2018 & 2022 final lcr study results san diego … & 2022 final lcr study results san...
TRANSCRIPT

2018 & 2022 Final LCR Study Results
San Diego-Imperial Valley
Frank Chen - Regional Transmission Engineer Lead
David Le - Senior Advisor Regional Transmission Engineer
Stakeholder Call
April 13, 2017

San Diego-Imperial Valley LCR Area
Slide 2
HUNTINGTON
BEACH [SCE]
CHINO [SCE]
AR
IZO
NA
IMPERIA
L VALLEY[SDG&E /
IID]
HIGHLINE[IID]
MIDWAY[IID]
COACHELLA[IID]
NORT
H
GILA[APS]Tijuana
MIGUEL
DEVER
S[SCE]
VALLEY[SCE]
SAN
ONOFRE[SCE &
SDG&E]ENCIN
A P.P.[SDG&E]
ESCONDIDO[SDG&E]
SAN
LUIS
REY
TALEGA
[SDG&E]
EL
CENTRO[IID]
MEXICO[CFE]
IMPERIAL
CO.
RIVERSIDE
CO.SAN DIEGO
CO.
SERRANO[SCE]
MIRA LOMA [SCE]
ORANGE
CO.
SOUTH
BAY P.P.
OLD
TOWN
MISSION
PENASQUITOS
SYCAMORE CANYON
KNOB[WALC]
PALO
VERDE[APS]
MIRAGE[SCE]
SANTIAGO
[SCE]
JOHANN
A
[SCE]
Cerro Prieto
Rosarito
La Rosita
Mexicali
To Ensenada
Rumorosa
N
* Not to Scale
Generation Plants
Nuclear Generating
Station
500 kV Transmission
Substation
230 kV Transmission
Substation
500 kV Transmission
Lines/Path
230 kV Transmission
Lines/Path
County Lines
State Lines
Proposed Lines
OTAY MESA
P.P.
SUNCREST
ECO

San Diego-Imperial Valley
Area Load and Resources (MW)
Slide 3
Year Managed
Peak Load
(MW)
Peak Shift
(MW)
Pump Loads Transmission
Losses (MW)
Total
(MW)
2018 4,661 138 0 125 4,924
2022 4,505 415 0 133 5,053
Year QF/Wind
(MW)
Nuclear Market
(MW)
Battery
Storage
(MW)
20-Minute
DR
(MW)
Maximum
Qualifying
Capacity
(MW)
2018 202 0 4,694 38 19 4,953
2022 217 0 4,336 38 19 4,610
Available Resources
Loads

Major Network Upgrades Modeled by 2018
1. 2nd Encina 230/138 bank #61
2. Encina power plant unit #1 retirement
3. Reconductor of Mission-Mesa Heights 69 kV (ISD: Sept. 2018)
4. Reconductor of Kearny-Mission 69 kV line (ISD: Nov. 2018)
5. TL600 Loop in to Mesa Height 69 kV substation(ISD: Dec. 2018)
5. TL6906 Mesa Rim rearrangement
6. Salt Creek 69 kV substation
7. Vine 69 kV substation
8. Bay Boulevard 230 kV substation
9. Sycamore - Penasquitos 230kV line (ISD: June 30, 2018)
10. Imperial Valley phase shifting transformers
11. Miguel synchronous condensers (2x225 Mvar)
12. San Luis Rey synchronous condensers (2x225 Mvar)
13. San Onofre synchronous condenser (1x225 Mvar)
14. New capacitors at Pendlenton and Basilone 69 kV substations
15. Storage projects at Escondido(3x10 MW) & El Cajon (7.5 MW)
Slide 4

Additional Network Upgrades by 2022
1. Ocean Ranch 69 kV substation
2. 2nd Poway to Pomerado line
3. TL632 Granite loop-in and TL6914 reconfiguration
4. Reconductor of Stuart Tap-Las Pulgas 69 kV line (TL690E)
5. Reconductor of Japanes Mesa–Basilone–Talega Tap 69 kV lines
6. 2nd San Marcos – Escondido 69kV line
7. Upgrade Bernardo - Rancho Carmel 69kV line
8. Second Poway-Pomerado 69 kV line
9. Artesian 230 kV expansion with 69kV upgrade
10. Second Miguel – Bay Boulevard 230 kV line
11. South Orange County Reliability Enhancement
12. By-passing 500 kV series capacitor banks on SWPL and SPL
13. Suncrest SVC project
14. Encina repower (500 MW)
Slide 5

Areas and sub-areas studied:
• El Cajon sub-area
• Mission sub-area
• Esco sub-area
• Pala sub-area
• Miramar sub-area
• Border sub-area
• San Diego sub-area
• San Diego-Imperial Valley area
Slide 6
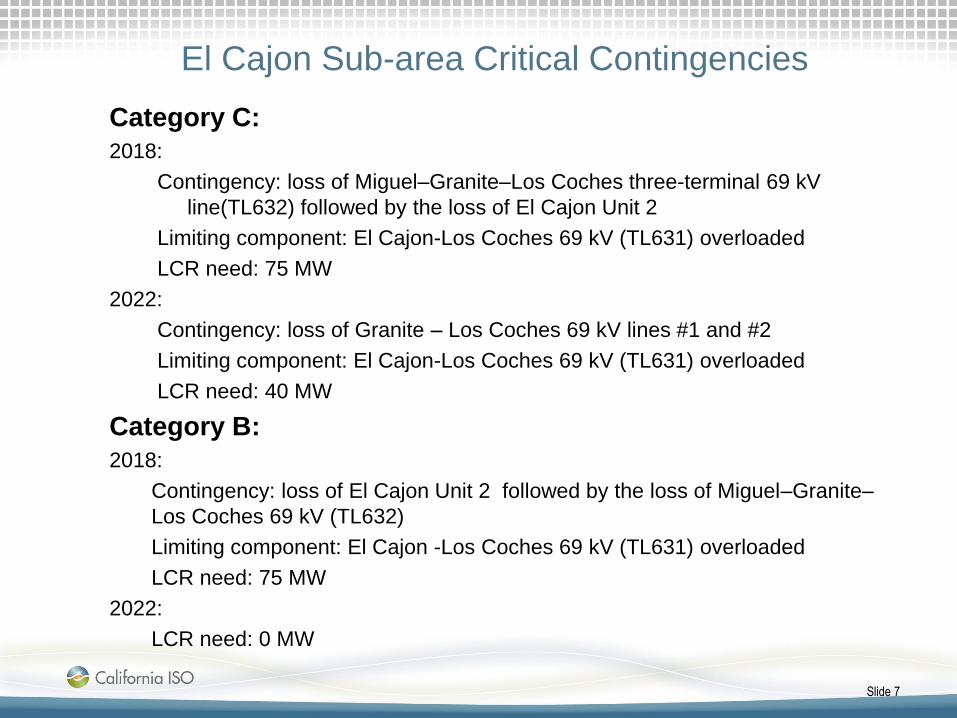
El Cajon Sub-area Critical Contingencies
Category C:
2018:
Contingency: loss of Miguel–Granite–Los Coches three-terminal 69 kV
line(TL632) followed by the loss of El Cajon Unit 2
Limiting component: El Cajon-Los Coches 69 kV (TL631) overloaded
LCR need: 75 MW
2022:
Contingency: loss of Granite – Los Coches 69 kV lines #1 and #2
Limiting component: El Cajon-Los Coches 69 kV (TL631) overloaded
LCR need: 40 MW
Category B:
2018:
Contingency: loss of El Cajon Unit 2 followed by the loss of Miguel–Granite–
Los Coches 69 kV (TL632)
Limiting component: El Cajon -Los Coches 69 kV (TL631) overloaded
LCR need: 75 MW
2022:
LCR need: 0 MW
Slide 7

Slide 8
Mission Sub-area Critical Contingency
Category C:2018:
Contingency: loss of the Mission-Kearny 69 kV (TL663) followed by the
loss of Mission-Mesa Heights 69kV (TL676) or vice versa.
Limiting component: Kearny-Clairmont Tap 69kV line (TL600) overloaded
LCR need: 28 MW
2022:
LCR need: 0 MW
Category B:No LCR requirement in 2018 and 2022.

Esco Sub-area Critical Contingency
Category C:2018:
Contingency: loss of one of the Sycamore-Pomerado 69 kV lines (TL6915
or TL6924), followed by the loss of Esco-Escondido 69kV (TL6908)
Limiting component: remaining Sycamore-Pomerado 69 kV line overloaded
LCR need: 8 MW
2022:
Contingency: loss of either one of the two Sycamore-Pomerado 69 kV
(TL6915 or TL6924) lines followed by the loss of Artesian 230/69kV
bank or vice versa
Limiting component: remaining Sycamore-Pomerado 69 kV line overloaded
LCR need: 30 MW
Category B:No requirements in 2018 and 2022.
Slide 9

Pala Sub-area Critical Contingency
Category C:Contingency: loss of Pendleton-San Luis Rey 69 kV line (TL6912)
followed by loss of Lilac-Pala 69kV (TL6908)
Limiting component: Melrose-Morro Hill Tap 69kV (TL694)
overloaded
2018 LCR need: 23 MW
2022 LCR need: 28 MW
Category B:No requirements in 2018 and 2022.
Slide 10

Border Sub-area Critical Contingency
Category C:Contingency: loss of Bay Boulevard-Otay 69 kV #1 (TL645) followed
by loss of Bay Boulevard-Otay 69 kV #2 (TL646)
Limiting component: Imperial Beach-Bay Boulevard 69 kV (TL647) overloaded
2018 LCR: 50 MW
2022 LCR: 62 MW
Category B:No requirements in 2018 and 2022.
Slide 11

Miramar Sub-area Critical Contingencies
Category C:No requirement is identified in 2018 and 2022 as the Sycamore Canyon -
Penasquitos 230kV Line project would eliminate the Sycamore-Scripps
69 kV (TL6916) overload for the loss of the Miguel-Bay Blvd. 230 kV line
followed by outage of Sycamore-Palomar 230 kV line or vice versa.
It is recommended to retain at least 38 MW of Miramar Energy Center
operational until the project is in service by June of 2018 or 2022.
Category B:No requirements in 2018 and 2022
Slide 12
Slide 13
Combined Overall LA Basin and San
Diego-Imperial Valley LCR Assessment
The presentation on the combined overall LA Basin and San
Diego-Imperial Valley LCR areas is common for both the LA
Basin and San Diego-Imperial Valley area presentations

Slide 14
Combined Overall LA Basin and San
Diego-Imperial Valley LCR Assessment• Due to electrical interdependency, the overall LA Basin and San Diego –
Imperial Valley areas are closely coordinated in the LCR study.
• The San Diego-Imperial Valley area is evaluated first due to its position as
the southernmost area and power flow typically flows in the north to south
direction with the outages that isolate SDG&E system from major import
tie lines connecting to the WECC system that lie east of San Diego. The
San Diego-Imperial Valley LCR need will be determined with the outages
that affect this area.
• Once the preliminary LCR need is determined for the San Diego – Imperial
Valley area, the LA Basin LCR need will be evaluated next based on the
contingencies that would most affect the LA Basin.
• The ISO then checks for the San Diego – Imperial Valley area again to
check for adequacy and to optimize its LCR need if possible.
• This effort goes back and forth several times until further LCR reduction
can no longer be achieved for these two areas.

Slide 15
Category B & C (2018)
The LCR need for the overall San Diego-Imperial Valley area is driven by the
limiting contingency of G-1 of (TDM), system readjustment, followed by an N-1
of the Imperial Valley-North Gila 500kV line
Limiting component: Imperial Valley – El Centro 230 kV line thermal loading
• San Diego-Imperial Valley LCR area LCR need: 4,032 MW
• Overall LA Basin 2018 LCR need: 7,300 MW
Overall San Diego-Imperial Valley Critical
Contingencies

Slide 16
Category B & C (2022)
The LCR need for the overall San Diego-Imperial Valley area is driven by the limiting
contingency of G-1 of (TDM), system readjustment, followed by an N-1 of the Imperial Valley-
North Gila 500kV line
Limiting component: Imperial Valley – El Centro 230 kV line thermal loading
• San Diego-Imperial Valley LCR area LCR need: 4,643 MW
• Overall LA Basin 2018 LCR need: 5,957 MW
− The LA Basin resources are not as effective as the Imperial Valley and San
Diego subarea resources in mitigating the “S” line loading concern
− The LCR need in the LA Basin is much lower when compared to the 2018 LCR
need due to implementation of major transmission projects (i.e., Mesa Loop-In
and Delaney – Colorado River 500 kV line) as well as having lower CEC
demand forecast
Overall San Diego-Imperial Valley Critical
Contingencies (cont’d)

Page 17
San Diego Sub-area Critical Contingencies
Category C (2018 & 2022)
The LCR need for the San Diego sub-area, independent of the San Diego-Imperial
Valley area is driven by an overlapping contingency of N-1 of ECO-Miguel 500 kV
line, system readjustment, followed by an N-1 of the Ocotillo-Suncrest 500kV line
Limiting component: Post-transient voltage instability
• San Diego sub-area 2018 LCR need: 2,157 MW
• San Diego sub-area 2022 LCR need: 2,502 MW
Observations:
• With the increase in managed peak loads with peak shift, the San Diego sub-
area LCR need also increases.
• However, this LCR need due to voltage instability is still lower than the LCR
need that is caused by the “S” line thermal loading constraint for the 2022 time
frame.

Page 18
Overall LA Basin Critical Contingency
Category C (2018)
Contingency: Lugo-Victorville 500 kV, system readjustment, followed by
Sylmar-Gould 230 kV line out
Limiting component: Sylmar – Eagle Rock 230 kV line
− Overall LA Basin 2018 LCR need: 7,525 MW
− San Diego-Imperial Valley LCR area 2018 LCR need: 4,032 MW

Page 19
Category C (2022)
Contingency: Mesa – Redondo 230 kV line, system readjustment, followed by Mesa -
Lighthipe 230 kV line out
Limiting component: Mesa – Laguna Bell #1 230 kV line
− Overall LA Basin 2022 LCR need: 6,022 MW
− Lower LCR need in the LA Basin is attributed to implementation of transmission
projects (i.e., Mesa Loop-In and Delaney – Colorado River 500 kV line projects)
as well as lower CEC demand forecast (with peak shift)
− San Diego-Imperial Valley LCR area 2022 LCR need: 4,643 MW
− This includes a 33 MW deficiency for the area
− Higher LCR need for the San Diego-Imperial Valley area is attributed to the
constraint on the “S” line between IID and SDG&E and higher peak demand
forecast (with peak shift)
Overall LA Basin Critical Contingency

Page 20
Peak shift has already occurred

Page 21
Overall LA Basin and San Diego-Imperial Valley
Critical Contingencies – Sensitivity Study (2018)
Sensitivity study with Imperial Valley connected solar generation
unavailable at 6 p.m. (based on EMS data for Sept. 26, 2016 high load day
in Southern California)
Contingency: G-1/N-1 of TDM/Imperial Valley – North Gila 500kV line or N-1/G-1
vice versa
Limiting component: Imperial Valley – El Centro 230 kV line
− LA Basin 2018 LCR need: 7604 MW
− The LCR need for this area is increased by about 79 MW
− San Diego subarea LCR need: 3145 MW
− The LCR need for this area increases by 750 MW as there are no
further resources in the Imperial Valley area that can be dispatched
− San Diego-Imperial Valley area LCR need: 4142 MW
− The LCR need is increased by about 110 MW as less effective
resources are dispatched

Page 22
Overall LA Basin and San Diego-Imperial Valley
Critical Contingencies – Sensitivity Study (2022)
Sensitivity study with Imperial Valley connected solar generation
unavailable at 6 p.m.
Contingency: G-1/N-1 of TDM/Imperial Valley – North Gila 500kV line or N-1/G-1
vice versa
Limiting component: Imperial Valley – El Centro 230 kV line
− LA Basin 2022 LCR need: 7404 MW
− The LCR need for this area is increased by about 1382 MW (compared
to 2022 LCR without the sensitivity) to support the San Diego-Imperial
Valley LCR need
− San Diego subarea LCR need: 2800 MW
− Maximum available resources for this subarea in the 2022 timeframe
− San Diego-Imperial Valley area LCR need: 4739 MW
− There is a deficiency of about 900 MW if replacement resources are to
be located in effective area (i.e., Imperial Valley substation or vicinity)

Page 23
Overall San Diego-Imperial Valley Sensitivity Study
without Sycamore-Penasquitos 230 kV Line (2018)Sensitivity study without the Sycamore-Penasquitos 230 kV line. This
project is expected to miss the June 1, 2018 in-service date.
• Contingency: N-1 of Miguel-Miguel Tap-Bay Blvd.-Otay Mesa 230 kV line, system
readjustment, followed by an N-1 of Mission-Old Town Tap-Silvergate-Old Town
230 kV line
• Limiting component: Mission-Old Town 230 kV line
• Loading concerns under various generation dispatch scenarios
Encina Generation (MW) Percent loadings on
the Mission-Old Town
230 kV Line
Firm Load
Curtailment (MW)
1 0 137% 0
2 859 117% 0
3 859 <100% 199*
Notes: *With generation curtailment of about 643 MW from Otay Mesa and Pio
Pico, the load curtailment impact would be reduced to about 145 MW

Page 24
Updated considerations related to the Aliso
Canyon gas storage constraint scenariosThe ISO also evaluated whether the Aliso Canyon gas storage constraint would affect the
LCR need in the LA Basin and San Diego areas
• Based on the recent CPUC Public Utilities Code Section 715 report, dated January 17,
2017
(http://www.cpuc.ca.gov/uploadedFiles/CPUC_Public_Website/Content/News_Room/New
s_and_Updates/AlisoGas1-9-715.pdf), the CPUC has recognized the effectiveness of
tighter non-core balancing rules.
– On page 15 of the report, the CPUC indicated that the 150 mmcf potential imbalance
has been offset by the enhanced balancing rules and thus directly reduces the
amount of the original curtailment identified in the four Summer Technical scenarios.
– Due to this balancing rules benefit, the LCR study evaluated here does not include
resource balancing as previously considered under the Aliso Canyon gas storage
constraint study scenario.
• However, as Southern California Gas Company has informed the CPUC in its February
17, 2017 Storage Safety Enhancement Plan, it is important to note that there are potential
deliverability impacts due to tubing flow only operation of the remaining gas storage fields
at Goleta, Playa Del Rey and Honor Rancho. More study is necessary to understand the
meaning and the extent of the tubing only production limitation.

Changes
Page 25
Since last year:
1) The 2018 adjusted managed peak demand, with peak shift, for the San
Diego-Imperial Valley area is increased by 84 MW compared to 2017.
2) The overall San Diego-Imperial Valley LCR need for 2018 is reduced by
603 MW compared to the corrected value (4635 MW) for 2017, based
consistent assumptions regarding Aliso Canyon gas storage constraint
scenario. Compared with the actual 2017 LCR Report that used
inconsistent assumptions the value in higher by 462 MW.
3) The 2022 adjusted managed peak demand, with peak shift, for the San
Diego-Imperial Valley area is increased by 139 MW compared to 2021.
4) The overall San Diego-Imperial Valley LCR need for 2022 is increased by
286 MW compared to the 2021, mostly due to demand forecast increase.

Slide 26
Changes
Your comments and questions are welcome
For written comments, please send to: [email protected]
Since last stakeholder meeting:
1) Updated NQC.
2) Updated 2018 LCR study results for all sub-areas and area needs.
3) Provide complete 2022 LCR study results.
4) Provide sensitivity study results for Imperial Valley solar generation
unavailable at 6:00 pm.
5) Provide sensitivity study regarding unavailability of the Sycamore –
Penasquitos 230 kV line.