2017 total quality impact report - strategic...
TRANSCRIPT

2017 Total Quality Impact™ Report Intro • 1
© 2017 Strategic VisionSource: New Vehicle Experience Study™
(v100901)
2017 Total Quality Impact™ Report:2017 Early Model Car and Truck Results
2017 Total Quality Award™ Winners Early-Year Data: July - December BuyersPublic Announcement: July 20, 2017
Contacts: Alexander Edwards, Christopher Chaney, or Karl Miller(858) 576-7141
INITIAL RELEASE

2017 Total Quality Impact™ Report Intro • 2
© 2017 Strategic VisionSource: New Vehicle Experience Study™
Total Quality Impact™ Calculation
What is Total Quality?Total Quality is a unique and complete measure of the total ownership experience. Strategic Vision knows that all of the aspects of the experience of buying, owning and driving a vehicle interact to form an overall impression are not equal. Other measures that fail to recognize this interaction can be misleading.
Strategic Vision also believes that it is essential to explicitly incorporate the emotional aspects of experience into the measurement of the vehicle buyer's experiences. Emotional deliverables which are associated with the attributes supercharge the influence of quality perceptions on the experience. These dimensions are typically not considered explicitly in the calculations of other companies.
Strategic Vision has captured in its unique Total Quality Impact score the complete, holistic measure of experience that encompasses positive and negative product experience, including reliability, driving excitement, and other aspects of dealership experiences − all energized by the emotional response associated with the experiences.
Factor scores that cover attribute and emotional dimensions (and other diagnostics) provide an explanation of why one vehicle does better than another.
Total Quality Impact (TQI) CalculationThe Total Quality Impact score is calculated using multi-variate statistical techniques that measure the correlations of all aspects of the vehicle ownership experience including product attributes and the dealership experience (independent variables) with multiple outcome measures (dependent variables) which include the following to assess the importance of each attribute:• The initial perception of quality• The overall perception of satisfaction• The willingness to be an advocate for the brand• Emotional attachment to the vehicle • Future purchase intention associated with the brand • Overall sales and service experiences
Additionally, Strategic Vision's Problem Impact Measure (PIM) is factored into TQI. PIM includes:• Number of problems reported by the consumer• Severity of problems reported• Severity of problems not adequately repaired by the dealership
The scores on over 100 product attributes and dealership experience are weighted by the dependent correlations and the emotional impact that each attribute has on the experience. The score is converted to a 1000 point scale. The scores typically range from 400 to 700. Generally, scores over 550 are good, those over 600 are terrific; although in some segments, a score in the high 500s is not very competitive. Scores in the 700s are exceptional. As some vehicle segments have higher quality products than others, the best way to measure the success or failure of a particular vehicle is to compare it to its direct competition.
Typically, differences of 3 points in this scoring system are significant depending on the nature of the sample, i.e., variation, differences in factor scores, etc.
The sample of those included in this Total Quality analysis of the New Vehicle Experience Study is 42,011 and includes those who purchased their 2017 vehicles during the July to December 2016 period. Buyers typically owned their vehicles three months when surveyed.
Limitation of the Study
Every study has intrinsic limitations based on the nature of the objectives and the design of the study. Every study has extrinsic limitations based on the political and financial realities associated with the study. The study of TQI is no exception. Because we have vehicles that sell at uneven rates throughout the year and because we must provide adequate objective data to clients in a timely fashion, there are a number of models that cannot be reported in this study. Because there are a number of financial obligations and the demand that we deliver data on a certain date to a syndicate, there are several models that do not receive all the attention they deserve. We will note throughout this study when limitations are being met head-on and how they impact our directions and interpretations.
Between October and March, a more comprehensive sample is available in the study, and the indices are augmented to reflect the increased number. Finally we will have a sample that approaches 250,000, reflecting the indicies associated with other metrics (Total Value IndexTM and Customer Love IndexTM) for each brand. The final examination of the strength of each brand can be determined from these metrics.

2017 Total Quality Impact™ Report Intro • 3
© 2017 Strategic VisionSource: New Vehicle Experience Study™
AwardClasses: BestinTotalQualityinClass TQI
1 SmallCar HondaCivicSedan 559
2 SmallHatchback HondaCivicHatchback 564
3 SmallAPTCar FordC-MAXHybrid 545
4 Mid-SizeCar NissanAltima 606
5 Mid-SizeHatchback SubaruOutback 596
6 Mid-SizeAPTCar ChevroletMalibuHybrid 601
7 Full-SizeCar DodgeCharger 684
8 Near-LuxuryCar ChevroletSS 678
9 Near-LuxuryAPTCar LincolnMKZHybrid* 629
10 LuxuryCar GenesisG90 761
11 SpecialtyCoupe MINICooper4-DoorHardtop 729
12 PremiumCoupe ChevroletCorvetteCoupe*** 755
13 StandardConvertible FordMustangCoupe* 704
14 PremiumConvertible/Roadster ChevroletCorvetteConvertible** 748
15 StandardPickup ChevroletColorado 551
16 Full-SizePickup ToyotaTundra 612
17 HeavyDutyPickup FordF-250/350 698
18 EntrySUV JeepWrangler 564
19 EntryCUV SubaruCrosstrek* 580
20 Mid-SizeSUV DodgeDurango 664
21 Mid-SizeCUV MazdaCX-9 632
22 Full-SizeUtility GMCYukonXL 714
23 Near-LuxuryUtility LandRoverRangeRoverEvoque5-Door 656
24 LuxurySUV LexusGX 679
25 LuxuryCUV PorscheMacan* 777
26 PremiumAPTUtility TeslaModelX 756
27 Minivan ChryslerPacifica 494
28 Bestmodel PorscheMacan 777
29 BrandUnder$26,000 Volkswagen 524
30 Mass-MarketBrand Subaru* 566
31 LuxuryBrand BMW* 650
32 Full-LineCorporation VolkswagenGroupofAmerica 575
*2016leader**2015-2016leader
2017 Total Quality Award™ Winners

2017 Total Quality Impact™ Report Problem Impact Definition • 4
Source: New Vehicle Experience Study Page 4 - Problem Impact Definition Strategic Vision
The Total Quality Experience™ (Problem Impact Report)
A new perspective on reliability
About two decades ago Strategic Vision introduced its unique Total Quality Index™ (TQI), now known as Total Quality Impact™. This complete, holistic measure of the vehicle ownership experience encompasses positive product experience, reliability, dealership experience and the emotional response. We took this broader view of quality because new owners told us that all partsof the buying, owning and driving experience interact to form an overall impression.
Previously the prevailing industry definition of quality counted defects stated in terms of Things-Gone-Wrong per 100 vehicles (TGW/100). This measure becomes increasingly irrelevant as the number of reported problems are generally converging for all companies below one problem per buyer on average.
Even when design flaws are assessed in addition to things gone wrong, the issues associated with quality are ambiguous. Is a flaw in a transmission equal to that in a mirror?
Strategic Vision has now come back to the issue of reported problems (a subset of Total Quality) to better address important elements missing in any reliability measure that just counts problems. Specifically, we propose that problems be analyzed in terms of their impact on the customer. This requires considering several other pieces of information obtained from the consumer.
We believe that it is first important to understand the severity of the problem. A loose screw on the glove compartment door isquite different than a failed transmission. Next, we want to consider the role of the dealer when a problem occurs. Has the dealer fixed the problem satisfactorily? An unresolved problem deemed serious by the owner can have a devastating impact on overallsatisfaction.
We also want to consider the expectations regarding reliability that the customer had going into the new vehicle ownership experience. For example, a new Lexus owner may have considerably different expectations regarding reliability than a new Hyundai owner.
To provide better insights into the reliability issues for both manufacturers and the car buying public, Strategic Vision hascontinued to provide a new metric (the Problem Impact Measure) that considers all of the factors just discussed. Remember, Total Quality is a complete or holistic measure that reflects the complete picture of how people make the quality judgement.
For more information about PIM, contact Strategic Vision at 858.576.7141.

2017 Total Quality Impact™ Report Corporations • 5
© 2017 Strategic VisionSource: New Vehicle Experience Study™
Combinedcarandtruckscores
2017TQI 2017PIM %ReportingScore Score Problems TGW
VolkswagenGroupofAmerica 575 10.72 23 37FordMotorCompany 560 10.95 22 36GeneralMotorsCorporation 551 11.73 23 37ToyotaMotorSales 544 6.93 17 26NissanMotorCorporation 538 10.57 21 35ChryslerGroup 529 14.36 27 46AmericanHondaMotor 523 9.53 21 33HyundaiMotorAmerica 514 9.08 20 31
INDUSTRY 548 10.38 22 35
Corporations

2017 Total Quality Impact™ Report Brands • 6
© 2017 Strategic VisionSource: New Vehicle Experience Study™
Combinedcarandtruckscores
2017TQI 2017PIM %ReportingScore Score Problems TGW
Volkswagen 524 10.25 22 34Hyundai 516 10.37 21 35Fiat 513 20.24 34 62Kia 510 7.75 18 27Mitsubishi 478 6.37 16 26Scion 449 9.51 22 32
INDUSTRY 548 10.38 22 35
smart* na
*Branddidnothavesufficientsampleordidnothaveafull-linemodellineup
Brands under $26,000

2017 Total Quality Impact™ Report Brands • 7
© 2017 Strategic VisionSource: New Vehicle Experience Study™
Combinedcarandtruckscores
2017TQI 2017PIM %ReportingScore Score Problems TGW
Subaru 566 7.90 19 27Ford 556 10.59 22 35Dodge 554 13.39 25 46Mazda 548 8.67 22 31Buick 542 9.30 20 31Chevrolet 538 10.81 22 35Nissan 531 10.70 21 35Toyota 530 6.70 16 25Honda 520 9.27 21 33Jeep 512 13.99 27 45Chrysler 489 16.67 29 50
INDUSTRY 548 10.38 22 35
MINI* naRam na
*Branddidnothavesufficientsampleordidnothaveafull-linemodellineup
Combinedcarandtruckscores
2017TQI 2017PIM %ReportingScore Score Problems TGW
BMW 650 8.15 20 28Cadillac 627 19.18 31 51Lincoln 625 15.90 28 50Lexus 622 7.67 18 31Audi 621 12.84 26 44LandRover 617 19.36 33 70Mercedes-Benz 616 12.20 24 43Infiniti 596 9.48 20 31Jaguar 587 38.37 48 107Volvo 582 24.38 36 77GMC 574 13.89 25 42Acura 555 12.80 23 37
INDUSTRY 548 10.38 22 35
Genesis* naPorsche* naTesla* na
*Branddidnothavesufficientsampleordidnothaveafull-linemodellineup
Mass-Market Brands
Luxury Brands
2017 Total Quality Impact™ Report Brands • 8
© 2017 Strategic VisionSource: New Vehicle Experience Study™
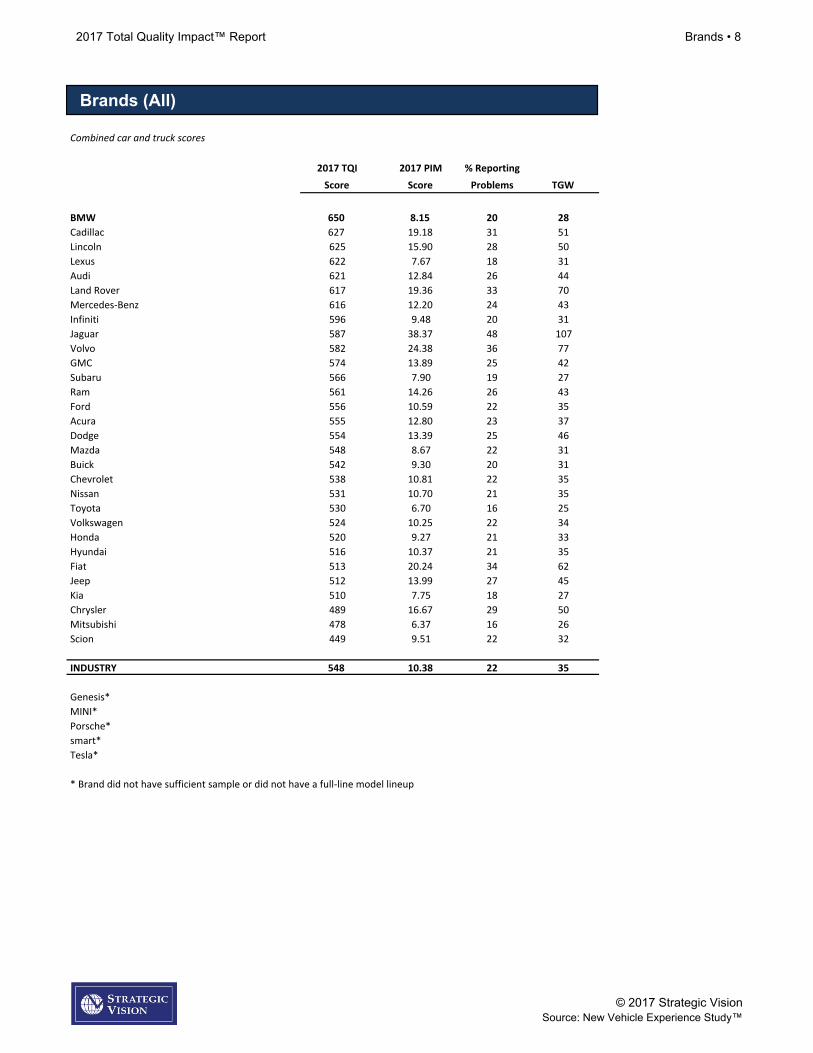
Combinedcarandtruckscores
2017TQI 2017PIM %ReportingScore Score Problems TGW
BMW 650 8.15 20 28Cadillac 627 19.18 31 51Lincoln 625 15.90 28 50Lexus 622 7.67 18 31Audi 621 12.84 26 44LandRover 617 19.36 33 70Mercedes-Benz 616 12.20 24 43Infiniti 596 9.48 20 31Jaguar 587 38.37 48 107Volvo 582 24.38 36 77GMC 574 13.89 25 42Subaru 566 7.90 19 27Ram 561 14.26 26 43Ford 556 10.59 22 35Acura 555 12.80 23 37Dodge 554 13.39 25 46Mazda 548 8.67 22 31Buick 542 9.30 20 31Chevrolet 538 10.81 22 35Nissan 531 10.70 21 35Toyota 530 6.70 16 25Volkswagen 524 10.25 22 34Honda 520 9.27 21 33Hyundai 516 10.37 21 35Fiat 513 20.24 34 62Jeep 512 13.99 27 45Kia 510 7.75 18 27Chrysler 489 16.67 29 50Mitsubishi 478 6.37 16 26Scion 449 9.51 22 32
INDUSTRY 548 10.38 22 35
Genesis*MINI*Porsche*smart*Tesla*
*Branddidnothavesufficientsampleordidnothaveafull-linemodellineup
Brands (All)

2017 Total Quality Impact™ Report Cars • 9
© 2017 Strategic VisionSource: New Vehicle Experience Study™
2017TQI 2017PIM %ReportingScore Score Problems TGW
SmartfortwoCoupe 519 37.70 44 86ChevroletSpark 486 8.38 18 26
SEGMENTAVERAGE 502 10.51 21 32
Fiat500Hatchback na
2017TQI 2017PIM %ReportingScore Score Problems TGW
HondaCivicSedan 559 13.04 26 42MitsubishiLancer 546 4.64 13 55Mazda3Sedan 535 11.12 27 42ToyotaCorolla 535 3.80 11 14ChevroletCruze 518 10.03 24 31NissanSentra 509 9.55 20 29HondaCivicCoupe 504 18.38 31 52HyundaiElantraSedan 470 10.85 23 36ToyotaYarisiA 468 9.57 23 26ChevroletSonic 449 16.39 28 43KiaRioSedan 448 9.29 20 31FordFiestaSedan 441 6.17 16 16KiaForteSedan 437 9.59 19 33DodgeDart 436 30.16 38 97FordFocusSedan 423 12.26 23 39HyundaiAccentSedan 419 6.09 14 34NissanVersaSedan 384 9.45 18 34
SEGMENTAVERAGE 497 10.03 22 34
KiaForteCoupe naScioniA na
*Convertiblesandstationwagonsexcluded
Small Car SegmentSmall Car SegmentSmall Car SegmentSmall Car
Small Car SegmentSmall Car SegmentSmall Car SegmentMicro Car (not an award category)

2017 Total Quality Impact™ Report Cars • 10
© 2017 Strategic VisionSource: New Vehicle Experience Study™
2017TQI 2017PIM %ReportingScore Score Problems TGW
HondaCivicHatchback 564 21.38 36 66HyundaiElantraHatchback 529 22.75 32 41Mazda3Hatchback 524 6.66 19 24VolkswagenGolf 521 18.89 31 46NissanVersaNote 510 6.80 16 24KiaSoul 488 3.33 9 16VolkswagenGolfSportwagen 484 9.55 23 30KiaForteHatchback 480 4.38 12 15HondaFit 467 7.21 18 24FordFiestaHatchback 452 9.68 21 26ToyotaCorollaiM 451 13.63 25 45HyundaiAccentHatchback 445 2.82 10 10FordFocusHatchback 428 11.19 22 38MitsubishiMirage 307 6.95 18 21
SEGMENTAVERAGE 470 7.57 18 27
Fiat500L naKiaRioHatchback naScioniM naToyotaYaris na
2017TQI 2017PIM %ReportingScore Score Problems TGW
FordC-MAXHybrid 545 16.97 31 48FordC-MAXEnergi 522 17.98 34 58Fiat500e 478 7.04 19 42Volkswagene-Golf 443 19.30 44 78ToyotaPriusc 419 4.54 14 20NissanLeaf 346 6.64 15 21
SEGMENTAVERAGE 446 11.39 24 41
ChevroletBolt naChevroletSparkEV naFordFocusElectric naHondaCR-Z naKiaSoulEV naMitsubishiI-MiEV naSmartfortwoEPassionCoupe na
Small Multi-Function SegmentSmall Multi-Function SegmentSmall Multi-Function SegmentSmall Hatchback
Small Multi-Function SegmentSmall Multi-Function SegmentSmall Multi-Function SegmentSmall Alternative Powertrain (APT) Car

2017 Total Quality Impact™ Report Cars • 11
© 2017 Strategic VisionSource: New Vehicle Experience Study™
2017TQI 2017PIM %ReportingScore Score Problems TGW
NissanAltima 606 8.85 19 29SubaruLegacy 584 7.73 19 27Mazda6 578 9.01 24 35HondaAccordSedan 572 5.98 15 21SubaruImprezaSedan 569 6.54 19 21FordFusion 559 9.77 21 37HyundaiSonata 548 8.95 19 29BuickRegal 545 9.46 21 30KiaOptima 543 16.08 28 37VolkswagenJettaSedan 502 9.76 21 31ChevroletMalibu 493 17.23 29 53VolkswagenPassat 490 8.73 20 31ToyotaCamry 480 4.31 12 20BuickVerano 478 7.21 15 26Chrysler200Sedan 395 19.30 30 62
SEGMENTAVERAGE 540 8.99 20 31
HondaAccordCoupe naSubaruWRX naSubaruWRXSTI na
*Convertiblesandstationwagonsexcluded
2017TQI 2017PIM %ReportingScore Score Problems TGW
SubaruOutback 596 7.49 19 26SubaruImprezaWagon 534 10.37 23 34VolkswagenGolfAlltrack 528 9.49 23 35
SEGMENTAVERAGE 585 7.95 19 28
Mid-Size Car SegmentMid-Size Car SegmentMid-Size Car SegmentMid-Size Car
Mid-Size Multi-Function Segment Mid-Size Hatchback

2017 Total Quality Impact™ Report Cars • 12
© 2017 Strategic VisionSource: New Vehicle Experience Study™
2017TQI 2017PIM %ReportingScore Score Problems TGW
ChevroletMalibuHybrid 601 16.86 26 48ToyotaPrius 554 8.96 21 33FordFusionPlug-in 553 26.73 39 75HondaAccordHybrid 547 11.18 24 40FordFusionHybrid 506 20.16 31 53ToyotaCamryHybrid 502 4.12 12 13HyundaiSonataHybrid 489 10.25 21 45ToyotaPriusv 477 4.06 12 13ChevroletVolt 468 16.71 29 48ToyotaPriusPrime 453 6.32 15 23
SEGMENTAVERAGE 523 11.03 23 37
HyundaiSonataPlug-inHybrid naKiaOptimaHybrid naVolkswagenJettaHybrid na
Mid-Size Multi-Function Segment Mid-Size Alternative Powertrain (APT) Car

2017 Total Quality Impact™ Report Cars • 13
© 2017 Strategic VisionSource: New Vehicle Experience Study™
2017TQI 2017PIM %ReportingScore Score Problems TGW
DodgeCharger 684 12.06 24 36NissanMaxima 678 17.56 30 42HyundaiAzera 670 10.16 21 31ChevroletImpala 618 11.47 23 32FordTaurus 604 12.96 24 31BuickLaCrosse(2017) 553 15.04 29 46
SEGMENTAVERAGE 641 12.78 25 36
Large Car Segment Large Car Segment Large Car Segment Full-Size Car
2017 Total Quality Impact™ Report Cars • 14
© 2017 Strategic VisionSource: New Vehicle Experience Study™
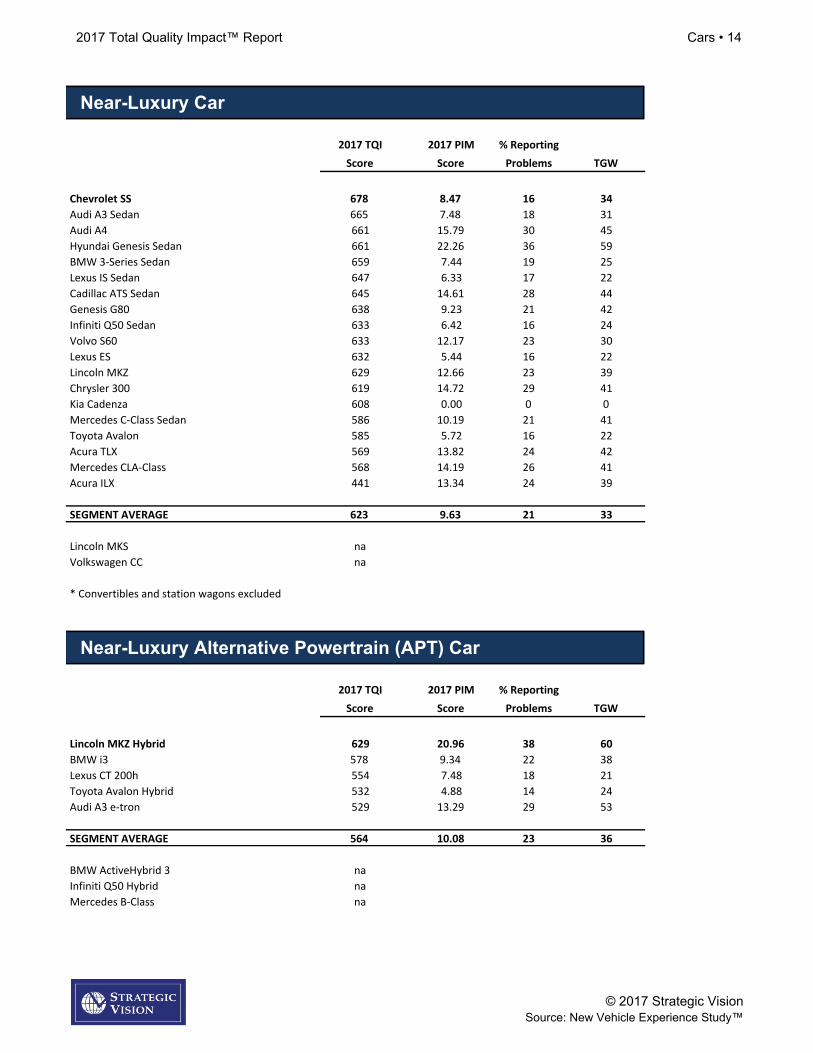
2017TQI 2017PIM %ReportingScore Score Problems TGW
ChevroletSS 678 8.47 16 34AudiA3Sedan 665 7.48 18 31AudiA4 661 15.79 30 45HyundaiGenesisSedan 661 22.26 36 59BMW3-SeriesSedan 659 7.44 19 25LexusISSedan 647 6.33 17 22CadillacATSSedan 645 14.61 28 44GenesisG80 638 9.23 21 42InfinitiQ50Sedan 633 6.42 16 24VolvoS60 633 12.17 23 30LexusES 632 5.44 16 22LincolnMKZ 629 12.66 23 39Chrysler300 619 14.72 29 41KiaCadenza 608 0.00 0 0MercedesC-ClassSedan 586 10.19 21 41ToyotaAvalon 585 5.72 16 22AcuraTLX 569 13.82 24 42MercedesCLA-Class 568 14.19 26 41AcuraILX 441 13.34 24 39
SEGMENTAVERAGE 623 9.63 21 33
LincolnMKS naVolkswagenCC na
*Convertiblesandstationwagonsexcluded
2017TQI 2017PIM %ReportingScore Score Problems TGW
LincolnMKZHybrid 629 20.96 38 60BMWi3 578 9.34 22 38LexusCT200h 554 7.48 18 21ToyotaAvalonHybrid 532 4.88 14 24AudiA3e-tron 529 13.29 29 53
SEGMENTAVERAGE 564 10.08 23 36
BMWActiveHybrid3 naInfinitiQ50Hybrid naMercedesB-Class na
Near-Luxury Car Segment Near-Luxury Car Segment Near-Luxury Car Segment Near-Luxury Car
Near-Luxury Car Segment Near-Luxury Car Segment Near-Luxury Car Segment Near-Luxury Alternative Powertrain (APT) Car

2017 Total Quality Impact™ Report Cars • 15
© 2017 Strategic VisionSource: New Vehicle Experience Study™
2017TQI 2017PIM %ReportingScore Score Problems TGW
GenesisG90 761 5.78 16 24BMW7-SeriesSedan 721 11.55 22 41LincolnContinental 720 16.47 27 42AudiA7 668 21.57 41 74LexusLS 663 2.01 7 9MercedesS-ClassSedan 641 13.28 24 49JaguarXF 639 37.76 53 89CadillacCTSSedan 627 21.16 30 50CadillacCT6Sedan 620 27.76 36 69BMW5-SeriesSedan 612 6.07 16 21LexusGS 581 10.54 21 53AudiA6 571 11.67 24 50MercedesE-ClassSedan(2017) 568 24.15 35 67CadillacXTS 550 21.60 35 55
SEGMENTAVERAGE 616 15.57 27 51
AcuraRLX naAudiA8 naHyundaiEquus naInfinitiQ70Sedan naInfinitiQ70L naJaguarXJ naKiaK900 naMercedesMaybach naVolvoS80 naVolvoS90 na
*Convertiblesandstationwagonsexcluded
2017TQI 2017PIM %ReportingScore Score Problems TGW
VolvoV60 599 9.90 20 41VolvoXC70 538 14.32 28 38
SEGMENTAVERAGE 596 7.55 19 26
Audiallroad naBMW3-SeriesGranTurismo naBMW3-SeriesSportsWagon naBMW5-SeriesGranTurismo naMercedesE-ClassWagon naPorschePanamera na
Luxury Car Segment Luxury Car Segment Luxury Car Segment Luxury Car
Luxury Car Segment Luxury Car Segment Luxury Car Segment Luxury Hatchback (not an award category)

2017 Total Quality Impact™ Report Cars • 16
© 2017 Strategic VisionSource: New Vehicle Experience Study™
2017TQI 2017PIM %ReportingScore Score Problems TGW
TeslaModelS 771 25 45 71
SEGMENTAVERAGE 754 24.31 44 69
AcuraRLXHybrid naBMWi8 naInfinitiQ70Hybrid naMercedesS-ClassSedanHybrid naPorschePanameraHybrid naToyotaMirai na
Luxury Car Segment Luxury Car Segment Luxury Car Segment Premium Alternative Powertrain (APT) Car (not an award category)

2017 Total Quality Impact™ Report Cars • 17
© 2017 Strategic VisionSource: New Vehicle Experience Study™
CoupesOnly 2017TQI 2017PIM %ReportingScore Score Problems TGW
MINICooper4-DoorHardtop 729 8.33 21 27DodgeChallenger 697 10.31 22 39MINICooperClubman 689 12.41 26 35FordMustangCoupe 686 11.46 23 35MINICooperCountryman 671 5.31 14 19ChevroletCamaroCoupe 668 12.70 24 50VolkswagenGolfGTI 659 10.19 24 41MINICooper2DrHardtop 657 6.39 16 23VolkswagenGolfR 596 20.82 37 61HyundaiVeloster 558 15.78 27 77VolkswagenBeetle 547 9.42 23 33
SEGMENTAVERAGE 658 11.07 23 41
Fiat500AbarthHatchback naMINICooperHardtop naMINICooperPaceman naScionFR-S naSciontC naSubaruBRZ naToyota86 na
*Convertiblesexcluded
Specialty Coupe SegmentSpecialty Coupe SegmentSpecialty Coupe SegmentSpecialty Coupe

2017 Total Quality Impact™ Report Cars • 18
© 2017 Strategic VisionSource: New Vehicle Experience Study™
CoupesOnly 2017TQI 2017PIM %ReportingScore Score Problems TGW
ChevroletCorvetteCoupe 755 7.60 18 26LexusRC 718 3.40 11 15BMW4-SeriesGranCoupe 706 6.96 19 25BMW2-SeriesCoupe 690 4.31 13 15BMW4-SeriesCoupe 670 5.83 15 24AudiA5Coupe 670 12.08 23 35MercedesC-ClassCoupe 657 9.34 22 34JaguarF-TypeCoupe 611 15.07 30 50JaguarXE 605 22.04 32 72
SEGMENTAVERAGE 693 6.79 17 24
AcuraNSX naAudiR8Coupe naAudiTT naBMW6-SeriesCoupe naBMW6-SeriesGranCoupe naCadillacATSCoupe naCadillacELR naDodgeViper naHyundaiGenesisCoupe naInfinitiQ60Coupe naMercedesAMGGTS naMercedesCLS-Class naMercedesE-ClassCoupe naMercedesS-ClassCoupe naNissanGT-R naNissanZCoupe naPorsche911Coupe naPorscheCayman na
*Convertiblesexcluded
Premium Coupe SegmentPremium Coupe SegmentPremium Coupe SegmentPremium Coupe

2017 Total Quality Impact™ Report Cars • 19
© 2017 Strategic VisionSource: New Vehicle Experience Study™
ConvertiblesOnly 2017TQI 2017PIM %ReportingScore Score Problems TGW
FordMustangConvertible 704 7.79 18 23MINICooperConvertible 697 6.23 16 20ChevroletCamaroConvertible 683 11.33 22 33VolkswagenBeetleConvertible 622 3.75 11 10BuickCascada 597 12.27 24 38MazdaMiataMX-5 594 5.11 14 19Fiat124Spider 475 11.73 24 39
SEGMENTAVERAGE 636 8.10 18 26
Fiat500AbarthConvertible naFiat500Convertible naSmartfortwoCabriolet na
ConvertiblesOnly 2017TQI 2017PIM %ReportingScore Score Problems TGW
ChevroletCorvetteConvertible 748 8.41 19 26MercedesSL-Class 711 8.52 20 42MercedesS-ClassCabriolet 700 17.63 28 48BMW4-SeriesConvertible 673 8.05 18 23BMW2-SeriesConvertible 669 5.61 16 21AudiA5Cabriolet 580 21.76 27 45
SEGMENTAVERAGE 692 9.03 19 32
AudiA3Cabriolet naAudiTTRoadster naBMW6-SeriesConvertible naBMWZ4Roadster naJaguarF-TypeConvertible naMercedesC-ClassCabriolet naMercedesE-ClassCabriolet naMercedesSLC-Class naMercedesSLK-Class naNissanZConvertible naPorsche911Cabriolet naPorscheBoxster na
Specialty Coupe SegmentConvertible Segment
Specialty Coupe SegmentPremium Convertible / Roadster Segment
Specialty Coupe SegmentStandard Convertible
Specialty Coupe SegmentPremium Convertible/Roadster

2017 Total Quality Impact™ Report Trucks • 20
© 2017 Strategic VisionSource: New Vehicle Experience Study™
2017TQI 2017PIM %ReportingScore Score Problems TGW
ChevroletColorado 551 12.49 25 46HondaRidgeline 531 12.20 24 44GMCCanyon 522 18.68 32 51ToyotaTacoma 499 14.70 26 44NissanFrontier 412 8.64 20 36
SEGMENTAVERAGE 508 13.74 26 44
2017TQI 2017PIM %ReportingScore Score Problems TGW
ToyotaTundra 612 5.85 15 24Ram1500 600 13.83 25 39GMCSierra1500 597 19.18 30 50ChevroletSilverado1500 572 11.55 22 32FordF-150 567 13.08 23 38
SEGMENTAVERAGE 584 12.88 24 37
NissanTitan na
2017TQI 2017PIM %ReportingScore Score Problems TGW
FordF-250/350(2017) 698 7.75 18 28GMCSierra2500/3500 564 15.36 26 47ChevroletSilverado2500/3500 541 17.92 32 42NissanTitanXD 523 46.79 49 137Ram2500/3500 499 14.17 26 47
SEGMENTAVERAGE 547 13.02 25 43
Standard Pickup Segment
Full-Size Pickup Segment
Heavy-Duty Pickup Segment
Standard Pickup Segment
Full-Size Pickup Segment
Heavy-Duty Pickup Segment
Standard Pickup Segment
Full-Size Pickup Segment
Heavy-Duty Pickup Segment
Standard Pickup
Full-Size Pickup
Heavy-Duty Pickup

2017 Total Quality Impact™ Report Trucks • 21
© 2017 Strategic VisionSource: New Vehicle Experience Study™
2017TQI 2017PIM %ReportingScore Score Problems TGW
JeepWrangler 564 14.99 28 32JeepWranglerUnlimited 521 15.39 28 51JeepCherokee 498 10.07 20 33JeepRenegade 479 14.20 28 58JeepPatriot 432 17.58 34 52
SEGMENTAVERAGE 495 13.74 26 45
2017TQI 2017PIM %ReportingScore Score Problems TGW
SubaruCrosstrek 580 4.01 11 14ToyotaRAV4 570 3.03 9 11FordEscape 561 7.06 17 23HyundaiTucson 535 11.75 23 33VolkswagenTiguan 531 12.12 23 36MazdaCX-5 530 7.43 20 25MazdaCX-3 526 8.87 21 33NissanJuke 526 5.63 14 36KiaSportage 524 7.60 19 30NissanRogue 515 8.82 19 29HondaHR-V 514 9.40 21 32BuickEncore 510 7.27 18 25SubaruForester 507 10.77 23 35Fiat500X 495 38.76 49 91MitsubishiOutlanderSport 494 4.36 14 13HondaCR-V 451 6.95 17 27JeepCompass 441 11.38 25 43ChevroletTrax 419 11.07 24 33
SEGMENTAVERAGE 517 7.57 18 26
Entry Utility SegmentEntry Utility SegmentEntry Utility SegmentEntry SUV
Entry Utility SegmentEntry Utility SegmentEntry Utility SegmentEntry CUV

2017 Total Quality Impact™ Report Trucks • 22
© 2017 Strategic VisionSource: New Vehicle Experience Study™
2017TQI 2017PIM %ReportingScore Score Problems TGW
DodgeDurango 664 8.55 20 28FordExplorer 585 9.34 19 30JeepGrandCherokee 580 15.56 29 47NissanPathfinder(2017) 542 13.11 26 42Toyota4Runner 531 3.84 11 15HondaPilot 527 13.73 26 43
SEGMENTAVERAGE 566 10.34 22 34
2017TQI 2017PIM %ReportingScore Score Problems TGW
MazdaCX-9 632 13.14 28 39FordFlex 607 12.70 25 43BuickEnvision 590 15.85 28 41NissanMurano 586 16.32 28 48KiaSorento 579 6.34 16 22HyundaiSantaFe 560 11.38 23 38MitsubishiOutlander 559 9.52 20 29FordEdge 548 12.90 24 39HyundaiSantaFeSport 534 7.35 17 21ToyotaHighlander 527 9.39 20 34ChevroletTraverse 525 7.16 18 27GMCTerrain 524 6.00 15 19GMCAcadia(2017) 506 13.15 26 50ChevroletEquinox 481 2.24 7 9DodgeJourney 384 15.23 29 56
SEGMENTAVERAGE 523 8.14 18 30
Mid-Size Traditional Utility Segment
Mid-Size Crossover Utility Segment
Mid-Size Traditional Utility Segment
Mid-Size Crossover Utility Segment
Mid-Size Traditional Utility Segment
Mid-Size Crossover Utility Segment
Mid-Size CUV
Mid-Size SUV

2017 Total Quality Impact™ Report Trucks • 23
© 2017 Strategic VisionSource: New Vehicle Experience Study™
2017TQI 2017PIM %ReportingScore Score Problems TGW
GMCYukonXL 714 10.93 23 28GMCYukon 679 10.25 24 40NissanArmada 669 11.18 23 26ChevroletSuburban 614 9.49 20 37ChevroletTahoe 595 16.13 29 58FordExpedition 584 15.41 26 59ToyotaSequoia 561 7.93 21 32
SEGMENTAVERAGE 627 12.57 25 46
2017TQI 2017PIM %ReportingScore Score Problems TGW
ToyotaHighlanderHybrid 556 7.66 20 30ToyotaRAV4Hybrid 523 8.26 18 30
SEGMENTAVERAGE 527 8.62 19 32
NissanMuranoHybrid naSubaruCrosstrekHybrid na
Large Utility SegmentLarge Utility SegmentLarge Utility SegmentFull-Size Utility
Large Utility SegmentLarge Utility SegmentLarge Utility SegmentAlternative Powertrain (APT) Utility (not an award category)

2017 Total Quality Impact™ Report Trucks • 24
© 2017 Strategic VisionSource: New Vehicle Experience Study™
2017TQI 2017PIM %ReportingScore Score Problems TGW
LandRoverRangeRoverEvoque5-Door 656 16.55 33 54BMWX4 652 20.91 36 45MercedesGLC-Class 647 16.21 29 46BMWX1 646 9.02 23 31LincolnMKX 631 19.10 32 63CadillacSRX 630 9.73 22 42CadillacXT5 620 19.71 33 53AudiQ5 613 10.39 22 39BMWX3 612 8.17 19 27LexusNX 606 8.72 20 41LincolnMKC 602 16.48 29 46BuickEnclave 595 8.36 19 31LexusRX 590 9.78 19 32AudiQ3 578 8.92 21 32MercedesGLA-Class 566 5.29 14 22LandRoverDiscoverySport 565 20.24 36 72AcuraRDX 562 9.60 19 25AcuraMDX 552 15.82 27 44VolvoXC60 552 8.46 19 32InfinitiQX50 534 5.01 12 18InfinitiQX60 532 18.06 28 50
SEGMENTAVERAGE 599 12.08 24 39
InfinitiQX30 naInfinitiQX70 naLandRoverRangeRoverEvoqueConvertible naLandRoverRangeRoverEvoqueCoupe naVolkswagenTouareg na
Near-Luxury Utility SegmentNear-Luxury Utility SegmentNear-Luxury Utility SegmentNear-Luxury Utility

2017 Total Quality Impact™ Report Trucks • 25
© 2017 Strategic VisionSource: New Vehicle Experience Study™
2017TQI 2017PIM %ReportingScore Score Problems TGW
LexusGX 679 6.98 19 31InfinitiQX80 675 7.34 16 25LandRoverRangeRoverSport 634 19.60 35 70MercedesGLE-Class 631 9.55 21 40LandRoverRangeRover 619 22.14 33 83LincolnNavigator 616 17.34 31 68LandRoverLR4 612 14.18 29 50CadillacEscalade 612 13.72 26 36VolvoXC90 578 51.50 57 129
SEGMENTAVERAGE 639 15.38 28 53
CadillacEscaladeESV naLexusLX naLincolnNavigatorL naMercedesG-Class naToyotaLandCruiser na
2017TQI 2017PIM %ReportingScore Score Problems TGW
PorscheMacan 777 4.57 14 23MercedesGLE-ClassCoupe 693 6.24 15 34BMWX6 646 8.57 20 31BMWX5 642 10.36 22 37MercedesGLS-Class 629 7.81 18 33AudiQ7 591 17.02 30 58JaguarF-PACE 562 49.92 55 135
SEGMENTAVERAGE 649 13.80 26 55
LincolnMKT naMercedesGL-Class naPorscheCayenne na
Luxury Utility SegmentLuxury Utility SegmentLuxury Utility SegmentLuxury SUV
Luxury CUV

2017 Total Quality Impact™ Report Trucks • 26
© 2017 Strategic VisionSource: New Vehicle Experience Study™
2017TQI 2017PIM %ReportingScore Score Problems TGW
TeslaModelX 756 39.09 58 157LexusRXHybrid 673 13.03 26 49LexusNXHybrid 554 4.58 11 38VolvoXC90Hybrid 502 58.13 52 229
SEGMENTAVERAGE 693 29.37 46 117
InfinitiQX60Hybrid naMercedesGLE-ClassHybrid naPorscheCayenneHybrid na
Minivan Segment Minivan Segment Minivan Segment Premium Alternative Powertrain (APT) Utility