2017 edition annual health, labour and welfare … of health, labour and welfare 2017 edition annual...
TRANSCRIPT
Ministry of Health,Labour and Welfare
2017 Edition
Annual Health,Labour and Welfare Report
― Social Security and Economic Growth ―
【 Summary 】

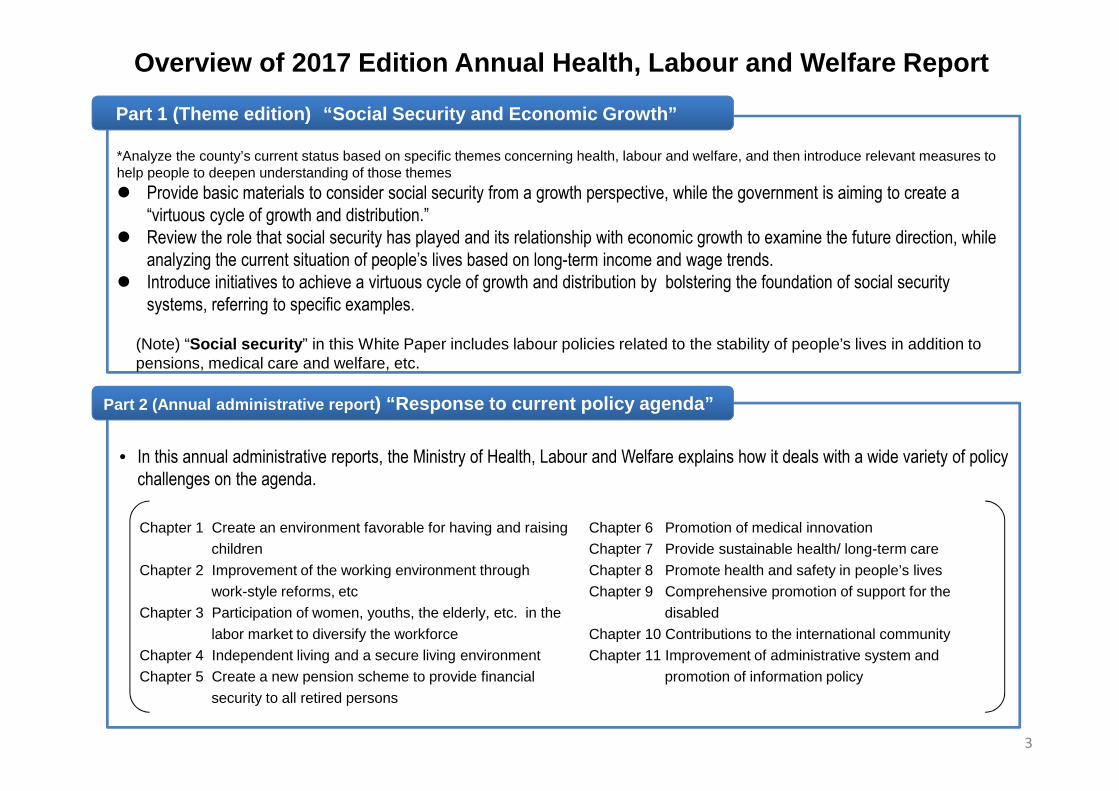
Overview of 2017 Edition Annual Health, Labour and Welfare Report
Part 1 (Theme edition) “Social Security and Economic Growth”
Part 2 (Annual administrative report) “Response to current policy agenda”
• In this annual administrative reports, the Ministry of Health, Labour and Welfare explains how it deals with a wide variety of policychallenges on the agenda.
*Analyze the county’s current status based on specific themes concerning health, labour and welfare, and then introduce relevant measures tohelp people to deepen understanding of those themes
Provide basic materials to consider social security from a growth perspective, while the government is aiming to create a“virtuous cycle of growth and distribution.”
Review the role that social security has played and its relationship with economic growth to examine the future direction, whileanalyzing the current situation of people’s lives based on long-term income and wage trends.
Introduce initiatives to achieve a virtuous cycle of growth and distribution by bolstering the foundation of social securitysystems, referring to specific examples.
(Note) “Social security” in this White Paper includes labour policies related to the stability of people’s lives in addition topensions, medical care and welfare, etc.
Chapter 1 Create an environment favorable for having and raising
children
Chapter 2 Improvement of the working environment through
work-style reforms, etc
Chapter 3 Participation of women, youths, the elderly, etc. in the
labor market to diversify the workforce
Chapter 4 Independent living and a secure living environment
Chapter 5 Create a new pension scheme to provide financial
security to all retired persons
Chapter 6 Promotion of medical innovation
Chapter 7 Provide sustainable health/ long-term care
Chapter 8 Promote health and safety in people’s lives
Chapter 9 Comprehensive promotion of support for the
disabled
Chapter 10 Contributions to the international community
Chapter 11 Improvement of administrative system and
promotion of information policy
3
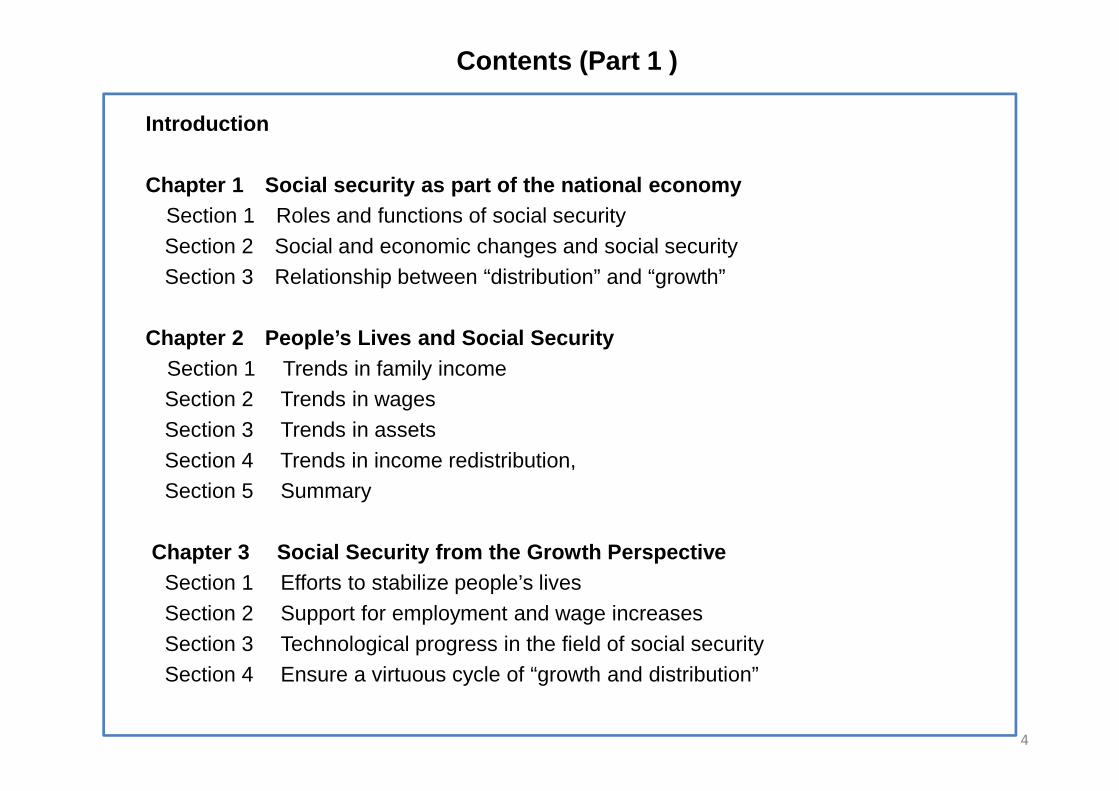
Contents (Part 1 )
Introduction
Chapter 1 Social security as part of the national economy
Section 1 Roles and functions of social security
Section 2 Social and economic changes and social security
Section 3 Relationship between “distribution” and “growth”
Chapter 2 People’s Lives and Social Security
Section 1 Trends in family income
Section 2 Trends in wages
Section 3 Trends in assets
Section 4 Trends in income redistribution,
Section 5 Summary
Chapter 3 Social Security from the Growth Perspective
Section 1 Efforts to stabilize people’s lives
Section 2 Support for employment and wage increases
Section 3 Technological progress in the field of social security
Section 4 Ensure a virtuous cycle of “growth and distribution”
4

7.4
6.6
5.8
4.8
3.9
3.3
2.8
2.32 1.9 1.9
0.91 0.93 1.01 1.05 1.00 0.96 0.93 0.940.94 1.06 1.12
0.95 0.91
0
1
2
3
4
5
6
7
8
1980 1985 1990 1995 2000 2005 2010 2015 2020 2025 2030
【International Comparison of Social Expenditure by Policy Area(FY2013)】
Chapter 1 Social security as part of the national economy
Section 1 Roles and functions of social security, Section 2 Social and economic changes and social security
• The proportion of the national budget devoted to social security spending has soared since World War II due to the country’saging population.
• Compared with social security spending in major Western countries, social security expenditures in Japan go more toward theelderly and less toward families and working age
• The number of working-age people per one elderly person has drastically declined, but policies to boost labor force participationwill increase the number of workers per unemployed person.
Source: “The Financial Statistics of Social Security in Japan for FY2015” National Institute of Population and Social Security Research.(Note) Based on two categories of “Medical care” and “Pension/Welfare and others” up to FY1963 and three categories of “Medical care,”“Pension” and “Welfare and others” in and after FY1964
Source: National Institute of Population and Social Security Research “The Financial Statistics of Social Security in Japan for FY2015”
(FY)
5
0
5
10
15
20
25
30
35
0
20
40
60
80
100
120
140
1950 1955 1960 1965 1970 1975 1980 1985 1990 1995 2000 2005 2010 2015
Pension
Welfare and others
(
Medical care
【Trends in Social Security Benefits Expenditure】 (%)(Trillion yen)
10.40% 10.71%
6.27% 7.25% 8.20% 9.56%12.61%
1.25% 1.33%
0.69% 0.06%
1.91% 0.40%
1.76%0.99% 0.98%
1.58% 2.07%
3.39% 4.68%
1.86%7.72% 7.64%
8.16% 7.13%
7.93% 6.55%
8.61%1.31% 1.23%
0.69%
3.79%
2.23% 3.64%
2.92%
0.14% 0.17%
0.12%
0.21%
0.66%1.35%
0.86%
0.17% 0.21%
0.43%
0.44%
1.03% 0.46%
1.63%
1.43%
0.46%
0.83%
0%
5%
10%
15%
20%
25%
30%
35%
日本
(2015年度)
日本 アメリカ 英国 ドイツ スウェーデン フランス
【Trends in and Projection of Ratio of Working Population to theElderly and Ratio of the Employed to Non-employed Persons】
Sources: Statistics Bureau, Ministry of Internal Affairs and Communications “Census,” National Institute of Population and Social SecurityResearch “Japan’s population estimates (2012 and 2017 estimates) medium-fertility/medium-mortality estimates” (as of October 1 eachyear) and Japan Institute for Labour Policy and Training “Estimation of labour supply and demand in 2015”
Number of working-age people supportingone elderly person
Number of employed to one non-employed
Actual Projection← →
(Persons)
(Year)
Social security benefits expenditure as a proportion of national income (right scale)
Japan Japan USA UK Germany Sweden France(FY2015)
Elderly Bereavedfamily
Disability, businessDisaster, injury
Insurance Other policyareas
HousingUnemployment
Proactive labourMarket policy
Family
Economic revitalization/labour participation progress scenario
Zero growth/status quo of labour participation scenario
As
%ofG
DP
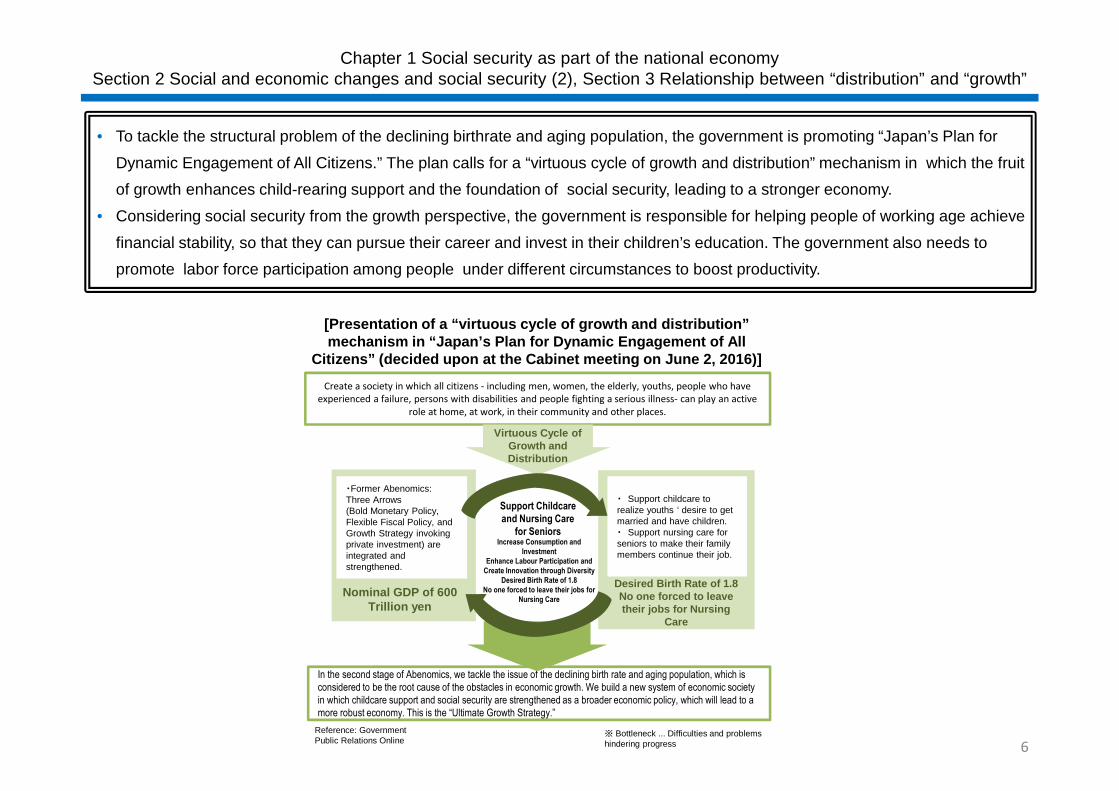
Chapter 1 Social security as part of the national economySection 2 Social and economic changes and social security (2), Section 3 Relationship between “distribution” and “growth”
• To tackle the structural problem of the declining birthrate and aging population, the government is promoting “Japan’s Plan for
Dynamic Engagement of All Citizens.” The plan calls for a “virtuous cycle of growth and distribution” mechanism in which the fruit
of growth enhances child-rearing support and the foundation of social security, leading to a stronger economy.
• Considering social security from the growth perspective, the government is responsible for helping people of working age achieve
financial stability, so that they can pursue their career and invest in their children’s education. The government also needs to
promote labor force participation among people under different circumstances to boost productivity.
6
[Presentation of a “virtuous cycle of growth and distribution”mechanism in “Japan’s Plan for Dynamic Engagement of All
Citizens” (decided upon at the Cabinet meeting on June 2, 2016)]
Create a society in which all citizens - including men, women, the elderly, youths, people who haveexperienced a failure, persons with disabilities and people fighting a serious illness- can play an active
role at home, at work, in their community and other places.
Virtuous Cycle ofGrowth andDistribution
・Former Abenomics:Three Arrows(Bold Monetary Policy,Flexible Fiscal Policy, andGrowth Strategy invokingprivate investment) areintegrated andstrengthened.
Nominal GDP of 600Trillion yen
・ Support childcare torealize youths ‘ desire to getmarried and have children.・ Support nursing care forseniors to make their familymembers continue their job.
Desired Birth Rate of 1.8No one forced to leavetheir jobs for Nursing
Care
In the second stage of Abenomics, we tackle the issue of the declining birth rate and aging population, which isconsidered to be the root cause of the obstacles in economic growth. We build a new system of economic societyin which childcare support and social security are strengthened as a broader economic policy, which will lead to amore robust economy. This is the “Ultimate Growth Strategy.”
※ Bottleneck ... Difficulties and problemshindering progress
Support Childcareand Nursing Care
for SeniorsIncrease Consumption and
InvestmentEnhance Labour Participation and
Create Innovation through DiversityDesired Birth Rate of 1.8
No one forced to leave their jobs forNursing Care
Reference: GovernmentPublic Relations Online
19942014
0
5
10
15
20
25
30
Less than 100 100~200 200~300 300~400 400~500 500~600 600~700 700~800 800~900 900~1,000 1,000 andover
(%)
150
200
250
300
350
400
450
1985 1988 1991 1994 1997 2000 2003 2006 2009 2012 2014
(10,000yen)
Chapter 2 People’s lives and Social Security
Section 1 Trends in family income (1)
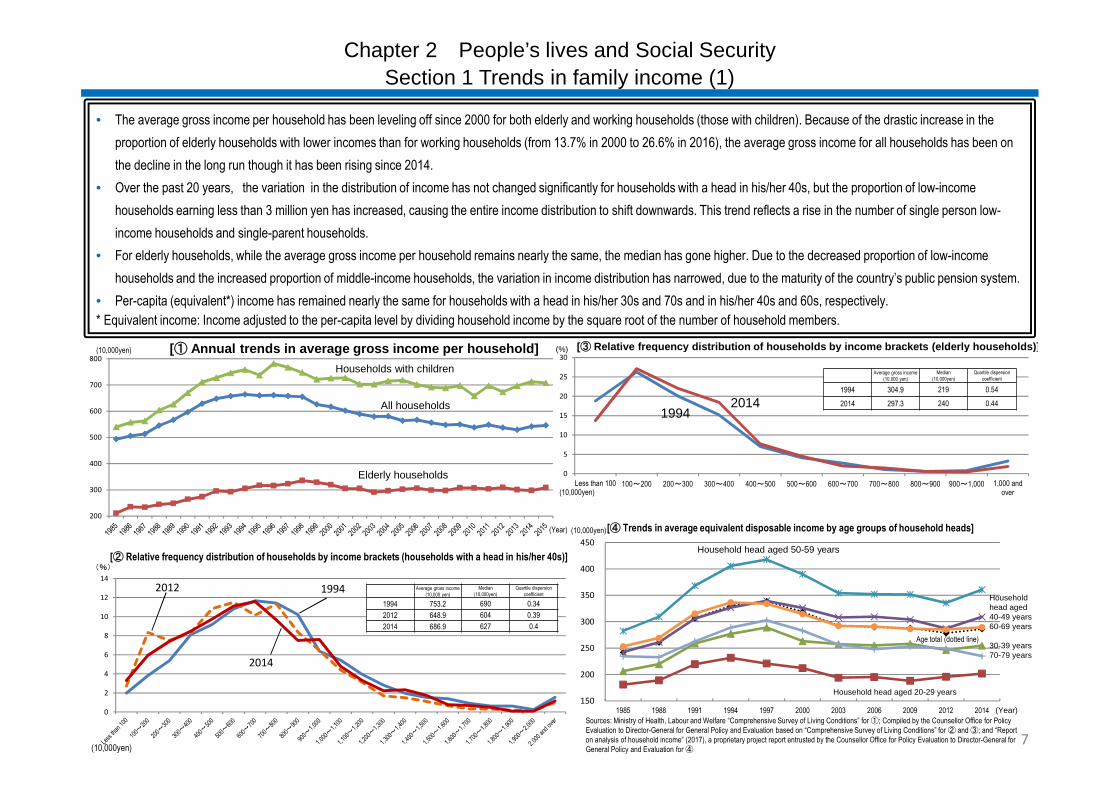
• The average gross income per household has been leveling off since 2000 for both elderly and working households (those with children). Because of the drastic increase in the
proportion of elderly households with lower incomes than for working households (from 13.7% in 2000 to 26.6% in 2016), the average gross income for all households has been on
the decline in the long run though it has been rising since 2014.
• Over the past 20 years, the variation in the distribution of income has not changed significantly for households with a head in his/her 40s, but the proportion of low-income
households earning less than 3 million yen has increased, causing the entire income distribution to shift downwards. This trend reflects a rise in the number of single person low-
income households and single-parent households.
• For elderly households, while the average gross income per household remains nearly the same, the median has gone higher. Due to the decreased proportion of low-income
households and the increased proportion of middle-income households, the variation in income distribution has narrowed, due to the maturity of the country’s public pension system.
• Per-capita (equivalent*) income has remained nearly the same for households with a head in his/her 30s and 70s and in his/her 40s and 60s, respectively.
* Equivalent income: Income adjusted to the per-capita level by dividing household income by the square root of the number of household members.
7
Sources: Ministry of Health, Labour and Welfare “Comprehensive Survey of Living Conditions” for ①; Compiled by the Counsellor Office for PolicyEvaluation to Director-General for General Policy and Evaluation based on “Comprehensive Survey of Living Conditions” for ② and ③; and “Reporton analysis of household income” (2017), a proprietary project report entrusted by the Counsellor Office for Policy Evaluation to Director-General forGeneral Policy and Evaluation for ④
200
300
400
500
600
700
800(10,000yen)
(Year)
Households with children
0
2
4
6
8
10
12
14
(%)
19942012
2014
(Year)
Average gross income(10,000 yen)
Median(10,000yen)
Quartile dispersioncoefficient
1994 304.9 219 0.54
2014 297.3 240 0.44
[③ Relative frequency distribution of households by income brackets (elderly households)]
Average gross income(10,000 yen)
Median(10,000yen)
Quartile dispersioncoefficient
1994 753.2 690 0.34
2012 648.9 604 0.39
2014 686.9 627 0.4
[② Relative frequency distribution of households by income brackets (households with a head in his/her 40s)]
[➀ Annual trends in average gross income per household]
All households
Elderly households
[④ Trends in average equivalent disposable income by age groups of household heads]
Household head aged 50-59 years
Age total (dotted line)
Householdhead aged40-49 years60-69 years
30-39 years70-79 years
Household head aged 20-29 years
(10,000yen)
(10,000yen)
0
5
10
15
20
25
1985
1986
1987
1988
1989
1990
1991
1992
1993
1994
1995
1996
1997
1998
1999
2000
2001
2002
2003
2004
2005
2006
2007
2008
2009
2010
2011
2012
2013
2014
2015
(Year)
Chapter 2 People’s lives and Social SecuritySection 1 Trends in family income (2)
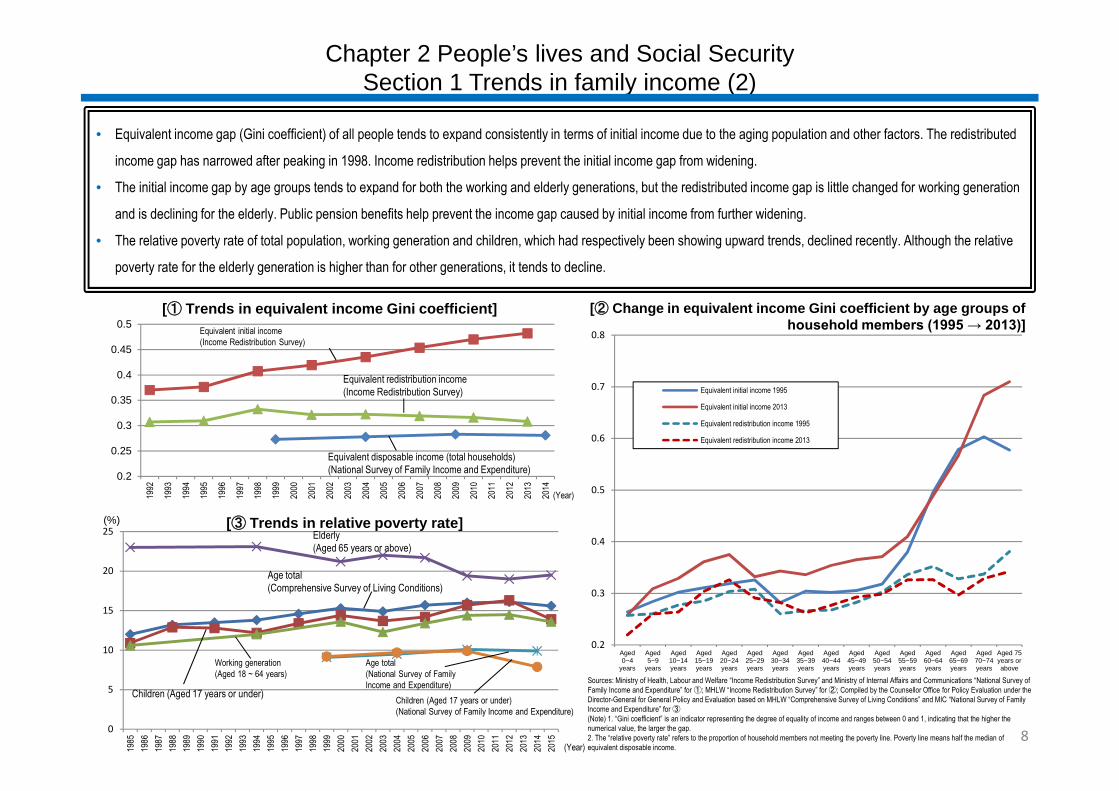
• Equivalent income gap (Gini coefficient) of all people tends to expand consistently in terms of initial income due to the aging population and other factors. The redistributed
income gap has narrowed after peaking in 1998. Income redistribution helps prevent the initial income gap from widening.
• The initial income gap by age groups tends to expand for both the working and elderly generations, but the redistributed income gap is little changed for working generation
and is declining for the elderly. Public pension benefits help prevent the income gap caused by initial income from further widening.
• The relative poverty rate of total population, working generation and children, which had respectively been showing upward trends, declined recently. Although the relative
poverty rate for the elderly generation is higher than for other generations, it tends to decline.
0.2
0.25
0.3
0.35
0.4
0.45
0.5
1992
1993
1994
1995
1996
1997
1998
1999
2000
2001
2002
2003
2004
2005
2006
2007
2008
2009
2010
2011
2012
2013
2014
(Year)
[① Trends in equivalent income Gini coefficient]
0.2
0.3
0.4
0.5
0.6
0.7
0.8
Aged0~4
years
Aged5~9
years
Aged10~14years
Aged15~19years
Aged20~24years
Aged25~29years
Aged30~34years
Aged35~39years
Aged40~44years
Aged45~49years
Aged50~54years
Aged55~59years
Aged60~64years
Aged65~69years
Aged70~74years
Aged 75years orabove
Equivalent initial income 1995
Equivalent initial income 2013
Equivalent redistribution income 1995
Equivalent redistribution income 2013
[② Change in equivalent income Gini coefficient by age groups ofhousehold members (1995 → 2013)]
[③ Trends in relative poverty rate]
8
Sources: Ministry of Health, Labour and Welfare “Income Redistribution Survey” and Ministry of Internal Affairs and Communications “National Survey ofFamily Income and Expenditure” for ①; MHLW “Income Redistribution Survey” for ②; Compiled by the Counsellor Office for Policy Evaluation under theDirector-General for General Policy and Evaluation based on MHLW “Comprehensive Survey of Living Conditions” and MIC “National Survey of FamilyIncome and Expenditure” for ③(Note) 1. “Gini coefficient” is an indicator representing the degree of equality of income and ranges between 0 and 1, indicating that the higher thenumerical value, the larger the gap.2. The “relative poverty rate” refers to the proportion of household members not meeting the poverty line. Poverty line means half the median ofequivalent disposable income.
(%)
Equivalent initial income(Income Redistribution Survey)
Equivalent redistribution income(Income Redistribution Survey)
Equivalent disposable income (total households)(National Survey of Family Income and Expenditure)
Elderly(Aged 65 years or above)
Age total(Comprehensive Survey of Living Conditions)
Working generation(Aged 18 ~ 64 years)
Age total(National Survey of FamilyIncome and Expenditure)
Children (Aged 17 years or under)Children (Aged 17 years or under)(National Survey of Family Income and Expenditure)
Chapter 2 People’s Lives and Social SecuritySection 2 Trends in wages
Sources: Ministry of Health, Labour and Welfare “Monthly Labour Survey” for ①; Compiled by the Counsellor Office for PolicyEvaluation under the Director-General for General Policy and Evaluation based on the MHLW “Monthly Labour Survey” for ②;and the MHLW “Basic Survey on Wage Structure” for ③
9▲ 14.0
▲ 12.0
▲ 10.0
▲ 8.0
▲ 6.0
▲ 4.0
▲ 2.0
0.0
2.0(%)
▲11.0%
▲12.4%
▲1.6%
0
5
10
15
20
25
30
35
40
45
50
1990
1991
1992
1993
1994
1995
1996
1997
1998
1999
2000
2001
2002
2003
2004
2005
2006
2007
2008
2009
2010
2011
2012
2013
2014
2015
2016
(10,000 yen)
(Year)
Part-time workers
All types ofemployment
Full-time workers
[① Annual trends in total cash earnings by type of employment]
Contribution of part-time workers’ totalcash earnings: 0.2%
0
150
200
250
300
350
400
450
(Year)
[③ Annual trends in scheduled cash earnings of full-time male workers (20s to 50s)]
Aged 35~39years
Aged 40~44years
Total age
Aged 30~34years
Aged 25~29years
Aged 20~24years
Aged 50~54 years Aged 45~49 years
Aged 55~59 years
(1,000 yen)
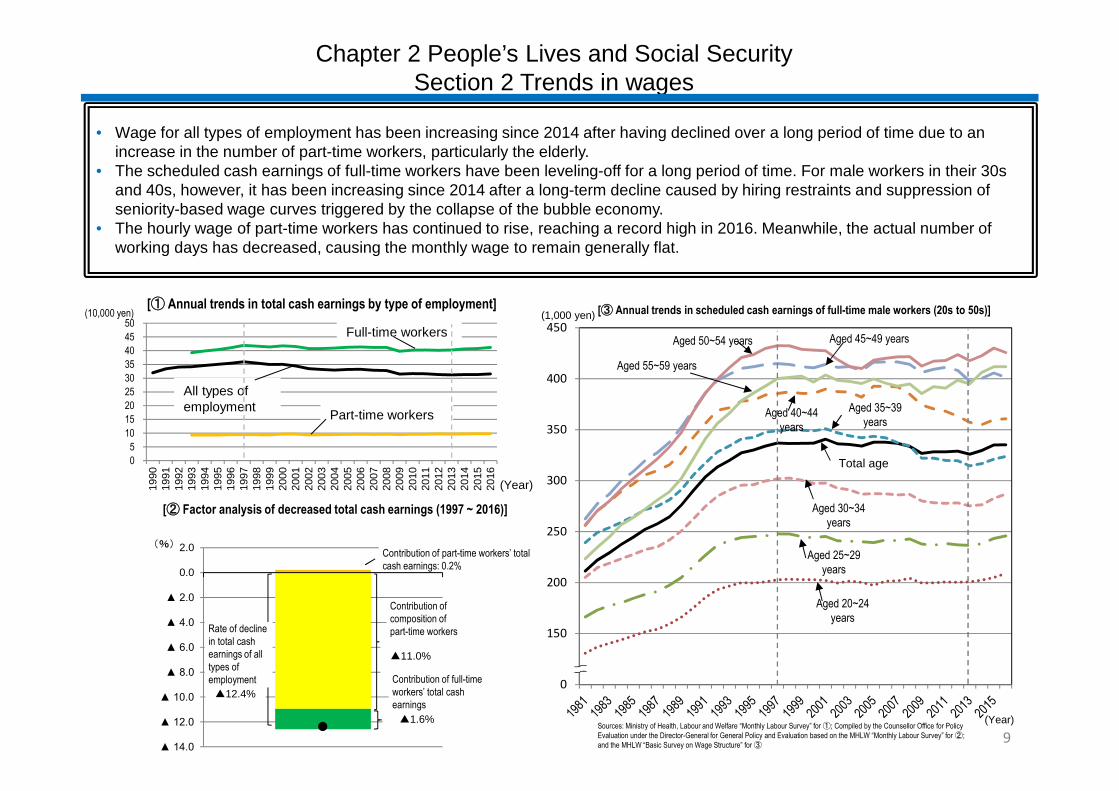
• Wage for all types of employment has been increasing since 2014 after having declined over a long period of time due to anincrease in the number of part-time workers, particularly the elderly.
• The scheduled cash earnings of full-time workers have been leveling-off for a long period of time. For male workers in their 30sand 40s, however, it has been increasing since 2014 after a long-term decline caused by hiring restraints and suppression ofseniority-based wage curves triggered by the collapse of the bubble economy.
• The hourly wage of part-time workers has continued to rise, reaching a record high in 2016. Meanwhile, the actual number ofworking days has decreased, causing the monthly wage to remain generally flat.
[② Factor analysis of decreased total cash earnings (1997 ~ 2016)]
Rate of declinein total cashearnings of alltypes ofemployment
Contribution ofcomposition ofpart-time workers
Contribution of full-timeworkers’ total cashearnings
-20
0
20
40
60
80
100
-500
0
500
1,000
1,500
2,000
2,500
1994
1999
2004
2009
2014
1994
1999
2004
2009
2014
1994
1999
2004
2009
2014
1994
1999
2004
2009
2014
1994
1999
2004
2009
2014
1994
1999
2004
2009
2014
1994
1999
2004
2009
2014
Age meter Under 30 Aged 30~39years
Aged 40~49years
Aged 50~59years
Aged 60~69years
Aged 70 yearsor above
(10,000 yen)Current outstanding liabilities
Current outstanding savings
Financial assets (currentoutstanding savings - currentoutstanding liabilities)Home ownership rate (rightscale)
Chapter 2 People’s lives and Social SecuritySection 3 Trends in assets
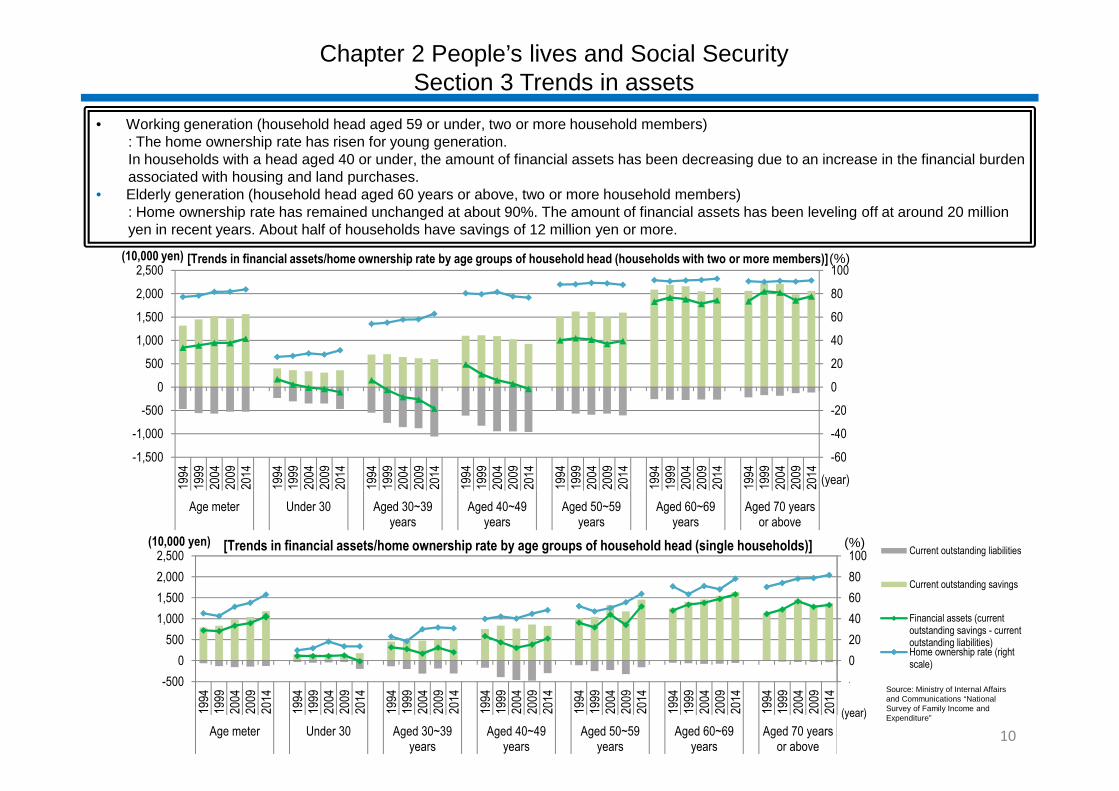
• Working generation (household head aged 59 or under, two or more household members): The home ownership rate has risen for young generation.In households with a head aged 40 or under, the amount of financial assets has been decreasing due to an increase in the financial burdenassociated with housing and land purchases.
• Elderly generation (household head aged 60 years or above, two or more household members): Home ownership rate has remained unchanged at about 90%. The amount of financial assets has been leveling off at around 20 millionyen in recent years. About half of households have savings of 12 million yen or more.
Source: Ministry of Internal Affairsand Communications “NationalSurvey of Family Income andExpenditure”
10
[Trends in financial assets/home ownership rate by age groups of household head (single households)]
[Trends in financial assets/home ownership rate by age groups of household head (households with two or more members)]
(%)
(year)
-60
-40
-20
0
20
40
60
80
100
-1,500
-1,000
-500
0
500
1,000
1,500
2,000
2,500
1994
1999
2004
2009
2014
1994
1999
2004
2009
2014
1994
1999
2004
2009
2014
1994
1999
2004
2009
2014
1994
1999
2004
2009
2014
1994
1999
2004
2009
2014
1994
1999
2004
2009
2014
Age meter Under 30 Aged 30~39years
Aged 40~49years
Aged 50~59years
Aged 60~69years
Aged 70 yearsor above
(year)
(%)(10,000 yen)
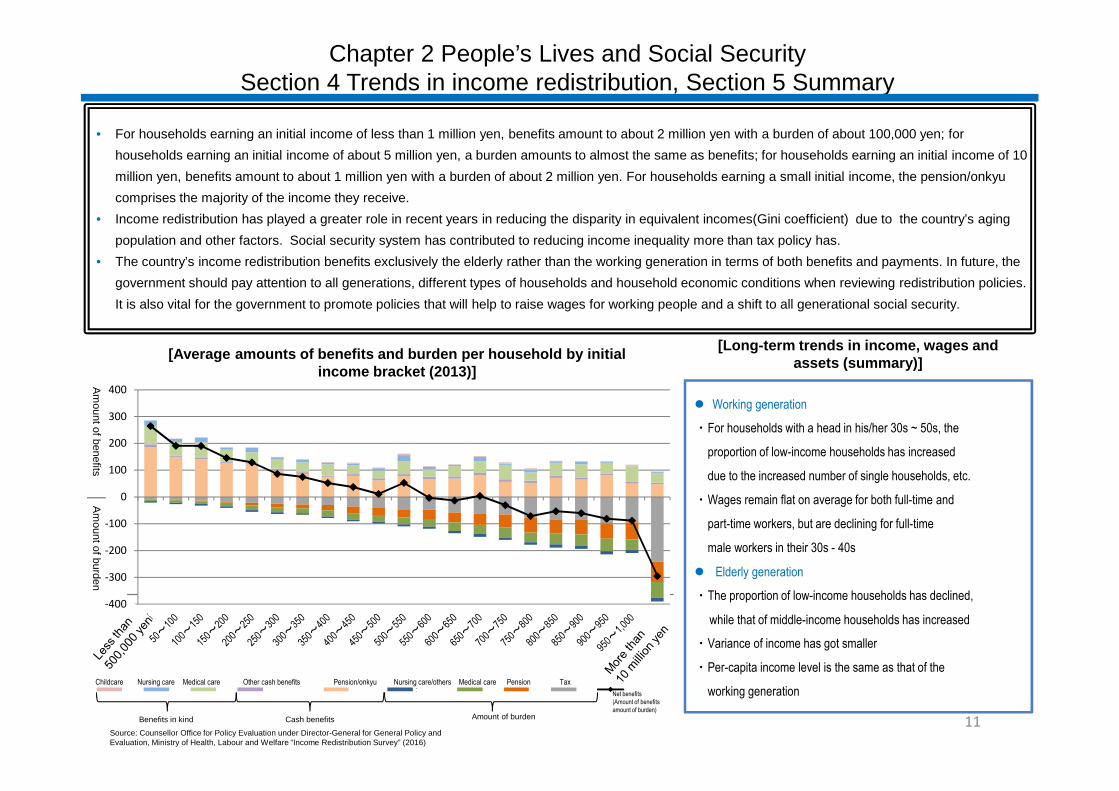
Chapter 2 People’s Lives and Social SecuritySection 4 Trends in income redistribution, Section 5 Summary
• For households earning an initial income of less than 1 million yen, benefits amount to about 2 million yen with a burden of about 100,000 yen; for
households earning an initial income of about 5 million yen, a burden amounts to almost the same as benefits; for households earning an initial income of 10
million yen, benefits amount to about 1 million yen with a burden of about 2 million yen. For households earning a small initial income, the pension/onkyu
comprises the majority of the income they receive.
• Income redistribution has played a greater role in recent years in reducing the disparity in equivalent incomes(Gini coefficient) due to the country’s aging
population and other factors. Social security system has contributed to reducing income inequality more than tax policy has.
• The country’s income redistribution benefits exclusively the elderly rather than the working generation in terms of both benefits and payments. In future, the
government should pay attention to all generations, different types of households and household economic conditions when reviewing redistribution policies.
It is also vital for the government to promote policies that will help to raise wages for working people and a shift to all generational social security.
Working generation
・For households with a head in his/her 30s ~ 50s, the
proportion of low-income households has increased
due to the increased number of single households, etc.
・Wages remain flat on average for both full-time and
part-time workers, but are declining for full-time
male workers in their 30s - 40s
Elderly generation
・The proportion of low-income households has declined,
while that of middle-income households has increased
・Variance of income has got smaller
・Per-capita income level is the same as that of the
working generation
[Long-term trends in income, wages andassets (summary)]
11Source: Counsellor Office for Policy Evaluation under Director-General for General Policy andEvaluation, Ministry of Health, Labour and Welfare “Income Redistribution Survey” (2016)
[Average amounts of benefits and burden per household by initialincome bracket (2013)]
-400
-300
-200
-100
0
100
200
300
400
保育 介護 医療 その他の現金給付 年金・恩給 介護・その他 医療 年金 税金 ネットの受益額
(受給額-負担額)
Benefits in kind Cash benefits Amount of burden
Am
ountof
benefits
Am
ountof
burd
en
Childcare Nursing care Medical care TaxOther cash benefits Pension/onkyu Nursing care/others Medical care Pension
Net benefits(Amount of benefitsamount of burden)
[Elimination of waiting children]To support proactive municipalities, including the Tokyo Metropolitan Government, the National Government secured a budget to preparea reservoir for approximately 220,000 children in 2 years from FY2018 to the end of FY2019, thereby eliminating the waiting list forchildren.(Eliminate the waiting list for children nationwide within three years, by the end of FY2020 at the latest)
Increase of approx.100,000 people
Increase of approx.220,000 people
“Plan to accelerate efforts to eliminate thewaiting list for children”(5 years)
FY2013 FY2017 - end FY2022 - end
Increase of 530,000people
2019 to FY2020 -end
Increase of approx. 320,000 people
“New plan”(2 to 3 years + 2 years)
Number of children onthe waiting list
Employment rate ofwomen (aged 25 - 44)
About 24,000 people(April 2016) Zero
80%72.7%(H28)
(Maintaining zero)
Supporting municipalities and securing budget to develop a reservoirfor eliminating children on the waiting list in 2 yearsEliminating the waiting list for children in 3 years at the latest
Female employment rate to beraised to 80% in 5 yearsElimination of "M-shaped curve"
[Elimination of the “M-shaped curve” in 5 years while maintaining a zero waiting list for children]To solve the “M-shaped curve,” prepare a reservoir for approximately 320,000 women in 5 years from FY2018 to the endof FY2022, which corresponds to an 80% female employment rate.
(Reference) Female employment rate in Sweden:82.5%(2013)
Chapter 3 Social Security from the Growth PerspectiveSection 1 Efforts to stabilize people’s lives, Section 2 Support for employment and wage increases (1)
• Help people lead financially stable lives and revitalize society through public pension scheme, and health insurance and long-term care insurancesystems
• Maintain household financial stability for families with children through child allowances, child support allowances and measures to combat childpoverty, which serve as investments in future generations
• Help needy persons achieve self-sufficiency through the welfare system and the support system for self-reliance of needy persons
• Expand child care support so that more young people can marry and have children/make sure that no one has to quit their jobs to care for familymembers so that people of working age can keep working while caregiving
12
[Support system for self-reliance of needy persons (enforced in April 2015) ]
Approximately 60,000 people were employedwithin two years of its enforcement
[Child-rearing security plan (June 2017)]
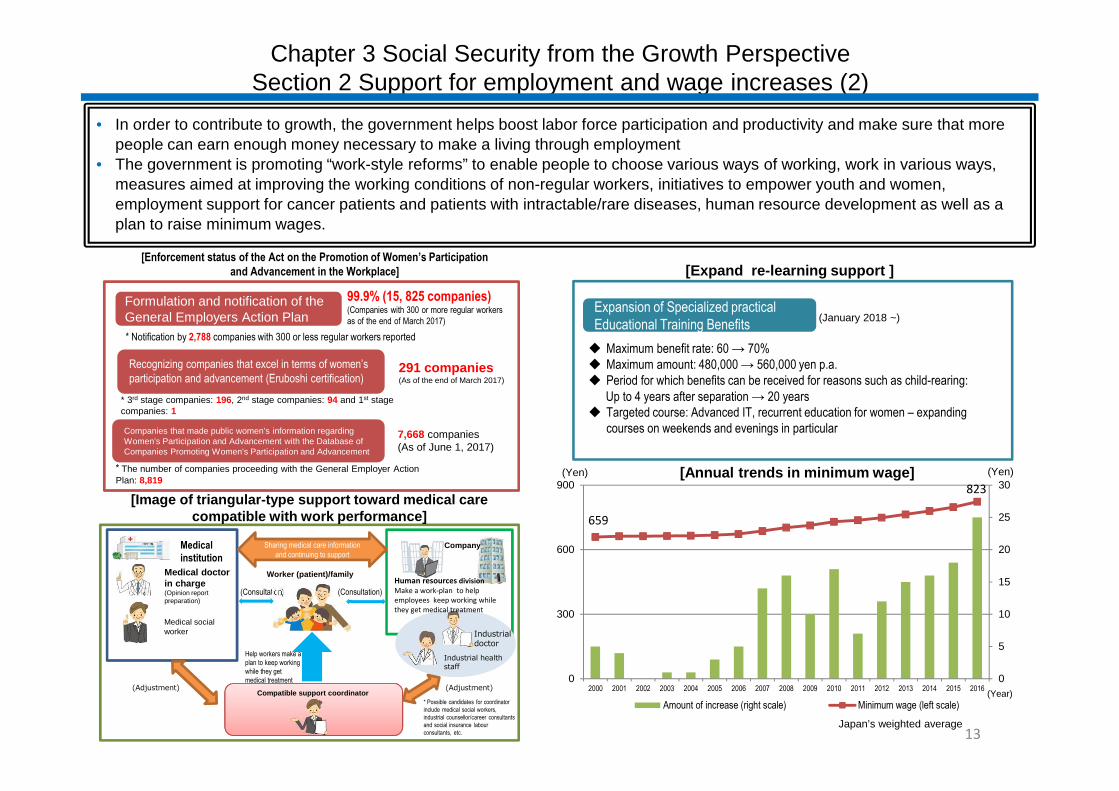
Chapter 3 Social Security from the Growth PerspectiveSection 2 Support for employment and wage increases (2)
Japan’s weighted average
659
823
0
5
10
15
20
25
30
0
300
600
900
2000 2001 2002 2003 2004 2005 2006 2007 2008 2009 2010 2011 2012 2013 2014 2015 2016
Amount of increase (right scale) Minimum wage (left scale)
(Yen)
(Year)
(Yen) [Annual trends in minimum wage]
• In order to contribute to growth, the government helps boost labor force participation and productivity and make sure that morepeople can earn enough money necessary to make a living through employment
• The government is promoting “work-style reforms” to enable people to choose various ways of working, work in various ways,measures aimed at improving the working conditions of non-regular workers, initiatives to empower youth and women,employment support for cancer patients and patients with intractable/rare diseases, human resource development as well as aplan to raise minimum wages.
[Enforcement status of the Act on the Promotion of Women’s Participationand Advancement in the Workplace] [Expand re-learning support ]
Expansion of Specialized practicalEducational Training Benefits
Maximum benefit rate: 60 → 70% Maximum amount: 480,000 → 560,000 yen p.a. Period for which benefits can be received for reasons such as child-rearing:
Up to 4 years after separation → 20 years Targeted course: Advanced IT, recurrent education for women – expanding
courses on weekends and evenings in particular
(January 2018 ~)
Formulation and notification of theGeneral Employers Action Plan
99.9% (15, 825 companies)(Companies with 300 or more regular workersas of the end of March 2017)
* Notification by 2,788 companies with 300 or less regular workers reported
Recognizing companies that excel in terms of women’sparticipation and advancement (Eruboshi certification)
291 companies(As of the end of March 2017)
* 3rd stage companies: 196, 2nd stage companies: 94 and 1st stagecompanies: 1
Companies that made public women’s information regardingWomen’s Participation and Advancement with the Database ofCompanies Promoting Women’s Participation and Advancement
7,668 companies(As of June 1, 2017)
* The number of companies proceeding with the General Employer ActionPlan: 8,819
13
[Image of triangular-type support toward medical carecompatible with work performance]
Compatible support coordinator
Medicalinstitution
Medical doctorin charge(Opinion reportpreparation)
Industrialdoctor
(Adjustment)
(Consultation)
Medical socialworker
Industrial healthstaff
Help workers make aplan to keep workingwhile they getmedical treatment
Sharing medical care informationand continuing to support
Worker (patient)/family
(Consultation)
Company
(Adjustment)
* Possible candidates for coordinatorinclude medical social workers,industrial counsellor/career consultantsand social insurance labourconsultants, etc.
Human resources divisionMake a work-plan to helpemployees keep working whilethey get medical treatment
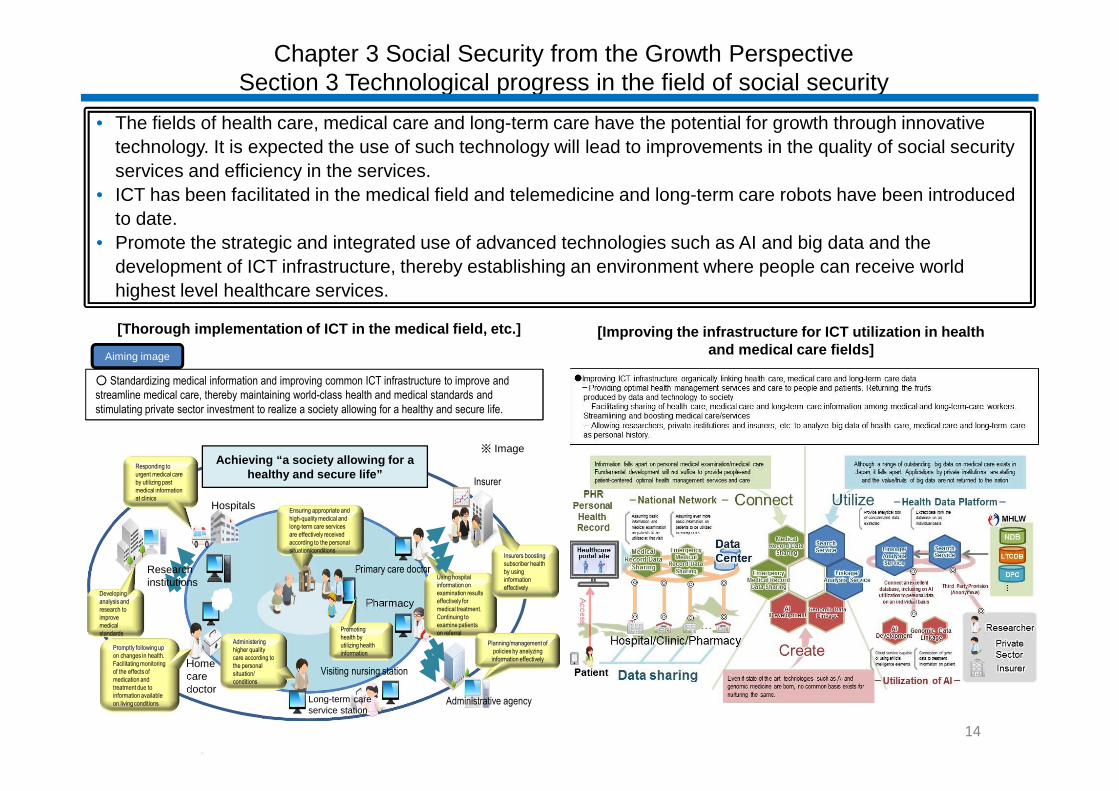
Chapter 3 Social Security from the Growth PerspectiveSection 3 Technological progress in the field of social security
• The fields of health care, medical care and long-term care have the potential for growth through innovative
technology. It is expected the use of such technology will lead to improvements in the quality of social security
services and efficiency in the services.
• ICT has been facilitated in the medical field and telemedicine and long-term care robots have been introduced
to date.
• Promote the strategic and integrated use of advanced technologies such as AI and big data and the
development of ICT infrastructure, thereby establishing an environment where people can receive world
highest level healthcare services.
[Improving the infrastructure for ICT utilization in healthand medical care fields]
14
[Thorough implementation of ICT in the medical field, etc.]
○ Standardizing medical information and improving common ICT infrastructure to improve andstreamline medical care, thereby maintaining world-class health and medical standards andstimulating private sector investment to realize a society allowing for a healthy and secure life.
Aiming image
Primary care doctor
Hospitals
Homecaredoctor
Long-term careservice station
Visiting nursing station
Pharmacy
Administrative agency
Insurer
Ensuring appropriate andhigh-quality medical andlong-term care servicesare effectively receivedaccording to the personalsituation/conditions
Administeringhigher qualitycare according tothe personalsituation/conditions
Using hospitalinformation onexamination resultseffectively formedical treatment.Continuing toexamine patientson referral
Developinganalysis andresearch toimprovemedicalstandards
※ Image
Promotinghealth byutilizing healthinformation
Promptly following upon changes in health.Facilitating monitoringof the effects ofmedication andtreatment due toinformation availableon living conditions
Planning/management ofpolicies by analyzinginformation effectively
Achieving “a society allowing for ahealthy and secure life”
Researchinstitutions
Responding tourgent medical careby utilizing pastmedical informationat clinics
Insurers boostingsubscriber healthby usinginformationeffectively
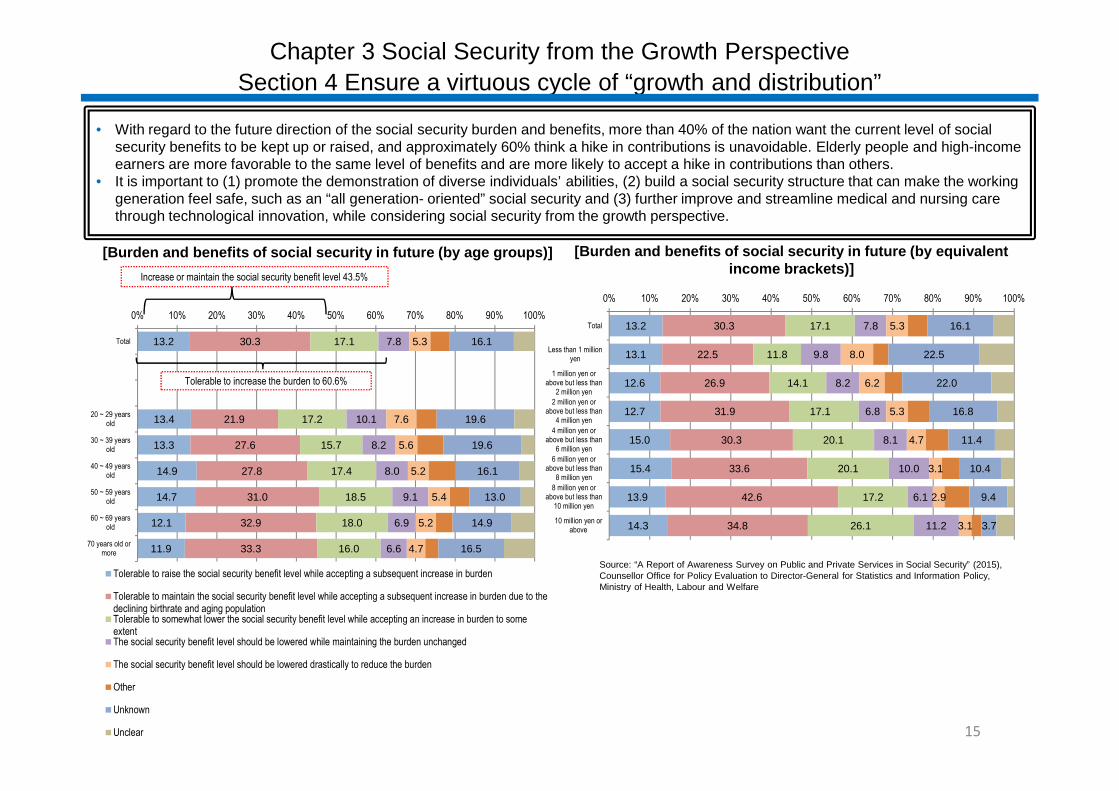
13.2
13.1
12.6
12.7
15.0
15.4
13.9
14.3
30.3
22.5
26.9
31.9
30.3
33.6
42.6
34.8
17.1
11.8
14.1
17.1
20.1
20.1
17.2
26.1
7.8
9.8
8.2
6.8
8.1
10.0
6.1
11.2
5.3
8.0
6.2
5.3
4.7
3.1
2.9
3.1
16.1
22.5
22.0
16.8
11.4
10.4
9.4
3.7
0% 10% 20% 30% 40% 50% 60% 70% 80% 90% 100%
Total
Less than 1 millionyen
1 million yen orabove but less than
2 million yen
2 million yen orabove but less than
4 million yen
4 million yen orabove but less than
6 million yen
6 million yen orabove but less than
8 million yen
8 million yen orabove but less than
10 million yen
10 million yen orabove
13.2
13.4
13.3
14.9
14.7
12.1
11.9
30.3
21.9
27.6
27.8
31.0
32.9
33.3
17.1
17.2
15.7
17.4
18.5
18.0
16.0
7.8
10.1
8.2
8.0
9.1
6.9
6.6
5.3
7.6
5.6
5.2
5.4
5.2
4.7
16.1
19.6
19.6
16.1
13.0
14.9
16.5
0% 10% 20% 30% 40% 50% 60% 70% 80% 90% 100%
Total
20 ~ 29 yearsold
30 ~ 39 yearsold
40 ~ 49 yearsold
50 ~ 59 yearsold
60 ~ 69 yearsold
70 years old ormore
Tolerable to raise the social security benefit level while accepting a subsequent increase in burden
Tolerable to maintain the social security benefit level while accepting a subsequent increase in burden due to thedeclining birthrate and aging populationTolerable to somewhat lower the social security benefit level while accepting an increase in burden to someextentThe social security benefit level should be lowered while maintaining the burden unchanged
The social security benefit level should be lowered drastically to reduce the burden
Other
Unknown
Unclear
Chapter 3 Social Security from the Growth Perspective
Section 4 Ensure a virtuous cycle of “growth and distribution”
• With regard to the future direction of the social security burden and benefits, more than 40% of the nation want the current level of socialsecurity benefits to be kept up or raised, and approximately 60% think a hike in contributions is unavoidable. Elderly people and high-incomeearners are more favorable to the same level of benefits and are more likely to accept a hike in contributions than others.
• It is important to (1) promote the demonstration of diverse individuals’ abilities, (2) build a social security structure that can make the workinggeneration feel safe, such as an “all generation- oriented” social security and (3) further improve and streamline medical and nursing carethrough technological innovation, while considering social security from the growth perspective.
[Burden and benefits of social security in future (by age groups)]
Source: “A Report of Awareness Survey on Public and Private Services in Social Security” (2015),Counsellor Office for Policy Evaluation to Director-General for Statistics and Information Policy,Ministry of Health, Labour and Welfare
15
[Burden and benefits of social security in future (by equivalentincome brackets)]
Tolerable to increase the burden to 60.6%
Increase or maintain the social security benefit level 43.5%