2016 school accountability report card - washington unified
TRANSCRIPT

2016-17 School Accountability Report Card for Washington Union High School Page 1 of 12
Washington Union High School
School Accountability Report Card
Reported Using Data from the 2016-17 School Year
Published During 2017-18
By February 1 of each year, every school in California is required by state law to publish a School Accountability Report Card (SARC). The SARC contains information about the condition and performance of each California public school. Under the Local Control Funding Formula (LCFF) all local educational agencies (LEAs) are required to prepare a Local Control and Accountability Plan (LCAP), which describes how they intend to meet annual school-specific goals for all pupils, with specific activities to address state and local priorities. Additionally, data reported in an LCAP is to be consistent with data reported in the SARC. • For more information about SARC requirements, see the California Department of Education (CDE) SARC Web page at
http://www.cde.ca.gov/ta/ac/sa/. • For more information about the LCFF or LCAP, see the CDE LCFF Web page at http://www.cde.ca.gov/fg/aa/lc/. • For additional information about the school, parents/guardians and community members should contact the school principal or
the district office. DataQuest DataQuest is an online data tool located on the CDE DataQuest Web page at http://dq.cde.ca.gov/dataquest/ that contains additional information about this school and comparisons of the school to the district and the county. Specifically, DataQuest is a dynamic system that provides reports for accountability (e.g., test data, enrollment, high school graduates, dropouts, course enrollments, staffing, and data regarding English learners). Internet Access Internet access is available at public libraries and other locations that are publicly accessible (e.g., the California State Library). Access to the Internet at libraries and public locations is generally provided on a first-come, first-served basis. Other use restrictions may include the hours of operation, the length of time that a workstation may be used (depending on availability), the types of software programs available on a workstation, and the ability to print documents.
About This School Contact Information (School Year 2017-18)
School Contact Information
School Name------- Washington Union High School
Street------- 6041 South Elm
City, State, Zip------- Fresno, CA 93706
Phone Number------- 559-485-8805
Principal------- Mr. John Sherron
E-mail Address------- [email protected]
Web Site------- wuhs.washingtonunified.org
CDS Code 1076778 1038306
2016-17 School Accountability Report Card for Washington Union High School Page 2 of 12
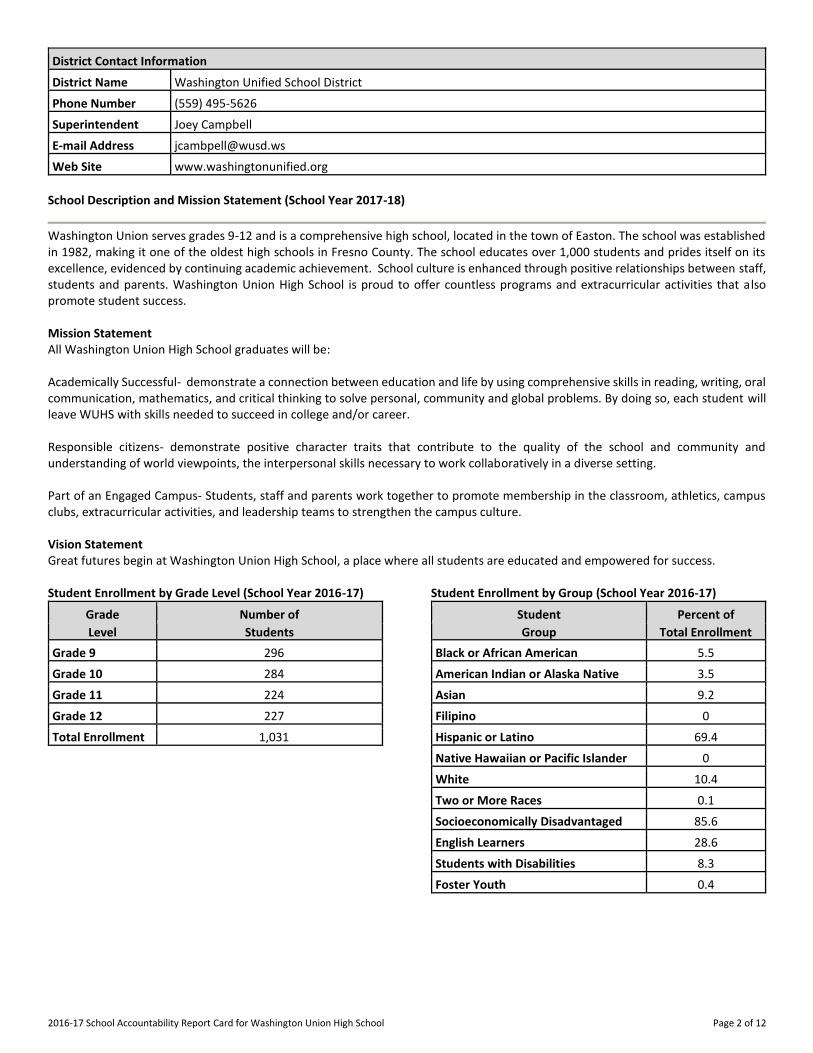
District Contact Information
District Name------- Washington Unified School District
Phone Number------- (559) 495-5626
Superintendent-------
Joey Campbell
E-mail Address------- [email protected]
Web Site------- www.washingtonunified.org
School Description and Mission Statement (School Year 2017-18)
Washington Union serves grades 9-12 and is a comprehensive high school, located in the town of Easton. The school was established in 1982, making it one of the oldest high schools in Fresno County. The school educates over 1,000 students and prides itself on its excellence, evidenced by continuing academic achievement. School culture is enhanced through positive relationships between staff, students and parents. Washington Union High School is proud to offer countless programs and extracurricular activities that also promote student success. Mission Statement All Washington Union High School graduates will be: Academically Successful- demonstrate a connection between education and life by using comprehensive skills in reading, writing, oral communication, mathematics, and critical thinking to solve personal, community and global problems. By doing so, each student will leave WUHS with skills needed to succeed in college and/or career. Responsible citizens- demonstrate positive character traits that contribute to the quality of the school and community and understanding of world viewpoints, the interpersonal skills necessary to work collaboratively in a diverse setting. Part of an Engaged Campus- Students, staff and parents work together to promote membership in the classroom, athletics, campus clubs, extracurricular activities, and leadership teams to strengthen the campus culture. Vision Statement Great futures begin at Washington Union High School, a place where all students are educated and empowered for success. Student Enrollment by Grade Level (School Year 2016-17)
Grade Number of
Level Students
Grade 9 296
Grade 10 284
Grade 11 224
Grade 12 227
Total Enrollment 1,031
Student Enrollment by Group (School Year 2016-17)
Student Percent of
Group Total Enrollment
Black or African American 5.5
American Indian or Alaska Native 3.5
Asian 9.2
Filipino 0
Hispanic or Latino 69.4
Native Hawaiian or Pacific Islander 0
White 10.4
Two or More Races 0.1
Socioeconomically Disadvantaged 85.6
English Learners 28.6
Students with Disabilities 8.3
Foster Youth 0.4
2016-17 School Accountability Report Card for Washington Union High School Page 3 of 12
A. Conditions of Learning
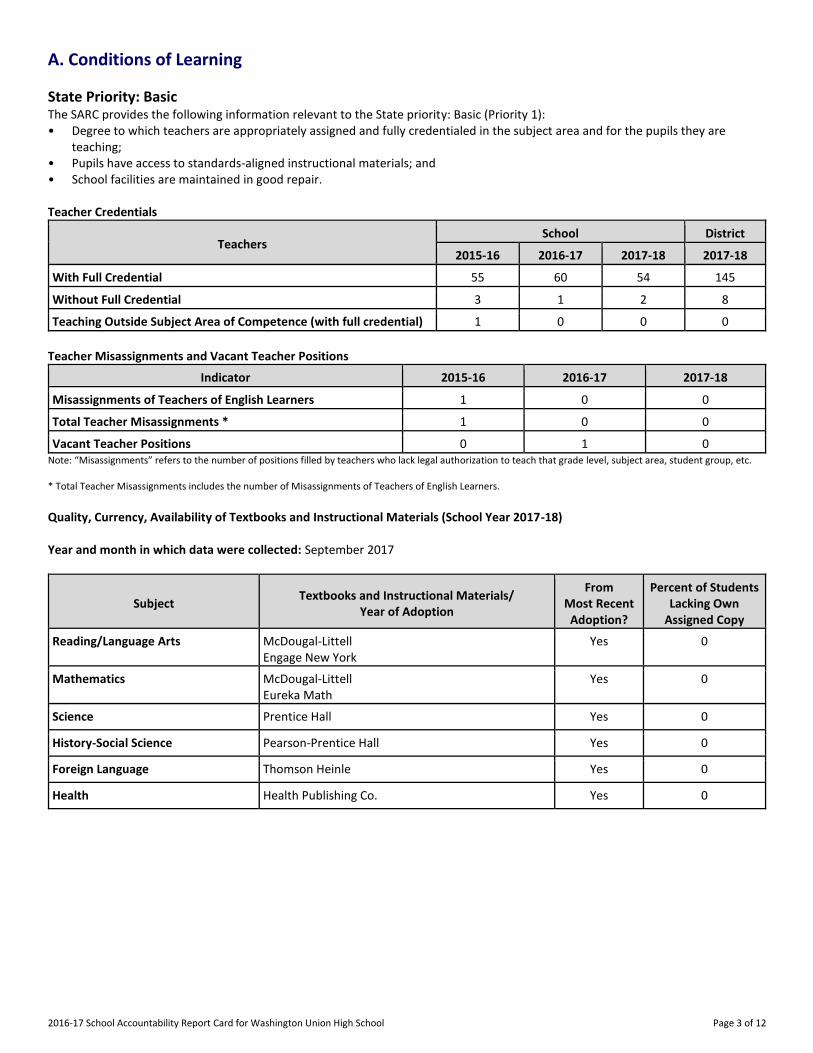
State Priority: Basic The SARC provides the following information relevant to the State priority: Basic (Priority 1): • Degree to which teachers are appropriately assigned and fully credentialed in the subject area and for the pupils they are
teaching; • Pupils have access to standards-aligned instructional materials; and • School facilities are maintained in good repair. Teacher Credentials
Teachers School District
2015-16 2016-17 2017-18 2017-18
With Full Credential 55 60 54 145
Without Full Credential 3 1 2 8
Teaching Outside Subject Area of Competence (with full credential) 1 0 0 0
Teacher Misassignments and Vacant Teacher Positions
Indicator 2015-16 2016-17 2017-18
Misassignments of Teachers of English Learners 1 0 0
Total Teacher Misassignments * 1 0 0
Vacant Teacher Positions 0 1 0 Note: “Misassignments” refers to the number of positions filled by teachers who lack legal authorization to teach that grade level, subject area, student group, etc. * Total Teacher Misassignments includes the number of Misassignments of Teachers of English Learners. Quality, Currency, Availability of Textbooks and Instructional Materials (School Year 2017-18) Year and month in which data were collected: September 2017
Subject Textbooks and Instructional Materials/
Year of Adoption
From Most Recent
Adoption?
Percent of Students Lacking Own
Assigned Copy
Reading/Language Arts McDougal-Littell Engage New York
Yes 0
Mathematics McDougal-Littell Eureka Math
Yes 0
Science Prentice Hall Yes 0
History-Social Science Pearson-Prentice Hall Yes 0
Foreign Language Thomson Heinle Yes 0
Health Health Publishing Co. Yes 0

2016-17 School Accountability Report Card for Washington Union High School Page 4 of 12
School Facility Conditions and Planned Improvements (Most Recent Year)
General Information The district takes great efforts to ensure that all schools are clean, safe, and functional. Below is more specific information on the condition of the school and the efforts made to ensure that students are provided with a clean, safe, and functional learning environment. Additional information about the condition of the school's facilities may be obtained by speaking with the school principal. Age of School Buildings: The school facilities include an auditorium, library, multipurpose room, cafeteria, gymnasiums, music room, classrooms and school administrative offices. The classrooms were modernized in 2013-2015. Walls, floors, ceilings, and cabinets were installed. New roofs and canopies were done as a part of modernization and a deferred maintenance hardship. Maintenance and Repair: District maintenance staff ensures that the repairs necessary to keep the school in good repair and working order are completed in a timely manner. Our most recent Williams Inspection validates our overall score of good in all perimeters of the school. This table displays the results of the most recently completed school site inspection to determine the school facility's good repair status. School Facility Good Repair Status (Most Recent Year) Using the most recently collected FIT data (or equivalent), provide the following:
• Determination of repair status for systems listed • Description of any needed maintenance to ensure good repair • The year and month in which the data were collected • The overall rating
School Facility Good Repair Status (Most Recent Year) Year and month of the most recent FIT report: 09/05/2017
System Inspected Repair Status Repair Needed and
Action Taken or Planned Good Fair Poor
Systems: Gas Leaks, Mechanical/HVAC, Sewer
X
Interior: Interior Surfaces X Auditorium: 4 seats are ripped. Old Gym: Lights are out.
Cleanliness: Overall Cleanliness, Pest/ Vermin Infestation
X Wrestling Room: Dirty room-needs to be cleaned and work repairs done. Training Room: Need to be cleaned. Old gym: Dirty.
Electrical: Electrical X Sophomore Academy: Directors Office light out. K1: Picture room wall socket not covered-bare wires exposed. Library: Office- 2 lights out. New Gym: Storage room light out (west side of gym). Office: 4 lights out. Rms. J1-2: 2 lights out in weight room. Cafeteria: 9 lights out. Light cover missing in Girl's RR. Kitchen: Light out in storage area. 5 lights out in serving area. Auditorium: 5 lights out. Wrestling Room: Light are out. Storage room heat switch cover missing. Phone jack not covered correctly bare wires. P.E. Team Room: Light out. Rms. H5-8: Cracked light cover.
2016-17 School Accountability Report Card for Washington Union High School Page 5 of 12
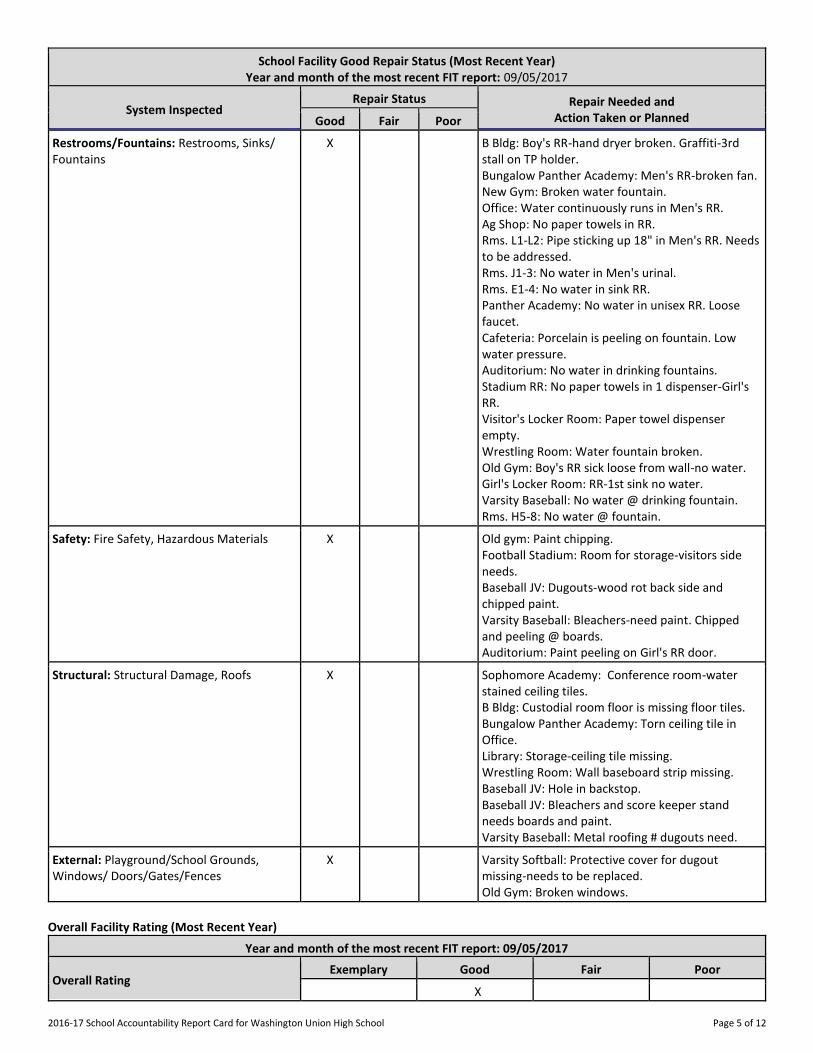
School Facility Good Repair Status (Most Recent Year) Year and month of the most recent FIT report: 09/05/2017
System Inspected Repair Status Repair Needed and
Action Taken or Planned Good Fair Poor
Restrooms/Fountains: Restrooms, Sinks/ Fountains
X B Bldg: Boy's RR-hand dryer broken. Graffiti-3rd stall on TP holder. Bungalow Panther Academy: Men's RR-broken fan. New Gym: Broken water fountain. Office: Water continuously runs in Men's RR. Ag Shop: No paper towels in RR. Rms. L1-L2: Pipe sticking up 18" in Men's RR. Needs to be addressed. Rms. J1-3: No water in Men's urinal. Rms. E1-4: No water in sink RR. Panther Academy: No water in unisex RR. Loose faucet. Cafeteria: Porcelain is peeling on fountain. Low water pressure. Auditorium: No water in drinking fountains. Stadium RR: No paper towels in 1 dispenser-Girl's RR. Visitor's Locker Room: Paper towel dispenser empty. Wrestling Room: Water fountain broken. Old Gym: Boy's RR sick loose from wall-no water. Girl's Locker Room: RR-1st sink no water. Varsity Baseball: No water @ drinking fountain. Rms. H5-8: No water @ fountain.
Safety: Fire Safety, Hazardous Materials X Old gym: Paint chipping. Football Stadium: Room for storage-visitors side needs. Baseball JV: Dugouts-wood rot back side and chipped paint. Varsity Baseball: Bleachers-need paint. Chipped and peeling @ boards. Auditorium: Paint peeling on Girl's RR door.
Structural: Structural Damage, Roofs X Sophomore Academy: Conference room-water stained ceiling tiles. B Bldg: Custodial room floor is missing floor tiles. Bungalow Panther Academy: Torn ceiling tile in Office. Library: Storage-ceiling tile missing. Wrestling Room: Wall baseboard strip missing. Baseball JV: Hole in backstop. Baseball JV: Bleachers and score keeper stand needs boards and paint. Varsity Baseball: Metal roofing # dugouts need.
External: Playground/School Grounds, Windows/ Doors/Gates/Fences
X Varsity Softball: Protective cover for dugout missing-needs to be replaced. Old Gym: Broken windows.
Overall Facility Rating (Most Recent Year)
Year and month of the most recent FIT report: 09/05/2017
Overall Rating Exemplary Good Fair Poor
X
2016-17 School Accountability Report Card for Washington Union High School Page 6 of 12
B. Pupil Outcomes
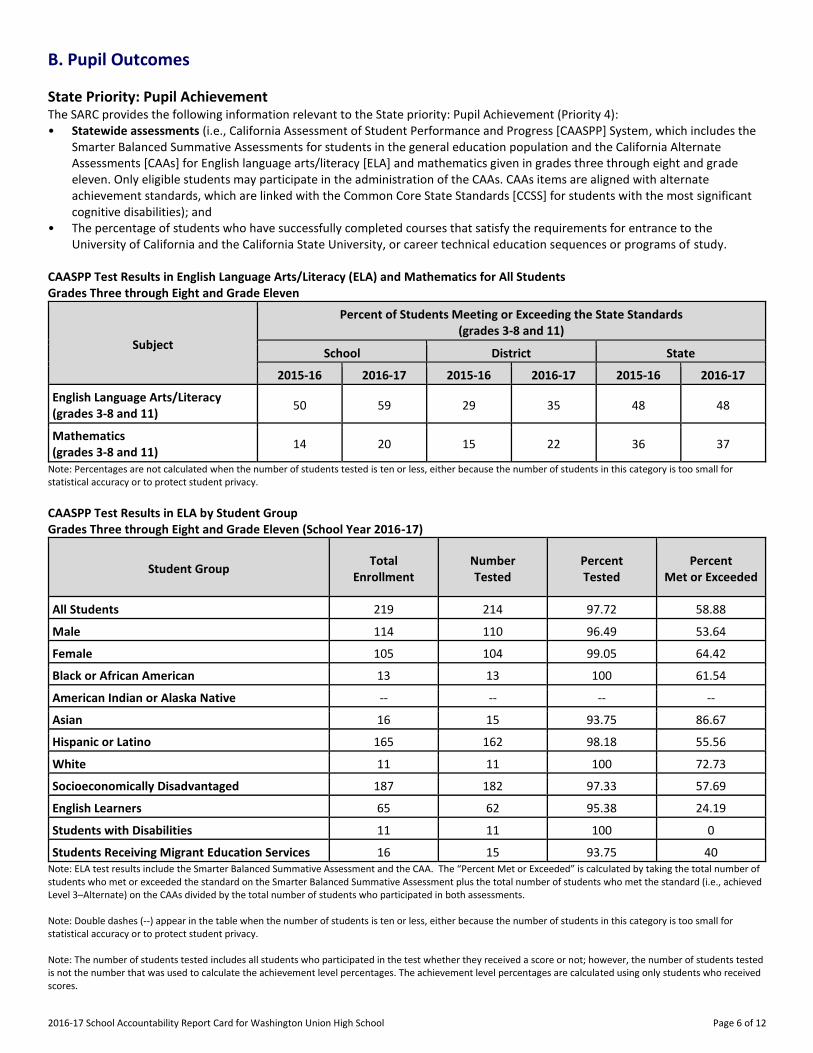
State Priority: Pupil Achievement The SARC provides the following information relevant to the State priority: Pupil Achievement (Priority 4): • Statewide assessments (i.e., California Assessment of Student Performance and Progress [CAASPP] System, which includes the
Smarter Balanced Summative Assessments for students in the general education population and the California Alternate Assessments [CAAs] for English language arts/literacy [ELA] and mathematics given in grades three through eight and grade eleven. Only eligible students may participate in the administration of the CAAs. CAAs items are aligned with alternate achievement standards, which are linked with the Common Core State Standards [CCSS] for students with the most significant cognitive disabilities); and
• The percentage of students who have successfully completed courses that satisfy the requirements for entrance to the University of California and the California State University, or career technical education sequences or programs of study.
CAASPP Test Results in English Language Arts/Literacy (ELA) and Mathematics for All Students Grades Three through Eight and Grade Eleven
Subject
Percent of Students Meeting or Exceeding the State Standards (grades 3-8 and 11)
School District State
2015-16 2016-17 2015-16 2016-17 2015-16 2016-17
English Language Arts/Literacy (grades 3-8 and 11)
50 59 29 35 48 48
Mathematics (grades 3-8 and 11)
14 20 15 22 36 37
Note: Percentages are not calculated when the number of students tested is ten or less, either because the number of students in this category is too small for statistical accuracy or to protect student privacy.
CAASPP Test Results in ELA by Student Group Grades Three through Eight and Grade Eleven (School Year 2016-17)
Student Group Total
Enrollment Number Tested
Percent Tested
Percent Met or Exceeded
All Students 219 214 97.72 58.88
Male 114 110 96.49 53.64
Female 105 104 99.05 64.42
Black or African American 13 13 100 61.54
American Indian or Alaska Native -- -- -- --
Asian 16 15 93.75 86.67
Hispanic or Latino 165 162 98.18 55.56
White 11 11 100 72.73
Socioeconomically Disadvantaged 187 182 97.33 57.69
English Learners 65 62 95.38 24.19
Students with Disabilities 11 11 100 0
Students Receiving Migrant Education Services 16 15 93.75 40 Note: ELA test results include the Smarter Balanced Summative Assessment and the CAA. The “Percent Met or Exceeded” is calculated by taking the total number of students who met or exceeded the standard on the Smarter Balanced Summative Assessment plus the total number of students who met the standard (i.e., achieved Level 3–Alternate) on the CAAs divided by the total number of students who participated in both assessments. Note: Double dashes (--) appear in the table when the number of students is ten or less, either because the number of students in this category is too small for statistical accuracy or to protect student privacy. Note: The number of students tested includes all students who participated in the test whether they received a score or not; however, the number of students tested is not the number that was used to calculate the achievement level percentages. The achievement level percentages are calculated using only students who received scores.

2016-17 School Accountability Report Card for Washington Union High School Page 7 of 12
CAASPP Test Results in Mathematics by Student Group Grades Three through Eight and Grade Eleven (School Year 2016-17)
Student Group Total
Enrollment Number Tested
Percent Tested
Percent Met or Exceeded
All Students 219 216 98.63 19.91
Male 114 112 98.25 20.54
Female 105 104 99.05 19.23
Black or African American 13 13 100 0
American Indian or Alaska Native -- -- -- --
Asian 16 15 93.75 53.33
Hispanic or Latino 165 164 99.39 18.29
White 11 11 100 27.27
Socioeconomically Disadvantaged 187 184 98.4 19.02
English Learners 65 63 96.92 7.94
Students with Disabilities 11 11 100 0
Students Receiving Migrant Education Services 16 16 100 6.25 Note: Mathematics test results include the Smarter Balanced Summative Assessment and the CAA. The “Percent Met or Exceeded” is calculated by taking the total number of students who met or exceeded the standard on the Smarter Balanced Summative Assessment plus the total number of students who met the standard (i.e., achieved Level 3–Alternate) on the CAAs divided by the total number of students who participated in both assessments. Note: Double dashes (--) appear in the table when the number of students is ten or less, either because the number of students in this category is too small for statistical accuracy or to protect student privacy. Note: The number of students tested includes all students who participated in the test whether they received a score or not; however, the number of students tested is not the number that was used to calculate the achievement level percentages. The achievement level percentages are calculated using only students who received scores.
CAASPP Test Results in Science for All Students Grades Five, Eight, and Ten
Subject
Percent of Students Scoring at Proficient or Advanced
School District State
2014-15 2015-16 2014-15 2015-16 2014-15 2015-16
Science (grades 5, 8, and 10) 29 38 30 33 56 54
Note: Science test results include California Standards Tests (CSTs), California Modified Assessment (CMA), and California Alternate Performance Assessment (CAPA) in grades five, eight, and ten. Note: Scores are not shown when the number of students tested is ten or less, either because the number of students in this category is too small for statistical accuracy or to protect student privacy. Note: The 2016-17 data are not available. The California Department of Education is developing a new science assessment based on the Next Generation Science Standards for California Public Schools (CA NGSS). The new California Science Test (CAST) was piloted in spring 2017. The CST and CMA for Science will no longer be administered.
Career Technical Education Programs (School Year 2016-17)
Washington High career planning program prepares students to succeed in real-world contexts through the development of conceptual thinking, effective communication, and the ability to apply knowledge and skills learned in the classroom. Instructors at Washington High have directed efforts toward establishing school-to-work structures within each curricular area for all students, including those with special needs. Washington Union currently has three pathways that students can choose to participate in: The Health Institute, The Law and Justice Institute, and the Wonderful Agriculture Institute. Students in these pathways participate in college prep classes that directly relate to their field of interest. They also participate in CTE courses throughout their four years to give them on-the-job training.

2016-17 School Accountability Report Card for Washington Union High School Page 8 of 12
Guidance Counselors offer additional support through various programs, including career units in each grade level, various community classrooms, and college workshops. Washington Union High School increases and develops students’ overall career awareness by teaching Career Units in grades 9-11. These career units are taught by counselors and teachers. During these career units, students participate in activities that help them research careers, match their personalities with compatible career areas, and research the training necessary for particular careers. In addition, during the 12th grade students are required to take a class called Senior Projects where students take a more in depth look at a particular career and complete fifteen hours of job shadowing. Senior Projects culminates with students making a formal presentation on their chosen career to teachers and community members. Administration conducts walkthroughs on a daily basis. The walkthrough is a method used to determine if research based instructional practices are being utilized and how often. Data for walkthroughs is collected, tabulated, and shared with teachers. The data is also used to determine overall teaching and course effectiveness as well as areas of strength and weakness. Professional Learning Communities have been formed for each course where the PLC reviews student performance data to determine course effectiveness, among other things. Career Technical Education Participation (School Year 2016-17)
Measure CTE Program Participation
Number of pupils participating in CTE 104
% of pupils completing a CTE program and earning a high school diploma 69%
% of CTE courses sequenced or articulated between the school and institutions of postsecondary education 16%
Courses for University of California (UC) and/or California State University (CSU) Admission
UC/CSU Course Measure Percent
2016–17 Pupils Enrolled in Courses Required for UC/CSU Admission 99.14
2015–16 Graduates Who Completed All Courses Required for UC/CSU Admission 19.82
State Priority: Other Pupil Outcomes The SARC provides the following information relevant to the State priority: Other Pupil Outcomes (Priority 8): • Pupil outcomes in the subject areas of physical education. California Physical Fitness Test Results (School Year 2016-17)
Grade Level
Percent of Students Meeting Fitness Standards
Four of Six Standards Five of Six Standards Six of Six Standards
---9--- 18.9 17.7 36.6 Note: Percentages are not calculated when the number of students tested is ten or less, either because the number of students in this category is too small for statistical accuracy or to protect student privacy.
C. Engagement
State Priority: Parental Involvement The SARC provides the following information relevant to the State priority: Parental Involvement (Priority 3): • Efforts the school district makes to seek parent input in making decisions for the school district and each schoolsite. Opportunities for Parental Involvement (School Year 2017-18)
Parents and the community are very supportive of the educational program at Washington Union High School. The school community is committed to providing a quality education, which meets the needs of Washington Union High School’s diverse population. Parent support groups are very active and include the School Site Council, Migrant Advisory Council, Academy Parent Committees, AG Boosters, and a variety of Athletic Boosters.
2016-17 School Accountability Report Card for Washington Union High School Page 9 of 12
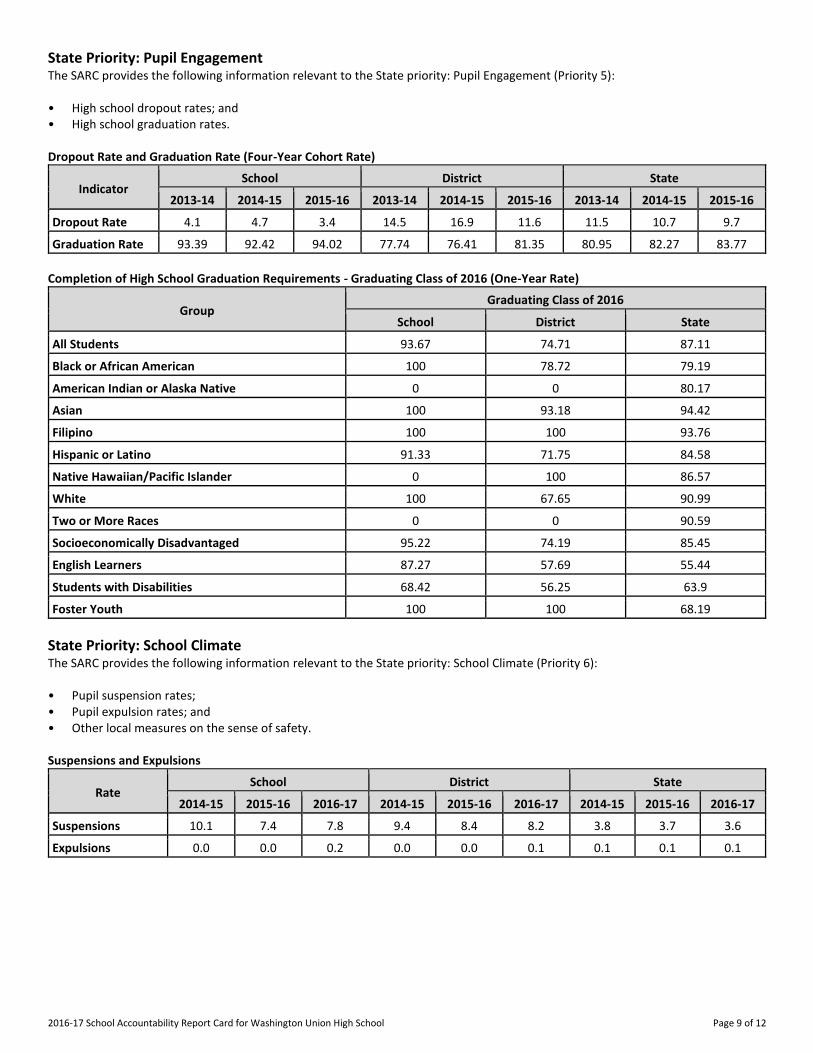
State Priority: Pupil Engagement The SARC provides the following information relevant to the State priority: Pupil Engagement (Priority 5): • High school dropout rates; and • High school graduation rates. Dropout Rate and Graduation Rate (Four-Year Cohort Rate)
Indicator School District State
2013-14 2014-15 2015-16 2013-14 2014-15 2015-16 2013-14 2014-15 2015-16
Dropout Rate 4.1 4.7 3.4 14.5 16.9 11.6 11.5 10.7 9.7
Graduation Rate 93.39 92.42 94.02 77.74 76.41 81.35 80.95 82.27 83.77
Completion of High School Graduation Requirements - Graduating Class of 2016 (One-Year Rate)
Group Graduating Class of 2016
School District State
All Students 93.67 74.71 87.11
Black or African American 100 78.72 79.19
American Indian or Alaska Native 0 0 80.17
Asian 100 93.18 94.42
Filipino 100 100 93.76
Hispanic or Latino 91.33 71.75 84.58
Native Hawaiian/Pacific Islander 0 100 86.57
White 100 67.65 90.99
Two or More Races 0 0 90.59
Socioeconomically Disadvantaged 95.22 74.19 85.45
English Learners 87.27 57.69 55.44
Students with Disabilities 68.42 56.25 63.9
Foster Youth 100 100 68.19
State Priority: School Climate The SARC provides the following information relevant to the State priority: School Climate (Priority 6): • Pupil suspension rates; • Pupil expulsion rates; and • Other local measures on the sense of safety. Suspensions and Expulsions
Rate School District State
2014-15 2015-16 2016-17 2014-15 2015-16 2016-17 2014-15 2015-16 2016-17
Suspensions------- 10.1 7.4 7.8 9.4 8.4 8.2 3.8 3.7 3.6
Expulsions------- 0.0 0.0 0.2 0.0 0.0 0.1 0.1 0.1 0.1

2016-17 School Accountability Report Card for Washington Union High School Page 10 of 12
School Safety Plan (School Year 2017-18)
Safety of students and staff is a primary concern of Washington Union High School. Before, during, and after school, responsibility for monitoring the campus is shared by instructional support staff and certificated staff. All visitors must sign in at the office and wear appropriate identification while on campus. The comprehensive school safety plan is designed to assist in preparing for emergencies, managing emergency response efforts, and maintaining a safe school environment. The plan requires identification of security needs, development of prevention and intervention techniques, evaluation of physical facilities, and communication with staff and students. Components of the plan include: child abuse reporting procedures, procedures for teacher notification of dangerous pupils, disaster response procedures, procedures for safe ingress and egress from school, sexual harassment policies, and suspension and expulsion policies. The safety plan is reviewed annually, updated as needed, and fully compliant with federal and state regulations. The plan includes procedures for emergencies, individual staff responsibilities during an incident, exit routes, and inventories of emergency supplies. We make the plan available on our school website and keep copies in the office for parents. We ensure all staff is properly trained throughout the year, practice fire drills monthly, and individual crisis drills three times a year. Lock down drills, earthquake drills, and fire drills are all performed by staff and students. A copy of the Teacher Handbook/School Safety Plan is available at the school office for viewing upon request.
D. Other SARC Information
The information in this section is required to be in the SARC but is not included in the state priorities for LCFF. Federal Intervention Program (School Year 2017-18)
Indicator School District
Program Improvement Status In PI In PI
First Year of Program Improvement 2010-2011 2013-2014
Year in Program Improvement* Year 5 Year 1
Number of Schools Currently in Program Improvement N/A 5
Percent of Schools Currently in Program Improvement N/A 62.5 Note: Cells with N/A values do not require data.
Average Class Size and Class Size Distribution (Secondary)
Subject
2014-15 2015-16 2016-17
Avg. Class Size
Number of Classrooms Avg. Class Size
Number of Classrooms Avg. Class Size
Number of Classrooms
1-22 23-32 33+ 1-22 23-32 33+ 1-22 23-32 33+
English------- ----------
22 25 21 6 21 22 22 12 23 22 22 8
Mathematics ----------
21 30 18 2 22 25 24 27 9 38 4
Science------- ----------
26 10 21 8 24 13 20 7 26 9 16 5
Social Science ----------
29 4 16 8 27 7 17 6 26 7 19 4 Note: Number of classes indicates how many classrooms fall into each size category (a range of total students per classroom). At the secondary school level, this information is reported by subject area rather than grade level.

2016-17 School Accountability Report Card for Washington Union High School Page 11 of 12
Academic Counselors and Other Support Staff (School Year 2016-17)
Title Number of FTE
Assigned to School Average Number of Students per
Academic Counselor
Academic Counselor------- 4 260
Counselor (Social/Behavioral or Career Development) 0 N/A
Library Media Teacher (Librarian) 0 N/A
Library Media Services Staff (Paraprofessional) 1 N/A
Psychologist------- 1 N/A
Social Worker------- 0 N/A
Nurse------- 1 N/A
Speech/Language/Hearing Specialist 0 N/A
Resource Specialist------- 4 N/A
Other------- 5 N/A Note: Cells with N/A values do not require data. *One Full Time Equivalent (FTE) equals one staff member working full time; one FTE could also represent two staff members who each work 50 percent of full time.
Expenditures per Pupil and School Site Teacher Salaries (Fiscal Year 2015-16)
Level
Expenditures Per Pupil Average Teacher Salary Total
Supplemental/ Restricted
Basic/ Unrestricted
School Site------- $1,715.68 $8,158.47 57,643.00
District------- N/A N/A $2,743.64 $63,695
Percent Difference: School Site and District N/A N/A 99.3 -10.0
State------- N/A N/A $6,574 $69,649
Percent Difference: School Site and State N/A N/A 21.5 -18.9 Note: Cells with N/A values do not require data.
Types of Services Funded (Fiscal Year 2016-17)
WUSD provides programs and services to support and assist students with core instruction, RTI, intervention, Tutoring, Migrant, AVID, After School Programs, Special Education, English Language Development, Career and Technical Education, Supplemental Education Services, and Teacher Professional Development through the use of Title I, II, III, 21st Century, Carl Perkins, Lottery, ROP, and LCFF Base, Supplemental, and Concentration funds. Teacher and Administrative Salaries (Fiscal Year 2015-16)
Category District Amount State Average for Districts In Same Category
Beginning Teacher Salary $44,167 $44,144
Mid-Range Teacher Salary $63,399 $69,119
Highest Teacher Salary $83,179 $86,005
Average Principal Salary (Elementary) $88,392 $106,785
Average Principal Salary (Middle) $97,568 $111,569
Average Principal Salary (High) $107,696 $121,395
Superintendent Salary $221,075 $178,104
Percent of Budget for Teacher Salaries 29% 34%
Percent of Budget for Administrative Salaries 8% 6% For detailed information on salaries, see the CDE Certificated Salaries & Benefits Web page at http://www.cde.ca.gov/ds/fd/cs/.

2016-17 School Accountability Report Card for Washington Union High School Page 12 of 12
Advanced Placement (AP) Courses (School Year 2016-17)
Subject Number of AP Courses Offered* Percent of Students In AP Courses
Computer Science N/A
English------- 2 N/A
Fine and Performing Arts 1 N/A
Foreign Language 1 N/A
Mathematics 3 N/A
Science------- 3 N/A
Social Science 3 N/A
All courses 13 18.4 Cells with N/A values do not require data. *Where there are student course enrollments of at least one student.
Professional Development (Most Recent Three Years)
Professional development at Washington Union is designed to meet the individual needs of teachers as well as broader school concerns. It is designed to assist staff members in refining existing skills and learning new skills to achieve district and state accountability goals. The professional development program is ongoing and clearly reflects the vision and mission of our school. Our Administration team, department leads, Literacy Team members, and teachers are committed to the ongoing practices of a Professional Learning Community (PLC) Model. Our Teachers analyze assessment data and student work to ensure accurate reflections of student academic growth. This information is in turn utilized to infuse learning strategies, lesson design, and best teaching and student engagement practices to increase levels of student proficiency. Washington Union has 2 hours of PLC time per week embedded in the master schedule for teachers. Also required are three days of district and site professional development prior to the start of the school year and four days of optional professional development offered each summer. Teachers are paid for their participation. Topics for these sessions are selected based on greatest areas of needs outlined in the LCAP using data from the dashboard and other local indicators. Academic Coaching is also offered to teachers at Washington Union. Three coaches share their time between the four district sites. Areas of coaching focus are: classroom management for new teachers, math lesson engagement, and lesson design and delivery for all subjects. Current Professional Development opportunities include Kagan Cooperative Learning Structures, Lesson Design and Delivery with emphasis on student engagement strategies (T4 Learning), Eureka Math, and English Language Development provided by FCSS. Our teachers also provide each other with numerous teaching strategies and focused professional development in areas such writing skills, creating Constructed Responses for SBAC, and graphic organizers. In addition, our Director of Curriculum, Instruction, and Assessment has facilitated district-wide trainings in Mathematical Mindsets, Units of Study, Illuminate, Instructional Technology, and Professional Learning Community Facilitation.