school accountability report card (sarc) - bonita unified
TRANSCRIPT
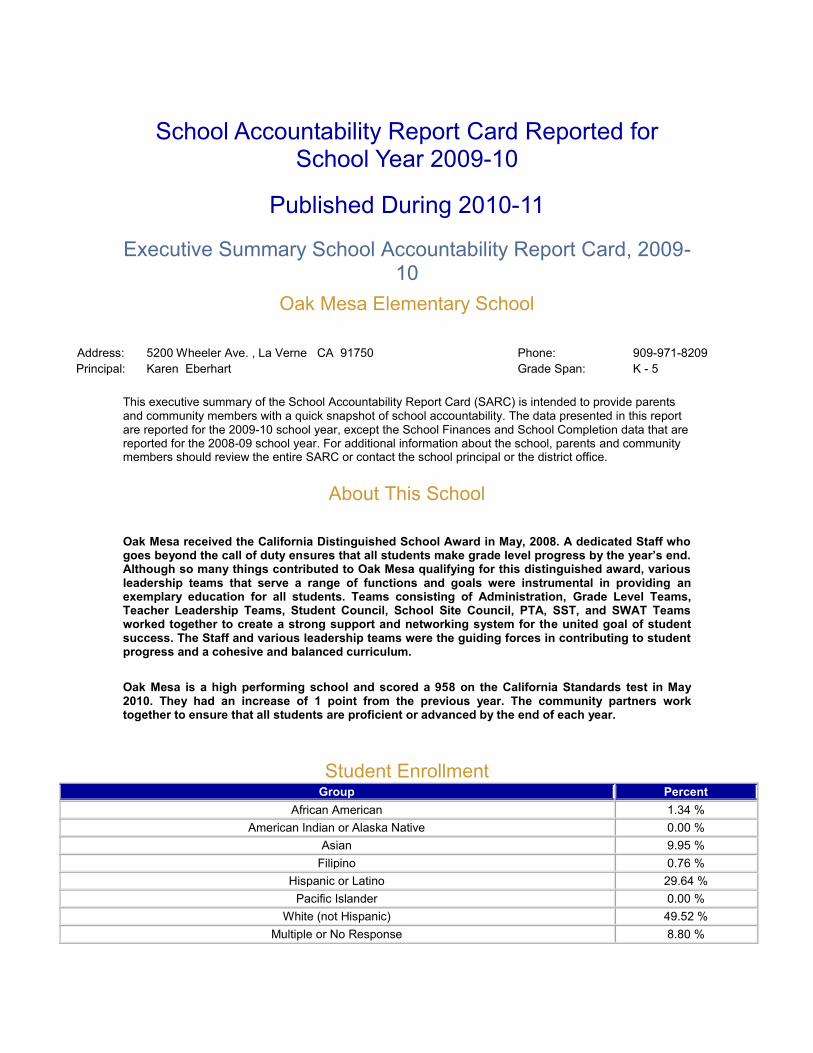
School Accountability Report Card Reported for School Year 2009-10
Published During 2010-11
Executive Summary School Accountability Report Card, 2009-10
Oak Mesa Elementary School
Address: 5200 Wheeler Ave. , La Verne CA 91750 Phone: 909-971-8209
Principal: Karen Eberhart Grade Span: K - 5
This executive summary of the School Accountability Report Card (SARC) is intended to provide parents and community members with a quick snapshot of school accountability. The data presented in this report are reported for the 2009-10 school year, except the School Finances and School Completion data that are reported for the 2008-09 school year. For additional information about the school, parents and community members should review the entire SARC or contact the school principal or the district office.
About This School
Oak Mesa received the California Distinguished School Award in May, 2008. A dedicated Staff who goes beyond the call of duty ensures that all students make grade level progress by the year’s end. Although so many things contributed to Oak Mesa qualifying for this distinguished award, various leadership teams that serve a range of functions and goals were instrumental in providing an exemplary education for all students. Teams consisting of Administration, Grade Level Teams, Teacher Leadership Teams, Student Council, School Site Council, PTA, SST, and SWAT Teams worked together to create a strong support and networking system for the united goal of student success. The Staff and various leadership teams were the guiding forces in contributing to student progress and a cohesive and balanced curriculum.
Oak Mesa is a high performing school and scored a 958 on the California Standards test in May 2010. They had an increase of 1 point from the previous year. The community partners work together to ensure that all students are proficient or advanced by the end of each year.
Student Enrollment Group Percent
African American 1.34 %
American Indian or Alaska Native 0.00 %
Asian 9.95 %
Filipino 0.76 %
Hispanic or Latino 29.64 %
Pacific Islander 0.00 %
White (not Hispanic) 49.52 %
Multiple or No Response 8.80 %
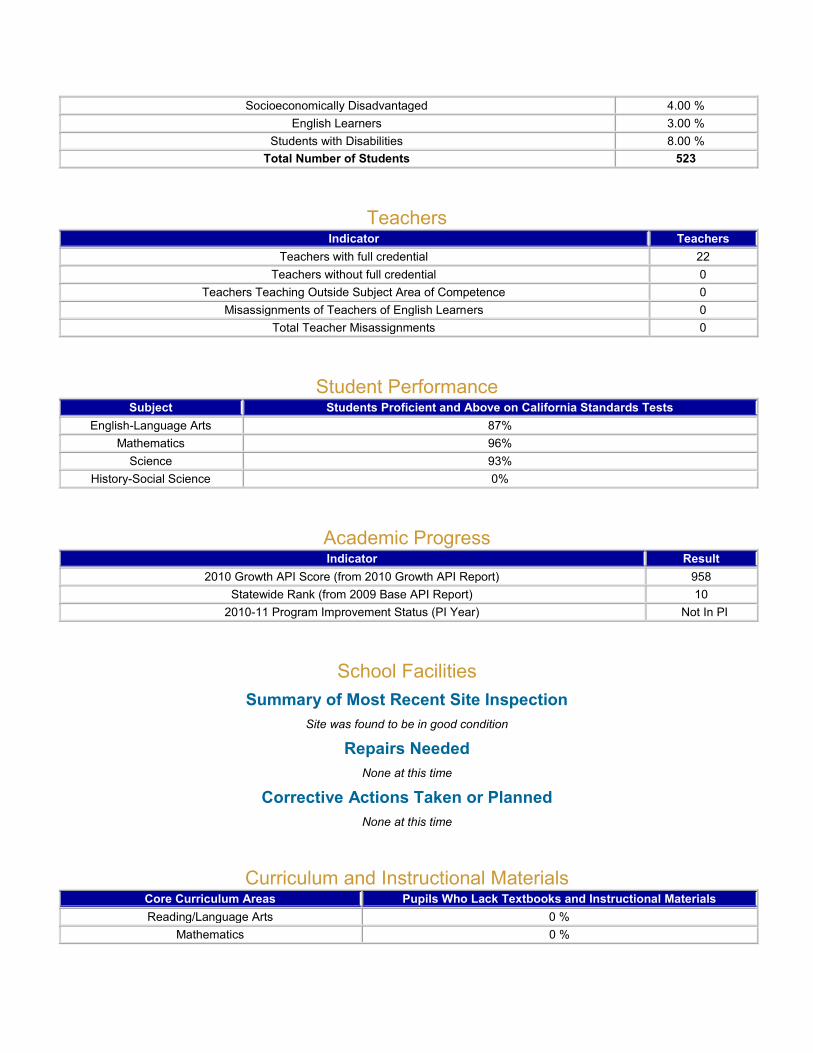
Socioeconomically Disadvantaged 4.00 %
English Learners 3.00 %
Students with Disabilities 8.00 %
Total Number of Students 523
Teachers Indicator Teachers
Teachers with full credential 22
Teachers without full credential 0
Teachers Teaching Outside Subject Area of Competence 0
Misassignments of Teachers of English Learners 0
Total Teacher Misassignments 0
Student Performance Subject Students Proficient and Above on California Standards Tests
English-Language Arts 87%
Mathematics 96%
Science 93%
History-Social Science 0%
Academic Progress Indicator Result
2010 Growth API Score (from 2010 Growth API Report) 958
Statewide Rank (from 2009 Base API Report) 10
2010-11 Program Improvement Status (PI Year) Not In PI
School Facilities
Summary of Most Recent Site Inspection
Site was found to be in good condition
Repairs Needed
None at this time
Corrective Actions Taken or Planned
None at this time
Curriculum and Instructional Materials Core Curriculum Areas Pupils Who Lack Textbooks and Instructional Materials
Reading/Language Arts 0 %
Mathematics 0 %

Science 0 %
History-Social Science 0 %
Foreign Language N/A
Health N/A
Visual and Performing Arts N/A
Science Laboratory Equipment (grades 9-12) N/A
School Finances Level Expenditures Per Pupil (Unrestricted Sources Only)
School Site $4,458
District $5,227
State $5,681
School Completion
Not applicable at the elementary school level.
Postsecondary Preparation
Not applicable at the elementary school level.
NAEP Reading, Grade 4 Level Result
Average Scale Score - State 209
Average Scale Score - National 220
Achievement Level - Basic 30%
Achievement Level - Proficient 18%
Achievement Level - Advanced 5%
NAEP Mathematics, Grade 4 Level Result
Average Scale Score - State 232
Average Scale Score - National 239
Achievement Level - Basic 41%
Achievement Level - Proficient 25%
Achievement Level - Advanced 5%

School Accountability Report Card Reported for School Year 2009-10 Published During 2010-11
The School Accountability Report Card (SARC), which is required by law to be published annually, contains information about the condition and performance of each California public school. More
information about SARC requirements is available on the California Department of Education (CDE) SARC Web page. For additional information about the school, parents and community members should contact
the school principal or the district office.
I. Data and Access
DataQuest
DataQuest is an online data tool located on the CDE DataQuest Web page that contains additional information about this school and comparisons of the school to the district, the county, and the state. Specifically, DataQuest is a dynamic system that provides reports for accountability (e.g., Academic
Performance Index [API], Adequate Yearly Progress [AYP]), test data, enrollment, graduates, dropouts, course enrollments, staffing, and data regarding English learners).
Internet Access
Internet access is available at public libraries and other locations that are publicly accessible (e.g., the California State Library). Access to the Internet at libraries and public locations is generally provided on a
first-come, first-served basis. Other use restrictions include the hours of operation, the length of time that a workstation may be used (depending on availability), the types of software programs available on a
workstation, and the ability to print documents.
II. About This School
Contact Information (School Year 2010-11)
This section provides the schools contact information.
School District
School Name Oak Mesa Elementary District Name Bonita Unified
Street 5200 Wheeler Ave. Phone Number 909-971-8200
City, State, Zip La Verne , CA 91750 Web Site www.bonita.k12.ca.us
Phone Number 909-971-8209 Superintendent Dr. Gary Rapkin
Principal Karen Eberhart E-mail Address [email protected]
E-mail Address [email protected] CDS Code 19- 64329- 6110035
School Description and Mission Statement (School Year 2009-10)
School Description and Mission Statement (School Year 2009-10)
Oak Mesa is one of eight elementary schools within the Bonita Unified School District, and served 519 students in kindergarten through fifth grade during the 2009-2010 school year. It is located 25 miles east of Los Angeles in the city of La Verne, and nestled at the base of the San Gabriel
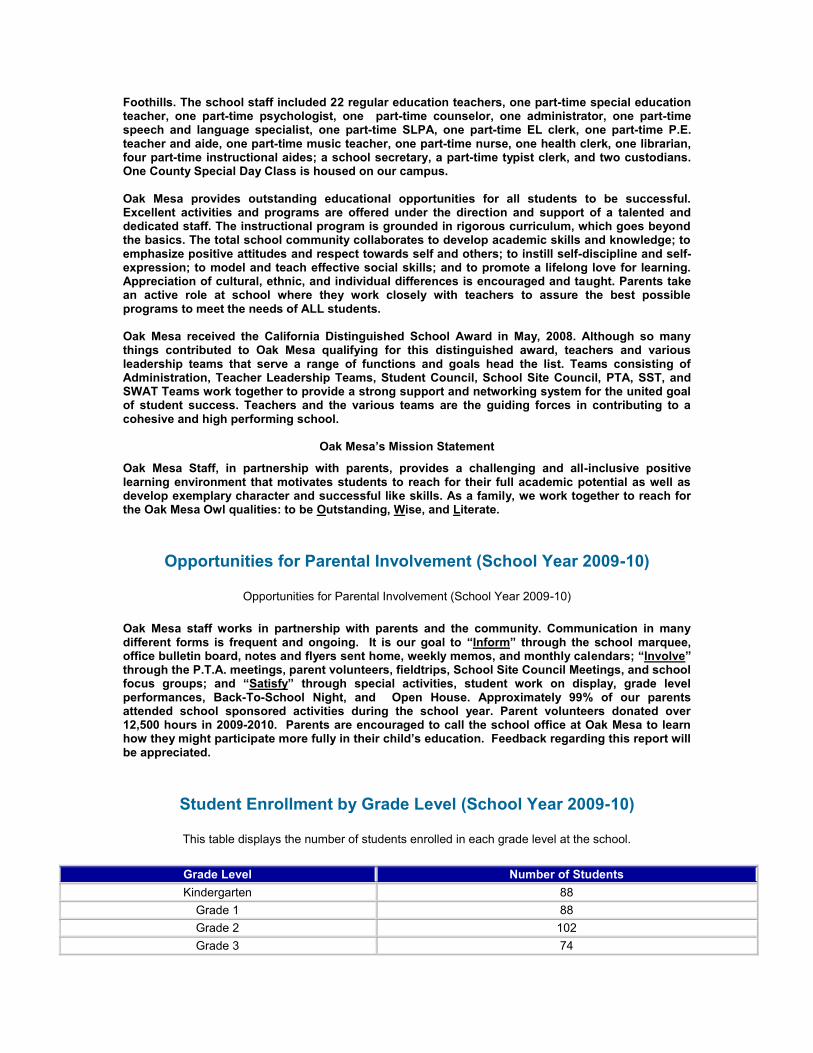
Foothills. The school staff included 22 regular education teachers, one part-time special education teacher, one part-time psychologist, one part-time counselor, one administrator, one part-time speech and language specialist, one part-time SLPA, one part-time EL clerk, one part-time P.E. teacher and aide, one part-time music teacher, one part-time nurse, one health clerk, one librarian, four part-time instructional aides; a school secretary, a part-time typist clerk, and two custodians. One County Special Day Class is housed on our campus. Oak Mesa provides outstanding educational opportunities for all students to be successful. Excellent activities and programs are offered under the direction and support of a talented and dedicated staff. The instructional program is grounded in rigorous curriculum, which goes beyond the basics. The total school community collaborates to develop academic skills and knowledge; to emphasize positive attitudes and respect towards self and others; to instill self-discipline and self-expression; to model and teach effective social skills; and to promote a lifelong love for learning. Appreciation of cultural, ethnic, and individual differences is encouraged and taught. Parents take an active role at school where they work closely with teachers to assure the best possible programs to meet the needs of ALL students. Oak Mesa received the California Distinguished School Award in May, 2008. Although so many things contributed to Oak Mesa qualifying for this distinguished award, teachers and various leadership teams that serve a range of functions and goals head the list. Teams consisting of Administration, Teacher Leadership Teams, Student Council, School Site Council, PTA, SST, and SWAT Teams work together to provide a strong support and networking system for the united goal of student success. Teachers and the various teams are the guiding forces in contributing to a cohesive and high performing school.
Oak Mesa’s Mission Statement
Oak Mesa Staff, in partnership with parents, provides a challenging and all-inclusive positive learning environment that motivates students to reach for their full academic potential as well as develop exemplary character and successful like skills. As a family, we work together to reach for the Oak Mesa Owl qualities: to be Outstanding, Wise, and Literate.
Opportunities for Parental Involvement (School Year 2009-10)
Opportunities for Parental Involvement (School Year 2009-10)
Oak Mesa staff works in partnership with parents and the community. Communication in many different forms is frequent and ongoing. It is our goal to “Inform” through the school marquee, office bulletin board, notes and flyers sent home, weekly memos, and monthly calendars; “Involve” through the P.T.A. meetings, parent volunteers, fieldtrips, School Site Council Meetings, and school focus groups; and “Satisfy” through special activities, student work on display, grade level performances, Back-To-School Night, and Open House. Approximately 99% of our parents attended school sponsored activities during the school year. Parent volunteers donated over 12,500 hours in 2009-2010. Parents are encouraged to call the school office at Oak Mesa to learn how they might participate more fully in their child’s education. Feedback regarding this report will be appreciated.
Student Enrollment by Grade Level (School Year 2009-10)
This table displays the number of students enrolled in each grade level at the school.
Grade Level Number of Students
Kindergarten 88
Grade 1 88
Grade 2 102
Grade 3 74
Grade 4 86
Grade 5 85
Total Enrollment 523
Student Enrollment by Group (School Year 2009-10)
This table displays the percent of students enrolled at the school who are identified as being in a particular group.
Group Percent of Total Enrollment
African American 1.34 %
American Indian or Alaska Native 0.00 %
Asian 9.95 %
Filipino 0.76 %
Hispanic or Latino 29.64 %
Pacific Islander 0.00 %
White (not Hispanic) 49.52 %
Multiple or No Response 8.80 %
Socioeconomically Disadvantaged 4.00 %
English Learners 3.00 %
Students with Disabilities 8.00 %
Average Class Size and Class Size Distribution (Elementary)
This table displays by grade level the average class size and the number of classrooms that fall into each size category (a range of total students per classroom).
Grade Level
2007-08 2008-09 2009-10
Avg. Class Size
Number of Classrooms Avg. Class
Size
Number of Classrooms Avg. Class
Size
Number of Classrooms
1-20 21-32 33+ 1-20 21-32 33+ 1-20 21-32 33+
K 19.6 5 20.3 3 1 22.0 4
1 18.8 4 19.8 5 22.0 4
2 19.0 5 18.4 5 20.4 3 2
3 21.5 1 3 20.5 2 2 24.7 3
4 34.0 2 35.0 2 36.0 2
5 35.5 2 35.0 2 34.5 2
4-5 30.0 1 30.0 1 30.0 1
III. School Climate
School Safety Plan (School Year 2009-10)
This section provides information about the school's comprehensive safety plan.

Oak Mesa provides a safe, secure, and supervised environment for learning. It is a closed campus where all exterior gates, with the exception of the front door to the office, are locked during the day. Any parents or community members must sign in the office and wear a visitor badge to be on campus. Emergency drills are conducted to assure for disaster preparedness. Teachers and aides supervise playgrounds. Our noon supervisors work well with our students. An extended day care program provides before and after-school supervision for students. The total school community takes pride in keeping the facility well-groomed. It is a joint effort. Oak Mesa believes that well-functioning schools promote learning, safety, and socially appropriate behaviors. They have a strong academic focus, encouraging students’ achievement, and they foster positive relationships among the entire school community. At Oak Mesa, all staff, students, parents, and members of the community work together to create a safe and positive school environment. It is the responsibility of staff, parents, and community members to safeguard children and to teach them the skills to be strong, smart, and safe. Quarterly meetings were held to discuss safety-related issues in order to provide more efficient and effective services to our children. Our major theme at each meeting was, “How Can We Do It Better?” We believe the message is clear. School safety is everyone’s job. “Doing It Better” commits Oak Mesa Support Family to meeting the challenges of making our school a safer haven for our children. The Safety Committee updates yearly the Safety Plan which included: Parking Lot Safety, Child Abuse Reporting Procedures; Emergency Preparedness Plan; Student Suspension and Expulsion Policies; Sexual Harassment Policy; Dress Code Policy; Arrival and Departure Plans; and School Discipline Rules and Expectations.
The Universal Emergency Preparedness Plan was updated to incorporate catastrophic events such as earthquakes, fires, bomb threats, chemical or biological attacks, nuclear or radiological attacks, and electromagnetic pulse attacks. A variety of monthly disaster drills took place, so that staff and students were prepared. School-Wide Emergency Drills take place monthly. District-Wide Emergency Drills take place each trimester. A portable trailer on campus houses emergency food, water, equipment, and medical supplies should there be a need. In addition, every classroom has bottled water, high energy bars, and face masks in the event of a catastrophic incident.
Suspensions and Expulsions
This table displays the rate of suspensions and expulsions (the total number of incidents divided by the total enrollment) at the school and district levels for the most recent three-year period.
Rate
School District
2007-08 2008-09 2009-10 2007-08 2008-09 2009-10
Suspensions 2.8 0.4 1.9 17.2 10.2 6.8
Expulsions 0.0 0.0 0.0 0.2 0.2 0.4
IV. School Facilities
School Facility Conditions and Planned Improvements (School Year 2010-11)
This section provides information about the condition of the school’s grounds, buildings, and restrooms, and a description of any planned or recently completed facility improvements.
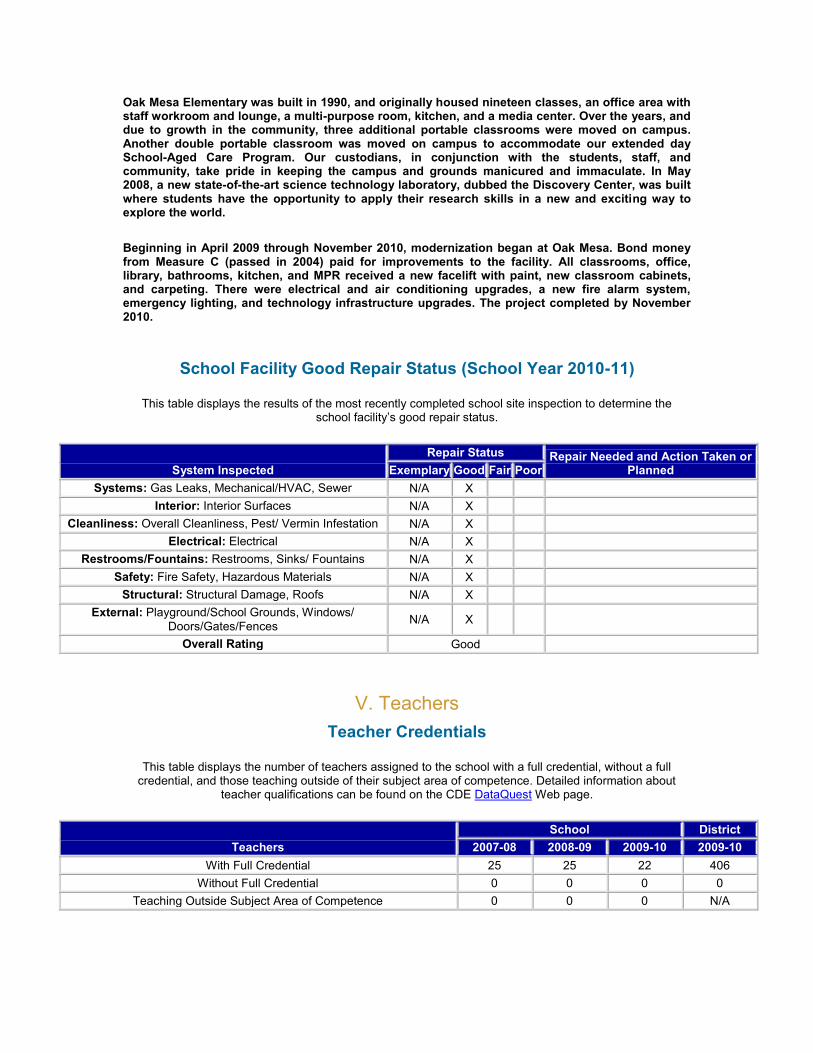
Oak Mesa Elementary was built in 1990, and originally housed nineteen classes, an office area with staff workroom and lounge, a multi-purpose room, kitchen, and a media center. Over the years, and due to growth in the community, three additional portable classrooms were moved on campus. Another double portable classroom was moved on campus to accommodate our extended day School-Aged Care Program. Our custodians, in conjunction with the students, staff, and community, take pride in keeping the campus and grounds manicured and immaculate. In May 2008, a new state-of-the-art science technology laboratory, dubbed the Discovery Center, was built where students have the opportunity to apply their research skills in a new and exciting way to explore the world.
Beginning in April 2009 through November 2010, modernization began at Oak Mesa. Bond money from Measure C (passed in 2004) paid for improvements to the facility. All classrooms, office, library, bathrooms, kitchen, and MPR received a new facelift with paint, new classroom cabinets, and carpeting. There were electrical and air conditioning upgrades, a new fire alarm system, emergency lighting, and technology infrastructure upgrades. The project completed by November 2010.
School Facility Good Repair Status (School Year 2010-11)
This table displays the results of the most recently completed school site inspection to determine the school facility’s good repair status.
System Inspected
Repair Status Repair Needed and Action Taken or Planned Exemplary Good Fair Poor
Systems: Gas Leaks, Mechanical/HVAC, Sewer N/A X
Interior: Interior Surfaces N/A X
Cleanliness: Overall Cleanliness, Pest/ Vermin Infestation N/A X
Electrical: Electrical N/A X
Restrooms/Fountains: Restrooms, Sinks/ Fountains N/A X
Safety: Fire Safety, Hazardous Materials N/A X
Structural: Structural Damage, Roofs N/A X
External: Playground/School Grounds, Windows/
Doors/Gates/Fences N/A X
Overall Rating Good
V. Teachers
Teacher Credentials
This table displays the number of teachers assigned to the school with a full credential, without a full credential, and those teaching outside of their subject area of competence. Detailed information about
teacher qualifications can be found on the CDE DataQuest Web page.
Teachers
School District
2007-08 2008-09 2009-10 2009-10
With Full Credential 25 25 22 406
Without Full Credential 0 0 0 0
Teaching Outside Subject Area of Competence 0 0 0 N/A

Teacher Misassignments and Vacant Teacher Positions
This table displays the number of teacher misassignments (teachers assigned without proper legal authorization) and the number of vacant teacher positions (not filled by a single designated teacher
assigned to teach the entire course at the beginning of the school year or semester). Note: Total Teacher Misassignments includes the number of Misassignments of Teachers of English Learners.
Indicator 2008-09 2009-10 2010-11
Misassignments of Teachers of English Learners 0 0 0
Total Teacher Misassignments 0 0 0
Vacant Teacher Positions 0 0 0
Core Academic Classes Taught by No Child Left Behind Compliant Teachers (School Year 2009-10)
This table displays the percent of classes in core academic subjects taught by No Child Left Behind (NCLB) compliant and non-NCLB compliant teachers in the school, in all schools in the district, in high-
poverty schools in the district, and in low-poverty schools in the district. High poverty schools are defined as those schools with student participation of approximately 75 percent or more in the free and reduced
price meals program. Low poverty schools are those with student participation of approximately 25 percent or less in the free and reduced price meals program. More information on teacher qualifications required
under NCLB can be found on the CDE Improving Teacher and Principal Quality Web page.
Location of Classes
Percent of Classes In Core Academic Subjects
Taught by NCLB Compliant Teachers Taught by Non-NCLB Compliant Teachers
This School 100% N/A All Schools in District 93% 7%
High-Poverty Schools in District N/A N/A Low-Poverty Schools in District 93% 7%
VI. Support Staff
Academic Counselors and Other Support Staff (School Year 2009-10)
This table displays, in units of full-time equivalents (FTE), the number of academic counselors and other support staff who are assigned to the school and the average number of students per academic counselor. One FTE equals one staff member working full time; one FTE could also represent two staff members who
each work 50 percent of full time.
Title Number of FTE Assigned
to School Average Number of Students per
Academic Counselor
Academic Counselor N/A N/A
Library Media Teacher (Librarian) 0.625 N/A
Psychologist 0.20 N/A
Social Worker N/A N/A
Nurse 0.154 N/A
Speech/Language/Hearing Specialist 0.60 N/A

Resource Specialist (non-teaching) N/A N/A
Other (Health Clerk) 0.875 N/A
VII. Curriculum and Instructional Materials
Quality, Currency, Availability of Textbooks and Instructional Materials (School Year 2010-11)
This table displays information about the quality, currency, and availability of the standards-aligned textbooks and other instructional materials used at the school, and information about the school’s use of
any supplemental curriculum or non-adopted textbooks or instructional materials.
Core Curriculum Area
Quality, Currency, and Availability of Textbooks and Instructional Materials
Percent of Pupils Who Lack Their Own Assigned Textbooks and Instructional Materials
Reading/Language Arts
Adopted 2003, Sufficient 0 %
Mathematics Adopted 2009, Sufficient 0 %
Science Adopted 2008, Sufficient 0 %
History-Social Science
Adopted 2007, Sufficient 0 %
VIII. School Finances
Expenditures Per Pupil and School Site Teacher Salaries (Fiscal Year 2008-09)
This table displays a comparison of the school’s per pupil expenditures from unrestricted (basic) sources with other schools in the district and throughout the state, and a comparison of the average teacher salary
at the school site with average teacher salaries at the district and state levels. Detailed information regarding school expenditures can be found on the CDE Current Expense of Education & Per-pupil
Spending Web page and teacher salaries can be found on the CDE Certificated Salaries & Benefits Web page.
Level Total Expenditures
Per Pupil Expenditures Per Pupil
(Supplemental / Restricted) Expenditures Per Pupil (Basic / Unrestricted)
Average Teacher Salary
School Site $4,635 $176 $4,458 $70,263
District N/A N/A $5,227 $69,479
Percent Difference – School Site and District
N/A N/A -14.70% 1.13%
State N/A N/A $5,681 $65,399
Percent Difference – School Site and State
N/A N/A -21.52% 7.44%
Types of Services Funded (Fiscal Year 2009-10)

This section provides information about the programs and supplemental services that are available at the school and funded through either categorical or other sources.
During the 2009-2010 school year, Oak Mesa received categorical funding that directly supported students. $1,831 was designated for GATE students to support an enriching curriculum such as books, computer software, fieldtrips, and other materials to enhance and deepen their educational school experience. The School and Library Improvement Block Grant in the amount of $34,446 was used to directly support student needs. This funding purchased library books, school supplies in the classroom, materials of instruction, and student technology.
Unrestricted General Fund Allocations went toward funding fieldtrips, technology, equipment repairs, and school supplies.
Teacher and Administrative Salaries (Fiscal Year 2008-09)
This table displays district salaries for teachers, principals, and superintendents, and compares these figures to the state averages for districts of the same type and size. The table also displays teacher and
administrative salaries as a percent of a district's budget, and compares these figures to the state averages for districts of the same type and size based on the salary schedule. Detailed information regarding
salaries may be found on the CDE Certificated Salaries & Benefits Web page.
Category District Amount State Average For Districts In Same Category
Beginning Teacher Salary $44,456 $41,209
Mid-Range Teacher Salary $66,815 $65,228
Highest Teacher Salary $84,213 $83,339
Average Principal Salary (Elementary) $106,262 $103,189
Average Principal Salary (Middle) $109,581 $108,789
Average Principal Salary (High) $122,864 $119,247
Superintendent Salary $234,840 $179,589
Percent of Budget for Teacher Salaries 41.40 % 40.70 %
Percent of Budget for Administrative Salaries 5.50 % 5.90 %
IX. Student Performance
Standardized Testing and Reporting Program The Standardized Testing and Reporting (STAR) Program consists of several key components, including
the California Standards Tests (CSTs); the California Modified Assessment (CMA), and the California Alternate Performance Assessment (CAPA). The CSTs show how well students are doing in relation to the
state content standards. The CSTs include English-language arts (ELA) and mathematics in grades two through eleven; science in grades five, eight, and nine through eleven; and history-social science in grades eight, and ten through eleven. The CAPA includes ELA, mathematics, and science in grades two through
eleven, and for science for grades five, eight, and ten. The CAPA is given to those students with significant cognitive disabilities whose disabilities prevent them from taking either the CSTs with accommodations or
modifications or the CMA with accommodations. The CMA includes ELA and mathematics for grades three through eight and science in grade five and is an alternate assessment that is based on modified
achievement standards. The CMA is designed to assess those students whose disabilities preclude them from achieving grade-level proficiency on an assessment of the California content standards with or without
accommodations. Student scores are reported as performance levels. Detailed information regarding the STAR Program results for each grade and performance level, including the percent of students not tested,
can be found on the CDE Standardized Testing and Reporting (STAR) Results Web site. Program information regarding the STAR Program can be found in the Explaining 2008 STAR Program Summary
Results to the Public guide. Note: Scores are not shown when the number of students tested is ten or less,

either because the number of students in this category is too small for statistical accuracy or to protect student privacy. In no case shall any group score be reported that would deliberately or inadvertently make
public the score or performance of any individual student.
Standardized Testing and Reporting Results for All Students – Three-Year Comparison
This table displays the percent of students achieving at the Proficient or Advanced level (meeting or exceeding the state standards).
Subject
School District State
2007-08 2008-09 2009-10 2007-08 2008-09 2009-10 2007-08 2008-09 2009-10
English-Language Arts 77 89 87 61 65 66 46 50 52
Mathematics 85 96 96 52 55 57 43 46 48
Science 70 92 93 67 71 74 46 50 54
History-Social Science 0 0 0 50 58 58 36 41 44
Note: Scores are not shown when the number of students tested is 10 or less because the number of students in this category is too small for statistical accuracy or privacy protection. In no case shall any
group score be reported that would deliberately or inadvertently make public the score or performance of any individual student.
Standardized Testing and Reporting Results by Student Group (School Year 2009-10)
This table displays the percent of students, by group, achieving at the Proficient or Advanced level (meeting or exceeding the state standards) for the most recent testing period.
Group
Percent of Students Scoring at Proficient or Advanced
English-Language Arts Mathematics Science History-Social Science
African American * * * N/A
American Indian or Alaska Native * * * N/A
Asian 97 10 * N/A
Filipino * * * N/A
Hispanic or Latino 84 94 90 N/A
Pacific Islander * * * N/A
White (not Hispanic) 88 98 93 N/A
Male 89 97 95 N/A
Female 85 96 91 N/A
Economically Disadvantaged 40 73 * N/A
English Learners * * * N/A
Students with Disabilities 85 96 * N/A
Students Receiving Migrant Education Services * * * N/A
Note: Scores are not shown when the number of students tested is 10 or less because the number of students in this category is too small for statistical accuracy or privacy protection. In no case shall any
group score be reported that would deliberately or inadvertently make public the score or performance of any individual student.

California Physical Fitness Test Results (School Year 2009-10)
The California Physical Fitness Test is administered to students in grades five, seven, and nine only. This table displays by grade level the percent of students meeting fitness standards for the most recent testing period. Detailed information regarding this test, and comparisons of a school’s test results to the district and state levels, may be found on the CDE Physical Fitness Testing (PFT) Web page. Note: Scores are
not shown when the number of students tested is ten or less because the number of students in this category is too small for statistical accuracy or privacy protection. In no case shall any group score be
reported that would deliberately or inadvertently make public the score or performance of any individual student.
Grade Level
Percent of Students Meeting Healthy Fitness Zones
Four of Six Standards Five of Six Standards Six of Six Standards
5 Not Available Not Available Not Available
7 * * *
9 * * *
X. Accountability
Academic Performance Index
The Academic Performance Index (API) is an annual measure of the academic performance and progress of schools in California. API scores range from 200 to 1,000, with a statewide target of 800. Detailed information about the API can be found on the CDE Academic Performance Index (API) Web page.
Academic Performance Index Ranks – Three-Year Comparison
This table displays the school’s statewide and similar schools API ranks. The statewide API rank ranges from one to ten. A statewide rank of one means that the school has an API score in the lowest ten percent
of all schools in the state, while a statewide rank of ten means that the school has an API score in the highest ten percent of all schools in the state. The similar schools API rank reflects how a school compares
to 100 statistically matched “similar schools.” A similar schools rank of one means that the school’s academic performance is comparable to the lowest performing ten schools of the 100 similar schools, while a similar schools rank of ten means that the school’s academic performance is better than at least 90 of the
100 similar schools.
API Rank 2007 2008 2009
Statewide 10 10 10
Similar Schools 7 4 10
"N/A" means a number is not applicable or not available due to missing data.
"B" means this is either an LEA or an Alternative Schools Accountability Model (ASAM) school. Schools participating in the ASAM do not currently receive growth, target information, or statewide or similar schools rankings on this report in recognition of their markedly different educational missions and populations served. ASAM schools are covered under the Alternative Accountability system as required by Education Code Section 52052 and not the API accountability system. However, API information is needed to comply with the federal No Child Left Behind (NCLB) law. Growth, target and rank information are not applicable to LEAs.
"C" means this is a special education school. Statewide and similar schools ranks are not applicable to special education schools.
" * " means this API is calculated for a small school or a small LEA, defined as having between 11 and 99 valid STAR Program test scores included in the API. APIs based on small numbers of students are less reliable and therefore should be carefully interpreted. Similar schools ranks are not calculated for small schools.

Academic Performance Index Growth by Student Group – Three-Year Comparison
This table displays, by student group, the actual API changes in points added or lost for the past three years, and the most recent API score. Note: "N/A" means that the student group is not numerically
significant.
Group
Actual API Change Growth API Score
2007-08 2008-09 2009-10 2010
All Students at the School -2 56 1 958
African American * * * *
American Indian or Alaska Native * * * *
Asian * * * *
Filipino * * * *
Hispanic or Latino -1 73 0 941
Pacific Islander * * * *
White (not Hispanic) -1 55 -3 967
Socioeconomically Disadvantaged * * * *
English Learners * * * *
Students with Disabilities * * * *
"N/A" means a number is not applicable or not available due to missing data.
"*" means this API is calculated for a small school, defined as having between 11 and 99 valid Standardized Testing and Reporting (STAR) Program test scores included in the API. The API is asterisked if the school was small either in 2008 or 2009. APIs based on small numbers of students are less reliable and therefore should be carefully interpreted.
Adequate Yearly Progress
The federal NCLB Act requires that all schools and districts meet the following Adequate Yearly Progress (AYP) criteria:
Participation rate on the state’s standards-based assessments in ELA and mathematics Percent proficient on the state’s standards-based assessments in ELA and mathematics
API as an additional indicator Graduation rate (for secondary schools)
Detailed information about AYP, including participation rates and percent proficient results by student group, can be found on the CDE Adequate Yearly Progress (AYP) Web page.
Adequate Yearly Progress Overall and by Criteria (School Year 2009-10)
This table displays an indication of whether the school and the district made AYP overall and whether the school and the district met each of the AYP criteria.
AYP Criteria School District
Overall Yes No
Participation Rate - English-Language Arts Yes Yes
Participation Rate - Mathematics Yes Yes

Percent Proficient - English-Language Arts Yes No
Percent Proficient - Mathematics Yes No
API Yes Yes
Graduation Rate N/A Yes
"Yes" Met 2010 AYP Criteria
"No" Did not Meet 2010 AYP Criteria
Federal Intervention Program (School Year 2010-11)
Schools and districts receiving federal Title I funding enter Program Improvement (PI) if they do not make AYP for two consecutive years in the same content area (ELA or mathematics) or on the same indicator (API or graduation rate). After entering PI, schools and districts advance to the next level of intervention with each additional year that they do not make AYP. Detailed information about PI identification can be
found on the CDE Adequate Yearly Progress (AYP) Web page.
Indicator School District
Program Improvement Status Not In PI Not In PI
First Year of Program Improvement
Year in Program Improvement
Number of Schools Currently in Program Improvement N/A N/A
Percent of Schools Currently in Program Improvement N/A N/A
XI. School Completion and Postsecondary Preparation
Admission Requirements for California Public Universities
University of California
Admission requirements for the University of California (UC) follow guidelines set forth in the Master Plan, which requires that the top one-eighth of the state's high school graduates, as well as those transfer
students who have successfully completed specified college work, be eligible for admission to the UC. These requirements are designed to ensure that all eligible students are adequately prepared for University-level work. For general admissions requirements please visit the General Admissions
Information Web page (Outside Source).
California State University
Admission requirements for the California State University (CSU) use three factors to determine eligibility. They are specific high school courses; grades in specified courses and test scores; and graduation from
high school. Some campuses have higher standards for particular majors or students who live outside the local campus area. Because of the number of students who apply, a few campuses have higher standards (supplementary admission criteria) for all applicants. Most CSU campuses utilize local admission guarantee policies for students who graduate or transfer from high schools and colleges that are historically served by
a CSU campus in that region. For general admissions requirements please visit the Undergraduate Admission & Requirements Web page (Outside Source).
Dropout Rate and Graduation Rate

This table displays the school’s one-year dropout and graduation rates for the most recent three-year period for which data are available. For comparison purposes, data are also provided at the district and state levels. Detailed information about dropout rates and graduation rates can be found on the CDE
DataQuest Web page.
Indicator
School District State
2006-07 2007-08 2008-09 2006-07 2007-08 2008-09 2006-07 2007-08 2008-09
Dropout Rate (1-year) N/A N/A N/A 1.2 1.8 1.5 4.4 3.9 5.7
Graduation Rate N/A N/A N/A 96.2 96.3 94.5 80.6 80.2 78.6
XII. Instructional Planning and Scheduling
Professional Development
This section provides information on the annual number of school days dedicated to staff development for the most recent three-year period.
Program improvement is dependent upon meaningful staff and parent input and effective staff development programs. The curriculum is an outgrowth of the State Frameworks, Content Standards, and Guides. Minimum days, weekly compact days, and pupil-free days provide opportunities for site in-services, planning, parent conferencing, and curriculum improvement. The staff at Oak Mesa had direct input regarding staff development for each school year. Our staff development broadened viewpoints on technology, our school improvement plan, math, science, and language arts. Since our goal is for all teachers to adhere to the Practices for Developing as a Professional Educator, teachers have attended workshops that included science instruction, GATE, mathematics, technology, language arts, research-based strategies, and class management. They also met in grade level teams weekly where they shared curriculum concerns, analysis of data, instructional strategies, best practices, and plan for next steps. Students have benefited from teachers’ participation in such varied staff development activities.
XIII. National Assessment of Educational Progress
National Assessment of Educational Progress
The National Assessment of Educational Progress (NAEP) is a nationally representative assessment of what America's students know and can do in various subject areas. Assessments are conducted
periodically in mathematics, reading, science, writing, the arts, civics, economics, geography, and U.S. history. Student scores for reading and mathematics are reported as performance levels (i.e., basic,
proficient, and advanced) and the participation of students with disabilities and English language learners is reported based on three levels (identified, excluded, and assessed). Detailed information regarding the
NAEP results for each grade, performance level, and participation rate can be found on the National Assessment of Educational Progress Web page (Outside Source).
Note: Only a sample group of California's schools and districts participate in the NAEP testing cycle. Therefore, students in any particular school or district may not be included in these results. The NAEP reflects state test results and is not reflective of either the LEA or the individual school. Comparisons of
student performance on the NAEP and student performance on the Standardized Testing and Reporting (STAR) Program assessments cannot be made without an understanding of the key differences between the two assessment programs. For example, the NAEP only assesses grades four, eight and twelve and for long-term trends assesses grades nine, thirteen, and seventeen. Additionally, the NAEP only provides
state test results for grades four and eight. The California Standards Tests (CSTs) are based on a different set of standards than the NAEP assessments. For example, the NAEP is not aligned with California
academic content and achievement standards and, therefore, does not necessarily reflect the curriculum and instruction to which students are exposed in the classroom. The NAEP assesses reading and writing separately, while the CSTs assess English-language arts (ELA), encompassing reading as well as writing
conventions, spelling, and grammar. Scores on the CSTs and other assessments are not directly comparable to those on NAEP. The averages and percentages presented are estimates based on samples of students rather than on entire populations. Finally, the questions students respond to are only a sample
of the knowledge and skills covered by the NAEP frameworks. Information on the differences between NAEP and CST can be found on the CDE National Assessment of Educational Progress (NAEP) Web
page.
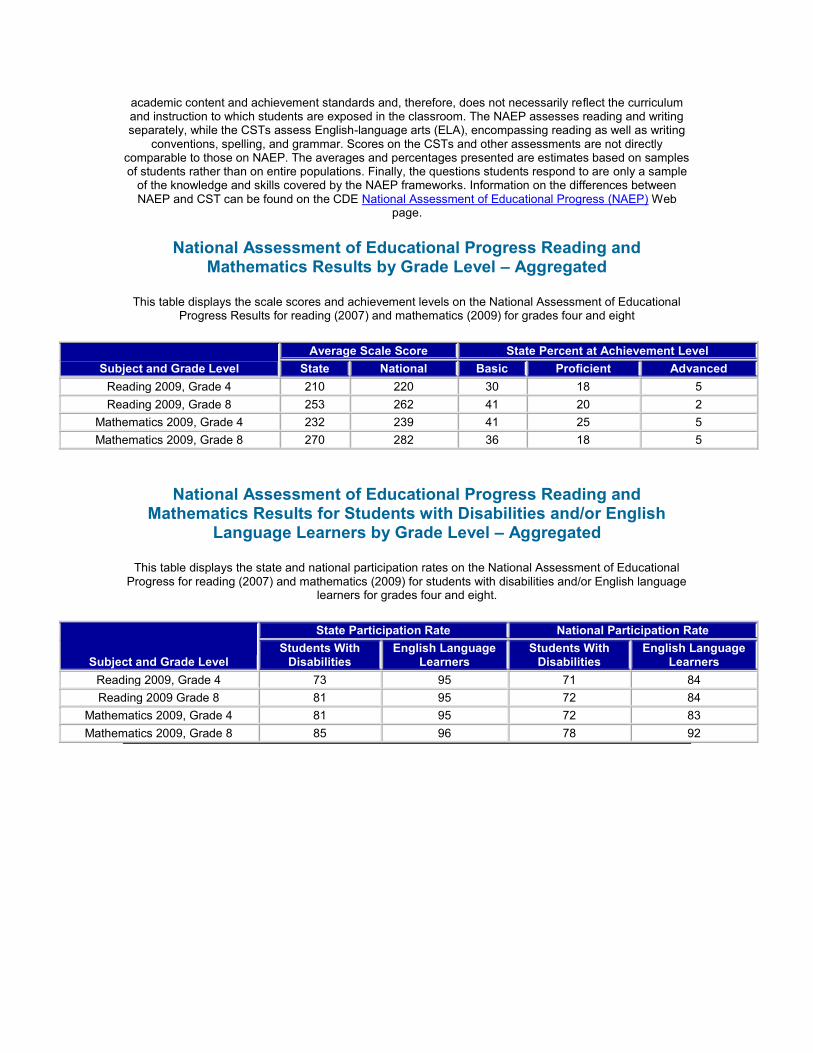
National Assessment of Educational Progress Reading and Mathematics Results by Grade Level – Aggregated
This table displays the scale scores and achievement levels on the National Assessment of Educational Progress Results for reading (2007) and mathematics (2009) for grades four and eight
Subject and Grade Level
Average Scale Score State Percent at Achievement Level
State National Basic Proficient Advanced
Reading 2009, Grade 4 210 220 30 18 5
Reading 2009, Grade 8 253 262 41 20 2
Mathematics 2009, Grade 4 232 239 41 25 5
Mathematics 2009, Grade 8 270 282 36 18 5
National Assessment of Educational Progress Reading and Mathematics Results for Students with Disabilities and/or English
Language Learners by Grade Level – Aggregated
This table displays the state and national participation rates on the National Assessment of Educational Progress for reading (2007) and mathematics (2009) for students with disabilities and/or English language
learners for grades four and eight.
Subject and Grade Level
State Participation Rate National Participation Rate
Students With Disabilities
English Language Learners
Students With Disabilities
English Language Learners
Reading 2009, Grade 4 73 95 71 84
Reading 2009 Grade 8 81 95 72 84
Mathematics 2009, Grade 4 81 95 72 83
Mathematics 2009, Grade 8 85 96 78 92