chool accountability report card - san diego unified ... · ... responsibility, problem solving,...
TRANSCRIPT

School Accountabi l i ty Report Card Issued Spring 2016 for Academic Year 2014–15
San Diego Unified School District • Cindy Marten, Superintendent • 4100 Normal Street, San Diego, CA 92103 • www.sandiegounified.org
What Is a SARC?
All California public schools are re-quired by state law to publish a School Accountability Report Card (SARC) by February 1 of each year. The SARC contains specific information about the condition and performance of the school from the previous school year.
Furthermore, under the Local Con-trol Funding Formula (LCFF), San Die-go Unified is required to prepare a Lo-cal Control Accountability Plan (LCAP), which describes how it intends to meet annual school-specific goals for all students, with specific activities to ad-dress state and local priorities. Data reported in the SARC are to be con-sistent with data reported in the LCAP.
More information about the re-quirements for the SARC is available on the state’s SARC website:
www.cde.ca.gov/ta/ac/sa/
Additional copies of this SARC may be obtained from the school office or from the district’s SARC website:
www.sandiegounified.org/sarc
For more information about the LCFF or LCAP, see the state’s LCFF website:
www.cde.ca.gov/fg/aa/lc/
Finally, for more information about this school, contact the principal or the district office.
Contents Data and Access ................................... 2About This School ................................. 2Conditions of Learning ........................... 2Student Outcomes ................................ 5Engagement ......................................... 9Other Information ............................... 11
Adequate Yearly Progress ................. 11 Federal Intervention Program ............ 11 Average Class Size and Class Size Distribution .................................... 11 Academic Counselors and Other Support Staff Members ..................... 12 Expenditures per Pupil and School- Site Teacher Salaries ........................ 12 Types of Services Funded .................. 12 Teacher and Administrative Salaries ... 13 Advanced Placement Courses ............ 13Professional Development ................. 13
Appendix: Adopted Texts and Instructional Materials ......................... 14
Garfield High School 1255 16th St, San Diego, CA 92101-4759
Phone: (619) 362-4500 E-mail: [email protected]
Web: www.sandiegounified.org/schools/garfield-high CDS Code: 37-68338-3737962
Jolie Pickett, Principal School Description and Mission Statement Garfield High School was the first continuation/alternative high school in the United States, opening in 1929. Garfield is now located on the campus of San Diego City College and provides a student-centered alternative education to students who experi-ence, or have experienced, circumstances disruptive to their ed-ucational progress. The student population participates in pro-grams including, but not limited to, the Joint Diploma Program, Giving Everyone a New Educational Start in School (GEN-ESIS) program, Operation Restart: A Contracted Learning Ex-perience (ORACLE), the Expectant Teen Classroom (ETC), infant lab, career technical education courses, and San Diego City College coursework. In addition, there is a High School Diploma Program (HSDP) located on the corner of the Garfield campus.
Students aged 16 years and older qualify to be referred to Garfield due to a variety of academic, social, and personal fac-tors. Students are accepted for enrollment if an appropriate pro-gram will meet their needs and on a space-available basis. In-coming students are oriented through the GENESIS program, a two-week course emphasizing school attendance and skill de-velopment in the areas of goal setting, responsibility, problem solving, and conflict resolution.
Garfield (361) 2 Spring 2016 School Accountability Report Card
Data and Access
Most of the data in this SARC are from the 2014–15 school year or the two preceding years (2012–13 and 2013–14). Gradua-tion, dropout, and fiscal data are from 2013–14. Contact information and data on facilities, curriculum and instructional mate-rials, and certain teacher information are from the 2015–16 school year. When no year is specified, data are from the most recent year available.
Data included in this SARC are consistent with State Board of Education guidelines, available at the California Depart-ment of Education website: www.cde.ca.gov/ta/ac/sa/. DataQuest DataQuest is an on-line data tool (dq.cde.ca.gov/dataquest/) that contains additional information about this school and com-parisons of the school to the district, the county, and the state. DataQuest is a dynamic system that provides reports for ac-countability, test results, enrollment, graduates, dropouts, course enrollments, staffing, and data regarding English learners. Internet Access Internet access is available at public libraries and other locations that are publicly accessible (e.g., the California State Li-brary). Access to the Internet at libraries and public locations is generally provided on a first-come, first-served basis. Other use restrictions include the hours of operation, the length of time that a workstation may be used (depending on availability), the types of software programs available on a workstation, and the ability to print documents.
About This School
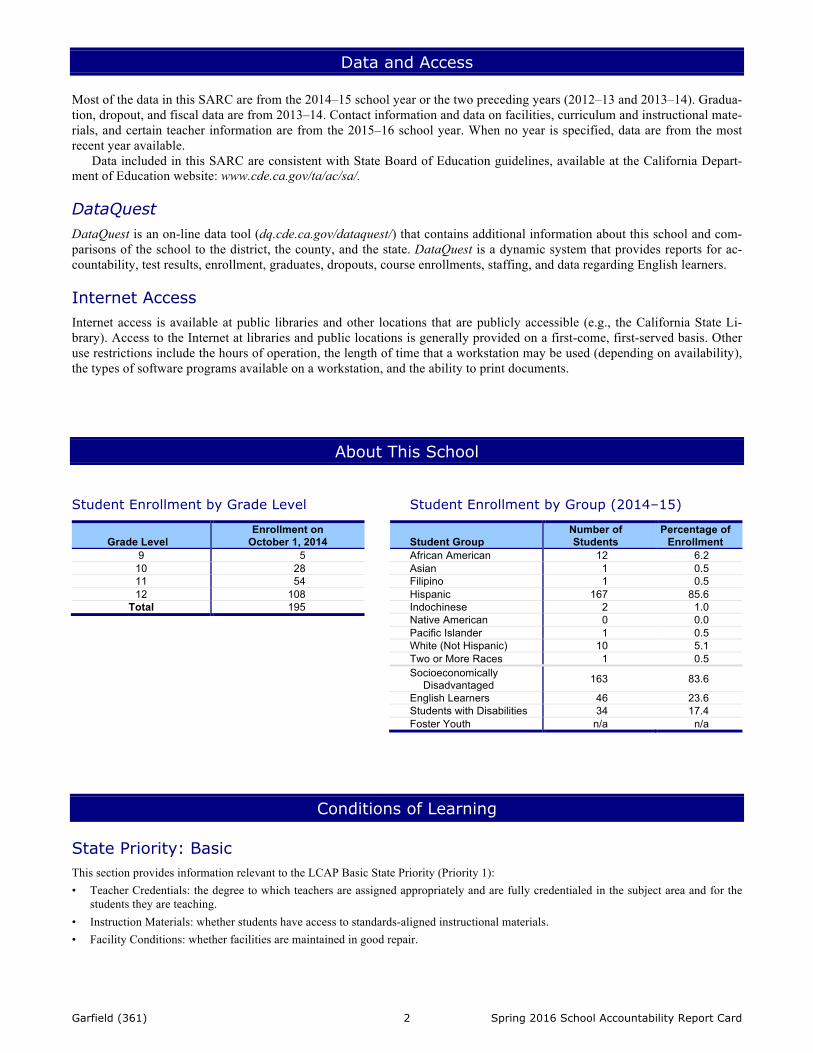
Student Enrollment by Grade Level
Grade Level Enrollment on
October 1, 2014 9 5
10 28 11 54 12 108
Total 195
Student Enrollment by Group (2014–15)
Student Group Number of Students
Percentage of Enrollment
African American 12 6.2 Asian 1 0.5 Filipino 1 0.5 Hispanic 167 85.6 Indochinese 2 1.0 Native American 0 0.0 Pacific Islander 1 0.5 White (Not Hispanic) 10 5.1 Two or More Races 1 0.5 Socioeconomically
Disadvantaged 163 83.6
English Learners 46 23.6 Students with Disabilities 34 17.4 Foster Youth n/a n/a
Conditions of Learning
State Priority: Basic This section provides information relevant to the LCAP Basic State Priority (Priority 1): • Teacher Credentials: the degree to which teachers are assigned appropriately and are fully credentialed in the subject area and for the
students they are teaching. • Instruction Materials: whether students have access to standards-aligned instructional materials. • Facility Conditions: whether facilities are maintained in good repair.

Garfield (361) 3 Spring 2016 School Accountability Report Card
Teacher Credentials
This table displays the number of teachers assigned to the school who are fully credentialed, who are working without a full credential, and who are credentialed but teaching outside of their subject area of competence. District totals do not include charter schools. Detailed infor-mation about teachers’ qualifications can be found on the CDE DataQuest website at dq.cde.ca.gov/dataquest/.
Number of Teachers* School District 2013–14 2014–15 2015–16 2015–16
With full credential and teaching in subject area 25 27 26 4,609 With full credential but teaching outside area of competence 0 0 0 243 Without full credential 0 0 0 0 Total 25 27 26 4,852
*Some of these data were not available at the time of publication. For more up-to-date information, contact the San Diego Unified School District’s Human Resources Department.
Teacher Misassignments and Vacant Teacher Positions This table displays the number of teacher misassignments (i.e., teachers who lack legal authorization to teach that grade level, subject area, student group, etc.) and the number of vacant teacher positions (long-term vacancies for which there was no teacher assigned by the twenti-eth day of the school year or semester). Total teacher misassignments includes the number of misassignments of teachers of English learn-ers. For 2015–16, the most current data are reported.
Indicator* 2013–14 2014–15 2015–16 Misassignments of teachers of English learners 0 0 0 Total teacher misassignments 0 0 0 Vacant teacher positions 0 0 1
*Some of these data were not available at the time of publication. For more up-to-date information, contact the San Diego Unified School District’s Human Resources Department.
Core Academic Courses Taught by Teachers in Compliance with the No Child Left Behind Act (2014–15)
The federal Elementary and Secondary Education Act (ESEA), also known as the No Child Left Behind Act (NCLB), requires all teachers of core academic subjects to be “highly qualified.” In general, ESEA requires that each teacher must have: (1) a bachelor’s degree, (2) a state credential (or an Intern Certificate/Credential for no more than three years), and (3) demonstrated subject-matter competence for each core subject he or she will teach.
This table displays the percentage of classes in core academic subjects taught by teachers who are compliant with ESEA at this school, at all schools in the district, in high-poverty schools in the district, and in low-poverty schools in the district. (High-poverty schools are defined as those with student eligibility rates of approximately 40 percent or higher in the free and reduced-price meals program. Low-poverty schools are defined as those with student eligibility rates of 39 percent or lower in the program.) These data do not include inde-pendently reporting charter schools. More information on teacher qualifications required under ESEA can be found at the CDE website at www.cde.ca.gov/nclb/sr/tq/.
Location of Classes
Percentage of Classes in Core Academic Subjects Taught by Highly
Qualified Teachers Not Taught by Highly
Qualified Teachers This school 98.91 1.09 All schools in district 97.69 2.31 High-poverty schools in district 97.66 2.34 Low-poverty schools in district 97.81 2.19
Garfield (361) 4 Spring 2016 School Accountability Report Card
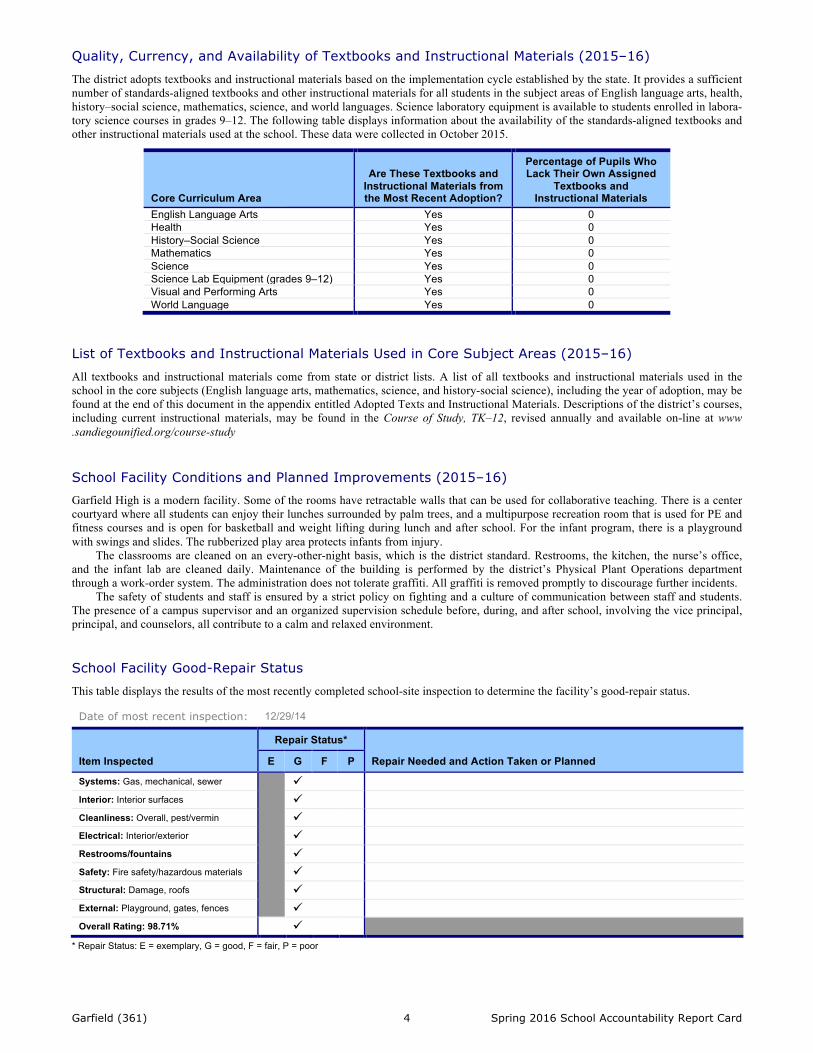
Quality, Currency, and Availability of Textbooks and Instructional Materials (2015–16)
The district adopts textbooks and instructional materials based on the implementation cycle established by the state. It provides a sufficient number of standards-aligned textbooks and other instructional materials for all students in the subject areas of English language arts, health, history–social science, mathematics, science, and world languages. Science laboratory equipment is available to students enrolled in labora-tory science courses in grades 9–12. The following table displays information about the availability of the standards-aligned textbooks and other instructional materials used at the school. These data were collected in October 2015.
Core Curriculum Area
Are These Textbooks and Instructional Materials from the Most Recent Adoption?
Percentage of Pupils Who Lack Their Own Assigned
Textbooks and Instructional Materials
English Language Arts Yes 0 Health Yes 0 History–Social Science Yes 0 Mathematics Yes 0 Science Yes 0 Science Lab Equipment (grades 9–12) Yes 0 Visual and Performing Arts Yes 0 World Language Yes 0
List of Textbooks and Instructional Materials Used in Core Subject Areas (2015–16)
All textbooks and instructional materials come from state or district lists. A list of all textbooks and instructional materials used in the school in the core subjects (English language arts, mathematics, science, and history-social science), including the year of adoption, may be found at the end of this document in the appendix entitled Adopted Texts and Instructional Materials. Descriptions of the district’s courses, including current instructional materials, may be found in the Course of Study, TK–12, revised annually and available on-line at www .sandiegounified.org/course-study School Facility Conditions and Planned Improvements (2015–16) Garfield High is a modern facility. Some of the rooms have retractable walls that can be used for collaborative teaching. There is a center courtyard where all students can enjoy their lunches surrounded by palm trees, and a multipurpose recreation room that is used for PE and fitness courses and is open for basketball and weight lifting during lunch and after school. For the infant program, there is a playground with swings and slides. The rubberized play area protects infants from injury.
The classrooms are cleaned on an every-other-night basis, which is the district standard. Restrooms, the kitchen, the nurse’s office, and the infant lab are cleaned daily. Maintenance of the building is performed by the district’s Physical Plant Operations department through a work-order system. The administration does not tolerate graffiti. All graffiti is removed promptly to discourage further incidents.
The safety of students and staff is ensured by a strict policy on fighting and a culture of communication between staff and students. The presence of a campus supervisor and an organized supervision schedule before, during, and after school, involving the vice principal, principal, and counselors, all contribute to a calm and relaxed environment. School Facility Good-Repair Status
This table displays the results of the most recently completed school-site inspection to determine the facility’s good-repair status.
Date of most recent inspection: 12/29/14
Item Inspected
Repair Status*
Repair Needed and Action Taken or Planned E G F P
Systems: Gas, mechanical, sewer
ü Interior: Interior surfaces ü Cleanliness: Overall, pest/vermin ü Electrical: Interior/exterior ü Restrooms/fountains ü Safety: Fire safety/hazardous materials ü Structural: Damage, roofs ü External: Playground, gates, fences ü Overall Rating: 98.71% ü
* Repair Status: E = exemplary, G = good, F = fair, P = poor

Garfield (361) 5 Spring 2016 School Accountability Report Card
Student Outcomes
State Priority: Pupil Achievement This section provides information relevant to the Pupil Achievement State Priority (Priority 4): • Statewide Assessments: results of the California Assessment of Student Performance and Progress (CAASPP) and the Science Califor-
nia Standards Tests. • Preparation for College or Career: successful completion of courses that satisfy requirements for entrance to the University of Califor-
nia or the California State University, or career technical education sequences or programs of study. Statewide Assessments CAASPP Assessment Results
The California Assessment of Student Performance and Progress (CAASPP) tests students in English language arts/literacy and mathemat-ics in grades 3 through 8 and grade 11. The CAASPP was piloted in 2013–14 and first administered statewide in 2014–15. CAASPP scores are ranked according to four “performance levels”: Level 1 indicates that the student has not met the standard tested; Level 2 indicates that the student has nearly met the standard; Level 3 indicates that the student has met the standard; Level 4 indicates that the student has ex-ceeded the standard. Students scoring at Levels 3 and 4 have met state standards in that content area.
Note: In the tables that follow the number of students tested includes students who did not receive a score; however, achievement-level percentages have been calculated using only those students who did receive scores. CAASPP: All Students, 2014–15
The following table shows the percentage of all students tested whose CAASPP scores indicate that they met or exceeded the state stand-ards for English language arts and mathematics.
Subject Area Percentage of Students Meeting or Exceeding State Standards
School District State English Language Arts/Literacy (Grades 3–8, 11) 11 50 44 Mathematics (Grades 3–8, 11) 0 41 33
Note: A dash (—) indicates the number of students tested is 10 or less; percentages are not calculated either because the result is too small for statistical ac-curacy or to protect student privacy. An “n/a” indicates no data are available.
The following tables show the 2014–15 CAASPP results of students in each grade tested, disaggregated by student group, for both English language arts/literacy (ELA) and mathematics.
CAASPP: 2014–15, ELA, Grade 11
Student Group Total
Enrollment Number Tested
Percentage Tested
Percentage Achieving Level 1*
Percentage Achieving Level 2*
Percentage Achieving Level 3*
Percentage Achieving Level 4*
All students at this school 101 70 69.3 50 23 10 1Male n/a 39 38.6 46 26 5 3Female n/a 31 30.7 55 19 16 0African American n/a 3 3 — — — —Asian n/a 1 1 — — — —Filipino n/a n/a n/a n/a n/a n/a n/aHispanic n/a 61 60.4 52 26 7 0Native American n/a n/a n/a n/a n/a n/a n/aPacific Islander n/a 1 1 — — — —White (not Hispanic) n/a 4 4 — — — —Two or More Races n/a n/a n/a n/a n/a n/a n/aSocioeconomically Disadvantaged n/a 46 45.5 52 24 9 0English Learners n/a 24 23.8 50 25 0 0Students with Disabilities n/a 2 2 — — — —Receiving Migrant Ed. Services n/a n/a n/a n/a n/a n/a n/aFoster Youth n/a — — — — — —
* Level 1 = standard not met; Level 2 = standard nearly met; Level 3 = standard met; Level 4 = standard exceeded. Note: A dash (—) indicates the number of students tested is 10 or less; percentages are not calculated either because the result is too small for statistical accu-racy or to protect student privacy. An “n/a” indicates no data are available.

Garfield (361) 6 Spring 2016 School Accountability Report Card
CAASPP: 2014–15, Mathematics, Grade 11
Student Group Total
Enrollment Number Tested
Percentage Tested
Percentage Achieving Level 1*
Percentage Achieving Level 2*
Percentage Achieving Level 3*
Percentage Achieving Level 4*
All students at this school 101 71 70.3 66 10 0 0Male n/a 39 38.6 69 8 0 0Female n/a 32 31.7 63 13 0 0African American n/a 3 3 — — — —Asian n/a 1 1 — — — —Filipino n/a n/a n/a n/a n/a n/a n/aHispanic n/a 62 61.4 69 10 0 0Native American n/a n/a n/a n/a n/a n/a n/aPacific Islander n/a 1 1 — — — —White (not Hispanic) n/a 4 4 — — — —Two or More Races n/a n/a n/a n/a n/a n/a n/aSocioeconomically Disadvantaged n/a 47 46.5 62 11 0 0English Learners n/a 24 23.8 71 4 0 0Students with Disabilities n/a 3 3 — — — —Receiving Migrant Ed. Services n/a n/a n/a n/a n/a n/a n/aFoster Youth n/a — — — — — —
* Level 1 = standard not met; Level 2 = standard nearly met; Level 3 = standard met; Level 4 = standard exceeded. Note: A dash (—) indicates the number of students tested is 10 or less; percentages are not calculated either because the result is too small for statistical accu-racy or to protect student privacy. An “n/a” indicates no data are available.
California Standards Test: Science—Three-Year Comparison
The following table shows the percentage of all students scoring at the Proficient or Advanced levels (that is, meeting or exceeding the state standards) in science over the most recent three-year period. Science assessments include California Standards Tests (CST), California Modified Assessment (CMA), and the California Alternate Performance Assessment (CAPA).
Grades School District State
2012–13 2013–14 2014–15 2012–13 2013–14 2014–15 2012–13 2013–14 2014–15 5, 8, & 10 7 16 n/a 65 68 65 59 60 56
Note: A dash (—) indicates the number of students tested is 10 or less; percentages are not calculated either because the result is too small for statistical ac-curacy or to protect student privacy. An “n/a” indicates no data are available.
CAASPP: Science—By Student Group, 2014–15
Science assessments include California Standards Tests (CSTs), California Modified Assessment (CMA), and the California Alternate Performance Assessment (CAPA) in grades 5, 8 and 10.
Student Group
Percentage of Students Scoring at Proficient or
Advanced All students in district 65All students at this school —Male —Female —African American —Asian n/aFilipino n/aHispanic —Native American n/aPacific Islander n/aWhite (not Hispanic) n/aTwo or More Races —Socioeconomically Disadvantaged —English Learners —Students with Disabilities —Receiving Migrant Education Services n/aFoster Youth —
Note: A dash (—) indicates the number of students tested is 10 or less; percent-ages are not calculated either because the result is too small for statistical accu-racy or to protect student privacy. An “n/a” indicates no data are available.

Garfield (361) 7 Spring 2016 School Accountability Report Card
Career Technical Education Programs (2014–15)
Career Technical Education (CTE) in the San Diego Unified School District is a program of study involving a sequence of courses that integrates core academic knowledge with technical skills. The program provides students with multiple pathways to college and careers. Students complete a career pathway, which includes: (a) two or more CTE courses in a single, defined field of study, (b) passing of the pre- and co-requisites CTE and core curriculum courses, and (c) passing of at least one CTE advanced-level course. The career pathways are organized within the context of the state-defined 15 different industry sectors, which have been identified as critical for the fiscal stability and prosperity of the State of California. Student internships are a required component of the advanced-level CTE course curriculum. CTE programs of study often fulfill the “a–g” subject-area requirements of the University of California and the California State University and may lead to community college credit, an industry-recognized credential, a certificate, or a degree at the postsecondary level. Career Technical Education Participation (2014–15)
Data reported in the following table are intended to measure the performance of the school’s career technical education (CTE) programs. “Number of pupils” is the total number of students in all grades at the school who took at least one CTE course during the most recent-
ly completed school year. “Pupils earning a high school diploma who also completed a CTE program” is the number of students who earned a high school di-
ploma during the most recently completed school year and who completed a CTE program at some time during their high school career, divided by the total number of students who earned a high school diploma during the most recently completed school year.
“CTE courses sequenced between the school and postsecondary institutions” is the number of CTE courses the school offers that are sequence or linked (through formal articulation agreements) to courses or programs offered by colleges, universities, or other institutions of postsecondary education, divided by the total number of all CTE courses offered by the school. Such articulation provides high school stu-dents the opportunity to transfer smoothly into postsecondary education and training programs without experiencing delay or duplication of learning.
Measure of CTE Program Participation Participation Students participating in CTE (number) n/a Students earning a high school diploma who also completed a CTE program (%) n/a CTE courses sequenced between the school and postsecondary institutions (%) n/a
Courses for University of California and/or California State University Admission
University of California
Admission requirements for the University of California (UC) follow guidelines set forth in the Master Plan, which requires that the top one-eighth of the state’s high school graduates, as well as those transfer students who have successfully completed specified college work, be eligible for admission to the UC. These requirements are designed to ensure that all eligible students are adequately prepared for univer-sity-level work. For general admissions requirements, please visit the University of California website at admission.universityofcalifornia .edu/ California State University
Admission requirements for the California State University (CSU) include three factors to determine eligibility: specific high school cours-es; grades in specified courses and test scores; and graduation from high school. Some campuses have higher standards for particular ma-jors or students who live outside the local campus area. Because of the number of students who apply, a few campuses have higher stand-ards (supplementary admission criteria) for all applicants. Most CSU campuses utilize local admission guarantee policies for students who graduate or transfer from high schools and colleges that are historically served by a CSU campus in that region. For general admissions requirements please visit the California State University website at www.calstate.edu/admission/admission.shtml. This table displays, for the most recent year for which data are available, two measures related to the school’s courses that are required for UC and/or CSU admission. Detailed information about student enrollment in and completion of courses required for UC/CSU admission can be found at the CDE website at dq.cde.ca.gov/dataquest/.
Measure Percentage 2014–15 students enrolled in courses required for UC/CSU admission 98.0 2013–14 graduates who completed all courses required for UC/CSU admission 11.0
State Priority: Other Pupil Outcomes This section provides information relevant to the Other Pupil Outcomes Sate Priority (Priority 8): student outcomes in English, mathemat-ics, and physical education. The results of the California High School Exit Examination (CAHSEE) provide the outcomes in English and mathematics. The results of the California Physical Fitness Test provide the outcomes in physical fitness.

Garfield (361) 8 Spring 2016 School Accountability Report Card
California High School Exit Examination
The California High School Exit Examination (CAHSEE) is primarily used as a graduation requirement. However, the grade 10 results of this exam are also used to establish the percentages of students at three proficiency levels (not proficient, proficient, or advanced) in Eng-lish–language arts and mathematics in order to compute Adequate Yearly Progress (AYP) designations as required by the federal Elemen-tary and Secondary Education Act (ESEA), also known as the No Child Left Behind Act (NCLB). Detailed information regarding CAHSEE results can be found at the CAHSEE website at cahsee.cde.ca.gov/. Note: No group score is reported that would deliberately or inadvertently make public the score or performance of any individual student. Scores are not shown when the number of students tested in a particular student group is 10 or fewer, either because the number of students is too small for statistical accuracy or to protect students’ privacy. Such cases are indicated by an asterisk (*). CAHSEE Results for All Grade 10 Students by Performance Level: Three-Year Comparison
This table displays the percentage of grade 10 students achieving the Proficient or Advanced level in English–language arts and mathemat-ics. Data on students receiving migrant education services are not available.
Subject School District State
2012–13 2013–14 2014–15 2012–13 2013–14 2014–15 2012–13 2013–14 2014–15 English Language Arts 13.0 33.0 — 60 56 58 57 56 58 Mathematics 31.0 15.0 — 63 62 61 60 62 59
Note: A dash (—) indicates the number of students tested is 10 or less; percentages are not calculated either because the result is too small for statistical accura-cy or to protect student privacy. An “n/a” indicates no data are available. 2014–15 CAHSEE Results by Grade 10 Student Group
This table displays the percentage of grade 10 students, by student group, who achieved each performance level in English language arts and mathematics for the most recent (2014–15) CAHSEE testing period. Data on students receiving migrant education services are not available.
Group English–Language Arts Mathematics
Not Proficient Proficient Advanced Not Proficient Proficient Advanced All Students 0.0 — 0.0 0.0 0.0 n/a African American — — — — — — Asian — — — — — — Filipino — — — — — — Hispanic — — — — — — Native American — — — — — — Pacific Islander — — — — — — White (not Hispanic) — — — — — — Two or More Races — — — — — — Male — — — — — — Female — — — — — — Socioeconomically
Disadvantaged — — — — — —
English Learners — — — — — — Students with Disabilities — — — — — — Receiving Migrant
Education Services — — — — — —
Foster Youth — — — — — — District Totals 38 26 36 36 38 26
Note: A dash (—) indicates the number of students tested is 10 or less; percentages are not calculated either because the result is too small for statistical accu-racy or to protect student privacy. An “n/a” indicates no data are available.
California Physical Fitness Test Results (2014–15)
The California Physical Fitness Test is administered to students in grades 5, 7, and 9 only. This table displays by grade level the percentage of students tested who met the fitness standards for the most recent testing period. Data on students receiving migrant education services are not available. Detailed information regarding this test, and comparisons of a school’s test results to the district and state levels, may be found at the CDE website at www.cde.ca.gov/ta/tg/pf/.
Grade Level
Percentage of Students Tested Who Met Fitness Standards Four of Six Standards Five of Six Standards Six of Six Standards
9 — — — Note: A dash (—) indicates the number of students tested is 10 or less; percentages are not calculated either because the re-sult is too small for statistical accuracy or to protect student privacy. An “n/a” indicates no data are available.

Garfield (361) 9 Spring 2016 School Accountability Report Card
Engagement
State Priority: Parental Involvement This section provides information relevant to the Parental Involvement State Priority (Priority 3): efforts the school district makes to seek parent input in making decisions for the school district and each school. Opportunities for Parent Involvement
Parents and other relatives are encouraged and welcomed to become involved in the formal education of their children. Educational re-search validates that support at home is critical to a child’s academic success. There are many opportunities to be involved at their chil-dren’s school site, including: governance committees, special events, fundraising events, parent organizations, and in classrooms, and at the district level by participating in cluster councils, district advisory councils/committees, Parent University, and special events. Parents are encouraged to support their children at home by making their expectations about school clear and creating a positive learning environment at home.
We are committed to communicating with and engaging parents as partners in their children’s education. The district’s Parent Out-reach and Engagement Department serves as a national model in providing opportunities and effective methods for parents, guardians, and family members to participate in the educational process. We are also committed to obtaining community resources for our school and invite all members of our community to assist us in the education of our students. Parents have many opportunities to be involved at their children’s school site (for example, governance committees, special events, fundraising events, parent organizations, and in classrooms) and at the district level (for example, district councils/committees, Parent University, and special events). We encourage parents to support their children at home by making their expectations about school clear and creating a positive homework and learning environment.
Parents are expected to participate in their child’s academic success including ensuring that their child attends school daily and on time.
Opportunities to participate on-site include School Site Council, English Learner Advisory Committee, open houses, and student recognition and excellence programs.
If you want to get involved, please contact the school at (619) 362-4500. State Priority: Pupil Engagement This section provides information relevant to the Pupil Engagement State Priority (Priority 5): • High school dropout rates • High school graduation rates Dropout Rate and Graduation Rate This table displays the school’s “cohort” dropout rates and graduation rates for the most recent three-year period for which data are availa-ble. (A cohort is the group of first-time grade 9 students in a given school year, plus students who transfer in, less students who transfer out, emigrate, or die, during that and the following three school years. A graduate is a cohort member who earns a regular high school di-ploma by the end of the cohort’s fourth year.) For comparison purposes, data are also provided at the district and state levels. Detailed in-formation about dropout rates and graduation rates can be found on the DataQuest website at dq.cde.ca.gov/dataquest/.
Indicator School District State
2011–12 2012–13 2013–14 2011–12 2012–13 2013–14 2011–12 2012–13 2013–14 Dropout Rate (cohort) 21.3 20.6 12.2 6.1 5.2 4.5 13.1 11.4 11.5 Graduation Rate (cohort) 39.3 47.7 49.4 87.0 87.9 89.7 78.9 80.4 81.0
Completion of High School Graduation Requirements
Since the graduating class of 2007, students in California public schools have been required to pass both the English–language arts and mathematics portions of the California High School Exit Exam (CAHSEE) to receive a high school diploma. The following table displays, by student group, the percentage of students who began the 2013–14 school year in grade 12 and who met all state and local graduation requirements for grade 12 completion, including having passed both portions of the CAHSEE or received a local waiver or state exemption. Detailed information about the CAHSEE can be found at the CDE website at www.cde.ca.gov/ta/tg/hs/.

Garfield (361) 10 Spring 2016 School Accountability Report Card
Graduating Class of 2014 Group School District State All Students 111.4 83.8 84.6 African American 87.5 79.4 76.0 Asian 200 91.4 92.6 Filipino 0 93.7 96.5 Hispanic 110.3 79.4 81.3 Native American 50 74.3 78.1 Pacific Islander 150 89.6 83.6 White (not Hispanic) 175 87.4 89.9 Two or More Races 200 89.4 82.8 Socioeconomically Disadvantaged 113.0 81.9 81.4 English Learners 68.75 48.0 50.8 Students with Disabilities 100 45.6 61.3 Foster Youth — — —
Note: A dash (—) indicates the number of students tested is 10 or less; percentages are not calculat-ed either because the result is too small for statistical accuracy or to protect student privacy. An “n/a” indicates no data are available.
State Priority: School Climate This section provides information relevant to the School Climate State Priority (Priority 6): • Student suspension rates • Student expulsion rates • Other local measures to ensure safety Suspensions and Expulsions
The following table shows the numbers and rates of suspensions and expulsions. Rates per 100 students are the total number of incidents divided by the school’s enrollment for the given year, multiplied by 100. The district comparison rates are the expected rates for the school’s enrollment and grade-level composition, based on actual districtwide rates. Because suspension and expulsion rates vary greatly by grade level, and since any given two schools are not likely to have identical enrollment numbers per grade, schools will have different district comparison rates. District figures include charter schools.
Type of Action 2012–13 2013–14 2014–15
School District State School District State School District State
Suspensions Number 32 9,622 — 24 7,744 — 13 6,130 — Rate/100 students 6.20 3.02 5.07 5.22 2.26 4.36 3.33 1.69 3.80
Expulsions Number 0 212 — 0 139 — 0 85 — Rate/100 students 0.00 0.09 0.13 0.00 0.06 0.10 0.00 <0.05 0.09
School Safety Plan (2015–16)
Last Review/Update: September 8, 2014 Last Discussed with Staff: September 8, 2014
Campus safety is the district’s top priority. Principals, teachers, support staff, school police services, and community organizations work together to prevent, prepare, and respond to emergency situations. To ensure safety and security, each school has a state-mandated individ-ual emergency response plan that is updated annually and posted on the school’s website. School staff members participate in regular emergency-preparedness drills and response training. Substance abuse prevention programs are presented to students regularly. Policies and procedures are in place to address safe entry and exit of students; serious disciplinary problems; discrimination, harassment and bully-ing; mandated child abuse reporting procedures; and school dress codes.
Adult supervision is provided in the classrooms and outside areas before and after school, during recess and lunch, and during passing time between classes. Under the direction of the principal or site administrator, school staff members implement specific school-building security procedures. In addition, district offices support schools by reviewing and disseminating safety requirements and information, coor-dinating safety-related services, and providing safety training and assistance.
The complete comprehensive site plan is on file in the principal’s office at Garfield High School.

Garfield (361) 11 Spring 2016 School Accountability Report Card
Other Information
This section provides information that is required by law to be included in the SARC but is not included in the state priorities for the LCFF. Adequate Yearly Progress The federal ESEA requires that all schools and districts meet the following Adequate Yearly Progress (AYP) criteria:
• Participation rate on the state’s standards-based assessments in English language arts (ELA) and mathematics • Percentage proficient on the state’s standards-based assessments in ELA and mathematics • Graduation rate (for secondary schools) Detailed information about AYP, including participation rates and percent proficient results by student group, can be found at the AYP
website www.cde.ca.gov/ta/ac/ay/. AYP Overall and by Criteria (2014–15)
This table displays an indication of whether the school and the district made AYP overall and whether the school and the district met each of the AYP criteria.
AYP Criteria School District Overall No Yes Participation Rate—English Language Arts No Yes Participation Rate—Mathematics No Yes Percentage Proficient—English Language Arts n/a n/a Percentage Proficient—Mathematics n/a n/a Met Graduation Rate Yes Yes
Federal Intervention Program (2015–16)
Schools that receive funding from the federal government under Title I must enter federal Program Improvement (PI) if they do not make AYP for two consecutive years in the same content area (English language arts or mathematics) or on the same indicator (API or gradua-tion rate). After entering PI, schools and districts advance to the next level of intervention with each additional year that they do not make AYP. Detailed information about PI identification and status can be found at the CDE website at www.cde.ca.gov/ta/ac/ay/tidetermine.asp.
Indicator School District Program Improvement Status Not in PI In PI First Year of Program Improvement n/a 2009–10 Year in PI* n/a 3+ Number of Schools Currently in Program Improvement†
147
Percentage of Schools Currently in Program Improvement† 76.2 * A determination waiver (DW) indicates that the PI status of the school was carried over from the prior year in accordance with the flexibility granted through the federal waiver process. † Includes charter schools. Average Class Size and Class Size Distribution (Secondary)
This table displays the average class size for each subject area and the number of classrooms that fall into each class size category.
Subject
2012–13 2013–14 2014–15 Avg. Class Size
Number of Classrooms Avg. Class Size
Number of Classrooms Avg. Class Size
Number of Classrooms
1–22 23–32 33+ 1–22 23–32 33+ 1–22 23–32 33+ English 7 30 1 — 6 33 — — 5 30 — — Mathematics 9 18 1 — 8 19 — — 7 21 — — Science 9 15 — — 13 12 — — 6 15 — — History–Social Science 11 14 — — 8 15 — — 7 19 — —

Garfield (361) 12 Spring 2016 School Accountability Report Card
Academic Counselors and Other Support Staff Members (2014–15)
This table displays, in units of full-time equivalents (FTE), the number of academic counselors and other support staff members who are assigned to the school. One FTE equals one staff member working full time; one FTE could also represent two staff members who each work 50 percent of full time. The table also displays the average number of students for each academic counselor.
Position Number of FTE Assigned
to the School Average Number of Students per
Academic Counselor Academic Counselor 3.0 65.00 Counselor (Social/Behavioral or Career Development) 0.2
Library Media Teacher (Librarian) 0.0 Library Media Services Staff (Paraprofessional) 0.0 Psychologist 0.2 Social Worker 0.0 Nurse 1.0 Speech/Language/Hearing Specialist 0.0 Resource Specialist (Non-Teaching) 0.0 Other (Specify) 0.0
Expenditures per Pupil and School-Site Teacher Salaries (Fiscal Year 2013–14)
The following table displays this school’s expenditures per student from basic (unrestricted) sources, from any supplemental (restricted) sources, and its total per-pupil expenditures. The table also provides a comparison of the school’s per-pupil expenditures from basic sources with other schools in the district and throughout the state. Finally, it compares the average teacher salary at the school with average teacher salaries in the district and the state.
Basic or unrestricted sources are funds that, except for general guidelines, are not controlled by law or by a donor. Supplemental or re-stricted sources are funds whose use is controlled by law or by a donor. Money that is designated for specific purposes by the Board of Education is not considered restricted.
For detailed information on school expenditures for all districts in California, see the CDE Current Expense of Education and Per-pupil Spending webpage: www.cde.ca.gov/ds/fd/ec/. For information on teacher salaries for all districts in California, see the CDE Certificated Salaries and Benefits webpage: www.cde.ca.gov/ds/fd/cs/. To look up expenditures and salaries for a specific school district, see the Ed-Data website at: www.ed-data.org.
Level Total Expenditures
Per Pupil Expenditures Per Pupil
(Supplemental) Expenditures Per
Pupil (Basic) Average
Teacher Salary School Site $21,718 $2,540 $19,179 $73,942 District (excludes charter schools)
$5,218 $69,748 Difference: School Site and District (%) 267.5 6.0 State $5,348 $72,971 Difference: School Site and State (%) 258.6 1.3
Types of Services Funded (Fiscal Year 2014–15)
The district’s general fund includes monies for: • General operations—salaries, benefits, services, materials, and support to the general education • Special Education—programs offering appropriate, individualized instruction to students with special needs • Special projects—monies from agencies (federal or state) earmarked for specific programs/projects or services • Transportation • Maintenance and operations • District administration Each school in the district receives an instructional budget based on enrollment, programs, and formulas set by Board of Education pol-
icy, state law, agreements with employee bargaining units, and guidelines of outside funding sources. After-school academic programs include ACCESS (college prep) program study sessions and academic tutoring in all subjects. Recrea-
tional activities include basketball, weightlifting and fitness, and a soccer team that competes in recreational leagues around the county. Other enrichment activities include music writing and recording, organic gardening, and ASB.

Garfield (361) 13 Spring 2016 School Accountability Report Card
Teacher and Administrative Salaries (Fiscal Year 2013–14)
This table displays district-level salary information for teachers, principals, and the superintendent, and compares these figures to the state averages for districts of the same type and size. The table also displays teachers and administrative salaries as a percentage of a district’s budget, and compares these figures to the state averages for districts of the same type and size. Detailed information regarding salaries may be found at the CDE website at www.cde.ca.gov/ds/fd/cs/.
Position District Amount Statewide Average for
Districts in Same Category Beginning Teacher Salary $39,983 $43,165 Mid-Range Teacher Salary $60,754 $68,574 Highest Teacher Salary $82,578 $89,146 Average Principal Salary (Elementary School Level) $114,227 $111,129 Average Principal Salary (Middle School Level) $116,019 $116,569 Average Principal Salary (High School Level) $126,214 $127,448 Superintendent Salary $252,960 $234,382 Percentage of Budget for Teachers’ Salaries 39 38 Percentage of Budget for Administrative Salaries 5 5
Advanced Placement Courses (2014–15)
This table displays for the most recent year the number of Advanced Placement (AP) courses that the school offered, by subject, and the percentage of the school’s students enrolled in all AP courses. Detailed information about student enrollment in AP courses can be found at the CDE website at dq.cde.ca.gov/dataquest/.
Subject Number of
AP Courses Offered
Percentage of Students in AP Courses
Computer Science 0
English 0 History–Social Science 0 Mathematics 0 Science 0 Visual and Performing Arts 0 World Languages 0
Total 0 0 Professional Development
The district and the Board of Education have set a high priority on professional development, with the goal of providing targeted profes-sional development to build capacity and knowledge to support student learning success. The Office of Leadership and Learning collabo-rates with other departments to provide teachers and administrators with ongoing professional development, including improving teaching and learning related to the Common Core State Standards, educational technology, advanced studies, and leadership development. Sessions offered at various times throughout the year focus on a wide variety of professional development aimed at strengthening content knowledge to meet the needs of all learners, with an emphasis on targeting the needs of our English language learners, students with disabilities, and other struggling learners.
In addition to district-provided professional development, principals identify a schoolwide focus each year for professional develop-ment and also determine areas of individual need. Throughout the year, teachers participate in school-based professional learning commu-nities (PLCs) to encourage best practices and shared problem solving. Teachers are provided with useful data systems that allow them to improve the learning of each student. Principals also provide the ongoing training needed to be professional site managers. Staff release for professional development is organized in a variety of ways on a site-by-site basis throughout the year.

Garfield (361) 14 Spring 2016 School Accountability Report Card
Appendix: Adopted Texts and Instructional Materials
Subject Area
Grade Level
District Course (for secondary courses) Instructional Material or Textbook
Copyright Date
Adoption Year
High School Level
ELA 9 English 1,2 Literature for California, Grade 9, McDougal Littell 2009 2008–09 ELA 10 English 3,4 Literature for California, Grade 10, McDougal Littell 2009 2008–09 ELA 10 English 3,4 Advanced Prentice Hall Literature: World Masterpieces, Pearson Prentice Hall 2009 2008–09 ELA 11 American Literature 1,2 Language of Literature, American Literature, McDougal Littell 2006 2003–04 ELA 11 American Literature 1,2
Honors Language of Literature, American Literature, McDougal Littell 2006 2003–04
ELA 11–12 Contemporary Voices in Literature 1,2
Contemporary Reader, 7th ed., Prentice Hall –or– Legacies, 2nd ed., Thomson Learning
2004 2002
2003–04 2003–04
ELA 11–12 World Literature 1,2 The Language of Literature, World Literature, McDougal Littell 2003 2003–04
ELA 11 English Language & Composition AP 1,2
Readings for Writers, Thomson Learning Norton Reader, Norton
2004 2005
2004–05
ELA 12 English Literature 1,2 Timeless Voices, Timeless Themes—The British Tradition, Prentice Hall
2005 2004–05
ELA 11–12 English Literature & Composition AP 1,2
Reading Fiction, Poetry, and Drama, Glencoe/McGraw-Hill 2010 2009–10
ELA 12 Expository Reading and Writing
Teachers of this course receive instructional materials during specialized training.
— —
ELA 11–12 Writers Workshop 1,2 Steps to Writing Well, with Additional Readings, Thomson Learning Writers INC, Great Source
2002 2001
2003–04
ELA 12 Contemporary Communi-cations 1,2
Elements of Literature Sixth Course: Literature of Britain with World Classics, Holt, Rinehart & Winston
2003 2003–04
ELD 9–12 ESL Newcomers 9th–12th Word by Word Basic Picture Dictionary, Longman 1995 2002–03
ELD 9–12 ESL 1-2 Champion—Red Level, Ballard & Tighe Keys to Learning, Pearson Longman
2008 2005
2008–09 2008–09
ELD 9–12 ESL 3-4 Champion—Blue Level, Ballard & Tighe Quest: Introduction, McGraw-Hill ESL/ELT
2007 2007
2008–09 2008–09
ELD 9–12 ESL 5-6 Quest 1, McGraw-Hill ESL/ELT 2007 2008–09
H-SS 10 Modern World History & Geography 1,2
Modern World History: Patterns of Interaction, California Edition, McDougal Littell
2006 2008–09
H-SS 10 World History 1,2 Ad-vanced
World History: Modern Times, California Edition, Glencoe 2006 2005–06
H-SS 10 World History 1-2 AP The Earth and Its Peoples, McDougal Littell 2008 2008–09
H-SS 10-12 European History 1,2 AP Western Civilization, Thomson 2003 2004–05
H-SS 10-12 Psychology 1,2 AP Myer’s Psychology for AP, 2nd ed., BFW/Worth 2015 2015–16
H-SS 11 U.S. History & Geography 1,2
The Americans: Reconstruction to the 21st Century, California Edi-tion, McDougal Littell
2006 2008–09
H-SS 11 U.S. History & Geography 1,2 Honors
A People and a Nation, McDougal Littell 2008 2008–09
H-SS 11 U.S. History 1,2 AP AP American History: Connecting with the Past, McGraw-Hill 2015 2015–16
H-SS 12 Principles of Economics 1 Economics: Principles In Action, Prentice Hall 2003 2003–04
H-SS 12 Government 1 United States Government: Democracy in Action, Glencoe 2003 2003–04
H-SS 12 American Government in World Affairs
World Politics in the 21st Century, Prentice Hall 2004 2004–05
H-SS 12 Government & Politics: United States AP
Government in America: People, Politics, and Policy, 16th AP ed., Pearson
2014 2015–16
H-SS 12 Microeconomics 1 AP Economics, Glencoe/McGraw-Hill 2005 2004–05
H-SS 12 Macroeconomics 2 AP Economics, Glencoe/McGraw-Hill 2005 2004–05
Math 9–12 Integrated Math I Mathematics I: Integrated CME Project, Pearson 2013 2014–15
Math 9 Advanced Integrated Math I
Mathematics I: Integrated CME Project, Pearson 2013 2014–15
Math 9–11 Integrated Math II Mathematics II: Integrated CME Project, Pearson 2013 2014–15
Math 9–10 Advanced Integrated Math II
Mathematics II: Integrated CME Project, Pearson 2013 2014–15
Math 10–12 Integrated Math III Mathematics III: Integrated CME Project, SE, Pearson 2014 2014–15
Math 10–11 Advanced Integrated Math III
Mathematics III: Integrated CME Project, SE, Pearson 2014 2014–15

Garfield (361) 15 Spring 2016 School Accountability Report Card
Subject Area
Grade Level
District Course (for secondary courses) Instructional Material or Textbook
Copyright Date
Adoption Year
Math 9–12 Algebra 1-2 Prentice Hall Mathematics: Algebra, California Edition, Prentice Hall 2009 2009–10
Math 9–12 Geometry 1-2 Prentice Hall Mathematics: Geometry, California Edition, Prentice Hall
2008 2009–10
Math 10–12 Intermediate Algebra 1-2 Algebra 2, Holt 2004 2005–06
Math 10 Intermediate Algebra 1-2 Advanced
Algebra 2, California Edition, Glencoe 2005 2005–06
Math 11–12 Precalculus 1-2 Honors Precalculus: Graphical, Numerical, Algebraic, Prentice Hall 2004 2004–05
Math 11–12 Precalculus 1-2 Precalculus, Prentice Hall 2004 2004–05
Math 11–12 Statistics and Data Analysis 1-2
Workshop Statistics: Discovery with Data and the Graphing Calcula-tor, Key Curriculum Press
2002 2003–04
Math 11–12 Statistics 1-2 AP The Practice of Statistics for the AP Exam, 5th ed., BFW/Freeman 2015 2015–16 Math 11–12 Topics in Discrete
Mathematics 1,2 Finite Mathematics and Calculus with Applications, Prentice Hall 2002 2003–04
Math 12 Calculus AB 1,2 AP Calculus: Graphical, Numerical, Algebraic, AP 5th ed., Pearson 2016 2015–16
Science 9–12 Earth Science 1,2 Holt Earth Science, California Edition, Holt Rinehart Winston 2007 2007–08
Science 9–12 Physics 1,2 Conceptual Physics, Pearson Prentice Hall 2006 2007–08
Science 9–12 Physics 1,2 Advanced CA Physics: Principles and Problems, Glencoe/McGraw-Hill 2008 2007–08
Science 11–12 AP Physics 1 A,B Wilson and Buffa, Physics, Prentice Hall 2003 2005–06
Science 11–12 Physics C 1,2 AP Physics for Scientists and Engineers, Cengage 2008 2008–09
Science 9–12 Chemistry 1,2 Chemistry, California Edition, Prentice Hall 2007 2009–10
Science 9–12 Chemistry 1,2 Honors Principles of General Chemistry, Glencoe McGraw-Hill 2010 2009–10
Science 11–12 Chemistry 1,2 AP Chemistry: The Central Science, Prentice Hall 2009 2009–10
Science 9–12 Biology 1,2 BSCS Biology: A Human Approach, 2nd ed., Kendall Hunt 2003 2004–05
Science 9–12 Biology 1,2 Advanced Biology: Concepts and Connections, Pearson Prentice Hall 2003 2005–06
Science 11–12 Biology 1,2 AP Campbell Biology, 10th ed., Pearson 2014 2015–16
Science 11–12 Marine Science ,2 Oceanography: An Invitation to Marine Science, Thomson 2007 2007–08
Science 11–12 Physiology 1,2 Principles of Anatomy and Physiology, Wiley 2006 2005–06
Science 11–12 Environmental Science 1,2 AP
Environment: The Science Behind the Stories, AP 5th ed., Pearson 2014 2015–16
Note: ELA = English Language Arts; ELD = English Language Development; H-SS = History–Social Studies.