2015 annual results - zonebourse.com€¦ · 2015 annual results march 3rd, 2016 bus shelter on...
TRANSCRIPT

2015 ANNUAL RESULTS
March 3rd, 2016
Bus shelter on Broadway and West 61st Street in New York, United States

BUSINESS OVERVIEW
Jean-François Decaux
Chairman of the Executive Board and Co-CEO

In million Euros, except %. Adjusted figures (1) except when IFRS. 2015 2014
► Revenue 3,207.6 2,813.3 +14.0%
► Operating margin 695.2 630.0 +10.3%
► EBIT before impairment charge (2) 371.4 334.9 +10.9%
► Net income Group share before impairment charge, IFRS (3) 241.4 215.6 +12.0%
► Net income Group share, IFRS 233.9 194.3 +20.4%
► Net cash flow from operating activities 562.8 498.1 +13.0%
► Free cash flow 333.4 297.9 +11.9%
► Net debt as of end of period, IFRS 400.5 (83.5)
2015 RESULTS
(1) Adjusted figures include our prorata share in companies under joint control accounted for using the equity method under IFRS 11.(2) The impact of the impairment charge on EBIT in 2015 corresponds to a -€2.7m impairment on intangible assets and PP&E and a -€11.2m net provisions for onerous contracts. The impact of the impairment charge on EBIT in 2014
corresponded to a -€7.1m impairment undertaken on the net assets of some of our companies under joint control, a -€27.0m impairment on intangible assets and PP&E and a €2.3m reversal on provisions for onerous contracts.(3) The impact of the impairment charge on Net income Group share in 2015 corresponds to a -€1.5m impairment on intangible assets and PP&E (net of tax and net of the impact on minority interests) and a -€6.0m (net of tax and net of the
impact on minority interests) net provisions for onerous contracts. The impact of the impairment charge on Net income Group share in 2014 corresponded to a -€7.1m impairment undertaken on the net assets of some of our companies under
joint control, a -€16.0m impairment on intangible assets and PP&E and a €1.8m net reversal on provisions for onerous contracts.
Please refer to page 52 for financial definitions. 3

+4.5%
+8.0%
-5.3%
+4.2%
+9.3%
+25.6%
-0.2%
+14.0%
2015 ADJUSTED REVENUE GROWTH BY SEGMENT
(1) Organic growth = excluding acquisitions / divestitures and the impact of foreign exchange.
Street
FurnitureTransport Billboard Group
Street
FurnitureTransport Billboard Group
Organic growth (%) (1)Reported growth (%)
4

+9.3%
+5.3%
-1.3%
+0.4%
+5.4% +5.4%
+4.2%
2015 ADJUSTED REVENUE GROWTH BY REGION
(1) Organic growth = excluding acquisitions / divestitures and the impact of foreign exchange.(2) Excluding France and the United Kingdom.
FranceUnited
Kingdom
Rest of the
World
North
AmericaGroup
Organic growth (%) (1)
5
Europe (2)Asia-
Pacific

26.0%
25.9%19.1%
11.5%
10.4%
7.1%
43.4%
42.3%
14.3%
2015 ADJUSTED REVENUE BREAKDOWN
Billboard
Transport
United
Kingdom
Rest of
the World
North
America
France
Street
Furniture
(1) Excluding France and the United Kingdom. 6
Europe (1)
Asia-
Pacific

2015 TOP 10 CLIENT CATEGORIES
Diversified portfolio of advertisers: 93% of world Top 100 advertisers are JCDecaux clients
Top 10 clients represent only 11.2% of Group revenue
Avenue des Champs-Élysées, Paris, France 7
# Category2015
revenue %YoY %
change
1 Retail 15.1% +7%
2 Entertainment, Leisure & Film 11.6% +8%
3 Personal Care & Luxury Goods 10.6% +5%
4 Finance 9.0% +10%
5 Food & Beverage 8.1% +18%
6 Automotive 6.3% =
7 Services 6.2% +8%
8 Fashion 6.1% +7%
9 Telecom & Technology 5.8% +12%
10 Travel 5.5% +14%

Netflix campaign in Düsseldorf, Germany
INCREASED AD SPENDFROM SOCIAL MEDIA & STREAMING SERVICES
8Google dynamic digital campaign in the UK

134
339 408 400534
638764
859952
1,185
8%
16%
19%21%
23%
26%
29%
32%34%
37%
2004 2007 2008 2009 2010 2011 2012 2013 2014 2015
Revenue from Faster-growth markets Faster-growth markets' revenue as a % of Total revenue
FASTER-GROWTH MARKETS NOW REPRESENT 37% OF OUR GROUP REVENUE
In million €. Adjusted figures.
"Faster-growth markets” include Central & Eastern Europe (excl. Austria), Baltic countries, Russia, Turkey, Ukraine, Latin America, Asia (China incl. Hong Kong and Macau, Mongolia,
Thailand, South Korea, Singapore, India), Africa, Middle East, Central Asia. 9

4.1%5.9% 6.8%
8.9%10.5%
10.0%
13.3%
15.3%
17.9% 17.5%
2011 2012 2013 2014 2015
STRONG GROWTH FROM DIGITAL:+34.6% INCREASE IN REVENUE IN 2015
UK digital will reach 50% of UK revenue by 2017 (currently 36%)
Transport digital revenue as a % of total Transport revenue
Digital revenue as a % of total revenue
10Adjusted figuresLos Angeles International Airport, United States

20.5%
70.7%
8.8%16.7%
77.2%
6.1%
Princes Street in Edinburgh, UK
Breakdown by segment
2014 2015
Billboard
Transport
Street
FurnitureBillboard
Transport
Street
Furniture
INCREASED CONTRIBUTION FROM DIGITALIN STREET FURNITURE
11

Oxford Street, London, UK
LONDON DIGITAL NETWORK:THE 3 D’S THAT CHANGE THE FACE OF OUTDOOR
Data: 9m audience data points
Route
100,000 geo-sales zones CACI
20m web/app usage zones Telefonica
Digitization: up to 1,000 84ʺ screens starting in March 2016
Distribution: SmartBrics Data Planning
SmartContent CMS
SmartExchange
12
“One of the most visible digital transformations
will be JCDecaux’s digital roll-out across London,
creating a multitude of creative and technical capabilities.”Source: Campaign Magazine The Year Ahead 2016

Small cells deployment along Market Street in San Francisco
Small cells deployed were among those considered critical for network success by Verizon during the Super Bowl
Verizon Executive: “Outstanding network performance”
Small cell integrated in a column in San Francisco, United States
THE RIGHT “PLACE” FOR SMALL CELLS
Small cell installation within a column 13

“This combination of features turns the shelter into … a
platform capable of unlocking future innovations that we
can barely imagine. This is 21st century technology at work-
fundamentally improving customer service across our city.”
Eric Garcetti, Mayor of Los Angeles
Los Angeles, United States
THE RIGHT “PLACE” FOR CITY WI-FI
Avenue des Champs-Élysées, Paris, France 14

Yihaodian (Yhd.com) campaign, Beijing metro, China
China: 1st market in the world for e-commerce
Largest client category in our metros
Jurassic World launch campaign in Waterloo station, London, UK
CONVERGENCE: OFFLINE TO ONLINE
500,000 tweets on the 1st day of the campaign
71% engagement rate
15

RECENT CONTRACT WINS & RENEWALS
Contract renewals / extensionsNew contracts
16
STREET FURNITURE
Denmark Copenhagen
TRANSPORT
Finland Helsinki City Transport
Denmark Danish rail stations
Italy Rome metro and bus
Italy Naples buses
United States Orlando International airport
STREET FURNITURE
UK London (TfL bus shelters)
UK Royal Borough of Kensington and Chelsea
Japan Kagoshima
TRANSPORT
Italy Naples metro
Brazil Rio de Janeiro Tom Jobim International Airport
Brazil Salvador de Bahia Deputado Luís Eduardo
Magalháes International Airport
Brazil Brasilia Juscelino Kubitschek International
Airport
Brazil Natal São Gonçalo de Amarante International
Airport
China Guangzhou metro lines
Hong Kong Hong Kong island buses
India Chennai trains
Saudi Arabia Madinah Prince Mohammad bin Abdulaziz
International Airport
Includes digital

Bus shelter in Rio de Janeiro (Olympic city in 2016), Brazil
ACCELERATION OF THE CONSOLIDATIONIN LATIN AMERICA
Bolt-on acquisitions:
70% of Eye Catcher Media (Peru)
CEMUSA Brazil
OUTFRONT Media Latam expected to close (Mexico, Chile, Uruguay, Brazil and Argentina) in H1 2016
JCDecaux won 3 of the 10 largest airports:
Brasilia (18.1 million passengers)
Rio de Janeiro (17.4 million passengers)
Lima (15.7 million passengers)
17

Acquisition (1) of Continental Outdoor Media closed on 18th June, 2015: 13 new countries, N°1 in Africa
Key drivers for growth in Africa:
From 54 cities with over 1 million inhabitants in 2014 to 102 cities by 2030
City beautification is becoming a top-of-mind issue for authorities
Less clutter implies higher quality panels (including digitization)
Development of our internationalclients
LEADING PLATFORM FOR GROWTH IN AFRICA
Johannesburg, South Africa 18(1) In partnership (70% / 30%) with Royal Bafokeng Holdings
Source: Le Monde

60% STAKE IN IGPDECAUX (ITALY)
RCS Media Group’s stake purchased 30th June 2015, post-acquisition:
JCDecaux’s stake increases from 32.35% to 60% in the present structure
Publitransport (Du Chène de Vèrefamily) increases from 33.15% to 40%
The company remains under the joint-control of the 2 shareholders
IGPDecaux operates mainly in Transport with the Milan airports, buses and metro, and with Street Furniture contracts in Milan, Naples and Turin
Tramway during the Universal Exhibition in Milan, Italy 19

Kiosk on 5th Avenue and 42nd Street in New York, United States
CEMUSA: IMPROVING COVERAGE IN 4 COUNTRIES
43,000 advertising faces in 4 countries: US, Brazil, Spain and Italy
US: JCDecaux present in 5 of the largest DMAs (1) (New York, Los Angeles, Chicago, San Francisco and Boston)
Brazil: consolidation of our n°1 position in Street Furniture and Transport, especiallyin the country’s largest cities (São Paulo, Rio de Janeiro, Brasilia, Salvador de Bahia)
Spain: JCDecaux strengthens its leading position across all segments and enters 41 airports (incl. Madrid and Barcelona)
Italy: JCDecaux enters new cities in Italy (Genoa, Bologna, Parma)
20(1) DMA: Designated Market Area

New green roof bus shelter in Paris, France
Recognition of the commitments, performance and transparency achieved by the Group’s Sustainable Development Strategy deployed in 2014
This strategy centers around six priorities:
Environmental priorities Reduce energy consumption
Reduce other environmental impacts
Social priorities Deploy a Group-wide Health & Safety Policy
Implement an ambitious Group-wide Social Policy
Stakeholder priorities Reinforce sustainable development in the
Purchasing Policy
Strengthen employee commitment to sustainable development
JOINING THE FTSE4GOOD INDEX SERIES
2121

FINANCIAL HIGHLIGHTS
David Bourg
Chief Financial & Administrative Officer

In million Euros, except %. Adjusted figures (1) except when IFRS. 2015 2014
► Revenue 3,207.6 2,813.3 +14.0%
► Operating margin 695.2 630.0 +10.3%
► EBIT before impairment charge (2) 371.4 334.9 +10.9%
► Net income Group share before impairment charge, IFRS (3) 241.4 215.6 +12.0%
► Net income Group share, IFRS 233.9 194.3 +20.4%
► Net cash flow from operating activities 562.8 498.1 +13.0%
► Free cash flow 333.4 297.9 +11.9%
► Net debt as of end of period, IFRS 400.5 (83.5)
2015 RESULTS
(1) Adjusted figures include our prorata share in companies under joint control accounted for using the equity method under IFRS 11.(2) The impact of the impairment charge on EBIT in 2015 corresponds to a -€2.7m impairment on intangible assets and PP&E and a -€11.2m net provisions for onerous contracts. The impact of the impairment charge on EBIT in 2014
corresponded to a -€7.1m impairment undertaken on the net assets of some of our companies under joint control, a -€27.0m impairment on intangible assets and PP&E and a €2.3m reversal on provisions for onerous contracts.(3) The impact of the impairment charge on Net income Group share in 2015 corresponds to a -€1.5m impairment on intangible assets and PP&E (net of tax and net of the impact on minority interests) and a -€6.0m (net of tax and net of the
impact on minority interests) net provisions for onerous contracts. The impact of the impairment charge on Net income Group share in 2014 corresponded to a -€7.1m impairment undertaken on the net assets of some of our companies under
joint control, a -€16.0m impairment on intangible assets and PP&E and a €1.8m net reversal on provisions for onerous contracts.
Please refer to page 52 for financial definitions. 23

+4.5%
+8.0%
-5.3%
+4.2%
+9.3%
+25.6%
-0.2%
+14.0%
ANALYSIS OF THE REVENUE GROWTH
(1) Organic growth = excluding acquisitions / divestitures and the impact of foreign exchange.
Street
FurnitureTransport Billboard Group
Street
FurnitureTransport Billboard Group
Organic growth (%) (1)Reported growth (%)
24

ANALYSIS OF OPERATING MARGIN
25
In million Euros, except %. Adjusted figures. 2015 2014
► Revenue 3,207.6 2,813.3 +14.0%
• Rent & fees (1,306.6) (1,095.0) +19.3%
• Other net operational expenses (1,205.8) (1,088.3) +10.8%
► Operating margin 695.2 630.0 +10.3%
Please refer to page 52 for financial definitions.

OPERATING MARGIN TO EBIT
In million Euros, except %. Adjusted figures. 2015 2014
► Operating margin 695.2 630.0 +10.3%
• Maintenance spare parts (46.8) (42.1)
• Amortization and provisions (net) (261.4) (254.2)
o Of which net depreciation of PP&E and intangible assets (250.0) (246.5)
o Of which impact of PPA depreciation (22.7) (20.3)
o Of which net provision charge 11.3 12.6
• Other operating income and expenses (15.6) 1.2
► EBIT before impairment charge 371.4 334.9 +10.9%
• Net impairment charge, excluding goodwill (1) (13.9) (31.8)
• Goodwill impairment - -
► EBIT after impairment charge 357.5 303.1 +17.9%
26
(1) Including impairment charge on net assets of companies under joint control.
Please refer to page 52 for financial definitions.

14.4%11.2%
4.0%
11.6%
31.7%
14.9%11.4%
21.7%
MARGINS BY SEGMENT
+130bps
-30bps
-140bps
-70bps
(1) Before impairment charge
Street
FurnitureTransport Billboard Group
EBIT (1) (% of revenue)Adjusted figures
Operating margin (% of revenue)Adjusted figures
27
Street
FurnitureTransport Billboard Group
+90bps
=
-140bps
-30bps

EBIT TO NET INCOME
In million Euros, except % 2015 2014
► Adjusted EBIT after impairment charge 357.5 303.1 +17.9%
• Restatement of EBIT from companies under joint control (87.4) (70.8)
► EBIT after impairment charge, IFRS 270.1 232.3 +16.3%
• Financial income / (loss) (1) (28.2) (26.2)
• Tax (72.9) (69.8)
• Equity affiliates 81.4 70.3
• Minority interests (1) (16.5) (12.3)
► Net income Group share, IFRS 233.9 194.3 +20.4%
• Net impact of impairment charge 7.5 21.3
► Net income Group share before impairment charge, IFRS 241.4 215.6 +12.0%
(1) Excluding the impact of discounting and revaluation of debt on commitments to purchase minority interests (-€5.5m in 2015 and -€6.3m in 2014).
Please refer to page 52 for financial definitions.
28

CASH FLOW STATEMENT
29
In million Euros, except % 2015 2014
► Adjusted funds from operations net of maintenance costs 536.6 494.6 +8.5%
• Adjusted change in working capital requirement 26.2 3.5
► Adjusted net cash flow from operating activities 562.8 498.1 +13.0%
• Adjusted capital expenditure (229.4) (200.2)
► Adjusted free cash flow 333.4 297.9 +11.9%
• Restatement from companies under joint control 1.5 14.7
► Free cash flow, IFRS 334.9 312.6
• Dividends (124.7) (119.6)
• Equity increase (net) (483.3) 10.4
• Financial investments (net) (1) (163.3) (91.5)
• Others (2) (47.6) (26.7)
► Change in Net debt (Balance Sheet), IFRS 484.0 (85.2)
► Net debt as of end of period, IFRS 400.5 (83.5)
(1) Excluding net cash of acquired and
sold companies.
(2) Non cash variations (mainly due to
consolidation scope variations,
translation differences on net financial
debt, the impact of IAS 39 and finance
lease) and including net cash of
acquired and sold companies.

19 1738
2 23 25 29 2545 42
92
163 125
11039 50 53 55
5489
57
126141
67
9393 86
142 101
98
8.6%
14.5%14.0%
9.4%
6.6%6.8% 6.4%
8.3%
7.1%
7.2%
0
50
100
150
200
250
300
350
2006 2007 2008 2009 2010 2011 2012 2013 2014 2015
General investments Renewal capex Growth capex Capex as a % of revenue
200304306 180 155 168168 168 222 229
In million €. Adjusted figures
BREAKDOWN OF CAPEX
30

Finalization of the share buyback
194,419,422 shares, accounting for 87% of the share capital, were tendered to the offer
Of these, 61% of the free float were tendered
JCDecaux bought back a total of 12,500,000 shares, for a consideration of €500 million
The shares were cancelled on July 20th, 2015
Renegotiation of the syndicated credit facility in July 2015
Increase of the amount from €600m to €825m
5-year tenor + 2 one-year extensions
Margin improvement
OPTIMIZING OUR BALANCE SHEET
31

2015 FINANCIAL HIGHLIGHTS
A record revenue, operating margin, EBIT and net income before impairment charge
A record cash flow generation, in line with our operating performance, allowing us to self-finance organic and external development
A solid balance sheet:
A leveraged balance sheet at 0.7 times operating margin, IFRS
An improved banking financing
EPS* accretion at €1.14 (+18.1% vs. 2014)
A recommended dividend of €0.56 per share (+12.0% vs. 2014)
32* Based on Net income Group share before impairment charge, IFRS and on the number of shares outstanding as of 31st December 2015 (and 31st December 2014)

GROWTH STRATEGY AND OUTLOOK
Jean-Charles Decaux
Co-CEO

Berlin, Germany
STRONG OUTDOOR FUNDAMENTALS
34
Outdoor advertising: growing audiences
Urbanization accelerates. By 2050, the urban population will represent:
North America: 87%
Latin America: 86%
Europe: 82%
Asia: 65%
Africa: 62%
Air traffic will double in the next 15 years
Source: World Health Organization, Airbus
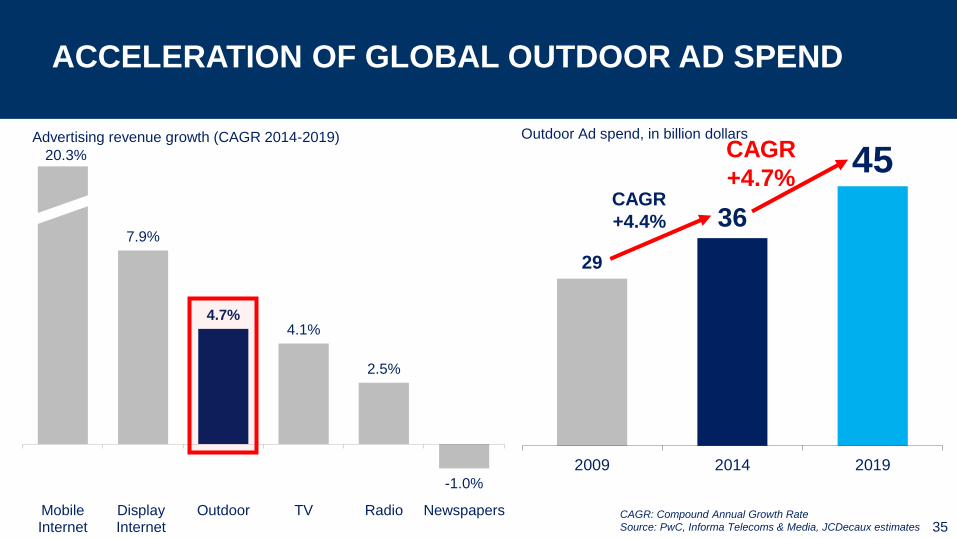
29
36
45
2009 2014 2019
Outdoor Ad spend, in billion dollars
7.9%
4.7%4.1%
2.5%
-1.0%
MobileInternet
DisplayInternet
Outdoor TV Radio Newspapers
Advertising revenue growth (CAGR 2014-2019)
20.3%
ACCELERATION OF GLOBAL OUTDOOR AD SPEND
35CAGR: Compound Annual Growth Rate
Source: PwC, Informa Telecoms & Media, JCDecaux estimates
CAGR
+4.4%
CAGR
+4.7%

UNIQUE AIRPORT PLATFORM FOR GLOBAL REACH
36
Source: ACI
N.B.: Number of airports as of December 2015
Number of passengers as of December 2014
231 airports
1.8 billion annual passengers
28% of annual global traffic
G L O B A L
22 airports
471m PAX
NORTH AMERICA
20 airports
48m PAX
LATIN AMERICA
107 airports
551m PAX
EUROPE
37 airports
55m PAX
AFRICA
34 airports
188m PAX
MIDDLE EAST
11 airports
439m PAX
ASIA-PACIFIC

ACCELERATION OF DIGITAL TRANSFORMATIONIN OUR 3 BUSINESS SEGMENTS
Chicago, United States 37Changi airport, SingaporeEdinburgh, UK

38
SMART OUTDOOR
JCDecauxDynamic: Optimizing content
SmartBrics: Optimizing yields
through data
Smarter: Proving
effectiveness of the Medium
JCDecaux Link: Optimizing
locations for small cells, Wi-Fi and Beacon tech.

UNIQUE GLOBAL FOOTPRINT
39
Latin America: JCDecaux n°1
Urbanization and beautification
Solid growth potential for outdoor
Bolt-on acquisitions still possible
North America: JCDecaux n°4
Transition to digital billboards
Outdoor market share gains
Organic growth opportunities
Europe: JCDecaux n°1
Beautification
Smart / Connected street furniture
JCDecaux well placed to benefit from a European recovery
Asia-Pacific: JCDecaux n°1
Urbanization
Need for infrastructure
Increase in air passenger traffic
Middle East: JCDecaux n°1
Need for infrastructure
Beautification
Increase in air passenger traffic
Africa: JCDecaux n°1
Urbanization
Need for infrastructure
Solid growth potential for outdoor

6.0%
1.1%1.6%
2.1%
2.8% 2.7%
9.1%
5.7%
1.5%1.2%
3.8%4.2%
5.3%
4.2%
1.3%
0.6%
1.3%
2.5%
5.8%
1.3%1.0%
0.6%
2.2%
3.8%
2010 2011 2012 2013 2014 2015
Annual organic growth (%)Ad spend @constant prices
JCDecaux
Clear Channel Outdoor
Outfront Media*
40
JCDECAUX OUTPERFORMSTHE MEDIA MARKET AND ITS US COMPETITORS
Source: Company news releases, ZenithOptimedia
* Outfront Media was CBS Outdoor before 2013

0.7x1.1x
3.2x4.9x
7.1x
11.5x
STRONGEST BALANCE SHEET IN THE INDUSTRY
JCDecaux Ströer Lamar OUTFRONT Media CCO / iHeartMedia
Net debt / EBITDA, IFRS (1) 0.7x 1.1x 3.2x 4.9x 7.1x / 11.5x
Gross debt $768m $372m $1.9bn $2.3bn $5.2bn / $20.9bn
Maturity date 2018 2020 2019-2024 2021-2025 2020-2022 / 2017-2027
Credit Rating (S&P) BBB NA BB- BB- NA / CCC+
Credit Rating (Moody’s) Baa2 NA Ba3 Ba3 NA / Caa2
Source: Company news releases.
Currency conversions are based on an exchange rate $/€ of 0.9185 (closing rate) as of December 31st, 2015 for JCDecaux. Ströer figures are based on preliminary 2015
results and JCDecaux estimates.(1) For consistency purposes, maintenance spare parts have been reclassified in the Operating margin for JCDecaux. 41

MAIN TENDERS EXPECTED IN 2016-2017
Street FurnitureEurope
Bonn, Leipzig, Berlin, Frankfurt
Brussels’ region bus shelters
Birmingham
Dublin
Paris’ kiosks
Nantes
Lyon
Barcelona
Lisbon
Istanbul
North America
Seattle
West Hollywood
San Francisco
Asia-Pacific
ASEAN (Southeast Asia)
India
Japan
Rest of the World
St. Petersburg
Belo Horizonte bus shelters and clocks
Transport BillboardEurope
London underground
Budapest metro
Milan metro and buses
Istanbul
North America
New York subway and buses
Dallas/Fort Worth International airport
Asia-Pacific
Metros in Chinese cities
Terminals in Chinese airports
Hong Kong International airport
Rest of the World
Panama metro
San José airport
Algiers metro
Abu Dhabi airport
Moscow metro
South African airports
On-going tenders
Postponed tender timetable
42
Europe
SNCF Réseau
North America
West Hollywood
Rest of the World
St. Petersburg

11,390 advertising panels in 5 countries: Mexico, Chile, Uruguay, Brazil and Argentina
Acquisition via our subsidiaries JCDecaux Latin America/Corameq, 85% owned by JCDecaux (1)
Revenue of $72.5m in 2014 in 2 business segments: Billboard and Buses
JCDecaux consolidates its n°1 position in Brazil and Chile and is now n°1 in Uruguay
JCDecaux strengthens its position in Mexico:
15th global economy
2nd Latin American economy
Presence in:
The 10 wealthiest cities on the continent
29 cities with over 1 million inhabitants
Billboard in Mexico City, Mexico
PENDING ACQUISITION OFOUTFRONT’S OUTDOOR BUSINESS IN LATIN AMERICA
43(1) The remaining 15% are owned by our partners in EUMEX: Antonio Torres and Carlos De Meer.

JCDecaux and Publicis entered into exclusive negotiations on October 19th, 2015
The relevant employee representative bodies were consulted. The operation is subject to standard conditions precedent, including approval by the French Competition Authority
Metrobus is the French Public Transport specialist:
125,000 panels in 30 cities
4 metro networks including the Paris metro
Strong digital expertise
Revenue of €215m in 2015
2 strategic objectives: Diversify JCDecaux’s portfolio in France
Bring JCDecaux’s know-how in international transport contracts
Digital campaign in Franklin D. Roosevelt metro station in Paris, France
PENDING ACQUISITION OFMETROBUS (JCDECAUX OWNS 33% SINCE 2005)
4444

252
1,349 1,380 1 353
232
3,3071,457
134
1,207914
569 325 239 236 226 210 181
126
CONSOLIDATION WITHMID TO SMALL SIZE OPERATORS
3,559 (1)
2,806
North America operations
International operations
excluding North America
2015 outdoor revenue ($m)
45
30% 33%
Eq
uity
me
tho
d
Eq
uity
me
tho
d
Sources: Company news releases. Currency conversions are based on an annual average exchange rate $/€ of 0.9013, CHF/€ of 0.9365, HKD/€ of 0.1163, AUD/€ of 0.6767 and RUB/€ of 0.0147 .(1) Does not include revenue from APG|SGA and Metrobus, companies integrated through the equity method in JCDecaux’s financial statements. (2) JCDecaux’s estimate of 2015 revenue. (3) On November 2nd, 2015, JCDecaux announced that it has entered into
an agreement to buy the Latin America business of OUTFRONT Media via its subsidiaries JCDecaux Latin America / Corameq, which are 85% owned by JCDecaux SA. The transaction is subjected to customary closing conditions, including regulatory approval. (4) On October 19th, 2015, JCDecaux announced that it has entered into exclusive negotiations with Publicis in the context of increasing our participation in the capital of Metrobus from 33% to 100%. The relevant employee representative bodies were consulted
before any final agreement is signed. The operation is subject to standard conditions precedent, including approval by the French Competition Authority. (5) On June 23rd, 2015, Sidewalk Labs acquired a stake in Titan Outdoor, now called Intersection.
oOh!
MediaJCDecaux CCO
OUTFRONT
Media(3) LamarFocus
Media(2) Ströer APG|SGARuss
OutdoorAsiaray(2)Metrobus
(4)Intersection
(2) (5)APN
Clear
Media
Exterion
Media(2)
1,514

CONCLUSION
46
Solid financial achievements in 2015
A record revenue, operating margin, EBIT and net income before impairment charge
A record cash flow generation, in line with our operating performance, allowing us to self-finance organic and external development
EPS* accretion at €1.14 (+18.1% vs. 2014)
A strong financial flexibility and a recommended dividend of €0.56 per share (+12.0% vs. 2014)
Investments for future growth
Digitization of London, New York, Berlin, Sydney, Stockholm, …
Major opportunities in metro tenders
Further external growth opportunities
A worldwide leadership position
Well-diversified geographical exposure to benefit from faster-growth and mature markets
Acceleration of digital transformation in our 3 business segments
Focus on product and software innovation* Based on Net income Group share before impairment charge, IFRS and on the number of shares outstanding as of 31st December 2015 (and 31st December 2014)
Q1 2016 OUTLOOK
“As we begin 2016 with the world’s largest OOH digital
street furniture roll-out in London starting next week
with other large cities including New York, Berlin,
Sydney, Stockholm, … to follow later in the year, we
continue the strong growth momentum of Q4 2015
across all segments and regions with an expected
organic revenue growth rate at around 9% in Q1 2016”
47

48

Under IFRS 11, applicable from January 1st, 2014, companies under joint control previouslyconsolidated using the proportionate method are accounted for using the equity method.
However, operating data of the companies under joint control will continue to be proportionatelyintegrated in the operating management Group reports on which operating management relies in theirdecision making.
Indeed, operating management considers this information to measure the operating performance and toinform their decision making. Consequently, the operating data presented in this document is“adjusted” to reflect the contribution of companies under joint control, and is therefore consistent withhistorical data.
As regards the Profit & Loss, it concerns all aggregates down to the EBIT. As regards the cash flowstatement, it concerns all aggregates down to the free cash flow.
We systematically present the reconciliations between the IFRS data and the adjusted data, incompliance with the AMF's instructions. Reconciliations are provided on slides 50 and 51.
IMPLEMENTATION OF IFRS 11
49

2015 2014
In million Euros Adjusted
Impact of
companies
under joint
control
IFRS Adjusted
Impact of
companies
under joint
control
IFRS
► Revenue 3,207.6 (400.5) 2,807.1 2,813.3 (331.1) 2,482.2
• Operating costs (2,512.4) 288.0 (2,224.4) (2,183.3) 232.1 (1,951.2)
► Operating margin 695.2 (112.5) 582.7 630.0 (99.0) 531.0
• Maintenance spare parts (46.8) 1.4 (45.4) (42.1) 1.2 (40.9)
• Amortization and provisions (net) (261.4) 22.9 (238.5) (254.2) 19.0 (235.2)
• Other operating income / expenses (15.6) 0.8 (14.8) 1.2 0.9 2.1
► EBIT before impairment charge 371.4 (87.4) 284.0 334.9 (77.9) 257.0
• Net impairment charge (1) (13.9) - (13.9) (31.8) 7.1 (24.7)
► EBIT after impairment charge 357.5 (87.4) 270.1 303.1 (70.8) 232.3
RECONCILIATION BETWEEN ADJUSTED FIGURES AND IFRS FIGURES – PROFIT & LOSS
50
(1) Including impairment charge on net assets of companies under joint control.

2015 2014
In million Euros Adjusted
Impact of
companies
under joint
control
IFRS Adjusted
Impact of
companies
under joint
control
IFRS
► Funds from operations net of maintenance costs 536.6 (21.6) 515.0 494.6 (20.8) 473.8
• Change in working capital requirement 26.2 (4.4) 21.8 3.5 3.4 6.9
► Net cash flow from operating activities 562.8 (26.0) 536.8 498.1 (17.4) 480.7
• Capital expenditure (229.4) 27.5 (201.9) (200.2) 32.1 (168.1)
► Free cash flow 333.4 1.5 334.9 297.9 14.7 312.6
RECONCILIATION BETWEEN ADJUSTED FIGURES AND IFRS FIGURES – CASH FLOW STATEMENT
51

FINANCIAL DEFINITIONS
Operating margin
Revenue less Direct Operating Expenses (excluding Maintenance spare parts) less SG&A expenses
EBIT (Earnings Before Interests and Taxes)
Operating Margin less Depreciation, amortization and provisions (net) less Impairment of goodwill less
Maintenance spare parts less Other operating income and expenses
Free cash flow
Net cash flow from operating activities less capital investments (property, plant and equipment and intangible
assets) net of disposals
Net debt
Debt net of managed cash less bank overdrafts, excluding the non-cash IAS 32 impact (debt on commitments to
purchase minority interests), including the non-cash IAS 39 impact on both debt and hedging financial derivatives
52

FORWARD LOOKING STATEMENTS
This presentation may contain some forward-looking statements. These statements are
not undertakings as to the future performance of the Company. Although the Company
considers that such statements are based on reasonable expectations and assumptions
on the date of publication of this release, they are by their nature subject to risks and
uncertainties which could cause actual performance to differ from those indicated or
implied in such statements.
These risks and uncertainties include without limitation the risk factors that are described
in the annual report registered in France with the French Autorité des Marchés
Financiers.
Investors and holders of shares of the Company may obtain copy of such annual report
by contacting the Autorité des Marchés Financiers on its website www.amf-france.org or
directly on the Company website www.jcdecaux.com.
The Company does not have the obligation and undertakes no obligation to update or
revise any of the forward-looking statements.53
