amec foster wheeler plc 2015 results - zonebourse.com€¦ · 1 amec foster wheeler plc 2015...
TRANSCRIPT

1
Amec Foster Wheeler plc 2015 results
Summary:
2015 trading performance and proposed final dividend of 14.2p in line with November update
Year end net debt £946m lower than guidance, with £50m Longview settlement paid in Q1 2016
GPG: non-cash impairment charge of £308m in 2015
£6.6bn order book gives confidence for the year ahead
Refinancing completed in March 2016
Objective to halve net debt over next 15 months, through non-core disposals (including GPG) and cash generation
Search for new CEO progressing well
2015 Key performance measures1
£m unless stated 2015 2014 PF2 Underlying change3 2014 reported
Continuing operations
Revenue 5,455 5,800 -7% 3,993 Trading profit4 374 457 -19% 321 Trading margin 6.9% 7.9% -100bps 8.0% Trading cash flow 388 - - 283 Cash conversion 104% - - 88% Adjusted diluted earnings per share 67.7p - - 79.5p Dividend per share 29.0p5 - -33% 43.3p Order book (bn) 6.6 6.3 +4% 6.3
2015 Reported under IFRS
£m unless stated 2015 2014 Change
Continuing operations
Revenue 5,455 3,993 +37%
(Loss)/profit before net financing expense (205) 148 -
(Loss)/profit before tax (235) 155 -
Cash flow from operations 220 200 +10%
Diluted (loss)/earnings per share (66.1)p 35.1p -
Ian McHoul, Chief Financial Officer and interim CEO said:
“Our 2015 trading performance was in line with our November update. We expect the challenging market conditions to continue for the foreseeable future and our priorities remain the same. “Our focus is to maintain our solid operational performance and drive our cost reduction and efficiency programmes. We are also making good progress with our portfolio review, and have identified a number of non-core assets, including GPG, which we intend to sell over the next 15 months. We are targeting to halve our net debt over this timeframe, from disposal proceeds together with the cash generated from our core businesses. The successful refinancing we announced last week further strengthens our position. “2016 is expected to be another year of challenging market conditions across upstream Oil & Gas and Mining. However, our exposure to a number of end markets, including downstream Oil & Gas, renewables and government work means we expect to see only a slight fall in like-for-like revenue, and a reduction in trading margins significantly less than the decline in 2015.” Contacts: Amec Foster Wheeler plc
Julian Walker (media) Rupert Green (investors)
+ 44 (0)20 7429 7500
Brunswick Group LLP Mike Harrison/Stuart Donnelly + 44 (0)20 7404 5959
Notes:
1) Adjusted performance measures used by the group are reconciled to the equivalent IFRS measures in ‘Performance measures’ 2) Unaudited pro forma information provided for comparative purposes only, assuming the AMEC and Foster Wheeler businesses had
been combined from 1 January 2014. A full description of the adjustments can be found at the beginning of ‘Performance measures’ 3) Excluding the impacts of currency movements and bolt-on acquisitions, measuring change from 2014 pro forma 4) Trading profit represents profit before net financing expense excluding exceptional items, the amortisation and impairment of
intangible assets and asbestos-related costs (net of insurance recoveries) and the impairment charge at GPG. Trading profit includes the group’s share of the trading profit of joint ventures
5) Includes the proposed final dividend for 2015 of 14.2p per ordinary share

2
Results presentation:
We will host a presentation on the results for analysts and investors at 8.30am today (UK time) at the offices of Nomura International, One Angel Lane London EC4R 3AB. For those unable to attend, dial-in details: UK 020 3059 8125, international +44 20 3059 8125, participant password: 889763
Analyst consensus estimates:
Regularly updated on our website at amecfw.com/investors/consensus-estimates.htm
Notes to editors:
Amec Foster Wheeler (www.amecfw.com) designs, delivers and maintains strategic and complex assets for its customers across the global energy and related sectors.
Employing around 40,000 people in more than 55 countries and with 2015 revenues of £5.5 billion, the company operates across the oil and gas industry – from production through to refining, processing and distribution of derivative products – and in the mining, clean energy, power generation, pharma, environment and infrastructure markets.
Amec Foster Wheeler offers full life-cycle services to offshore and onshore oil and gas projects (conventional and unconventional, upstream, midstream and downstream) for greenfield, brownfield and asset support projects, plus leading refining technology.
Amec Foster Wheeler shares are publicly traded on the London Stock Exchange and its American Depositary Shares are traded on the New York Stock Exchange. Both trade under the ticker AMFW.

3
Segmental review by business units
With effect from 1 January 2015, the group adopted new geographical operating segments within its E&C business: Americas; Northern Europe & CIS; and Asia, Middle East, Africa & Southern Europe. The Global Power Group continues to be reported as a separate operating segment. In this section, all 2014 numbers are provided on a pro forma basis, as if the AMEC and Foster Wheeler businesses had combined on 1 January 2014. A full description of the adjustments can be found in the ‘Performance measures’ section. We have decided to cease reporting ‘scope revenue’ and focus on a single revenue line. For convenience for this set of results, we have included scope revenue disclosure in the operating and financial review (see page 10). Americas
Americas is the largest business unit, with substantial positions in each of our four markets: Oil & Gas, Mining, Clean Energy, and Environment and Infrastructure. We support our customers in consulting, through the EPC project lifecycle (including engineering, procurement, project management and construction), into operations & maintenance, and remediation and reinstatement.
£m unless stated 2015 2014 Change Underlying
change
Revenue 2,646 2,705 -2% -3%
Profit before net financing expense 94 - Intangibles amortisation and impairment 46 - Exceptional items 22 - Share of trading profit of joint ventures (1)
Trading profit1 161 258 -38% -36%
Trading margin1 6.1% 9.6% -350bps Order book £2.0bn £2.0bn -
Revenue by market (£m) 2015 2014 Change Underlying
change
Oil & Gas 1,067 1,130 -6% -7% Mining 295 369 -20% -20% Clean Energy 821 785 +5% +3% Environment & Infrastructure 463 421 +10% -+7%
2,646 2,705 -2% -3%
1 Non-IFRS measure (see ‘Performance measures’)
Revenue in Americas was £2,646 million (2014: £2,705 million), a decrease of 2%. Excluding the effect of bolt-on acquisitions and currency movements, underlying revenue was down 3%. Growth in underlying revenue in the downstream Oil & Gas, Clean Energy and E&I, was offset by declines in upstream Oil & Gas and Mining. Trading profit fell by 38% to £161 million (2014: £258 million), as a result of pricing pressure in the Oil & Gas market. Trading margin was 6.1%, down by 350 basis points compared with 2014, due to an increased proportion of EPC in our scope, particularly in downstream Oil & Gas and Clean Energy. Key Oil & Gas projects currently underway include oil sands work for Imperial Oil, Syncrude, CNRL, Suncor and Shell among others. In downstream, we continue to work, with a reduced scope, on a propane dehydrogenation project in Texas for Enterprise Products and on projects for LyondellBassell and Dow. In Latin America we continue to build our relationship through project activity with PEMEX in Mexico and Ecopetrol in Colombia. Mining activity in project delivery includes a number of copper, gold and potash projects for Codelco, Newmont, Thompson Creek and K+S Potash. In E&I we are working on site remediation programmes for Honeywell and Duke. During 2015 we completed the 250 MW Copper Mountain III solar project for Sempra US Gas & Power, and we are now working on multiple significant new solar projects for Sempra. The renewables market in the US is expected to remain attractive for the next few years, helped by the recent extension of investment tax credits by the US Congress. We have a strong pipeline of similar projects in the US with a number of customers.

4
Contract wins announced in the period included:
Customer Market Description Country
Shandong Yuhuang
O&G Engineering, project management, procurement and early construction services for a new methanol plant in Louisiana
USA
D’Arcinoff O&G Engineering and design work for West Texas Renewable and Gas Monetisation project
USA
Canadian Nuclear Laboratories
CE Long term remediation project, including building waste management facility at Port Granby
Canada
Freeport McMorRan
CE Design and supply wet flue gas desulphurisation system USA
US Air Force E&I 6-year contract to support the AFCAP IV programme USA Northern Europe & CIS (NECIS)
Operating from more than 120 locations in 15 countries, our NECIS business unit focuses on three of our markets: Oil & Gas, Clean Energy and Environment & Infrastructure. The largest exposure is to Oil & Gas, with a strong position in the North Sea and we are one of the largest service providers to the UK nuclear industry.
£m unless stated 2015 2014 Change Underlying
change
Revenue 1,492 1,705 -12% -13%
Profit before net financing expense 60 - Intangibles amortisation and impairment 41 - Exceptional items 13 - Share of trading profit of joint ventures 20
Trading profit1 134 137 -2% -5%
Trading margin1 9.0% 8.0% +100bps Order book £2.4bn £2.3bn +4%
Revenue by market (£m) 2015 2014 Change Underlying
change
Oil & Gas 1,125 1,307 -14% -15% Mining 1 - - - Clean Energy 320 344 -7% -6% Environment & Infrastructure 46 54 -15% -15%
1,492 1,705 -12% -13%
1 Non-IFRS measure (see ‘Performance measures’)
Revenue in NECIS fell by 12% to £1,492 million (2014: £1,705 million), primarily due to a downturn in Oil & Gas project activity. Excluding the effect of bolt-on acquisitions and currency movements, underlying revenue was down 13%. Trading profit decreased by 2% to £134 million (2014: £137 million). Trading margin was 9.0%, up 100 basis points compared with 2014. Less procurement, favourable contract settlements and cost savings initiatives boosting the margin. Key Oil & Gas projects worked on during the year included hook up and commissioning of BP Clair Ridge and GDF Cygnus, BP Shah Deniz 2 in Azerbaijan plus brownfield projects for Conoco, BP and Talisman. In addition we continue to work on a number of long term support contracts with the likes of Conoco, BG, Shell, Centrica and BP and the Maersk integrated services contract awarded during the year. Ongoing Clean Energy projects include reactor services support work for EDF’s nuclear power stations in the UK and ongoing clean-up work at the Sellafield site, as well as framework agreements with National Grid, Scottish Power and SSE.

5
Contract wins announced in 2015 included:
Customer Market Description Country
Petroineos O&G FEED for Grangemouth refinery upgrade UK
BP O&G 2-year EPC contract to improve living quarters in Eastern Trough Area Project
UK
Maersk Oil O&G 3-year integrated services contract UK
BP O&G 5-year operations and maintenance contract for Forties pipeline system
UK
Apache O&G 3-year contract for commissioning services UK
BP O&G 3 contract scopes on BP Glen Lyon FPSO UK
SP Energy Networks
CE Design, supply and construction of overhead power lines in Scotland UK
Fusion For Energy
CE 7-year contract for development of and delivery of a neutral beam cell remote handling system
France
Sellafield CE 10-year contract to supply radioactive waste analysis UK
NDA CE 4-year decommissioning and research framework contract UK
EDF CE 9-year project management contract to UK nuclear fleet UK
MoD E&I 3-year contract to supply regulatory, technical and training services to MoD nuclear safety authority
UK
Asia, Middle East, Africa & Southern Europe (AMEASE)
AMEASE is a diverse region with our people spread across more than 40 locations. We now have enhanced capabilities and significantly increased customer reach which positions us well for growth across all four of our markets - Oil & Gas, Environment & Infrastructure, Mining and Clean Energy.
£m unless stated 2015 2014 Change Underlying
change
Revenue 1,050 1,031 +2% +2%
Profit before net financing expense 13 - Intangibles amortisation and impairment 23 - Exceptional items 28 - Share of trading profit of joint ventures 4
Trading profit1 68 53 +27% +18%
Trading margin1 6.5% 5.2% +130bps Order book £1.8bn £1.6bn +6%
Revenue by market (£m) 2015 2014 Change Underlying
change
Oil & Gas 829 833 - +2% Mining 83 114 -27% -40% Clean Energy 10 10 - - Environment & Infrastructure 128 74 +73% +78%
1,050 1,031 +2% +2%
1 Non-IFRS measure (see ‘Performance measures’)
Revenue in AMEASE was up 2% year on year at £1,050 million (2014: £1,031 million), driven by an increase in US government work and reduction in Mining work. Excluding the effect of bolt-on acquisitions and currency movements, underlying revenue was up 2%. Trading profit rose by 27% to £68 million (2014: £53 million), reflecting higher contributions from Oil & Gas and E&I. Trading margin was 6.5%, up 130 basis points compared with 2014, due to the early benefits of cost saving initiatives and favourable contract settlements. In Asia, our key upstream Oil & Gas projects include providing asset support for ConocoPhillips' Bayu-Udan gas facilities in the East Timor Sea, operational readiness services for Chevron’s Wheatstone facility offshore Australia, and onshore

6
turnaround and maintenance support to ENI’s onshore gas treatment plant and offshore unmanned wellhead platform, also in Australia. Oil & Gas downstream projects include front end design for the expansion of the Dung Quat refinery in Vietnam for Binh Son Refining Company and two work packages at ExxonMobil’s new halobutyl rubber and hydrocarbon resins plant in Singapore. During 2015 we completed EPCm services for new synthetic rubber plants in Singapore and China for Lanxess. In the Middle East we are providing technical and project management services on the Upper Zakum project for Zadco, supporting KNPC’s new oil refinery at Al Zour and delivering the propylene oxide plant at Jubail for Sadara Chemical Company. Iraq remains an important market for us, as we support various IOCs as they develop the oil & gas fields in southern Iraq. In Africa, we are continuing our work on a gas project in Mozambique and providing PMC support to ENI in Ghana, and on the Husab uranium project in Namibia. We continue to seek to offer our services in new geographies and with new customers across the continent. In E&I and Clean Energy we are leveraging our existing market footprint, particularly looking at new prospects in Saudi Arabia and the UAE. Contract wins announced in 2015 included:
Customer Market Description Country
Sonatrach O&G Consultancy project to de-bottleneck Hassi R’Mei gas field Algeria
Zadco O&G 3-year extension to PMC services contract on Upper Zakum project UAE
Vietnam National Oil & Gas
O&G FEED for Dung Quat refinery upgrade Vietnam
SKS O&G Feasibility study for a new refinery and petchem complex in Kedah State
Malaysia
Gov of Timor-Leste
O&G Pre-FEED for the proposed Beaço LNG plant Timor-Leste
Orpic O&G 3-year technical services contract for refinery and polypropylene facilities
Oman
Shenhua Ningxia Coal
O&G 3-year project management contract at a coal-chemical complex China
SKS O&G Consultancy services to a new refinery and pet-chem complex in Kedah
Malaysia
Anagold Madencilik
Mining Initial phase reimbursable EPC for the Çőpler Gold Mine Turkey
NDF CE Study into managing radioactive waste at Fukushima Japan
US Air Force E&I Design and construction of specialist facilities Guam

7
Global Power Group (GPG)
GPG has market-leading capabilities in the design, supply and erection of circulating fluidised bed (CFB) boilers, a wide range of steam generators, air pollution control equipment and a full array of related of aftermarket products and services. Customers include utilities, independent power producers, and industrial concerns.
£m unless stated 2015 2014 Change Underlying
change
Revenue 364 454 -20% -20%
Loss before net financing expense (302) - Intangibles amortisation and impairment 334 - Exceptional items 4 - Share of trading profit of joint ventures 15
Trading profit1 51 69 -26% -31%
Trading margin1 14.0% 15.2% -120bps Order book £0.4bn £0.4bn -
1 Non-IFRS measure (see ‘Performance measures’) Revenues in GPG fell by 20% to £364 million (2014: £454 million), primarily driven by a decline in project activity. On an underlying basis, revenue was also down 20%. Trading profit fell by 26% to £51 million (2014: £69 million). Trading margin was 14.0%, down 120 basis points, driven by pricing pressure in weak market conditions and lower resource utilisation, and reflecting the non-recurrence of £20m one-off income from a license settlement in 2014.
Key project activity includes the erection of the 4 x 550MWe Samcheok ultra-supercritical CFB boilers, the largest CFB units in the world. Commercial operation is expected in 2016. Other current projects include Thai Binh pulverised coal (PC) units in Vietnam, Soma Kolin CFB units in Turkey and three heat recovery steam generator (HRSG) projects in Mexico. The new business pipeline still includes future work worth over US$500 million for projects on which GPG has been selected as the supplier, that are awaiting the go-ahead from customers (and therefore not yet recorded in our order book).
Contract wins announced in 2015 included:
Customer Description Country
Avanzia & Intec Energia
Design and supply of 2x HRSGs for Valle de Mexico II CCG power plant Mexico
Isolux Design and supply of air quality systems at Altamira power plant Mexico
Hanwha Energy
Design and supply of 100MW CFB boiler S Korea
Hyundai Design and supply 2x 150MW CFB boilers in Cebu Philippines
Fortum Zabrze
Design, supply construction and commissioning of 220MW CFB boiler in Zabrze
Poland
RWE Engineering services and permitting in support of 2x 550MW CFB boilers project in Niederraussem
Germany
GPG’s results for 2015 and forecasts for 2016 and beyond are well down on earlier expectations giving rise to an impairment in goodwill of £308m. Further information can be found in note 9.
As part of the portfolio review announced in November 2015, GPG has been designated as non-core. As a result, the board has decided to explore the sale of GPG.

8
Operations update
We launched the new operating model on 1st January alongside which we have re-focused our efforts on our safety programme “Beyond Zero”. We are committed to maintaining a strong and sustainable safety culture across all of our operations, in order to deliver a world-class safety performance. The integration of AMEC and Foster Wheeler is on track, and along with other cost saving initiatives, we have identified actions that will be completed this year that are due to deliver £130 million of ongoing benefits, with the full benefit in 2017 and thereafter. In 2015 we have delivered £50 million of savings, and taken an exceptional charge of £91 million. We continue to seek further efficiencies. Portfolio review
On 5 November 2015, we announced a review of our portfolio of assets. Since then, a number of assets have been identified as no longer being core to the future of the business. The board believes selected disposals can make the major contribution to its objective of halving the Group’s net debt over the next 15 months. As described above, the board has decided to explore the sale of GPG, and advisers have been appointed. Financing update
On 2 March 2016 we announced we had completed the refinancing of our main debt facilities by entering into a new facility with a syndicate of 20 banks. The new facility, which has three tranches - a three-year £650 million term loan, a five-year £650 million term loan and a five-year £400 million revolving credit facility - replaces the company’s existing revolving credit facility and the Foster Wheeler acquisition facility. The interest cover covenant of more than 3.0x remains unchanged, while the net debt to EBITDA covenant is increased to less than 3.75x for the first two years, and becomes less than 3.5x thereafter. No capital repayments are required to be made until 2019 under the terms of the facility. The syndication process was oversubscribed and banks were duly scaled back. The pricing of the facility is in line with previous guidance, and upfront fees were in line for a facility of this type. We have current credit ratings from Moody’s (Ba1, stable outlook) and Standard & Poors (BB+, negative outlook). Pension update
Following an employee consultation exercise at the end of 2015, the Company has now confirmed its intention to close the UK staff and executive Defined Benefit pension schemes to future accrual from 1 April 2016 and replace them with a new Defined Contribution arrangement. Subject to gaining the necessary Trustee approvals, all legacy Defined Contribution plans in the UK will be merged into the new arrangement by 30 June 2016. Dividends
The board recommends a final dividend of 14.2p per share. Together with the interim dividend of 14.8p per share, this results in a total dividend of 29.0p per share for the full year. Subject to approval by shareholders at the AGM on 27 April 2016, the final dividend will be payable on 4 July 2016 to shareholders on the register at the close of business on 27 May 2016. Dividend cover for 2015 is 2.3 times based on adjusted diluted EPS from continuing operations. As announced in November 2015, it is the current intention of the board that ordinary dividends in 2016 will be approximately half that declared in 2014, with approximately one-third paid at the interim, and two-thirds as a final dividend.

9
Board changes
During 2015 there were two changes to the board. Kent Masters joined the board as a non-executive director in February and Simon Thompson retired as a non-executive director after the AGM in May. In September 2015, we announced that Roy Franklin would join the board as a non-executive on 1 January 2016. On 18 January 2016, it was announced that Samir Brikho had stepped down as Chief Executive with immediate effect. Ian McHoul has been appointed into the role of interim CEO and is chairing the Group Leadership Team (in addition to being Chief Financial Officer) whilst the search for the new CEO is conducted. Ian is not putting himself forward for the role on a permanent basis.
The search for the new CEO is progressing well. An update will be provided when appropriate.
Outlook statement
2016 is expected to be another year of challenging market conditions across upstream Oil & Gas and Mining. However, our exposure to a number of more resilient end markets, including downstream Oil & Gas, renewables and government work reduces the impact of this. For the full year 2016, we expect to see only slight like-for-like revenue decline, with a reduction in trading margins significantly less than the decline in 2015. As in recent years, we anticipate a working capital outflow in the first half reversing in the second half. Net debt is expected to be circa £1 billion at the year end, including the impact of the Longview payment paid in March 2016, but excluding any proceeds from disposals. The board believes selected disposals can make the major contribution to its objective of halving the Group’s net debt over the next 15 months.

10
Operating and financial review Basis of preparation
Accounting policies
The group’s consolidated financial statements for the year ended 31 December 2015 have been prepared in accordance with IFRS as adopted for use in the EU and those parts of the Companies Act 2006 that are applicable to companies reporting under IFRS. From the group’s perspective, there are no differences between IFRS as adopted for use in the EU and IFRS as issued by the IASB. The group’s principal accounting policies during 2015 were unchanged compared with 2014. Restatement
On 13 November 2014 (the acquisition date), the group acquired 95.3 per cent of the issued share capital of Foster Wheeler AG. Due to the relatively short period of time between the acquisition date and 31 December 2014, management had not finalised its assessment of the fair value s of certain of Foster Wheeler’s assets and liabilities at the time that the 2014 financial statements were completed, and as a result, the 2014 financial statements reflected the provisional assessment of the fair values as at the acquisition date. During 2015, management has completed the fair value assessment and the comparative amounts shown in the Balance Sheet, Statement of Comprehensive Income, Statement of Changes in Equity and Cash Flow Statement have been restated to reflect changes made to the carrying amounts of assets and liabilities recognised on the acquisition of Foster Wheeler, details of which are set out in note 12. As the acquisition of Foster Wheeler AG in November 2014 represented more than 90% of Foster Wheeler’s issued share capital, the acquisition qualifies for merger relief under section 612 of the Companies Act 2006 from crediting the share premium that arose on the new shares issued in consideration for Foster Wheeler to a share premium account. The balance sheet as at 31 December 2014 has been restated to present the excess of the nominal value of the shares issued of £877m as a merger reserve. Adjusted performance measures
We report adjusted performance measures because they provide both management and investors with useful additional information about the underlying trading performance of the business. The adjusted performance measures that we reported excluded the amortisation and impairment of intangible assets, exceptional and asbestos –related items and, where relevant, the tax effects of those items. Adjusted performance measures used by the group are reconciled to the equivalent IFRS measures in the section entitled ‘Performance measures’. Continuing operations Revenue
Following the acquisition of Foster Wheeler, revenue for the year of £5,455m was 37% higher than last year (2014: £3,993m). Following its acquisition in November 2014, Foster Wheeler contributed £274m to the group’s revenue in 2014. Revenue increased by £462m in the Americas, by £199m in NECIS and £534m in AMEASE, and in addition there was a full year’s revenue in the Global Power Group of £364m (2014: £53m). On a pro-forma basis and excluding the effect of currency movements and bolt-on acquisitions, underlying revenue decreased by 7%. Underlying revenue from E&I was up 14% underpinned by growth in US government work and Clean Energy was up 2%, but Oil & Gas was down 8% with Mining and GPG down 24% and 20% respectively. Scope revenue at £5,176m was 6% lower than last year (2014: £5,493m). This includes scope revenue of £2,577m in the Americas, £1,448m for NECIS and £884m for AMEASE. Administrative expenses
Administrative expenses were £872m (2014: £354m), including exceptional items, intangibles amortisation and impairment and asbestos-related costs (net of insurance recoveries) of £538m (2014: £135m). Administrative expenses before intangibles amortisation and impairment, exceptional items and asbestos-related items increased by £115m following the Foster Wheeler acquisition, the impact of which was partly offset by cost savings achieved to date. Corporate costs, which comprise the costs of operating central corporate functions and certain regional overheads, were £23m higher at £54m (2014: £31m) reflecting the enlarged group.

11
(Loss)/profit before net financing expense
There was a loss before net financing expense of £205m (2014:profit of £148m) as the profit generated by Foster Wheeler has been offset by an impairment charge of £308m in the Global Power Group business and higher intangible amortisation resulting from the intangible assets recognised on the acquisitions of Foster Wheeler and Scopus in 2014. Amortisation and impairment of intangible assets
Intangible assets principally comprise goodwill and identifiable intangible assets that were recognised in relation to acquired businesses. Goodwill is not amortised but is subject to an annual impairment test. The results of the Global Power Group for 2015 and forecasts for 2016 and beyond are well down on earlier expectations giving rise to an impairment in goodwill of £308m. In addition, there has been a £7m impairment to the order backlog intangible asset arising on the Foster Wheeler acquisition. No impairments were recognised in 2014. Intangibles amortisation was £129m (2014: £49m) reflecting the full-year amortisation of intangible assets recognised on the acquisitions of Foster Wheeler and Scopus completed in 2014. Exceptional and asbestos-related items
Net exceptional and asbestos-related costs totalling £115m (2014: £107m) were recognised in arriving at profit before tax from continuing operations, as follows:
costs of £97m relating to the integration of Foster Wheeler and AMEC (including internal staff costs associated with identifying and achieving cost synergies);
a £5m loss incurred following an unauthorised payment made from the Australian business and not expected to be recovered; and
£13m amortisation of facility fees associated with the acquisition of Foster Wheeler.
During the year ended 31 December 2015, the group recognised net asbestos-related income of £6m (2014: costs of £9m) in profit before net financing expense, which related to the movement in the discount rate applied to the net asbestos-related liabilities assumed on the acquisition of Foster Wheeler of £5m and experiential gains of £9m as the liability is reassessed on an annual basis. In addition, there was an asbestos-related interest expense of £7m related to the unwinding of the discount applied to the liability and costs of £1m associated with managing the liability.
Trading profit and trading margin
£m unless stated 2015 2014 Change
Underlying
change1
Revenue 5,455 3,993 +37% -7%
Loss/(profit) before net financing expense (205) 148 - Amortisation and impairment of intangibles 444 49 - Net asbestos-related (income)/costs (13) 8 - Exceptional items 108 94 - Share of trading profit of joint ventures 40 22
Trading profit1 374 321 +17% -20%
Trading margin1 6.9% 8.0% -110bps -100bps Order book £6.6bn £6.3bn +5%
1 Non-IFRS measure (see ‘Performance measures’)
Trading profit increased by 17% to £374m (2014: £321m). Trading margin decreased by 110 basis points to 6.9% (2014: 8.0%). On a pro forma basis and excluding the effect of currency movements and bolt on acquisitions, trading profit was £83m lower than 2014 with reductions in the Americas and Northern Europe & CIS partly offset by growth in Asia, Middle East, Africa & Southern Europe. Within the Americas, trading profit fell by 36% on an underlying basis, as a result of pricing pressure in the Oil & Gas market and trading margin was down by 350 basis points compared with 2014, due to an increased proportion of EPC in our scope, particularly in downstream Oil & Gas and Clean Energy and pricing pressure from oil & gas clients. Within Northern Europe & CIS, trading profit decreased by 5% but trading margin was 9.0%, up 100 basis points compared with 2014, with less procurement, favourable contract settlements and cost savings initiatives boosting the margin. In Asia, Middle East, Africa & Southern Europe trading profit rose by 18%, reflecting higher contributions from Oil & Gas and E&I. Trading margin was 6.5%, up 130 basis points compared with 2014, due to the early benefits of cost saving initiatives and favourable contract settlements.

12
Net financing expense
Net financing expense was £58m (2014: £5m), of this expenses of £20m (2014:£5m) have been presented separately on the income statement relating to £13m amortisation of the facility fees associated with the Foster Wheeler acquisition and £7m (2014: £1m) due to the unwinding of the discount on asbestos-related liabilities (net of insurance recoveries). Of the remaining £38m there was bank interest payable of £31m (2014: £7m), net foreign exchange losses of £1m (2014: £nil), and net interest expense on pension assets and liabilities of £2m (2014: income of £1m) and other costs classified as financing of £4m (2014: £1m). A net currency exchange loss of £3m (2014: £4m) was recognised in the translation reserve in respect of foreign currency borrowings and derivatives held in designated net investment hedging relationships. Share of results of joint ventures
The group’s share of joint ventures’ profit for the year was £28m (2014: £12m). (Loss)/profit before tax
The loss before tax was £235m (2014: profit of £155m) after intangibles amortisation and impairment of £444m (2014: £49m), exceptional and asbestos-related items of £115m (2014: £107m) and the group’s share of joint ventures’ tax expense of £10m (2014: £6m). Adjusted profit before tax was 5% higher at £334m (2014: £317m). Taxation
Our tax policy is to manage our obligations in compliance with all relevant tax laws, disclosure requirements and regulations. We seek to ensure that our approach to tax and the tax payments that we make in all territories in which we have operations are fully consistent with local requirements, taking into account available tax incentives and allowances, and are aligned with the group’s wider business strategy. We seek to develop good, open working relationships with tax authorities and to engage with them proactively, recognising that tax legislation can be complex and may be subject to differing interpretations. The group’s effective tax rate on continuing operations (including its share of joint ventures’ income tax expense but before exceptional items, intangibles amortisation and impairment and asbestos-related items) reduced to 22.0% (2014: 23.0%). We expect the effective tax rate to remain below 25%. During 2015, there was a tax credit on exceptional items of £18m (2014: tax credit of £6m), and a tax credit of £27m on intangibles amortisation and impairment (2014: £12m). The group’s share of joint ventures’ income tax expense was £10m (2014: £6m). (Loss)/profit for the year from continuing operations
The loss for the year from continuing operations was £253m (2014: profit of £106m) after intangibles impairment and amortisation of £444m (2014: £49m), the net asbestos-related £6m (2014: expense of £9m), net exceptional items of £121m (2014: £98m), an income tax credit on those items of £45m (2014: charge of £18m). Adjusted profit for the year from continuing operations was 7% higher at £261m (2014: £244m). Non-controlling interests
During 2015, there was a loss of £1m attributable to non-controlling interests (2014: loss of £3m). Earnings per share
The diluted loss per share was (67.2)p (2014: EPS of 26.5p), comprising loss per share of (66.1)p (2014: EPS of 35.1p) from continuing operations and a loss of (1.1p) (2014: EPS of 8.6p) from discontinued operations. Adjusted diluted EPS from continuing operations was 67.7p (2014: 79.5p), the reduction being due to the decline in the profit for the year from continuing operations and the increase in the number of shares in issue as a consequence of the acquisition of Foster Wheeler. Dividend
The Board recommends a final dividend of 14.2p per share, which, together with the interim dividend of 14.8p per share, results in a total dividend of 29.0p per share (2014: 43.3p), a reduction of 33%. Subject to approval by shareholders at the AGM on 27 April 2016, the final dividend will be payable on 4 July 2016 to shareholders on the register at the close of business on 27 May 2016. Dividend cover for 2015 is 2.3 times (2014: 1.8 times) based on adjusted diluted EPS from continuing operations. As announced in November 2015, it is the current intention of the Board that ordinary dividends in 2016 will be approximately half that declared in 2014, with approximately one third paid at the interim, and two thirds as a final dividend. Discontinued operations

13
Discontinued operations represent the residual assets and retained obligations of businesses sold in prior years, together with the UK conventional power business that was classified as a discontinued operation during 2014. Discontinued operations generated a trading loss before tax of £6m (2014: loss of £10m) and after a tax credit of £1m (2014: £2m) generated a loss for the year of £5m (2014: loss of £8m). During 2014, negative revenue of £13m was recognised due to the settlement of final accounts and additional provisions on certain contracts within the UK conventional power business. Discontinued operations included a profit on disposals of £1m (2014: loss £23m) arising from movements in indemnity provisions and costs associated with businesses sold in prior years. In 2014, the loss on disposals included a provision of £11m in respect of a new claim received in the year related to a contract completed by the Built Environment business which was sold in 2007. Discontinued operations generated an overall loss for the year of £4m (2014: £27m). Acquisitions
There were no acquisitions during 2015. Acquisition of Foster Wheeler in 2014
On 13 November 2014, the group acquired a 95.3% interest in Foster Wheeler AG by way of a public tender offer. Consideration payable for the interest acquired totalled £1,915m, of which £979m was settled in cash, £919 m was
settled by the issue of approximately 85m of the Company’s ordinary shares and £17m was sett led by the grant of replacement share options and awards.
During 2015, management completed its assessment of the net identifiable assets of Foster Wheeler as at the
acquisition date. This resulted in the recognition of goodwill of £1,726m on the acquisit ion of Foster Wheeler. In January 2015, the group acquired the remaining 4.7% interest in Foster Wheeler AG by way of a ‘squeeze-out merger’ under Swiss law for consideration of £85m, of which £51m was paid in cash and £34m was settled by the issue of 4.3m of the Company’s ordinary shares and ADSs.
Further details of the acquisition of Foster Wheeler are set out in note 12 to the accompanying financial information.
Cash flow
Trading cash flow
Trading cash flow of £388m was £105m higher than last year (2014: £283m), principally due to the increase in trading profit following the acquisition. Cash conversion was strong at 104% (2014: 88%). Cash generated from operations
Cash generated from operations was £220m (2014: £200m), an increase of £20m with the £93m increase in trading cash flow partly offset by an increase of £27m in the cash outflow on exceptional items (principally integration-related costs). Purchases of property, plant and equipment and software
Purchases of property, plant and equipment and software were £36m in the year (2014: £31m). Additionally, in 2014, there were purchases of computer software amounting to £33m were financed using deferred payment arrangements. Acquisitions and disposals
During 2015 there was a cash outflow of £5m in respect of deferred consideration arrangements on prior year acquisitions. There was a cash outflow of £54m from the acquisitions of the non-controlling interest in Foster Wheeler and Kromav, this is presented within financing activities in the cash flow statement. During 2014, consideration paid on the acquisition of businesses was £1,049m, which comprised £982m for Foster Wheeler (including a currency hedging loss of £3m) and £67m for Scopus. The net cash outflow on acquisitions was £781m, after deducting cash and cash equivalents of £268m held by the acquired businesses.

14
Movement in net (debt)/cash
The movement in net (debt)/cash may be analysed as follows:
2015 2014
Year ended 31 December £m £m
Trading cash flow 388 283 Write off of finance arrangement fees (12) - Net asbestos-related payments (22) (5) Excess of retirement benefit contributions over current service cost (3) (2) Cash outflow on exceptional items (85) (58) Legacy settlements and discontinued operations (23) (9) Dividends received from joint ventures (42) (14) Exchange rate movements 19 5
Cash generated from operations 220 200 Income taxes paid (net) (79) (54) Interest paid (net) (35) (3) Capital expenditure (net of disposals) (36) (31) Acquisitions and disposals (net) (51) (876) Ordinary dividends (167) (124) Net share movements 10 6 Dividends received from joint ventures 42 14 Exchange and other movements 33 (7)
Cash movement in net debt (63) (875) Non-cash movements (80) (49)
Movement in net debt (143) (924) Opening net (debt)/cash (803) 121
Closing net debt (946) (803)
Net debt comprised:
2015 2014
As at 31 December £m £m
Cash and cash equivalents 307 377 Cash deposits 33 118 Cash deposits >3 months 23 21 Derivatives classified as net debt 14 - Bank loans (net of facility fees) (1,264) (1,258) Finance lease obligations (59) (61)
Net debt (946) (803)
Balance sheet Goodwill and other intangibles
As at 31 December 2015, the carrying amount of goodwill was £2,192m (2014: £2,516m), with the reduction during the year principally an impairment of £308m recognised against the goodwill attributable to the Global Power Group business. See note 9 for further details. As at 31 December 2015, the carrying amount of other intangibles was £833m (2014: £927m), which comprised acquired identifiable intangible assets of £753m (2014: £849m) and computer software of £80m (2014: £78m). There was an impairment charge of £7m recognised against the order back log intangible asset arising as part of the Foster Wheeler acquisition. Amortisation of £129m (2014: £49m) reflects a full year’s amortisation of the intangible assets arising on the Foster Wheeler and Scopus acquisitions, both in 2014. Property, plant and equipment
As at 31 December 2015, property, plant and equipment amounted to £127m (2014: £150m), with a reduction of £23m during the year due as the additions of £16m were more than offset by depreciation of £26m and other smaller movements. We hold the majority of the properties through which the group operates under operating leases which are for varying periods and on differing terms. The group has a network of over 350 offices worldwide, which range from regional hubs, with a headcount of between 1,000 and 2,500 employees, to smaller offices with more local focus. It is expected that the number of properties that are occupied by the group will be reduced following the integration of Foster Wheeler’s businesses. Due to the geographical spread of the group’s operations, there is no individual facility the loss of which would have a material adverse impact on the group’s operations. Equally, there are no plans to construct, expand or improve facilities that would, on completion or cancellation, significantly affect the group’s operations.

15
Post-retirement benefits
The group has a number of defined benefit pension plans in a number of countries. There are three principal plans: two in the UK and one in the US. Each of these plans is closed to new entrants and the two legacy Foster Wheeler plans are also closed to future service accruals. Following an employee consultation exercise at the end of 2015, the Company has now confirmed its intention to close its UK Staff and Executive Defined Benefit pension schemes to future accrual from 1 April 2016 and replace them with a new Defined Contribution arrangement. Subject to gaining the necessary Trustee approvals, all legacy Defined Contribution plans in the UK will be merged into the new arrangement by 30 June 2016. As at 31 December 2015, there was a net surplus of £63m on the group’s defined benefit pension plans (2014: deficit of £86m) principally due to actuarial gains in the defined benefit liability. During 2015, the group contributed £36m (2014: £32m) to defined benefit pension plans and expects to contribute £36m in 2016, including special contributions of £6m. Further information on the group’s retirement benefit plans is provided in note 11 to the accompanying financial information. Provisions
Provisions held at 31 December 2015 amounted to £664m (2014: £756m), with the substantial reduction during the year arising principally due to the utilisation of brought forward provisions of £64m. Otherwise, additional provisions of £33m were created and unutilised provisions amounting to £38m were released during 2015. In addition, there was an exchange movement of £22m on the opening balances Provisions may be summarised as follows:
2015 2014 As at 31 December £m £m
Asbestos-related litigation 378 400 Legal claims and actions 154 217 Obligations relating to disposed businesses 78 86 Property-related provisions 19 19 Other provisions 35 34
664 756
Asbestos-related obligations
The group is subject to claims by individuals who allege that they have suffered personal injury from exposure to asbestos primarily in connection with equipment allegedly manufactured by certain of their subsidiaries during the 1970s or earlier. As at 31 December 2015, the group recognised:
an asbestos-related provision of £414m (after the effect of discounting of £74m), which included estimates of indemnity amounts and defence costs for open and yet to be asserted claims expected to be incurred in each year in the period to 2050; and
insurance recoveries of £104m (after discounting of £4m). Management expects that there will be a net cash outflow of £22m during 2016 due to the excess of forecast indemnity
payments and defence costs over insurance proceeds.
Details of the provisions held by the group are set out in note 10 to the accompanying financial information. Non-controlling interests
As at 31 December 2015, non-controlling interests in equity amounted to £9m (2014: £29m), with the reduction during the year being principally due to the acquisition via a squeeze out merger, of the 4.7% non-controlling interest in Foster Wheeler AG that existed when the group took control of Foster Wheeler in November 2015 and was subsequently acquired by the group in January 2016. Going concern
Based on internal forecasts and projections that take into account reasonably possible changes in the group’s trading performance, the directors consider that the Company and the group have adequate financial resources to continue in operation. Accordingly, the directors continue to adopt the going concern basis in preparing the Company’s and the group’s financial statements.

16
Performance measures
Profitability measures
We use three measures of profitability that are not recognised measures under IFRS: trading profit, trading margin and
adjusted profit before tax.
As appropriate, we exclude the following specific items in arriving at these measures: exceptional items; the amortisation
and impairment of intangible assets; and asbestos-related costs (net of insurance recoveries). Exceptional items are items of income and expense that are material by their size, incidence or nature and may include, but are not restricted
to: acquisition-related costs; restructuring costs; gains and losses on the disposal of fixed assets; and gains and losses on the disposal or closure of businesses. Acquisition-related costs may include transaction costs (including external
advisory, legal, valuation and other professional fees and attributable internal costs), the amortisation of acquisition -related facility fees, payments to selling shareholders that are accounted for as remuneration and changes in the fair
value of contingent consideration.
Trading profit
Trading profit represents profit before net financing expense excluding exceptional items; the amortisation of intangible assets; and asbestos-related costs (net of insurance recoveries). Trading profit includes the group’s share of the trading
profit of joint ventures.
2015
£m 2014
£m
Continuing operations
(Loss)/profit before net financing expense (205) 148
Intangibles amortisation and impairment 444 49 Net asbestos-related (income)/costs (13) 8
Exceptional items 108 94 Share of trading profit of joint ventures 40 22
Trading profit 374 321
Trading margin
Trading margin represents trading profit expressed as a percentage of revenue.
£m unless stated 2015
£m 2014
£m
Continuing operations
Revenue 5,455 3,993 Trading profit 374 321
Trading margin 6.9% 8.0%
Adjusted profit before tax
Adjusted profit before tax represents profit before tax before exceptional items, the amortisation of intangible assets,
asbestos-related costs and interest expense (net of insurance recoveries), and the group’s share of tax on the results of joint ventures.
2015
£m 2014
£m
Continuing operations
(Loss)/profit before tax (235) 155 Exceptional items 121 98
Intangibles amortisation and impairment 444 49 Net asbestos-related (income)/costs (6) 9
Share of income tax of joint ventures 10 6
Adjusted profit before tax 334 317

17
Cash flow measures
Trading cash flow
Trading cash flow represents cash generated from operations before cash flows arising from exceptional items, asbestos -related payments (net of insurance recoveries), the difference between retirement benefits contributions and the current
service cost, legacy settlements and discontinued operations, and currency translation differences on working capital, but including dividends received from joint ventures.
2015
£m 2014
£m
Cash generated from operations 220 200
Net asbestos-related payments 22 5 Excess of retirement benefit contributions over current service cost 3 2
Cash outflow on exceptional items 85 58 Legacy settlements and discontinued operations 23 9
Currency translation differences (19) (5) Amortisation of finance arrangement fees 12 -
Dividends received from joint ventures 42 14
Trading cash flow 388 283
Cash conversion
Cash conversion represents trading cash flow expressed as a percentage of trading profit.
£m unless stated otherwise 2015 2014
Trading cash flow 388 283
Trading profit 374 321 Cash conversion 104% 88%
Other measures
Underlying change in revenue
We define the underlying change as the year-on-year change excluding the effect of exchange rate fluctuations on the translation into sterling of the results of foreign operations, and acquisitions and disposals of businesses.
2014 proforma
£m
Currency translation
£m Acquisitions
£m
Underlying change £million
2015 £million
Underlying change %
Continuing operations
Americas 2,705 34 - (93) 2.646 -3%
Northern Europe and CIS 1,705 (2) 16 (227) 1,492 -13% Asia, Middle East, Africa & Southern
Europe
1,031 (29)
27
21 1,050 +2%
Global Power group 454 2 - (92) 364 -20%
Investment Services 16 - - (1) 15
Intercompany eliminations (111) - - (1) (112)
5,800 5 43 (393) 5,455 -7%
Adjusted diluted EPS
Adjusted diluted earnings per share represents profit for the year from continuing operations before exceptional items, the
amortisation and impairment of intangible assets, asbestos-related costs and interest expense (net of insurance recoveries), and the tax effect of those items, divided by the diluted number of ordinary shares.
Reconciliations of adjusted diluted EPS to diluted EPS from continuing operations for each period presented are included
in note 7 to the consolidated financial information.
Dividend cover
Dividend cover represents adjusted diluted EPS from continuing operations as a multiple of the dividend per ordinary
share.
2015 2014
Dividend per ordinary share 29.0p1 43.3p Adjusted diluted EPS from continuing operations 67.7p 79.5p
Dividend cover 2.3x 1.8x
1 Includes the proposed final dividend for 2015 of 14.2p per ordinary share.
Order book
Our order book represents the total remaining value of secured projects to be executed up to any break point in the relevant contracts. Contracts are included in our order book only when they are signed and we do not include contracts won by joint ventures.

18
CONDENSED CONSOLIDATED INCOME STATEMENT Year ended 31 December
2015 Before Amortisation, amortisation, exceptional items exceptional items and asbestos and asbestos related items related items (note 4) Total £m £m £m Continuing operations Revenue 3 5,455 - 5,455 Cost of sales (4,787) - (4,787)
Gross profit 668 - 668 Administrative expenses (334) (538) (872) Loss on business disposals and closures - (1) (1)
Profit/(loss) before net financing expense 334 (539) (205)
Financial income 16 - 16 Financial expense (54) (20) (74)
Net financing expense (38) (20) (58) Share of post-tax results of joint ventures 28 - 28
Profit/(loss) before income tax 3 324 (559) (235) Income tax 5 (63) 45 (18)
Profit/(loss) for the year from continuing operations 261 (514) (253) (Loss)/profit for the year from discontinued operations 6 (5) 1 (4)
Profit/(loss) for the year 256 (513) (257)
Attributable to: Equity holders of the parent (256) Non-controlling interests (1)
(257)
Basic earnings/(loss) per share: 7 Continuing operations 68.1p (66.1)p Discontinued operations (1.3)p (1.1)p
66.8p (67.2)p
Diluted earnings/(loss) per share: 7 Continuing operations 67.7p (66.1)p Discontinued operations (1.3)p (1.1)p
66.4p (67.2)p
Dividend per share: 8 29.0p

19
2014 Before Amortisation, amortisation, exceptional items exceptional items and asbestos and asbestos related items related items (note 4) Total £m £m £m Continuing operations Revenue 3 3,993 - 3,993 Cost of sales (3,475) - (3,475)
Gross profit 518 - 518 Administrative expenses (219) (135) (354) Loss on business disposals and closures - (16) (16)
Profit/(loss) before net financing expense 299 (151) 148
Financial income 11 - 11 Financial expense (11) (5) (16)
Net financing expense - (5) (5) Share of post-tax results of joint ventures 12 - 12
Profit/(loss) before income tax 3 311 (156) 155 Income tax 5 (67) 18 (49)
Profit/(loss) for the year from continuing operations 244 (138) 106 Loss for the year from discontinued operations 6 (8) (19) (27)
Profit/(loss) for the year 236 (157) 79
Attributable to: Equity holders of the parent 82 Non-controlling interests (3)
79
Basic earnings/(loss) per share: 7 Continuing operations 81.8p 36.1p Discontinued operations (2.6)p (8.9)p
79.2p 27.2p
Diluted earnings/(loss) per share: 7 Continuing operations 79.5p 35.1p Discontinued operations (2.5)p (8.6)p
77.0p 26.5p
Dividend per share: 8 43.3p

20
CONDENSED CONSOLIDATED STATEMENT OF COMPREHENSIVE INCOME Year ended 31 December
2015 2014
(restated) £m £m (Loss)/profit for the year (257) 79 Other comprehensive income Items that may be reclassified to profit and loss: Exchange movements: Exchange movements on translation of foreign subsidiaries (46) (4) Net loss on hedges of net investment in foreign subsidiaries (3) (4) Cash flow hedges: Effective portion of changes in fair value (2) (1) Tax on effective portion of changes in fair value 2 -
(49) (9)
Items that will not be reclassified to profit and loss:
Actuarial gains/(losses) on defined benefit pension schemes 150 (58) Tax on actuarial gains/(losses) (25) 11
125 (47)
Other comprehensive income/(loss) 76 (56)
Total comprehensive (loss)/income (181) 23
Attributable to: Equity holders of the parent (181) 26 Non-controlling interests - (3)
Total comprehensive (loss)/income (181) 23

21
CONDENSED CONSOLIDATED BALANCE SHEET As at 31 December Note 2015 2014
(restated) £m £m
ASSETS Non-current assets Property, plant and equipment 127 150 Intangible assets 9 3,025 3,443 Interests in joint ventures 104 122 Derivative financial instruments 18 2 Retirement benefit assets 11 231 102 Other receivables 145 167 Deferred tax assets 50 56
Total non-current assets 3,700 4,042
Curent assets
Inventories 13 14 Trade and other receivables 1,455 1,469 Derivative financial instruments 16 12 Current tax receivable 25 12 Bank deposits (more than three months) 23 21 Cash and cash equivalents (excluding bank overdrafts) 340 495
Total current assets 1,872 2,023
Total assets 5,572 6,065
LIABILITIES Current liabilities
Interest bearing loans and borrowings (683) (710) Trade and other payables (1,459) (1,438) Derivative financial instruments (21) (14) Current tax payable (98) (130)
Total current liabilities (2,261) (2,292)
Non-current liabilities
Interest bearing loans and borrowings (640) (609) Trade and other payables (121) (111) Derivative financial instruments (4) (5) Retirement benefit liabilities 11 (168) (188) Deferred tax liabilities (106) (108) Provisions 10 (664) (756)
Total non-current liabilities (1,703) (1,777)
Total liabilities (3,964) (4,069)
Net assets 1,608 1,996
EQUITY
Share capital 197 194 Share premium account 133 101 Merger reserve 540 877 Hedging and translation reserves (26) 24 Capital redemption reserve 34 34 Retained earnings 721 744
Total equity attributable to equity holders of the parent 1,599 1,974 Non-controlling interests 9 22
Total equity 1,608 1,996

22
CONDENSED CONSOLIDATED STATEMENT OF CHANGES IN EQUITY
Year ended 31 December 2015
Capital Non- Share Share Merger Hedging Transl’n redemption Retained controlling Total
capital premium reserve reserve reserve reserve earnings Total interests equity
£m £m £m £m £m £m £m £m £m £m
As at 1 Jan 2015 194 101 877 - 24 34 744 1,974 22 1,996
Loss for the year - - - - - - (256) (256) (1) (257)
Exchange movements on translation of foreign subsidiaries - - - - (47) - - (47) 1 (46) Net loss on hedges of net investment in foreign subsidiaries - - - - (3) - - (3) - (3) Effective portion of changes in fair value of cash flow hedges - - - (2) - - - (2) - (2) Tax on effective portion of changes in fair value of cash flow hedges - - - 2 - - - 2 - 2 Actuarial gains on defined benefit
pension schemes - - - - - - 150 150 - 150 Tax on actuarial gains - - - - - - (25) (25) - (25)
Other comprehensive income for the year - - - - (50) - 125 75 1 76
Total comprehensive loss for the year - - - - (50) - (131) (181) - (181) Dividends - - - - - - (167) (167) - (167) Dividends to non-controlling interests
- - - - - - - - (4) (4)
Equity-settled share-based payments - - - - - - 7 7 - 7 Acquisition of shares by trustees of the Employee Share Trust - - - - - - (5) (5) - (5) Utilisation of treasury Shares - - - - - - 15 15 - 15 Issued 3 32 - - - - 35 - 35 7 Acquisition of non-controlling interests
- - - - - - (79) (79) (9) (88)
Transfer of impairment losses to merger reserve
- - (337) - - - 337 - - -
As at 31 Dec 2015 197 133 540 - (26) 34 721 1,599 9 1,608

23
CONDENSED CONSOLIDATED STATEMENT OF CHANGES IN EQUITY
Year ended 31 December 2014
Capital Non- Share Share Merger Hedging Transl’n redemption Retained controlling Total
capital premium Rese4rve reserve reserve reserve earnings Total interests equity
£m £m £m £m £m £m £m £m £m £m
As at 1 Jan 2014 152 101 - 1 32 34 802 1,122 2 1,124
Profit for the year - - - - - - 82 82 (3) 79
Exchange movements on translation of foreign subsidiaries - - - - (4) - - (4) - (4) Net loss on hedges of net investment in foreign subsidiaries - - - - (4) - - (4) - (4) Effective portion of changes in fair value of cash flow hedges - - - (1) - - - (1) - (1) Actuarial losses on defined benefit pension schemes - - - - - - (58) (58) - (58) Tax on actuarial losses - - - - - - 11 11 - 11
Other comprehensive income for the year - - - (1) (8) - (47) (56) - (56)
Total comprehensive income for the year - - - (1) (8) - 35 26 (3) 23 Dividends - - - - - - (124) (124) - (124) Equity-settled share-based payments - - - - - - 25 25 - 25 Utilisation of treasury Shares - - - - - - 6 6 - 6 Arising on business Combinations - - - - - - - - 23 23 Shares issued 42 877 - - - - - 919 - 919 Transfer to merger reserve
- (877) 877 - - - - - - -
As at 31 Dec 2014 194 101 877 - 24 34 744 1,974 22 1,996

24
CONDENSED CONSOLIDATED CASH FLOW STATEMENT 2015 2014 Note £m £m Cash flow from operating activities (Loss)/profit before income tax from continuing operations (235) 155 Loss before income tax from discontinued operations 6 (5) (33)
(Loss)/profit before income tax (240) 122 Financial income (16) (11) Financial expense 74 16 Share of post-tax results of joint ventures (28) (12) Intangible impairment and amortisation 444 49 Depreciation 26 16 (Profit)/loss on disposal of businesses (1) 44 Difference between contributions to retirement benefit schemes and current service cost (3) (2) Profit on disposal of property, plant and equipment (1) - Loss on disposal of intangible assets - 1 Equity-settled share-based payments 7 8
262 231 Decrease in inventories 1 - Decrease in trade and other receivables 38 106 Decrease in trade and other payables and provisions (81) (137)
Cash generated from operations 220 200 Tax paid (79) (54)
Net cash flow from operating activities 141 146
Cash flow from investing activities
Acquisition of businesses (net of cash acquired) (5) (781) Investment in joint ventures (1) (1) Purchase of property, plant and equipment (15) (14) Purchase of intangible assets (23) (17) Movements in bank deposits (more than three months) (2) (3) Disposal of businesses (net of cash disposed of) (2) (2) Disposal of joint ventures 11 (21) Disposal of property, plant and equipment 2 - Interest received 3 4 Dividends received from joint ventures 42 14 Amounts received/(paid) on maturity of net investment hedges 37 (7)
Net cash flow from investing activities 47 (828)
Net cash flow before financing activities 188 (682)
Cash flow from financing activities
Proceeds from other borrowings 68 1,198 Repayments of other borrowings (143) (100) Cash received in respect of debt related cash flow hedges 12 - Acquisition of non-controlling interests (54) - Cash flows in respect of facility arrangement fees (3) (13) Interest paid (38) (7) Dividend paid (167) (124) Dividends paid to non-controlling interests (4) - Cash flows in respect of treasury shares* 15 6 Acquisition of shares by trustees of the Employee Share Trust (5) -
Net cash flow from financing activities (319) 960
(Decrease)/increase in cash and cash equivalents (131) 278 Cash and cash equivalents as at the beginning of the year 495 223 Exchange losses on cash and cash equivalents (24) (6)
Cash and cash equivalents as at the end of the year 340 495

25
CONDENSED CONSOLIDATED CASH FLOW STATEMENT (continued)
2015 2014 £m £m Cash and cash equivalents consist of: Cash at bank and in hand 307 377 Bank deposits (less than three months) 33 118
Cash and cash equivalents as at the end of the year 340 495 Bank deposits (more than three months) 23 21 Bank loans (1,264) (1,267) Fees capitalised against bank facilities - 9 Finance leases (59) (61) Derivatives classified as net debt 14 -
Net debt as at the end of the year (946) (803)
*Cash received from SAYE option holders on exercise of options.

26
NOTES TO THE CONSOLIDATED FINANCIAL INFORMATION 1. BACKGROUND
The financial information is derived from the group’s consolidated financial statements for the year ended 31 December 2015, which were approved by the Board of Directors on 10 March 2016. The financial information does not constitute statutory accounts within the meaning of sections 434(3) and 435(3) of the Companies Act 2006 or contain sufficient information to comply with the disclosure requirements of International Financial Reporting Standards (IFRS). The Company’s auditors, Ernst & Young LLP, have given an unqualified report on the consolidated financial statements for the year ended 31 December 2015, which did not include reference to any matters to which the auditors drew attention without qualifying their report and did not contain any statement under section 498 of the Companies Act 2006. The consolidated financial statements will be filed with the Registrar of Companies, subject to their approval by the Company’s shareholders at the Company’s Annual General Meeting on 27 April 2016.
2. BASIS OF PREPARATION Basis of accounting
The group’s consolidated financial statements for the year ended 31 December 2015 have been prepared on the going concern basis in accordance with IFRS adopted for use in the European Union and those parts of the Companies Act 2006 that are applicable to companies reporting under IFRS. From the group’s perspective, there are no differences between IFRS as adopted for use in the EU and IFRS as issued by the IASB. The consolidated financial statements have been prepared under the historical cost convention, modified in respect of the revaluation to fair value of derivative financial instruments and assets held by defined benefit pension plans.
The group’s principal accounting policies are unchanged compared with the year ended 31 December 2014. Restatement
On 13 November 2014 (the acquisition date), the group acquired 95.3 per cent of the issued share capital of Foster Wheeler AG. Due to the relatively short period of time between the acquisition date and 31 December 2014, management had not finalised its assessment of the fair values of certain of Foster Wheeler’s assets and liabilities at the time that the 2014 financial statements were finalised and as a result, the 2014 financial statements reflected the provisional assessment of the fair values as at the acquisition date. The restatement had no impact on the 2014 income statement. During 2015, management has completed the fair value assessment and the comparative amounts shown in the Balance Sheet, Statement of Comprehensive Income, Statement of Changes in Equity and Cash Flow Statement have been restated to reflect changes made to the carrying amounts of assets and liabilities recognised on the acquisition of Foster Wheeler, details of which are set out in Note 12.
In addition to the above, the acquisition balance sheet has been restated to present liabilities of £65m in respect of onerous leases within trade and other payables. These liabilities had previously been presented within provisions. As the acquisition of Foster Wheeler AG in November 2014 represented more than 90% of its issued share capital it qualifies for merger relief under section 612 of the Companies Act 2006 from crediting the share premium that arose on the new shares issued to fund the acquisition to a share premium account. As a result, the balance sheet as at 31 December has been restated to present excess of the nominal value of the shares issued of £877m as a merger reserve. Use of estimates
The preparation of financial statements in accordance with IFRS requires management to make judgements, estimates and assumptions that affect the application of policies and reported amounts of assets and liabilities, income and expenses. The estimates and associated assumptions are based on historical experience and various other factors that are believed to be reasonable under the circumstances, the results of which form the basis of making the judgements about carrying values of assets and liabilities that are not readily apparent from other sources. Actual results may differ from these estimates. Estimates and underlying assumptions are reviewed on an ongoing basis. Revisions to accounting estimates are recognised in the period in which the estimate is revised if the revision affects only that period, or in the period of the revision and future periods if the revision affects both current and future periods. Management considers that the most significant areas of judgement and estimation made in preparing the consolidated financial statements arise in relation to the accounting for long-term contracts, business combinations, defined benefit pensions and other retirement benefits and provisions (including asbestos-related liabilities), and in assessing the recoverability of goodwill and other intangible assets.

27
Use of adjusted measures
Management uses adjusted performance measures including trading profit, adjusted profit before tax and adjusted diluted
earnings per share. Each of these measures is based on an IFRS measure of profit but excludes specific items whose inclusion in the IFRS measure hinders the comparison of the trading performance of the businesses from one period to
another, with each other or with those of competitors.
Management has identified the following specific items that are excluded in arriving at these non-IFRS measures: exceptional items; the amortisation of intangible assets; and asbestos-related costs (net of insurance recoveries).
We do not regard these non-IFRS measures as a substitute for, or superior to, the equivalent measures calculated and presented in accordance with IFRS and it should be noted that they may not be comparable with similarly-titled measures
used by other companies.
Exceptional items
Exceptional items may include, but are not restricted to: impairment charges, acquisition–related costs, restructuring costs,
gains and losses on the disposal of fixed assets and gains and losses on the disposal and closure of businesses. Acquisition-related costs may include impairment charges, transaction costs (including external advisory, legal, valuation,
and other professional fees and attributable internal costs), the amortisation of acquisition-related facilities fees, payments to selling shareholders that are accounted for as remuneration and changes in the fair value of contingent consideration.
Discontinued operations
In the consolidated financial statements, the results, assets and liabilities and cash flows of discontinued operations are presented separately from those of continuing operations. An operation is classified as discontinued if it is a component of the group that: has been disposed of, or meets the criteria to be classified as held for sale; and represents a separate major line of business or geographic area of operations or will be disposed of as part of a single co-ordinated plan to dispose of a separate major line of business or geographic area of operations.
3. SEGMENTAL ANALYSIS OF CONTINUING OPERATIONS
Amec Foster Wheeler designs, delivers and maintains strategic and complex assets for its customers across the global energy and related sectors. Segment information is presented on a consistent basis with the information presented to the Group Leadership Team for the purposes of allocating resources within the group and assessing the performance of the group’s businesses. Prior to the acquisition of Foster Wheeler in November 2014, the group’s continuing operations comprised four operating segments: Americas, Europe, Growth Regions and Investment Services. For the short period between its acquisition and the end of 2014, Foster Wheeler’s results were presented to the Group Leadership Team analysed by its existing operating segments: E&C Services and Global Power Group. With effect from 1 January 2015, the group adopted three new geographical operating segments: Americas; Northern Europe & CIS; and Asia, Middle East, Africa & Southern Europe; with Foster Wheeler’s E&C Services segment being merged into these segments. Foster Wheeler’s Global Power Group continues to be reported as a separate operating segment. Investment Services also continues to be reported separately. Details of the services offered by each segment and the end markets in which they operate are given in the segmental review. The Group Leadership Team uses trading profit as the measure of the profitability of the group’s businesses. Trading profit is, therefore, the measure of segment profit presented in the group’s segment disclosures. Trading profit represents profit before net financing expense excluding exceptional items; the amortisation and impairment of intangible assets; and asbestos-related costs (net of insurance recoveries). Trading profit includes the group’s share of the trading profit of joint ventures.

28
NOTES TO THE ACCOUNTS (continued)
3. SEGMENTAL ANALYSIS OF CONTINUING OPERATIONS (continued)
Revenue Profit 2015 2014 2015 2014 £m £m £m £m
Class of business: Americas 2,646 2,184 161 212 Northern Europe & CIS 1,492 1,293 134 105 Africa, Middle East, Asia and Southern Europe 1,050 516 68 25 Global Power Group 364 53 51 1 Investment Services 15 8 14 9
5,567 4,054 428 352 Internal revenue (112) (61)
External revenue 5,455 3,993
Corporate costs1 (54) (31)
Trading profit2 374 321 Net financing expense3 (40) (4)
Adjusted profit before income tax 334 317 Share of tax expense of joint ventures4 (10) (6)
324 311 Intangible impairment and amortisation 5 (444) (49) Exceptional items Net asbestos related items (115) (107)
(Loss)/profit before income tax (235) 155
1 Corporate costs comprise the costs of operating central corporate functions and certain regional overheads. 2 Trading profit includes the group’s share of the trading profit of joint ventures of £40m (2014: £22m). 3 Net financing expense includes the group’s share of net interest payable of joint ventures. 4 The group’s share of post-tax results of joint ventures is further analysed as follows:
2015 2014 £m £m Trading profit 40 22 Net financing expense (2) (4) Tax (10) (6)
28 12
5 See note 4 for further details.

29
4. AMORTISATION, IMPAIRMENT, EXCEPTIONAL ITEMS AND ASBESTOS-RELATED ITEMS
2015 2014 £m £m Continuing operations:
Administrative expenses – exceptional and asbestos-related items (94) (86) Administrative expenses – intangible amortisation and impairment (444) (49)
(538) (135) Loss on business disposals and closures (1) (16) Net financing expense (20) (5)
(559) (156)
Taxation credit on exceptional and asbestos-related items of continuing operations 18 6 Taxation credit on intangible amortisation and impairment 27 12
45 18
Post-tax amortisation, impairment, exceptional and asbestos-related items of continuing operations (514) (138) Exceptional items of discontinued operations (post-tax) 1 (19)
Post-tax amortisation, impairment, exceptional and asbestos-related items (513) (157)
Post-tax exceptional and asbestos-related items (96) (120) Post-tax intangible amortisation and impairment (417) (37)
(513) (157)
The charge of £444m in respect of intangible amortisation and impairment comprises amortisation of £129m and impairments of £315m. The goodwill in the Global Power Group business has been written down by £308m and there was a £7m write down on the order backlog intangible asset. See note 9 for further details. Post-tax exceptional and asbestos-related items are further analysed as follows:
Year ended 31 December 2015 Loss in Profit/(loss)
respect of on business Asbestos- Other
Profit on business disposals related exceptional
disposals closures and closures items items Total
£m £m £m £m £m £m
Continuing operations - (1) (1) 6 (120) (115)
Discontinued operations 1 - 1 - - 1
Profit/(loss) before tax 1 (1) - 6 (120) (114)
Tax - - - - 18 18
Profit/(loss) after tax 1 (1) - 6 (102) (96)
The pre-tax profit on disposal of £1m relates costs and movements in indemnity provisions associated with businesses sold in prior years and classified as discontinued. There was a credit of £5m relating to a change in the discount rate applied to the asbestos liability and experiential gains of £9m as the liability is reassessed on an annual basis. These credits were offset by a £7m charge in respect of unwinding the discount and £1m other costs of managing the liability. Other exceptional items of £120m includes £97m relating to the costs of integrating the Amec and Foster Wheeler businesses, £13m amortisation of fees associated with the borrowings taken on to fund the acquisition, a £5m loss incurred following an unauthorised payment made from the Australian business and not expected to be recovered and other exceptional items totalling £5m. Integration costs includes severance (£32m), professional and consultancy fees (£11m), costs of rationalisation of agents (£8m), property and office rationalisation (£27m), and staff costs (£11m) as well as IT, rebranding and Sarbanes-Oxley Act implementation costs totalling £8m. Of the £120m of other exceptional items, £72m was paid in cash during the year.

30
Year ended 31 December 2014
Profit in Loss on
respect of business Asbestos Other
Loss on business disposals related exceptional
disposals closures and closures items items Total
£m £m £m £m £m £m
Continuing operations
(21) 5 (16) (9) (82) (107)
Discontinued operations
(23) - (23) - - (23)
(Loss)/profit before tax
(44) 5 (39) (9) (82) (130)
Tax on exceptional items
5 - 5 - 5 10
(Loss)/profit after tax (39) 5 (34) (9) (77) (120)
During the year ended 31 December 2014, the group disposed of its investment in the Lancashire Waste project at a loss of £21m mainly arising from a reverse premium payable on exit. This combined with additional indemnity provisions and costs of £23m associated with businesses sold in prior years (and classified as discontinued) to give a pre-tax loss on disposal of £44m. This includes a provision of £11m in respect of a new claim received in the year related to a contract completed by the Built Environment business which was sold in 2006. There was a credit of £5m from the release of a provision no longer required in respect of a business closed in a prior year (and classified as continuing). There was a charge of £8m relating to a change in the discount rate applied to the asbestos liability and £1m in respect of unwinding the discount. Other exceptional items of £82m includes transaction costs of £37m relating to the acquisition of Foster Wheeler AG, £35m relating to the costs of integrating the two businesses and £4m of fees associated with the borrowings taken on to fund the acquisition. Integration costs include consultancy and other costs of identifying cost synergies of £18m which includes associated internal labour costs, plus £17m of costs of achieving cost synergies (including £14m redundancy costs). In addition, £6m was incurred in completing the previously announced restructuring into geographic business units. Out of the £82m of other exceptional items £58m was paid in cash during the year. 5. INCOME TAX
The group’s effective tax rate in 2015 for the continuing businesses (including tax attributable to joint venture interests) but before exceptional items and intangible amortisation was 22.0 per cent (2014: 23.0 per cent). The forthcoming reductions in the rate of UK corporation tax have all been substantively enacted.
6. LOSS FOR THE YEAR FROM DISCONTINUED OPERATIONS
Discontinued operations represent the residual assets and retained obligations in respect of businesses sold in prior years, as well as the UK conventional power business which was discontinued in 2013. In accordance with IFRS 5, the post-tax results of discontinued operations are disclosed separately in the consolidated income statement. The results of the discontinued operations are as follows:
2015 2014 £m £m Revenue - (13) Cost of sales and net operating expenses (6) 3
Loss before exceptional items and attributable tax (6) (10) Attributable tax 1 2
(5) (8) Profit/(loss) on disposal 1 (23) Tax on disposals - 4
Loss for the year from discontinued operations (4) (27)
The loss before exceptional items and income tax in 2015 represents additional provisions on certain contracts within the UK conventional power business. The negative revenue of £13m and loss of £10m before exceptional items and income tax in 2014 related to the settlement of final accounts and additional provisions on the UK conventional power contracts.
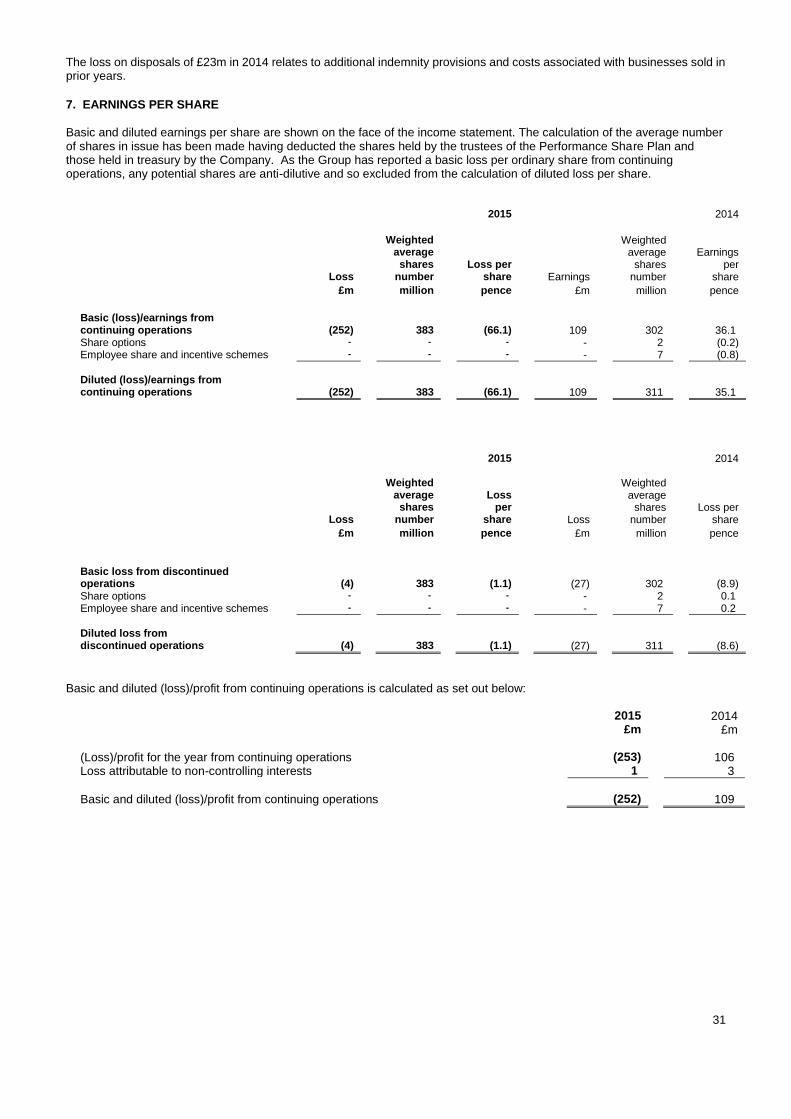
31
The loss on disposals of £23m in 2014 relates to additional indemnity provisions and costs associated with businesses sold in prior years.
7. EARNINGS PER SHARE
Basic and diluted earnings per share are shown on the face of the income statement. The calculation of the average number of shares in issue has been made having deducted the shares held by the trustees of the Performance Share Plan and those held in treasury by the Company. As the Group has reported a basic loss per ordinary share from continuing operations, any potential shares are anti-dilutive and so excluded from the calculation of diluted loss per share.
2015 2014
Weighted
Weighted
average shares
Loss per
average shares
Earnings per
Loss number share Earnings number share
£m million pence £m million pence
Basic (loss)/earnings from continuing operations (252) 383 (66.1) 109 302 36.1 Share options - - - - 2 (0.2) Employee share and incentive schemes - - - - 7 (0.8)
Diluted (loss)/earnings from continuing operations (252) 383 (66.1) 109 311 35.1
2015
2014
Weighted
Weighted
average shares
Loss per
average shares
Loss per
Loss number share Loss number share
£m million pence £m million pence
Basic loss from discontinued operations (4) 383 (1.1) (27) 302 (8.9) Share options - - - - 2 0.1 Employee share and incentive schemes - - - - 7 0.2
Diluted loss from discontinued operations (4) 383 (1.1) (27) 311 (8.6)
Basic and diluted (loss)/profit from continuing operations is calculated as set out below:
2015 2014 £m £m (Loss)/profit for the year from continuing operations (253) 106 Loss attributable to non-controlling interests 1 3
Basic and diluted (loss)/profit from continuing operations (252) 109

32
7. EARNINGS PER SHARE (continued)
In order to appreciate the effects on the reported performance of intangible amortisation and impairment, exceptional items and asbestos related items, along with the impact of the potential ordinary shares, additional calculations of earnings per share are presented.
2015 2014 Weighted Weighted
average (Loss)/ earnings
average Earnings
shares per shares per
(Loss)/ earnings
number share Earnings number share
£m million pence £m million pence
Basic (loss)/earnings from continuing operations (252) 383 (66.1) 109 302 36.1 Exceptional items and asbestos related items (post-tax) 97 - 25.3 101 - 33.4 Amortisation and impairment (post-tax) 417 - 108.9 37 - 12.3
Basic earnings from continuing operations before amortisation, impairment, exceptional items and asbestos related items 262 383 68.1 247 302 81.8 Share options - - - - 2 (0.5) Employee share and incentive schemes - 2 (0.4) - 7 (1.8)
Diluted earnings from continuing operations before amortisation, impairment, exceptional items and asbestos related items 262 385 67.7
247
311
79.5
2015 2014
Weighted Weighted
average Loss average Loss
shares per shares per
Loss number share Loss number share
£m million pence £m million pence
Basic loss from discontinued operations (4) 383 (1.1) (27) 302 (8.9) Exceptional items (post-tax) (1) - (0.2) 19 - 6.3
Basic loss from discontinued operations before exceptional items (5) 383 (1.3) (8) 302 (2.6) Share options - - - - 2 - Employee share and incentive schemes - 2 - - 7 0.1
Diluted loss from discontinued operations before exceptional items (5) 385 (1.3) (8) 311 (2.5)
8. DIVIDENDS
The directors are proposing a final dividend in respect of the financial year ended 31 December 2015 of 14.2 pence per share, which will absorb an estimated £54m of equity. Subject to approval, it will be paid on 4 July 2016 to shareholders on the register of members on 27 May 2016. This dividend has not been provided for and there are no income tax consequences for the company. This final dividend together with the interim dividend of 14.8 pence (2014: 14.8 pence) per share results in a total dividend for the year of 29.0 pence per share (2014: 43.3 pence).
2015 2014 Pence Pence Dividends charged to reserves and paid per share £m per share £m Interim dividend in respect of 2014 (2014: interim dividend in respect of 2013) 14.8 56 13.5 40 Final dividend in respect of 2014 (2014: final dividend in respect of 2013) 28.5 111 28.5 84
43.3 167 42.0 124

33
9. INTANGIBLE ASSETS Customer Brands/ Order Goodwill relationships trademarks backlog Patents Software Total £m £m £m £m £m £m £m
Cost: As at 1 Jan 2015 (restated) 2,551 560 186 137 109 123 3,666 Exchange and other movements (21) 1 8 - 8 - (4) Additions 1 - - - - 21 22 Disposals and retirements - (31) - - - (6) (37) Reclassifications - - - - - 7 7
As at 31 Dec 2015 2,531 530 194 137 117 145 3,654
Amortisation: As at 1 Jan 2015 (restated) 35 107 21 14 1 45 223 Exchange and other movements (4) - - 1 1 1 (1) Impairment loss 308 - - 7 - - 315 Provided during the year - 43 11 43 7 25 129 Disposals and retirements - (31) - - - (6) (37)
As at 31 Dec 2015 339 119 32 65 9 65 629
Cost: As at 1 Jan 2014 792 192 23 9 - 66 1,082 Exchange and other movements
(2)
4
1
-
(1)
2
4
Acquired through business combinations
1,761
367
162
129
110
5
2,534
Additions - - - - - 51 51 Disposals and retirements - (3) - (1) - (1) (5)
As at 31 Dec 2014 (restated) 2,551 560 186 137 109 123 3,666
Amortisation: As at 1 Jan 2014 35 85 19 7 - 29 175 Exchange and other movements
-
2
-
-
-
1
3
Provided during the year - 23 2 8 1 15 49 Disposals and retirements - (3) - (1) - - (4)
As at 31 Dec 2014 (restated) 35 107 21 14 1 45 223
Net book value: As at 31 Dec 2015 2,192 411 162 72 108 80 3,025
As at 31 Dec 2014 (restated) 2,516 453 165 123 108 78 3,443
As at 1 Jan 2014 757 107 4 2 - 37 907
The carrying value of software held under deferred payment arrangements which are similar to finance leases as at 31 December 2015 was £24m (2014: £30m). Additions during the year include £nil (2014: £33m) of software held under deferred payment arrangements. The impairment loss of £315m relates to a £308m impairment of goodwill in relation to the Global Power Group and a £7m impairment of the order backlog intangible asset.
The Group is required to test its goodwill and intangible assets for impairment at least annually, or more frequently if indicators of impairment exist. The review of goodwill for indications of impairment by management is performed at the operating segment level, being the lowest level of cash-generating units (CGU) monitored for goodwill purposes. The recoverable amount of all CGUs has been based on value-in-use calculations. These calculations use cash flow projections included in the financial budgets approved by the Board for 2016. For the purposes of the calculation of the recoverable amount, the cash flow projections beyond the budgeted period include no growth in 2017 for the Americas, Northern Europe and CIS, and Asia, Middle East, Africa and Southern Europe, and 10% growth in the Global Power Group. For all segments, no growth is included in 2018, 5% growth in 2019, 10% growth in 2020 and 3% growth per annum

34
thereafter. The long-term growth rates are in line with long-term average growth rates for the regions in which the CGUs operate. The carrying amount of the Global Power Group CGU has been reduced to its recoverable amount through recognition of an impairment loss of £308m against goodwill. This has been included in administrative expenses in the income statement. The recoverable amount of the Global Power Group CGU is £396m. The impairment loss arose due to the current difficult market conditions and a reduction in forecast future profits of the Global Power Group. Any adverse changes in the key assumptions would increase this impairment loss. The value-in-use has been compared to the carrying value for each CGU and no impairment is required nor has been charged in respect of the Americas, Northern Europe and CIS, or Asia, Middle East, Africa and Southern Europe CGUs. 10. PROVISIONS
Obligations relating to Property Asbestos Project disposed related related litigation businesses provisions Other Total £m £m £m £m £m £m As at 1 January 2015 (restated) 400 217 86 19 34 756 Exchange and other movements 18 6 (1) 1 (2) 22
Reclassification 1 (3) 2 2 (2) -
Transfers to other payables - (47) - (2) 2 (47) Utilised (35) (22) (2) (4) (1) (64) Provided 1 10 12 3 7 33 Released (9) (7) (19) - (3) (38) Change in discount rate (5) - - - - (5) Unwinding of discount 7 - - - - 7
As at 31 December 2015 378 154 78 19 35 664
Asbestos-related litigation
Certain of the Company’s subsidiaries in the US and the UK are defendants in numerous asbestos-related lawsuits and out-of-court informal claims pending in the US and the UK. Plaintiffs claim damages for personal injury alleged to have arisen from exposure to asbestos primarily in connection with equipment allegedly manufactured by certain of our subsidiaries during the 1970s or earlier. We expect that these subsidiaries will be named as defendants in additional and/or similar suits and that new claims will be filed in the future. Whilst some of these claims have been and are expected to be made in the UK, the overwhelming majority have been and are expected to be made in the US. We assumed the majority of our asbestos-related liabilities when we acquired Foster Wheeler in November 2015. Management worked with independent asbestos valuation experts, to measure the asbestos-related liabilities assumed. Asbestos-related liabilities recognised by the group include estimates of indemnity amounts and defence costs expected to be incurred in each year in the period to 2050, beyond which time management expects that there will no longer be a significant number of open claims. Management’s estimates were based on the following information and/or assumptions: the number of open claims, the forecasted number of future claims, the estimated average cost per claim by disease type – mesothelioma, lung cancer and non-malignancies, claim filings which result in no monetary payments (the ‘zero pay rate’), as well as other factors. Over the last several years, certain of our subsidiaries have entered into settlement agreements calling for insurers to make lump-sum payments, as well as payments over time, for use by our subsidiaries to fund asbestos-related indemnity and defence costs, and, in certain cases, for reimbursement for portions of out-of-pocket costs incurred. Asbestos-related insurance recoveries under executed settlement agreements are recognised in trade and other receivables together with our best estimate of actual and probable insurance recoveries relating to our liability for pending and estimated future asbestos claims in the period to 2050. Our actual insurance recoveries may be limited by future insolvencies among our insurers. We do not recognise insurance recoveries due from currently insolvent insurers unless they are subject to court-approved settlement in liquidation proceedings. We have discounted the expected future cash flows with respect to the asbestos-related liabilities and the expected insurance recoveries using discount rates determined by reference to appropriate risk-free market interest rates.

35
Asbestos-related liabilities and assets recognised on the group’s balance sheet were as follows:
2015 2014
(restated) £m £m
Asbestos-related provision
Gross provision 488 511 Effect of discounting (74) (76)
Net provision (1) 414 435
Insurance recoveries
Gross recoveries (122) (124) Effect of discounting 4 4
Net recoveries (118) (121)
Net asbestos-related liabilities 296 314
1) The net asbestos provision is made up of £378m included within provisions and £36m included within trade and other payables.
Legal claims and actions
The group is party to litigation involving clients and sub-contractors arising out of project contracts. Management has taken internal and external legal advice in considering known or reasonably likely legal claims and actions by and against the group. Where a known or likely claim or action is identified, management carefully assesses the likelihood of success of the claim or action. Generally, a provision is recognised only in respect of those claims or actions that management considers are probable of success. Additionally, however, the group recognises provisions for known or likely claims against an acquired business if, at the acquisition date, it is possible that the claim or action will be successful and its amount can be reliably estimated.
Indemnities and retained obligations
The group has agreed to indemnify certain third parties relating to businesses and/or assets that were previously owned by the group and were sold to them. As at 31 December 2015, we recognised indemnity provisions totalling £78m (2014: £86m). Indemnity provisions principally relate to the indemnification of the purchasers of SPIE in 2006, and the Built Environment and other peripheral businesses that were sold in 2007. During 2015, an additional indemnity provisions of £12m in relation to businesses sold in previous years and released provisions of £19m were no longer required following settlement of the underlying issues. As at 31 December 2015, the group held provisions totalling £44m (2014: £33m) for the estimated future environmental clean-up costs in relation to industrial facilities that it no longer operates. Whilst the timing of the related cash flows is typically uncertain, we expect that certain of our remediation obligations may continue for up to 60 years.
Property-related provisions
Property-related provisions principally comprise provisions for dilapidation of leasehold buildings.
Other provisions
Other provisions also include £7m (2014: £2m) in respect of the group’s legal and constructive obligations to fund loss-making joint ventures and to meet its share of certain of their obligations and insurance provisions of £28m (2014; £28m) relating to the potential liabilities in the group’s captive insurance entity and provisions in relation to risks associated with insurance claims. These potential liabilities and risks relate predominantly to industrial disease of former employees.

36
11. RETIREMENT BENEFITS
The group operates a number of pension schemes for UK and overseas employees. There are three principal defined benefit schemes. In the UK these are the AMEC Staff pension scheme (which also has an associated Executive top-up scheme) and the Foster Wheeler Pension Plan and in the US, The Foster Wheeler Inc. Salaried Employees Pension Plan. The AMEC Staff and Executive pension schemes are closed to new members but remain open to further accrual. The Foster Wheeler Pension Plan is a hybrid benefit arrangement with distinct defined benefit and defined contribution sections. The defined benefit section is closed to new members and further accrual, but the defined contribution section remains open to further accrual. The Foster Wheeler Inc. Salaried Employees Pension plan is also closed to new members and further accrual. The AMEC Staff and Executive pension schemes are average salary plans for UK employees. The Foster Wheeler Pension Plan was a final salary pension plan. Due to the nature of the liabilities, the pension plans are exposed to inflation, interest rate risk and changes in the life expectancy for pensioners. As the plan assets include significant investments in quoted equities, the group is also exposed to equity market risk. The valuations used have been based on the final valuations of the AMEC Staff pension scheme and the AMEC Executive pension scheme as at 31 March 2014. The Foster Wheeler Pension Plan’s most recent valuation took place as at 1 April 2013. These schemes have been updated by the schemes’ actuaries for the requirement to assess the present value of the liabilities of the schemes as at 31 December 2015. The assets of the schemes are stated at their aggregate market value as at 31 December 2015. The Foster Wheeler Inc. Salaried Employees Pension Plan provides pension benefits to certain full-time employees. Under the pension plan, retirement benefits are primarily a function of both years of service and level of compensation. The pension plan is closed to new members and further accrual. The amounts recognised in the balance sheet are as follows:
2015 2014 £m £m Retirement benefit assets 231 102
Retirement benefit liabilities (168) (188)
Retirement benefit net asset/(liability) 63 (86)
The retirement net benefit asset/(liability) is analysed as follows:
2015 2014 £m £m The AMEC Staff and the AMEC Executive pension schemes 184 65 The Foster Wheeler Pension Plan 47 37 The Foster Wheeler Inc. Salaried Employees Pension Plan (59) (57) Other smaller pension schemes (109) (131)
63 (86)
The retirement benefit liabilities of £168m (2014: £188m) reflect primarily the deficits on the smaller overseas schemes. Changes in the present value of the defined benefit liability are as follows:
2015 2014 £m £m As at 1 January 2,931 1,743 Exchange and other movements (1) 3 Acquired through business combinations - 898 Current and past service cost 32 29 Interest cost 104 84 Plan participants’ contributions 11 12 Actuarial (gains)/charges arising from changes in financial assumptions
(177)
278
Actuarial (gains)/charges arising from changes in demographic assumptions
(14)
(19)
Settlements (31) (12) Benefits paid (141) (85) Reclassifications 3 -
As at 31 December 2,717 2,931

37
11. RETIREMENT BENEFITS (continued)
Changes in the fair value of scheme assets are as follows: 2015 2014 £m £m As at 1 January 2,845 1,783 Exchange and other movements - 3 Acquired through business combinations - 826 Interest income 102 86 Actuarial (losses)/gains (41) 201 Employer contributions 36 32 Plan participants’ contributions 11 12 Administrative expenses (4) (4) Settlements (28) (9) Benefits paid (141) (85)
As at 31 December 2,780 2,845
The movement in the scheme net asset/(liability) during the year is as follows:
2015 2014 £m £m Scheme net (liability)/asset as at 1 January (86) 40 Exchange and other movements 1 - Acquired through business combinations - (72) Total charge (38) (31) Employer contributions 36 32 Settlements 3 3 Actuarial gains/(losses) recognised in other comprehensive income 150 (58) Reclassifications (3) -
Scheme net asset/(liability) as at 31 December 63 (86)
12. ACQUISITIONS
On 5 October 2015, the group acquired the remaining 49.9% shareholding in KROMAV Engenharia Ltda, a company incorporated in Brazil for a consideration of £3m. As a result of the transaction, the Non-controlling interest released was £1m resulting in a charge of £4m recognised in the consolidated statement of changes in equity. Mandatory purchase of minority Foster Wheeler shareholders
On 19 January 2015, Amec Foster Wheeler plc completed the squeeze-out merger under Swiss law (the "Squeeze-Out Merger") of Foster Wheeler AG ("Foster Wheeler") through its wholly owned subsidiaries AMEC International Investments BV and A-FW International Investments GmbH. All remaining Foster Wheeler shareholders received, for each Foster Wheeler share held, a combination of $16.00 in cash and either (i) 0.8998 Amec Foster Wheeler shares, if the shareholder's address on the books and records of Foster Wheeler was outside the United States or (ii) 0.8998 Amec Foster Wheeler American depositary shares ("ADSs"), if the shareholder's address on the books and records of Foster Wheeler was in the United States. The cash portion of the consideration was increased by $0.225 for each Amec Foster Wheeler share or Amec Foster Wheeler ADS received, in lieu of the Amec Foster Wheeler dividend of £0.148 (announced on 7 August 2014). This was calculated by converting the dividend amount to US$ (at the European Central Bank's 5 January 2015 exchange rate of $1.5223 per £1.00). In aggregate, Amec Foster Wheeler paid as consideration in the Squeeze-Out Merger £51m ($77m) in cash and issued 4,255,970 Amec Foster Wheeler shares.

38
The purchase consideration was allocated as follows: Recognised value £m Assets acquired - Liabilities assumed -
Net identifiable assets and liabilities - Amount recognised in the condensed statement of consolidated statement of changes in equity
75
Non-controlling interest acquired 10
85
Consideration Shares issued 34 Cash paid on completion 51
85
Acquisition of Foster Wheeler AG in 2014
On 6 October 2014, the group launched a public tender offer to acquire the entire issued share capital of Foster Wheeler AG, the ultimate parent company of Foster Wheeler. Pursuant to the tender offer, which closed on 13 November 2014 (the acquisition date), the group acquired 95.3 per cent of the issued share capital of Foster Wheeler AG. Consideration payable for the interests in Foster Wheeler acquired by the group amounted to £1,915m (measured at fair value at the acquisition date), of which £979m was settled in cash, £919m was settled by the issue of ordinary shares and ADSs and £17m was settled by the grant of replacement share options and awards to Foster Wheeler employees. Due to the relatively short period of time that elapsed between the acquisition date and the completion of the 2014 financial statements, management had not finalised its assessment of the fair values at the acquisition date of certain of Foster Wheeler’s property, plant and equipment, equity-accounted investments, and property-related, legal and environmental obligations and a provisional allocation was reported in the 2014 financial statements. The fair value assessment was completed during 2015. The purchase consideration has been allocated as follows:
£m
Identifiable assets acquired
Property, plant and equipment 111 Identifiable intangible assets 742
Interests in joint ventures 73 Current tax receivable 13
Deferred tax assets 27 Inventories 11
Trade and other receivables 751
Gross contractual amounts receivable 818
Allowance for doubtful debts (67)
Derivative financial instruments (12) Cash and cash equivalents 265
Liabilities assumed
Bank loans (39) Finance lease obligations (32)
Trade and other payables (856) Current tax (65)
Retirement benefit liabilities (72) Deferred tax liabilities (113)
Provisions (592)
Net identifiable assets acquired 212
Non-controlling interests (23)
Goodwill 1,726
Consideration 1,915
Non-controlling interests in Foster Wheeler were measured at their proportionate share of Foster Wheeler’s identifiable assets and liabilities at the acquisition date.

39
Goodwill of £1,726m has been recognised on the acquisition of Foster Wheeler. Management considers that the goodwill is attributable to the future strategic growth opportunities arising from the acquisition, Foster Wheeler’s highly skilled, customer-oriented and collaborative assembled workforce, the significant cost synergies that are expected to result from the integration of Foster Wheeler with the group’s existing operations, and the potential for tax synergies. None of the goodwill is expected to be deductible for tax purposes. Acquisition-related costs relating to the acquisition of Foster Wheeler totalling £33m were recognised within administrative expenses during 2014. In the period from its acquisition to 31 December 2014, Foster Wheeler contributed £274m to the group’s revenue and £1m to the group’s trading profit. After amortisation, exceptional items and net asbestos related items, Foster Wheeler generated a loss of £44m in the period from acquisition to 31 December 2014. Management estimated that if Foster Wheeler had been acquired on 1 January 2014, the group’s revenue for the year would have been £1,814m higher than reported at £5,800m. Management was unable to estimate reliably what the group’s profit or loss for the year would have been on this basis, principally because it is not practicable to retrospectively apply the significant purchase accounting adjustments that were made to the carrying amounts of the assets and liabilities of Foster Wheeler at its acquisition date and the tax effects of those adjustments. Changes to the provisional fair value allocation
As discussed above, during 2015 management completed its assessment of the fair values of Foster Wheeler’s assets and liabilities as at the acquisition date resulting in the recognition of additional goodwill of $245m. The most significant updates were as follows: Longview As previously disclosed, during 2015, the arbitration panel awarded Kvaerner approximately $74m (approximately £48m) in respect of the arbitration with Kvaerner North American Construction Inc arising from GPG's role in the construction of the Longview power plant in West Virginia, US in 2011. As the contract was complete prior to the acquisition, this award has been fully reflected in the purchase price allocation. Refinery project arbitration - India
As disclosed in the 2014 financial statements, Foster Wheeler commenced arbitration in India against its client seeking collection of unpaid invoices in connection with the construction of an oil refinery plant in north-eastern India. Its client rejected the claim and submitted significant counterclaims. The provisional purchase price allocation included an allowance against the outstanding debts but, due to the ongoing risks and the passage of time, a further charge of £16m has been made. This represents full provision against the outstanding receivables. Other project litigation A provision of £33m has been established against costs expected to be disallowed and an alleged breach of warranty claim in respect of design work undertaken on a design, build and construct project based in the Southern US. Management has performed a detailed review of the contracts in the GPG business and made provisions for defect rectification and damages claims totalling £19m across a number of contracts, A number of smaller provisions totalling £21m have been established against specific contact risks. Receivables and payables Provision has been made against receivables and unbilled work in progress on a number of contracts (including £10m on one contract) that were outstanding as at the acquisition date and remained uncollected at the end of the hindsight period. Provision has also been made against an employment tax risk associated with a permanent establishment overseas. Uncertain tax positions
Management has reviewed the ongoing tax positions of Foster Wheeler and increased the provisions for uncertain tax positions in a number of jurisdictions. The most significant increases withholding tax on potential deemed distributions. Property, plant and equipment The carrying value of property, plant and equipment has been reviewed resulting in a £9m write down of two properties to their expected market value.

40
Deferred tax Deferred tax liabilities have reduced by £23m.This movement includes a potential tax liability on the future unwind of an overseas branch, as well as the deferred tax impact of the additional adjustments to the purchase price offset by the impact of the finalisation of the intangible allocation. The recognition of deferred tax on the purchase price allocation is restricted as a result of uncertainty over future profits and capacity constraints. Restatement
In addition to the above, the acquisition balance sheet has been restated to present liabilities of £65m in respect of onerous leases within trade and other payables. These liabilities had previously been presented within provisions. As part of the finalisation of the acquisition accounting, the acquired intangible assets have been allocated to the relevant jurisdictions resulting in a foreign exchange movement between the acquisition date and 31 December 2014. This is reflected in the restated consolidated statement of changes in equity for 2014. 13. RELATED PARTY TRANSACTIONS
During 2015 there were a number of transactions with the senior management group, joint venture entities and subsidiary companies.
Transactions with the senior management group
The senior management group consists of Amec Foster Wheeler plc board members and the presidents of the Americas, Northern Europe and CIS, Asia, Middle East, Africa and Southern Europe and Global Power Group operating segments. Following the acquisition of Foster Wheeler in late 2014, the senior management group consisted of Amec Foster Wheeler plc board members and the presidents of the Americas, Europe and Growth Regions geographies and the Foster Wheeler segments of E&C Services and Global Power Group. The senior management group and relatives controlled 0.70% of the voting rights of the company as at 31 December 2015. In addition to their salaries, the company also provides non-cash benefits to executive directors and other senior managers and they receive share awards under the Performance Share Plan. The company also contributes to a defined benefit plan on behalf of certain executive directors. Details of their compensation are as follows:
2015 2014 £m £m Short-term employee benefits 5 5 Pension costs - - Equity-settled share-based payments - 1
5 6
The transactions and related balances outstanding with joint ventures are as follows:
Value of transactions
in the year Outstanding balance
as at 31 December 2015 2014
(restated) 2015 2014
(restated) £m £m £m £m Services received 1 - - - Services rendered 28 29 12 12 Provisions of finance - 9 17 25
The 2014 restatement reflects changes to classification of related party transactions. In September 2012, the UK government’s Department for Business, Innovation and Skills announced a change to UK legislation with respect to the requirement for a UK company to be subject to annual audit. An additional audit exemption has been introduced, such that for a subsidiary of a parent established in a European Economic Area state, that subsidiary can be exempt from annual audit if certain conditions are met. The principal conditions are the requirement for the subsidiary’s shareholders to agree to the exemption and a guarantee to be issued to the subsidiary by the parent undertaking, guaranteeing all of the subsidiary’s outstanding liabilities at the year end, until they are satisfied in full.

41
14. CONTINGENT LIABILITIES Legal claims and actions
From time to time, the group is party to litigation involving clients and sub-contractors arising out of project contracts. Such litigation includes claims or actions by and against the group for cancelled contracts, for additional costs incurred in excess of contract provisions, as well as for back charges for alleged breaches of warranty and other contract commitments. We have recognised provisions for certain known or reasonably likely legal claims or actions against the group. We do not expect known and reasonably likely legal claims or actions for which a provision has not been established to have a material impact on the group’s financial position, results of operations or cash flows. Indemnities and retained obligations
We have agreed to indemnify certain third parties relating to businesses and/or assets that were previously owned by the group and were sold to them. Such indemnifications relate primarily to breach of covenants, breach of representations and warranties, as well as potential exposure for retained liabilities, environmental matters and third party claims for activities conducted by the group prior to the sale of such businesses and/or asset. We have established provisions for those indemnities in respect of which we consider it probable that there will be a successful claim. We do not expect indemnities or retained obligations for which a provision has not been established to have a material impact on the group’s financial position, results of operations or cash flows. Guarantees
The group has guaranteed certain performance obligations in a refinery/ electric power generation plant located in Chile in which we hold a non-controlling interest. Mount Polley
The Mount Polley mine is owned and operated by Mount Polley Mining Corporation, a subsidiary of Imperial Metals Corporation, and is located near the town of Likely, British Columbia, Canada. On 4 August 2014, a tailings pond facility at the mine failed releasing large quantities of water and mine tailings into the local environment. The dam was in the process of being raised at the time of the failure. One of our subsidiaries, along with other parties, had various design and quality assurance responsibilities associated with the expansion of this facility. Our subsidiary was providing engineering services at the time of the breach, but did not perform the original design. An Independent Review Panel issued a report on 30 January 2015 concluding that the cause of failure was shearing along a zone containing a weak soil layer along with other contributory factors. On December 17, 2015, the Chief Inspector of Mines for B.C. issued a report that for the most part agrees with the conclusions of the Independent Review Panel. At this time, litigation has been threatened by the Owner of the Mine and its parent company, Imperial Metals Corporation, but no litigation has yet been commenced against the group. Management’s opinion is that its employees performed in a professional manner consistent with the standard of care for a competent engineer on a project of this nature. In addition, the contract between our subsidiary and Mount Polley Mining Corporation contains limitations of liability provisions that exclude claims for consequential damages and limit the subsidiary’s liability to the amount of professional fees charged, which were less than CDN$1,000,000. Amec Foster Wheeler is taking external legal advice on this matter. In light of both internal and external advice, and given the early stages of this matter, it is considered possible but not probable that there will be an outflow in respect of this issue. Tax planning
The Group undertakes tax planning which is compliant with current legislation and accepted practice. Recent changes to the tax environment, including the OECD’s project around Base Erosion and Profit Shifting have brought into question the legitimacy of tax planning previously undertaken by multinational entities. There have been several recent high profile tax cases against tax authorities and large groups. The European Commission has opened formal investigations to examine whether decisions by the tax authorities in certain European countries, comply with European Union rules. We are monitoring the outcome of these cases in order to understand whether there is any risk to the Group. Based on the Group’s current assessment of such issues, it is too early to speculate on any areas of challenge and potential liabilities and as a result, it is not currently considered probable that there will be an outflow in respect of these issues. 15. POST BALANCE SHEET EVENTS Longview
In early March 2016, the Group settled its dispute with Kvaerner as described in note 12. We have agreed to pay Kvaerner $70m in full and final settlement of their claims. Refinancing
On 1 March 2016, the Group completed a refinancing of its main debt facilities by entering into a new facility with a syndicate of 20 banks. The new facility, which has three tranches - a three-year £650 million term loan, a five-year £650 million term loan and a five-year £400 million revolving credit facility - replaces the company’s existing revolving credit facility and the Foster Wheeler acquisition facility.

42
RESPONSIBILITY STATEMENT OF THE DIRECTORS IN RESPECT OF THE ANNUAL FINANCIAL REPORT
We confirm that to the best of our knowledge:
the financial statements, prepared in accordance with the applicable set of accounting standards, give a true and fair view of the assets, liabilities, financial position and profit or loss of the company and the undertakings included in the consolidation taken as a whole; and
the directors’ report includes a fair review of the development and performance of the business and the position of the issuer and undertakings included in the consolidation taken as a whole, together with a description of the principal risks and uncertainties that they face.
Ian McHoul
Chief Financial Officer and Interim Chief Executive 10 March 2016

43
Principal business and strategic risks
The table below shows Amec Foster Wheeler’s principal business and strategic risks. Each is specific to the Group and could have a material impact on it. Actions have been taken to mitigate these risks and these are also shown.
Risk Mitigation
Geopolitical and economic conditions
Amec Foster Wheeler expects to derive the majority of its
revenues from Europe, the US and Canada and is therefore
particularly affected by political and economic conditions in
those markets.
Changes in general economic conditions may influence
customers’ decisions on capital investment and/or asset
maintenance, which could lead to volatility in the
development of Amec Foster Wheeler’s order intake. These
may also lead to change in the customer base, competition
and in the way customers procure the services we provide.
An increase in competition for new contracts may lead to
different, less favourable contract terms and conditions.
Continuing and escalating unrest and insurgency activity in
the Middle East may have a negative impact on existing and
future opportunities in the region.
Amec Foster Wheeler seeks to maintain a balanced
geographic presence and, through acquisitions and organic
growth, will continue to increase its exposure to other
attractive regions of the world.
The risk associated with economic conditions resulting in a
downturn and affecting the demand for Amec Foster
Wheeler’s services has been addressed, as far as practicable,
by seeking to maintain a balanced business portfolio in terms
of geographies, markets, clients and service offering/business
model.
In light of continuing global economic uncertainties, steps
have been taken to assess and monitor any potential impact
on Amec Foster Wheeler’s business opportunities and
address potential increased supply chain and, more broadly,
counterparty risk.
The Strategy and Business Development function is focussed
on realising the synergies across our customers, markets,
geographies, service offerings and relationships.
Changes in commodity prices
A sustained and significant reduction in oil & gas or
commodity prices would have an adverse impact on the level
of customer spending in Amec Foster Wheeler’s markets and
consequently represents a risk to organic growth.
The fall in oil prices has had an impact on the investment
behaviour of Amec Foster Wheeler customers in this sector,
with pressure on capital expenditure leading to a greater
focus on smaller projects and operating expenditure and an
increase in competition for new contracts.
This risk is mitigated by maintaining a balanced business
portfolio of geographies, markets, clients and service
offerings.
Improved efficiencies through increased workflow between
offices and the effective use of centres of excellence and High
Value Execution Centres.
Project delivery
Failing to maintain discipline and meet customer
expectations on project delivery could result in damage to
reputation, loss of repeat business and potentially lead to
litigation and/or claims against Amec Foster Wheeler.
The Project Delivery function provides assurance, drives
project execution and supports the development, training and
mobilisation of personnel to enhance execution competencies.
In addition the system of globally applied policies and
procedures, combined with comprehensive management
oversight, the risk management process, project reviews,
internal audit, peer reviews and customer feedback, mitigate
the risk to successful project delivery.
Lump sum contracts
Lump sum contracts carry different risks than reimbursable
contracts, with the contractor agreeing the contract price at
the start of the contract and accepting the risk of cost
overruns in completing the project.
This risk is mitigated by having skills and competencies fully
aligned with the project scope. It is further mitigated by having
a clear, delegated authority structure in place, combined with
the formal global mandatory procedures relating to
contracting principles and the tender review process. In
addition, the Project Delivery function referred to in the project
delivery risk above, perform reviews, provide assurance and
drive project execution.

44
Staff recruitment and retention
An inability to attract and retain sufficient high-calibre
employees could become a barrier to the continued success
and growth of Amec Foster Wheeler.
Senior management departures or prolonged absences could
also adversely affect our ability to implement our strategy and
manage our operations efficiently.
This risk is mitigated with a clear Human Resources (HR)
strategy, which is aligned to the business strategy and
focused on attracting, developing and retaining the best
people for the Group with succession planning as
appropriate. It is underpinned by an employee framework
which describes how we manage our people consistently.
In addition, there is a continual review of compensation and
benefits to ensure sector and geographic competitiveness
and there are localised recruitment teams capable of
recruiting large numbers into Amec Foster Wheeler.
Amec Foster Wheeler Academy delivers development
activities to enhance delivery and prepare employees for
more advanced roles.
Health, safety, security and environment
Amec Foster Wheeler is involved in activities and
environments that have the potential to cause serious injury
to personnel or damage to property or the environment and
damage to our reputation.
These activities may involve operations such as design,
construction, commissioning and decommissioning, which
have potential to cause serious environmental damage,
pollution and habitat destruction.
In order to control risk and prevent harm, Amec Foster
Wheeler is focused on achieving the highest standards of
health, safety and security management. This is achieved
through setting of an effective policy and putting in place clear
standards which underpin our health, safety, security and
environmental management systems.
We have put in place processes to assure that our systems
work effectively throughout the organisation and health and
safety performance is regularly reviewed against agreed
targets to facilitate continual improvement.
Amec Foster Wheeler employs environmental and
engineering specialists to support projects in implementing
comprehensive project management planning at all stages of
a project. These processes are governed by appropriate
quality management systems and are supported by risk
identification tools aimed at identifying and managing all
aspects of project environmental risk.
Environmental licences
Amec Foster Wheeler’s build/own/operate facilities and
fabrication/manufacturing sites rely on maintaining
environmental licences to operate, which includes protecting
the environment and achieving legally enforceable operating
parameters. Failure to maintain these standards may result in
the revocation of all or part of the licence and the suspension
of operation, resulting in criminal or civil action and/or
financial risk to the business. Failure to maintain assets
and/or pollution abatement equipment may result in a failure
to meet legally-binding objectives and targets for the
operation.
Environmental management systems are in place to monitor
and mitigate this risk.
Planned preventative maintenance schedules are in place to
further mitigate this risk.
Information technology (IT)
Amec Foster Wheeler is exposed to the risk that the IT
systems on which it relies fail and/or that sensitive data held
by the Group is lost due to ineffective data governance or as
a result of unauthorised access to Amec Foster Wheeler
systems or malware attacks.
Appropriate controls are in place to mitigate the risk of
systems failure and data loss, including systems back-up
procedures, data security breach response plan, disaster
recovery plans and globally distributed data centres providing
a secure and reliable environment for hosting critical
applications. There is also appropriate virus protection,
malware detection and remediation, network security controls
and penetration testing and encryption of mobile devices.
Ethical breach
A substantive ethical breach and/or non-compliance with laws
or regulations could potentially lead to damage to Amec
Amec Foster Wheeler has a number of measures in place to
mitigate the risk of a substantive ethical breach and/or non-
compliance with laws or regulations, including:
embedded policies and procedures;

45
Foster Wheeler’s reputation, fines, litigation and claims for
compensation.
Code of Business Conduct;
segregation of duties;
management oversight;
financial and operational controls;
independent whistle-blowing mechanism;
appointment of ethics and compliance officers;
anti-fraud and other internal audits;
legal team advice;
training programmes supporting the Code of Business Conduct and Anti-bribery and Corruption; and
oversight by the ethics committee of the board
Pensions
Amec Foster Wheeler operates a number of defined benefits
pension schemes, where careful judgement is required in
determining the assumptions for future salary and pension
increases, discount rate, inflation, investment returns and
member longevity. There is a risk of underestimating this
liability.
This risk to Amec Foster Wheeler’s pension schemes is
mitigated by:
maintaining a relatively strong funding position over time;
taking advice from independent qualified actuaries and other professional advisers;
agreeing appropriate investment policies with the trustees; and
close monitoring of changes in the funding position, with reparatory action agreed with the trustees in the event that a sustained deficit emerges.
Legacy risks
Litigation and business claims from divested and non-core
businesses remain a risk to Amec Foster Wheeler.
Managing non-core legacy assets until divestment may
require skills that are not common to the rest of the Company.
Ground contaminants remain at some former Amec Foster
Wheeler operational localities where the pollutant may have
been as a result of the Company’s operations, or the
Company is responsible for its clean-up. There is a risk that
pollution may result in a risk to human health or the
environment. There is potential for civil and/or criminal action
against the Company for such pollutants.
The established legacy team manages these claims with
internal and external legal advice. The aim is to seek cost-
effective management of litigation and promote commercially
sensible settlements where appropriate.
Amec Foster Wheeler has made provisions for the legacy
issues that are believed to be adequate and is not aware of
any other current issues relating to disposed businesses
which are likely to have a material impact. Specialist teams
with the appropriate knowledge are brought in as required.
In the case of any known contaminated land, strategies have
been developed to minimise the risk posed by such
contaminated land, including asset management and land
remediation projects and they remain under continuing
review.
Asbestos liability
The legacy Foster Wheeler business is exposed to significant
numbers of claims relating to alleged exposure to asbestos.
The quantum of these claims is actuarially forecast each year
and provisions are held against these loss projections.
However there is a risk that these loss projections will be
exceeded and the provisions could be inadequate to meet the
liabilities.
There is a dedicated in-house finance and legal resource
including a team of specialist asbestos lawyers who manage
the claims, assisted by National Co-ordinating Counsel (NCC)
and local counsel. A claims strategy has been developed with
the NCC and regular reviews are undertaken.
The team monitors legal developments in these claims and
the strategy to deal with them on a regular basis.
The quantum of these claims is actuarially forecast each year
and provisions are held against the ultimate loss projections.

46
FORWARD-LOOKING STATEMENTS
This announcement contains a number of ‘forward-looking statements’ with respect to the Group’s financial condition,
results of operations and certain of the Group’s plans and objectives.
In particular, such forward-looking statements include statements with respect to:
our expectations regarding the Group’s financial and operating performance, including statements contained within the business review and the Outlook statements in this document, and the performance of joint ventures, associates,
other investments and newly acquired businesses;
intentions and expectations regarding the contracts entered into by the Group or by third parties, including new
services, such as the supply of consultancy, engineering and project management services;
expectations regarding the global economy and the Group’s operating environment, including future market conditions and trends;
revenue and growth expected from Amec Foster Wheeler’s business and its expectations with respect to long term shareholder value growth;
our ability to acquire new contracts, expected growth prospects in and growth in its customers generally;
expected benefits associated with the acquisition of Foster Wheeler;
Forward-looking statements are sometimes, but not always, identified by their use of a date in the future or such words as
“will”, “anticipates”, “aims”, “could”, “may”, “should”, “expects”, “believes”, “intends”, “plans” or “targets”. By their nature, forward-looking statements are inherently predictive, speculative and involve risk and uncertainty because they relate to
events and depend on circumstances that will occur in the future. There are a number of factors that could cause actual results and developments to differ materially from those expressed or implied by these forward-looking statements. These
factors include, but are not limited to, the following:
global economic conditions or other macroeconomic developments in the geographic regions and markets in which the Group operates, including fluctuations in exchange rates;
changes in commodity prices which may impact demand for the Group’s services;
the Group’s exposure to the risks associated with operating in emerging markets;
the failure to meet customer expectations on project delivery, which could result in damage to reputation and/or loss
of repeat business and potentially lead to litigation;
long term contracts which may be subject to early termination, variation or non-renewal provisions;
projects included in the Group’s order book which may be delayed or cancelled;
lump sum contracts, which are subject to the risks associated with unanticipated modifications, technical problems and delays;
the loss of senior management or difficulty in attracting and retaining appropriately skilled personnel;
the failure to comply with health, safety and environmental laws;
the possibility of major safety incidents that can lead to reputational damage and increase potential liabilities;
obligations and liabilities relating to the Group’s divested and non-core businesses;
the failure or security breaches of its information technology systems and/or data security; and
the failure to comply with anti-corruption laws and regulations, economic sanction programmes or other laws and regulations, which may result in the Group becoming subject to fines or penalties and the disruption of its business
activities.
A review of the reasons why actual results and developments may differ materially from the expectations disclosed or implied within forward-looking statements can be found under the heading ‘principal business and strategic risks’. All subsequent written or oral forward-looking statements attributable to the Company or any persons acting on its behalf are expressly qualified in their entirety by the factors referred to above. No assurances can be given that the forward -looking statements in this document will be realised. Subject to compliance with applicable law and regulations, the Company does not intend to update these forward-looking statements and does not undertake any obligation to do so.