2014 flotek annual report bmk
DESCRIPTION
Annual reportTRANSCRIPT

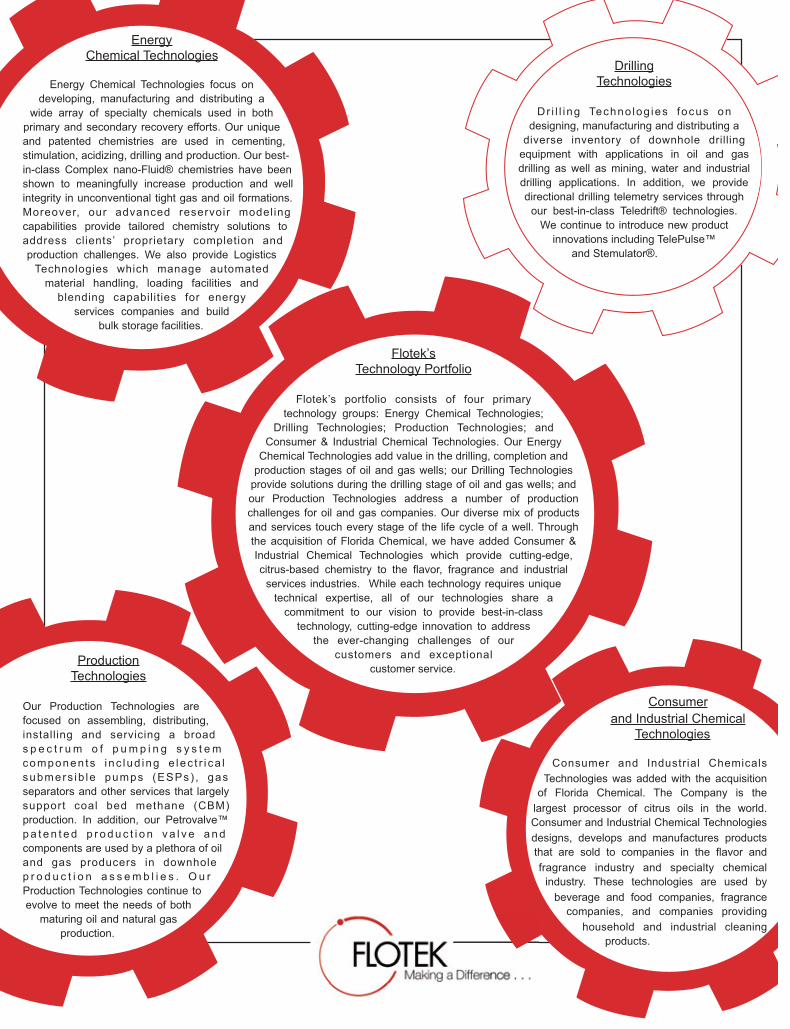
ProductionTechnologies
Our Production Technologies arefocused on assembling, distributing,installing and servicing a broads p e c t r um o f p um p i n g s y s t emcomponen ts inc lud ing e lec t r i ca lsubmers ib le pumps (ESPs) , gasseparators and other services that largelysupport coal bed methane (CBM)production. In addition, our Petrovalve™pa t en t ed p r oduc t i o n va l v e andcomponents are used by a plethora of oiland gas producers in downholep r o d u c t i o n a s s emb l i e s . O u rProduction Technologies continue toevolve to meet the needs of bothmaturing oil and natural gas
production.
Consumerand Industrial Chemical
Technologies
Consumer and Industrial ChemicalsTechnologies was added with the acquisitionof Florida Chemical. The Company is thelargest processor of citrus oils in the world.Consumer and Industrial Chemical Technologiesdesigns, develops and manufactures productsthat are sold to companies in the flavor andfragrance industry and specialty chemicalindustry. These technologies are used bybeverage and food companies, fragrancecompanies, and companies providinghousehold and industrial cleaning
products.
EnergyChemical Technologies
Energy Chemical Technologies focus ondeveloping, manufacturing and distributing a
wide array of specialty chemicals used in bothprimary and secondary recovery efforts. Our uniqueand patented chemistries are used in cementing,stimulation, acidizing, drilling and production. Our best-in-class Complex nano-Fluid® chemistries have beenshown to meaningfully increase production and wellintegrity in unconventional tight gas and oil formations.Moreover, our advanced reservoir modelingcapabilities provide tailored chemistry solutions toaddress clients’ proprietary completion andproduction challenges. We also provide LogisticsTechnologies which manage automatedmaterial handling, loading facilities andblending capabilities for energyservices companies and build
bulk storage facilities.
Flotek’sTechnology Portfolio
Flotek’s portfolio consists of four primarytechnology groups: Energy Chemical Technologies;
Drilling Technologies; Production Technologies; andConsumer & Industrial Chemical Technologies. Our EnergyChemical Technologies add value in the drilling, completion andproduction stages of oil and gas wells; our Drilling Technologiesprovide solutions during the drilling stage of oil and gas wells; andour Production Technologies address a number of productionchallenges for oil and gas companies. Our diverse mix of productsand services touch every stage of the life cycle of a well. Throughthe acquisition of Florida Chemical, we have added Consumer &Industrial Chemical Technologies which provide cutting-edge,citrus-based chemistry to the flavor, fragrance and industrialservices industries. While each technology requires uniquetechnical expertise, all of our technologies share acommitment to our vision to provide best-in-classtechnology, cutting-edge innovation to addressthe ever-changing challenges of our
customers and exceptionalcustomer service.
DrillingTechnologies
Dr i l l i ng Techno log ies focus ondesigning, manufacturing and distributing adiverse inventory of downhole drillingequipment with applications in oil and gasdrilling as well as mining, water and industrialdrilling applications. In addition, we providedirectional drilling telemetry services throughour best-in-class Teledrift® technologies.We continue to introduce new productinnovations including TelePulse™
and Stemulator®.

Fellow Flotek Shareholder:
On behalf of my colleagues at Flotek Industries I am pleased to report to you on the progress of your Company.
By nearly every account, 2014 was an extraordinary year for Flotek as we worked diligently to make a difference for all our shareholders. Record revenue and income combined with new market opportunities are certainly important attributes of a very successful year for your Company.
That said, while it is simple to measure our success in dollars and cents, it is the unwavering dedication and effort of the Flotek team of which I am most proud. The day-in and day-out belief by each member of the Flotek team – from Wyoming to Williston, Midland to Marlow and new frontiers beyond our borders – that they can make a difference for all our stakeholders: our clients; our team members and their communities; the environment; and, most importantly, you, our shareholder, is the most important measure of our success.
While I take this opportunity to share with you Flotek’s achievements in the year just past, I realize there is little time for celebration as the current challenges and our plans to navigate through the tumult are at the forefront of each and every member of the Flotek community. Rest assured, we are prepared for the challenges ahead and believe your Company will emerge as an even stronger leader in oilfield technology as the cycle evolves in the coming months.
Such confidence comes from our belief that Flotek remains extremely well positioned as a leader in an energy services renaissance that will be driven by a new wave of technological innovation, focused on customized chemistry that continues to improve production in new and existing wells and is conscious of the importance of environmental stewardship, a sense of obligation to leave the path of energy exploration as untarnished as possible, proving that energy development and environmental principles can coexist.
While the path to technological change and innovation may be circuitous and cumbersome, the reward makes the journey not only necessary but incredibly rewarding. I am confident that when the history books are written we will look back on the challenges that are currently before us and understand they made Flotek stronger, providing an opportunity to further sharpen our focus on our core competencies, seek opportunities that exploit and expand our key strengths and gain market share and expand our reputation as a leading innovator of value-added oilfield technologies.
That said, we are acutely aware of the cyclical nature of our industry and appreciate that we must live within the realities of our environment. While we are myopically focused on the protection of liquidity and ensuring the preservation of value for our stakeholders, we will also
m
d
n t f th

be strategic in our quest to grow our business through smart, tactical investments in our existing businesses as well as extrinsic opportunities that should create long-term value by adding to our world-class technologies.
It has often been said, “Those who ignore history are bound to repeat it,” a tenet that is especially prescient at Flotek, especially with those that lived through the chilling days of 2008 and 2009 with your Company. I have pledged since I assumed my role as Flotek’s leader that we would never again put your Company in that financial position (or even close) and I remain committed to that pledge. While we can’t do anything about cyclical lows in activity and commodity prices, we can, have and will make certain we do everything possible to ensure Flotek is one of the strongest oilfield technology companies as we reach the cyclical nadir and begin to accelerate and grow in the future.
The most important thing we can do in that regard is make sure that Flotek’s financial position remains strong. I submit to you today that Flotek completed 2014 in its strongest position ever and we continue to work hard to ensure we maintain a sturdy and durable balance sheet even as uncertainty envelopes our industry:
• Flotek’s 2014 revenue was $449.2 million, a record for your Company and an increase of over 21% from 2013 results. Income from Operations was nearly $81 million, an increase of approximately 38% from 2013; and Net Income was over $53 million, an increase of nearly 45% from the previous year, all records for your Company.
• Flotek’s Earnings Before Interest, Taxes, Depreciation and Amortization (EBITDA, a non-GAAP measure of financial performance) for 2014 was over $98 million, an increase of nearly 33% from 2013 levels, another record for Flotek.
• Flotek’s balance sheet ended 2014 as strong as it has been in the history of the Company. We ended the year with only $8 million drawn on our credit facility, continued to reduce the balance on our term loan used to finance a portion of our successful acquisition of Florida Chemical Company and, at the same time repurchased over $10 million of our common equity creating additional value for our continuing shareholders.
In short, our growth combined with our financial stewardship has afforded Flotek a financial position which many of our oilfield brethren would envy: solid earnings growth, minimal leverage and exceptional liquidity to not only endure the cyclical uncertainty but to thrive as the oilfield navigates through uncertainty toward a new cycle of reasonable growth driven by technology-inspired efficiency.
Our commitment to technology and improving the understanding of how that technology – especially customized chemistry – makes better wells is no better demonstrated by our introduction of FracMax™, our patent-pending, cutting-edge software analytical package, last summer.
Using data from FracFocus, the national hydraulic fracturing chemical registry, and state oil and gas regulators, FracMax has compiled a database of comprehensive completion inputs

and historical production results, allowing the comparison of what chemistries are used in the well completion process and the productivity of those wells. In fact, this data is provided to FracFocus and oil and gas regulators - such as the Texas Railroad Commission or the Kansas Corporation Commission – by the exploration companies, meaning the analysis is based on data that our clients have provided to regulators.
The FracMax research staff – as of March, 2015 – has data on over 80,000 wells across the United States and Canada. Employing time-tested statistical analysis, FracMax provides a view inside the impact of using Flotek’s Complex nano-Fluid® completion chemistry in a well.
We have long held that the use of CnF® chemistries in well completions provided a significant economic advantage versus common completion chemistries. However, with FracMax, we can validate and quantify the advantage. The result: FracMax indicates that firms that used CnF chemistry in their wells over the course of the past year gained over $8 billion – yes eight billion – in revenue from incremental production (at $60 oil) versus those companies that chose not to invest in advanced, customized chemistry. Over time, 230-plus unique clients have experienced the benefit of our CnF completion chemistries.
The data and results from FracMax have provided a significant step forward in proving the efficacy of Flotek’s completion chemistry and were key to the growth in our chemistry business in 2014. In fact, dozens of exploration companies chose to validate CnF chemistries in wells across North America during 2014 with nearly all becoming repeat customers. And, even with the challenging commodity price environment, additional companies start new validation projects every month.
In short, FracMax has transformed the competitive landscape and is quickly creating the presumption that CnF should be the default completion chemistry in nearly every well across the country and around the globe. While that doesn’t mean that every exploration company will adopt CnF without further validations, we believe FracMax has fundamentally changed the conversation when presenting Flotek’s suite of advanced completion chemistries.
FracMax is another example of Flotek making a difference for its stakeholders, in this case both our clients and our shareholders. Instead of sitting back and waiting for an uncertain future to come to us, Flotek is on tomorrow’s horizon, shaping the future of completion technology, proactively working to create value for clients and shareholders alike. We are committed to these types of technologies and advanced partnerships as we approach the challenges of 2015 and beyond.
In fact, FracMax is such an important part of Flotek’s strategy, your Company has personified the technology in the form of Max, the friendly humanoid that graces the cover of this year’s Annual Report. Over the course of the next weeks and months, we will continue to bring Max to life through a series of strategic events. Stay tuned. . .we think there is a pretty good chance that Max will become nearly ubiquitous in the oil patch in the coming year.
While FracMax is certainly a highlight of the past twelve months, your Company was busy with a number of other initiatives that we believe added value in the past year and should continue to do so into 2015 and beyond:

• Early in 2014, Flotek completed the acquisition of SiteLark, LLC, adding a leading provider of reservoir engineering and modelling services. SiteLark works globally to develop innovative solutions to enrich reservoir simulation models, build predictive models for unconventional gas and performs engineering studies related to fluid characterization, material balance, decline curves and pressure transient analysis. SiteLark also provides proprietary software solutions for the petroleum industry which assists engineers with reservoir simulation, reservoir engineering and waterflood optimization. Founded by Dr. Deepankar “Dee” Biswas, SiteLark also provides engineering services for Enhanced Oil Recovery projects and serves as a provider of in-depth modelling and evaluation services for EOGA, a company acquired by Flotek in 2013 focused on chemistry and polymer solutions for the Enhanced Oil Recovery market. Dee’s work has been instrumental not only in growing our EOR business platform but has been immensely valuable in modelling the impact of Flotek’s chemistries in reservoir systems.
• In April, Flotek teamed with drilling-fluid guru Tony Rea to purchase intellectual property that expanded the use of Flotek’s CnF into drilling applications. Tony’s decades of experience in drilling fluids has created a series of chemistries that utilize Flotek’s CnF formulations to improve the performance of drilling fluids in a number of conventional and unconventional drilling programs. In partnership with Tony, who signed a long-term consulting agreement with Flotek, we have increased our presence in the drilling fluids market, both domestically and in new international markets. We expect Tony’s knowledge and reputation, combined with our chemistries and research capabilities, to grow meaningfully, even in a more challenging market.
• In June, Flotek introduced a new set of citrus-based chemistries intended to replace Xylene in oil and gas applications. Flotek’s solvents, based on the Company’s technical grade d-limonene, is a double-bonded hydrocarbon produced from the skins of oranges. Laboratory and commercial validations show that d-limonene – an environmentally safe and renewable compound – is as effective as Xylene and other BTEX-type solvents in eviscerating pollutants that stifle production in oil and gas wells. Xylene – a by-product of crude oil – is a known environmental hazard, a ground water contaminant and suspected of numerous negative impacts on human and animal health. In contrast, the U.S. Food and Drug Administration has determined d-limonene to be Generally Regarded as Safe (“GRAS”) and has been given the “Designated for the Environment” label by the U.S. Environmental Protection Agency. As an agricultural by-product, d-limonene is both sustainable and bio-renewable. Flotek continues to refine and advance this environmentally friendly chemistry and we believe, over time, it will become the preferred solvent in production chemistries.
“While the path to technological
change and innovation may be circuitous and
cumbersome, the reward makes the journey not
only necessary but incredibly
rewarding.”

• In October, Flotek announced plans to create a new, re-imagined Research & Innovation Leadership Center. The center will be a 50,000-plus square foot facility located in the Sam Houston Business Park in Northwest Houston. The facility, will combine the Company's applied research and conceptual innovation teams in their development of next-generation chemistries for the oilfield. Our vision is to create a center for chemistry excellence that leverages our world-class scientific talent through state-of-the-art laboratories, provides our customers with an unparalleled tactile experience that literally creates solutions to drilling and production challenges as they watch and allows us to validate the efficacy of our chemistries and communicate the effectiveness with impact. We expect to complete our new facility in late 2015.
In addition to these exciting developments, we made key additions to the Flotek leadership team:
• In January, we added David McMahon to the Flotek team to head the Company’s reimagined Production Technologies division. David spent over two decades in the artificial lift industry with various units of Baker Hughes. David was instrumental in developing Baker Hughes' artificial lift presence in the Williston Basin, one of the most dynamic lift markets in the country. David has already had an impact on the focus of our Production Technologies business, including being the catalyst for our recent acquisition of International Artificial Lift which we believe will be a key growth component of David’s business in the coming months.
• In April, Flotek appointed Amerr Mahgoub as Vice President, Middle East Business
Development. As the leader of Flotek’s Middle Eastern business development and marketing team, Amerr is focused on development of new and existing markets for Flotek. Amerr has over 25 years in the oil patch. Until joining Flotek, Amerr spent his entire career with Schlumberger, concluding his tenure as a key relationship manager between Schlumberger and Saudi Aramco. His understanding of the Middle East and relationship with Aramco have already served Flotek well.
• In January, 2015 Flotek introduced Stephen A. Marinello, PhD as Director of CnF
Applied Technology, a newly created position to counsel Flotek clients on the benefits of CnF and new applications for Flotek’s unique chemistry systems. Steve has spent over two decades exploring and applying new chemistry technologies in the oilfield, including stints in academia and, most recently, as a key member of Shell’s completion team where he was charged with analyzing field performance of mobility enhancement fluids and completion systems. His academic and commercial research focused on completion systems combined with his knowledge of Flotek’s chemistry systems and our SiteLark modelling capabilities is a perfect fit for the Flotek team. Steve will be an integral part of our team that will espouse the benefits of using CnF in well recompletions, a facet of our business we believe will be a major contributor to our success in 2015 and beyond as we continue to emphasize the impact of chemistry in the reservoir.
While these initiatives and strategic decisions are important to the success of Flotek, none would have been possible without the 500-plus members of the Flotek team. Too often, annual
corporate missives leave the reader to wonder just exactly who really makes things happen at the Company.
Let me be crystal clear: the success of Flotek is the result of the hard work and untiring efforts of a group of people who believe they can shape the future. As a leadership team, it is incumbent on us to communicate our vision, challenge the spirit and ensure our team has the tools to exceed even their wildest expectations.
In a more challenging environment, it is also incumbent on leadership to make the decisions necessary to ensure the future of the enterprise, balance conservation and opportunity and position the Company appropriately to be prepared to exploit opportunities as the cycle evolves. While those decisions can be difficult, I am certain we have the right people in the right places to maximize our opportunities in this challenging environment. Moreover, we will continue to make strategic investments in technology that will ensure we work smarter and harder to create more efficient outcomes in the coming months.
We do believe opportunities will present themselves in many ways, both inside and outside our current footprint. We will continue to be deliberate in evaluating external opportunities, using what we’ve learned in the past year to ensure any transaction provides strategic advantages while, at the same time, is a compelling value for your Company. Moreover, especially in this environment, we will continue to carefully scrutinize the cultural fit of any potential partner to avoid the integration challenges that can result from an uneasy feeling of needing to make something happen when staying the course is the right thing to do.
Finally, an important part of a Company’s culture and ethos is giving back. While I am incredibly proud of our commercial success, I am just as proud of Flotek’s decisions to make a difference in the communities we serve. Whether it is our sponsorship of Veterans’ causes, the Red Cross, MD Anderson Children’s Hospital or Eric Dickerson’s efforts to help boys who are growing up without their fathers, Flotek is absolutely committed to giving back, being good stewards of our communities and making a difference in the lives of members of our communities. Without that commitment, our commercial efforts seem less important. Our commitments to our communities give our daily efforts a greater sense of meaning and purpose. That’s what making a difference is all about.
As I have mentioned before when I look at my last five years as the leader of your Company, I marvel at how far our team has come in such a short period of time. And, my conclusion at this time last year may be even more appropriate today.
If we were able to accomplish so much starting with so little, imagine what we can accomplish with the resources available to Flotek today. That, indeed, is our challenge in the coming year: to harness the resources we have developed to create more opportunities to make a difference for all our stakeholders in the coming months.
As I have told the Flotek team in recent weeks, while the challenges and uncertainties in front of us are significant, they pale in comparison to what we faced in 2008 and 2009. Moreover, our team is the most talented in the history of Flotek. Given our track record of addressing,

overcoming and excelling during periods of tumult, I am both confident and excited that the best is yet to come for Flotek and its stakeholders, especially you, our shareholders.
Finally, I know each of you will join me in acknowledging and thanking Joe Graham, a friend and long-time Flotek team member for his service to your Company. Joe, the controller at CESI, our chemistry research and production subsidiary, from its infancy is retiring this month after a decade-plus of service. While many of you may not have interacted with Joe, his steady demeanor and common-sense approach to the accounting issues of a rapidly growing company kept the Marlow trains running on time. Joe was an integral part of the positive evolution of our chemistry production hub in Marlow and a trusted and reasoned voice in our sometimes frenzied business.
Colleagues like Joe are what make Flotek a special place. Thank you, Joe, for your service and for making a difference during your tenure at Flotek.
I conclude this year’s missives with the same pledge I have made each year since becoming the President of your Company: Along with all of my colleagues at Flotek, I pledge to you, our shareholders, that everything we do will be based on our belief that it is in the best interest of our stakeholders. First and foremost, we will work tirelessly to add value and continue to earn your trust.
In short, we will make a difference.
Thank you for your continued interest and support of Flotek.
With appreciation,
John W. ChisholmChairman, President and Chief Executive
Officer

[THIS PAGE INTENTIONALLY LEFT BLANK]

UNITED STATESSECURITIES AND EXCHANGE COMMISSION
Washington, D.C. 20549
FORM 10-KÈ ANNUAL REPORT PURSUANT TO SECTION 13 OR 15(d) OF THE SECURITIES EXCHANGE
ACT OF 1934For the fiscal year ended December 31, 2014
or‘ TRANSITION REPORT PURSUANT TO SECTION 13 OR 15(d) OF THE SECURITIES EXCHANGE
ACT OF 1934For the transition period from to
Commission File Number 1-13270
FLOTEK INDUSTRIES, INC.(Exact name of registrant as specified in its charter)
Delaware 90-0023731(State or other jurisdiction of
incorporation or organization)(I.R.S. Employer
Identification No.)
10603 W. Sam Houston Parkway N. #300Houston, TX 77064
(Address of principal executive offices) (Zip Code)
(713) 849-9911(Registrant’s telephone number, including area code)
Securities registered pursuant to Section 12(b) of the Act:Title of each class Name of each exchange on which registered
Common Stock, $0.0001 par value New York Stock Exchange, Inc.Securities registered pursuant to Section 12(g) of the Act:
NoneIndicate by check mark:
• if the registrant is a well-known seasoned issuer, as defined in Rule 405 of the Securities Act. Yes È No ‘
• if the registrant is not required to file reports pursuant to Section 13 or Section 15(d) of the Act. Yes ‘ No È
• whether the registrant (1) has filed all reports required to be filed by Section 13 or 15(d) of the SecuritiesExchange Act of 1934 during the preceding 12 months (or for such shorter period that the registrant was required to filesuch reports), and (2) has been subject to such filing requirements for the past 90 days. Yes È No ‘
• whether the registrant has submitted electronically and posted on its corporate Website, if any, everyInteractive Data File required to be submitted and posted pursuant to Rule 405 of Regulation S-T (§232.405 of thischapter) during the preceding 12 months (or for such shorter period that the registrant was required to submit and postsuch files). Yes È No ‘
• if disclosure of delinquent filers pursuant to Item 405 of Regulation S-K (§229.405 of this chapter) is notcontained herein, and will not be contained, to the best of registrant’s knowledge, in definitive proxy or informationstatements incorporated by reference in Part III of this Form 10-K or any amendment to this Form 10-K. ‘
• whether the registrant is a large accelerated filer, an accelerated filer, a non-accelerated filer, or a smallerreporting company. See the definitions of “large accelerated filer,” “accelerated filer” and “smaller reporting company”in Rule 12b-2 of the Exchange Act.Large accelerated filer È Accelerated filer ‘ Non-accelerated filer ‘ (Do not check if a smaller reporting company)Smaller reporting company ‘
• whether the registrant is a shell company (as defined in Rule 12b-2 of the Exchange Act). Yes ‘ No È
The aggregate market value of voting stock held by non-affiliates of the registrant as of June 30, 2014 (based on theclosing market price on the NYSE Composite Tape on June 30, 2014) was approximately $1,527,000,000. AtJanuary 16, 2015, there were 53,364,905 outstanding shares of the registrant’s common stock, $0.0001 par value.
DOCUMENTS INCORPORATED BY REFERENCEThe information required in Part III of the Annual Report on Form 10-K is incorporated by reference to the registrant’sdefinitive proxy statement to be filed pursuant to Regulation 14A for the registrant’s 2015 Annual Meeting ofStockholders.

[THIS PAGE INTENTIONALLY LEFT BLANK]

TABLE OF CONTENTS
PART I . . . . . . . . . . . . . . . . . . . . . . . . . . . . . . . . . . . . . . . . . . . . . . . . . . . . . . . . . . . . . . . . . . . . . . . . 1
Item 1. Business . . . . . . . . . . . . . . . . . . . . . . . . . . . . . . . . . . . . . . . . . . . . . . . . . . . . . . . . . . . . . . . . . . 1
Item 1A. Risk Factors . . . . . . . . . . . . . . . . . . . . . . . . . . . . . . . . . . . . . . . . . . . . . . . . . . . . . . . . . . . . . . . 6
Item 1B. Unresolved Staff Comments . . . . . . . . . . . . . . . . . . . . . . . . . . . . . . . . . . . . . . . . . . . . . . . . . . . 18
Item 2. Properties . . . . . . . . . . . . . . . . . . . . . . . . . . . . . . . . . . . . . . . . . . . . . . . . . . . . . . . . . . . . . . . . . 18
Item 3. Legal Proceedings . . . . . . . . . . . . . . . . . . . . . . . . . . . . . . . . . . . . . . . . . . . . . . . . . . . . . . . . . . . 19
Item 4. Mine Safety Disclosures . . . . . . . . . . . . . . . . . . . . . . . . . . . . . . . . . . . . . . . . . . . . . . . . . . . . . . 19
PART II . . . . . . . . . . . . . . . . . . . . . . . . . . . . . . . . . . . . . . . . . . . . . . . . . . . . . . . . . . . . . . . . . . . . . . . 20
Item 5. Market for Registrant’s Common Equity, Related Stockholder Matters and Issuer Purchasesof Equity Securities . . . . . . . . . . . . . . . . . . . . . . . . . . . . . . . . . . . . . . . . . . . . . . . . . . . . . . . . 20
Item 6. Selected Financial Data . . . . . . . . . . . . . . . . . . . . . . . . . . . . . . . . . . . . . . . . . . . . . . . . . . . . . . 23
Item 7. Management’s Discussion and Analysis of Financial Condition and Results ofOperations . . . . . . . . . . . . . . . . . . . . . . . . . . . . . . . . . . . . . . . . . . . . . . . . . . . . . . . . . . . . . . . 24
Item 7A. Quantitative and Qualitative Disclosures About Market Risk . . . . . . . . . . . . . . . . . . . . . . . . . 42
Item 8. Financial Statements and Supplementary Data . . . . . . . . . . . . . . . . . . . . . . . . . . . . . . . . . . . . 44
Item 9. Changes in and Disagreements With Accountants on Accounting and FinancialDisclosure . . . . . . . . . . . . . . . . . . . . . . . . . . . . . . . . . . . . . . . . . . . . . . . . . . . . . . . . . . . . . . . 81
Item 9A. Controls and Procedures . . . . . . . . . . . . . . . . . . . . . . . . . . . . . . . . . . . . . . . . . . . . . . . . . . . . . . 81
Item 9B. Other Information . . . . . . . . . . . . . . . . . . . . . . . . . . . . . . . . . . . . . . . . . . . . . . . . . . . . . . . . . . . 81
PART III . . . . . . . . . . . . . . . . . . . . . . . . . . . . . . . . . . . . . . . . . . . . . . . . . . . . . . . . . . . . . . . . . . . . . . 82
Item 10. Directors, Executive Officers and Corporate Governance . . . . . . . . . . . . . . . . . . . . . . . . . . . . 82
Item 11. Executive Compensation . . . . . . . . . . . . . . . . . . . . . . . . . . . . . . . . . . . . . . . . . . . . . . . . . . . . . 82
Item 12. Security Ownership of Certain Beneficial Owners and Management and RelatedStockholder Matters . . . . . . . . . . . . . . . . . . . . . . . . . . . . . . . . . . . . . . . . . . . . . . . . . . . . . . . 82
Item 13. Certain Relationships and Related Transactions, and Director Independence . . . . . . . . . . . . 82
Item 14. Principal Accountant Fees and Services . . . . . . . . . . . . . . . . . . . . . . . . . . . . . . . . . . . . . . . . . . 82
PART IV . . . . . . . . . . . . . . . . . . . . . . . . . . . . . . . . . . . . . . . . . . . . . . . . . . . . . . . . . . . . . . . . . . . . . . 83
Item 15. Exhibits and Financial Statement Schedules . . . . . . . . . . . . . . . . . . . . . . . . . . . . . . . . . . . . . . 83
SIGNATURES . . . . . . . . . . . . . . . . . . . . . . . . . . . . . . . . . . . . . . . . . . . . . . . . . . . . . . . . . . . . . . . . . 86
i

FORWARD-LOOKING STATEMENTS
This Annual Report on Form 10-K (the “AnnualReport”), and in particular, Part II, Item 7 –“Management’s Discussion and Analysis of FinancialCondition and Results of Operations,” contains“forward-looking statements” within the meaning ofthe safe harbor provisions, 15 U.S.C. § 78u-5, of thePrivate Securities Litigation Reform Act of 1995.Forward-looking statements are not historical factsbut instead represent the Company’s currentassumptions and beliefs regarding future events,many of which, by their nature, are inherentlyuncertain and outside the Company’s control. Theforward-looking statements contained in this AnnualReport are based on information available as of thedate of this Annual Report. The forward lookingstatements relate to future industry trends andeconomic conditions, forecast performance or resultsof current and future initiatives and the outcome ofcontingencies and other uncertainties that may have asignificant impact on the Company’s business, futureoperating results and liquidity. These forward-looking statements generally are identified by wordssuch as “anticipate,” “believe,” “estimate,”“continue,” “intend,” “expect,” “plan,” “forecast,”
“project” and similar expressions, or future-tense orconditional constructions such as “will,” “may,”“should,” “could” and “would,” or the negativethereof or other variations thereon or comparableterminology. The Company cautions that thesestatements are merely predictions and are not to beconsidered guarantees of future performance.Forward-looking statements are based upon currentexpectations and assumptions that are subject to risksand uncertainties that can cause actual results todiffer materially from those projected, anticipated orimplied. A detailed discussion of potential risks anduncertainties that could cause actual results andevents to differ materially from forward-lookingstatements include, but are not limited to, thosediscussed in Part I, Item 1A – “Risk Factors” in thisAnnual Report and periodically in future reports filedwith the Securities and Exchange Commission (the“SEC”).
The Company has no obligation to publicly update orrevise any forward-looking statements, whether as aresult of new information or future events, except asrequired by law.
ii
PART I
Item 1. Business.
General
Flotek Industries, Inc. (“Flotek” or the “Company”)is a global diversified, technology-driven companythat develops and supplies oilfield products, servicesand equipment to the oil, gas and mining industries,and high value compounds to companies that makecleaning products, cosmetics, food and beverages andother products that are sold in consumer andindustrial markets.
The Company was originally incorporated in theProvince of British Columbia on May 17, 1985. InOctober 2001, the Company moved the corporatedomicile to Delaware and effected a 120 to 1 reversestock split by way of a reverse merger with CESIChemical, Inc. (“CESI”). Since then, the Companyhas grown through a series of acquisitions andorganic growth.
In December 2007, the Company’s common stockbegan trading on the New York Stock Exchange(“NYSE”) under the stock ticker symbol “FTK.”Annual reports on Form 10-K, quarterly reports onForm 10-Q, current reports on Form 8-K, andamendments to those reports filed or furnishedpursuant to Section 13(a) or 15(d) of the SecuritiesExchange Act of 1934, (the “Exchange Act”) areposted to the Company’s website, www.flotekind.com,as soon as practicable subsequent to electronicallyfiling or furnishing to the SEC. Information containedin the Company’s website is not to be considered aspart of any regulatory filing. As used herein, “Flotek,”the “Company,” “we,” “our” and “us” refers to FlotekIndustries, Inc. and/or the Company’s wholly ownedsubsidiaries. The use of these terms is not intended toconnote any particular corporate status or relationship.
Recent Developments
In May 2013, the Company acquired FloridaChemical Company, Inc. (“Florida Chemical”) for atotal purchase price of $106.4 million. FloridaChemical is one of the world’s largest processors ofcitrus oils and is a pioneer in solvent, chemicalsynthesis, and flavor and fragrance applications fromcitrus oils. Florida Chemical has been an innovator increating high performance, bio-based products for avariety of industries, including applications in the oil
and gas industry. This acquisition brings a portfolioof high performance renewable and sustainablechemistries that perform well in the oil and gasindustry as well as non-energy related markets. Theacquisition expands the Company’s business intoconsumer and industrial chemical technologies whichprovide products for the flavor and fragrance industryand the specialty chemical industry. Thesetechnologies are used by food and beveragecompanies, fragrance companies, and companiesproviding household and industrial cleaning products.
In November 2013, the Company signed a shareholderagreement with Tasneea Oil and Gas Technologies,LLC (“Tasneea”) an Omani Limited LiabilityCompany, to form Omani based Flotek Gulf, LLC(“Flotek Gulf”) and Flotek Gulf Research, LLC(“Flotek Gulf Research”). During the fourth quarter of2014, Flotek and Tasneea transferred initial capitalinto Flotek Gulf and Flotek Gulf Research. Flotek Gulfand Flotek Gulf Research will develop and marketspecialty chemistries for the oil and gas industrythroughout the Middle East and North Africa. In thecoming year, Flotek Gulf expects to construct amanufacturing facility designed to produce chemicalproducts including Flotek’s patented and proprietaryproducts for distribution throughout the region.
In January 2014, the Company acquired 100% of themembership interest in Eclipse IOR Services, LLC(“EOGA”), a leading Enhanced Oil Recovery designand injection firm. The Company paid $5.3 million,net of cash received, in cash consideration and94,354 shares of the Company’s Common Stock.EOGA’s enhanced oil recovery processes and its useof polymers to improve the performance of EORprojects has been combined with the Company’sexisting EOR products and services.
In April 2014, the Company acquired 100% of themembership interests in SiteLark, LLC (“SiteLark”)for $0.4 million and 5,327 shares of the Company’scommon stock. SiteLark provides reservoirengineering and modeling services for a variety ofhydrocarbon applications. Its services includeproprietary software which assists engineers withreservoir simulation, reservoir engineering andwaterflood optimization.
1

In May 2014, the Company launched its patentpending FracMaxTM software technology thatallows the Company to quantitatively demonstratethe benefits associated with the use of theCompany’s patented and proprietary Complex nanoFluidTM chemistries. The Company has integratedthe use of the FracMaxTM software technology intoits sales and marketing activities resulting in asignificant increase in interest in the Company’sComplex nano-FluidTM chemistries.
Description of Operations and Segments
Flotek operates in over 20 domestic andinternational markets, including the Gulf Coast,Southwest, West Coast, Rocky Mountains,Northeastern and Mid-Continental regions of theUnited States (the “U.S.”), Canada, Mexico, CentralAmerica, South America, Europe, Africa, MiddleEast, Australia and Asia-Pacific.
The Company has four strategic business segments:Energy Chemical Technologies, Consumer andIndustrial Chemical Technologies, DrillingTechnologies and Production Technologies. TheCompany offers competitive products and servicesderived from technological advances, some ofwhich are patented, that are reactive to industrydemands in both domestic and internationalmarkets.
Financial information about operating segments andgeographic concentration is provided in Note 17 –“Segment and Geographic Information” and in PartII, Item 8 – “Financial Statements andSupplementary Data” in this annual report.
Information about the Company’s four operatingsegments is below.
Energy Chemical Technologies
The Energy Chemical Technologies segmentdesigns, develops, manufactures, packages andmarkets chemicals for use in oil and gas (“O&G”)well drilling, cementing, completion, stimulationand production activities designed to maximizerecovery in both new and mature fields, includingenhanced and improved oil recovery markets. Thesespecialty chemicals possess enhanced performancecharacteristics and are manufactured to withstand abroad range of downhole pressures, temperaturesand other well-specific conditions to be compliant
with customer specifications. This segment has twooperational laboratories: (1) a technical serviceslaboratory and (2) a research and innovationlaboratory. Each focuses on design improvements,development and viability testing of new chemicalformulations, and continued enhancement ofexisting products. Chemicals branded Complexnano-Fluid® technologies (“CnF® products”) arepatented both domestically and internationally andare proven strategically cost-effective performanceadditives within both oil and natural gas markets.The CnF® products mixtures are environmentallyfriendly, stable mixtures of oil, water and surfaceactive agents which organize molecules into nanostructures. The combined advantage of solvents,surface active agents and water and the resultantnano structures improves well treatment results ascompared to the independent use of solvents andsurface active agents. CnF® products are composedof renewable, plant derived, cleaning ingredientsand oils that are certified as biodegradable. CertainCnF® products have been approved for use in theNorth Sea, which has some of the most stringent oilfield environmental standards in the world. CnF®
chemistries have also helped achieve improvedoperational and financial results for the Company’scustomers in low permeability sand and shalereservoirs.
The Logistics division of the Company’s EnergyChemical Technologies segment designs, operatesand manages automated bulk material handling andloading facilities. The bulk facilities handle drycement and additives for oil and natural gas wellcementing, and supply materials used in oilfieldoperations.
The segment launched its patent pendingFracMaxTM software technology in 2014. TheFracMaxTM application is an innovative softwaretechnology that allows the Company toquantitatively demonstrate the benefits associatedwith the use of the segment’s patented andproprietary Complex nano-Fluid® chemistries.
Consumer and Industrial Chemical Technologies
The Consumer and Industrial ChemicalsTechnologies (“CICT”) segment, was added inconjunction with the acquisition of FloridaChemical in May 2013. This segment sources citrusoil domestically and internationally and is one ofthe largest processors of citrus oils in the world.
2
Products produced from processed citrus oil include(1) high value compounds used as additives bycompanies in the flavors and fragrances marketsand (2) environmentally friendly chemicals for usein the oil & gas industry and numerous otherindustries around the world. The CICT segmentdesigns, develops and manufactures products thatare sold to companies in the flavor and fragranceindustry and specialty chemical industry. Thesetechnologies are used within food and beverage,fragrance, and household and industrial cleaningproducts industries.
Drilling Technologies
The Drilling Technologies segment is a leadingprovider of downhole drilling tools for use inoilfield, mining, water-well and industrial drillingactivities. This segment manufactures, rents, sells,inspects and assembles specialized equipment usedin drilling, completion, production, and work-overactivities. Established tool rental operations arestrategically located throughout the United States(the “U.S.”) and in a number of internationalmarkets. Rental tools include stabilizers, drillcollars, reamers, wipers, jars, shock subs, wirelesssurvey, measurement while drilling (“MWD”)tools, Stemulator® tools and mud-motors.Equipment sold primarily includes miningequipment, cementing accessories and drillingmotor components. The Company remains focusedon product marketing for this segment in all regionsof the U.S., as well as in select internationalmarkets through both direct and agent-based sales.
Production Technologies
The Production Technologies segment providespumping system components, electric submersiblepumps (“ESPs”), gas separators, production valves,and complementary services. These artificial liftproducts satisfy the requirements of traditional oiland natural gas production and coal bed methanemarkets by assisting natural gas, oil and other fluidsmovement from the producing horizon to thesurface. Patented products within the Company’sPetrovalveTM product line optimize pumpingefficiency in horizontal well completions as well asin heavy oil wells and wells with high liquid to gasratios. PetrovalveTM products placed horizontallyincrease flow per stroke and eliminate gas lockingof traditional ball and seat valves that traditionallyrequire more maintenance. The patented gas
separation technology is particularly effective incoal bed methane production, efficiently separatinggas and water downhole as well as ensuringsolution gas is not lost in water production. TheCompany’s products are sourced internationally anddomestically, assembled at domestic locations anddistributed globally.
Seasonality
Overall, operations are not significantly affected byseasonality. While certain working capitalcomponents build and recede throughout the year inconjunction with established purchasing and sellingcycles that can impact operations and financialposition, these cycles have not been significant todate. The performance of certain services withineach of the Company’s segments, however, issusceptible to both weather and naturally occurringphenomena, including, but not limited to thefollowing:
‰ the severity and duration of wintertemperatures in North America, which impactsnatural gas storage levels, drilling activity andcommodity prices;
‰ the timing and duration of the Canadian springthaw and resulting restrictions that impactactivity levels;
‰ the timing and impact of hurricanes uponcoastal and offshore operations;
‰ certain Federal land drilling restrictions duringidentified breeding seasons of protected birdspecies in key Rocky Mountain coal bedmethane producing regions. These restrictionsgenerally have a negative impact on ProductionTechnologies operations in the first or secondquarters of the year; and
‰ adverse weather in Florida and Brazil canimpact the availability of citrus oils for theCICT business unit.
Product Demand and Marketing
Demand for the Company’s products and services isdependent on levels of conventional and non-conventional oil and natural gas well drilling andproduction, both domestically and internationally.Products are marketed directly to customers throughthe Company’s direct sales force and throughcertain contractual agency arrangements.Established customer relationships provide repeatsales opportunities within all segments. While the
3

Company’s primary marketing efforts remainfocused in North America, a growing amount ofresources and effort are focused on emerginginternational markets, especially in the Middle Eastand North Africa (“MENA”) as well as SouthAmerica. In addition to direct marketing andrelationship development, the Company alsomarkets products and services through the use ofthird party agents in Mexico, Central America,South America, Europe, Africa, the Middle East,Australia, and Asia-Pacific.
Customers
The Company’s customers primarily include majorintegrated oil and natural gas companies, oilfieldservice companies, independent oil and natural gascompanies, pressure pumping service companies,international supply chain management companies,national and state-owned oil companies, householdand commercial cleaning product companies,fragrance and cosmetic companies, and foodmanufacturing companies. For the year endedDecember 31, 2014, the Company had threecustomers that accounted for 16%, 7% and 6% ofconsolidated revenue, respectively. For the yearsended December 31, 2013 and 2012, the Companyhad a single customer that accounted for 16% and16% of consolidated revenue, respectively. Inaggregate, the Company’s largest three customerscollectively accounted for 29%, 30% and 35% ofconsolidated revenue for the years endedDecember 31, 2014, 2013 and 2012, respectively.
Research and Innovation
The Company is engaged in research andinnovation activities focused on the improvement ofexisting products and services, the design ofreservoir specific, customized chemistries, and thedevelopment of new products, processes andservices. For the years ended December 31, 2014,2013 and 2012, the Company incurred $5.0 million,$3.8 million and $3.2 million, respectively, ofresearch and innovation expense. In 2014, researchand innovation expense was approximately 1.1% ofconsolidated revenue. The Company expects that its2015 research and innovation investment willincrease commensurate with the growth of thebusiness.
Backlog
Due to the nature of the Company’s contractualcustomer relationships and the way they operate,the Company has historically not had significantbacklog order activity.
Intellectual Property
The Company’s policy is to protect its intellectualproperty, both within and outside of the U.S. TheCompany pursues patent protection for all productsand methods deemed to have commercialsignificance and that qualify for patent protection.The decision to pursue patent protection isdependent upon several factors, including whetherpatent protection can be obtained, cost-effectivenessand alignment with operational and commercialinterests. The Company believes its patent andtrademark portfolio, combined with confidentialityagreements, trade secrets, proprietary designs,manufacturing and operational expertise, arenecessary and appropriate to protect its intellectualproperty and ensure continued strategic advantages.The Company currently has 15 issued patents andover four dozen pending patent applications onvarious chemical compositions and methods as wellas various downhole tools, including its ProSeries™tools. In addition, the Company also has severalregistered trademarks and pending trademarkapplications covering a variety of its goods andservices.
Competition
The ability to compete in the oilfield servicesindustry and the consumer and industrial markets isdependent upon the Company’s ability todifferentiate products and services, provide superiorquality and service, and maintain a competitive coststructure. Activity levels in the oil field servicesindustry are impacted by current and expected oiland natural gas prices, vertical and horizontaldrilling rig count, other oil and natural gas drillingactivity, production levels and customer drilling andproduction designated capital spending. Domesticand international regions in which Flotek operatesare highly competitive. The unpredictability of theenergy industry and commodity price fluctuationscreate both increased risk and opportunity for theservices of both the Company and its competitors.
4

Certain oil and natural gas service companiescompeting with the Company are larger and haveaccess to more resources. Such competitors couldbe better situated to withstand industry downturns,compete on the basis of price, and acquire anddevelop new equipment and technologies; all ofwhich could affect the Company’s revenue andprofitability. Oil and natural gas service companiesalso compete for customers and strategic businessopportunities. Thus, competition could have adetrimental impact upon the Company’s business.
The d-Limonene citrus-based terpene is a majorfeedstock for many of the Company’s CnF®
chemistries. In addition, the Company utilizesterpenes from other natural sources when itdetermines the efficacy of such formulas isappropriate. The Company is currently examiningthe potential of varying terpene streams in severalproprietary chemistries. It is also assessing theviability of removing trace amounts of “BTEX”(benzene, toluene, ethylbenzene, and xylene)compounds from such terpenes to ensure they meetFlotek’s rigorous environmental standards.
The Company faces competition from other citrusprocessors and other solvent sources. Otherterpenes can provide an effective substitute to theCompany’s citrus-based terpenes, although, withoutrefinement, are generally of lower quality. Suchterpenes can be cheaper than citrus terpenes, but, asnoted above, can contain “BTEX” compounds(benzene, toluene, ethylbenzene, and xylenes), andother volatile organic compounds that have varyingdegrees of toxicity. The Company’s chemistries areintended to replace these undesirable qualities.Management believes that environmentalconstituents will continue to promote “BTEX”substitutes, which diminishes the threat ofsubstitution in ecologically sensitive applicationsfrom these competitors.
Raw Materials
Materials and components used in the Company’sservicing and manufacturing operations, as well asthose purchased for sale, are generally available onthe open market from multiple sources. Collectionand transportation of raw materials to Companyfacilities, however, could be adversely affected byextreme weather conditions. Additionally, certainraw materials used by the Chemicals segments areavailable from limited sources. Disruptions to
suppliers could materially impact sales. The pricespaid for raw materials vary based on energy, steel,citrus, and other commodity price fluctuations,tariffs, duties on imported materials, foreigncurrency exchange rates, business cycle positionand global demand. Higher prices for chemicals,steel, citrus, and other raw materials couldadversely impact future sales and contractfulfillments.
The Company is diligent in its efforts to identifyalternate suppliers, in its contingency planning forpotential supply shortages, and in its proactiveefforts to reduce costs through competitive biddingpractices. The Drilling Technologies andProduction Technologies segments purchase rawmaterials and steel on the open market fromnumerous suppliers. When able, the Company usesmultiple suppliers, both domestically andinternationally, for all raw materials purchases.
Drilling Technologies maintains a three to sixmonth supply of mud-motor inventory parts sourcedfrom international and domestic suppliers, andDrilling Technologies and Production Technologiesmaintain parts necessary to meet forecast demand.The Company’s inventory levels are maintained toaccommodate the lead time required to secure partsto avoid disruption of service to customers.
Government Regulations
The Company is subject to federal, state and localenvironmental, occupational safety and health lawsand regulations within the U.S. and other countriesin which the Company does business. TheCompany strives to ensure full compliance with allregulatory requirements and is unaware of anymaterial instances of noncompliance. In the U.S.,the Company must comply with laws andregulations which include, among others:
‰ the Comprehensive Environmental Response,Compensation and Liability Act;
‰ the Resource Conservation and Recovery Act;‰ the Federal Water Pollution Control Act;‰ the Toxic Substances Control Act; and‰ the Affordable Care Act.
In addition to U.S. federal laws and regulations, theCompany does business in other countries whichhave extensive environmental, legal, and regulatoryrequirements. Laws and regulations strictly govern
5

the manufacture, storage, handling, transportation,use and sale of chemical products. The Companyevaluates the environmental impact of its actions andattempts to quantify the cost of remediatingcontaminated property in order to maintaincompliance with regulatory requirements and identifyand avoid potential liability. Several products of theEnergy Chemicals Technologies’ and Consumer andIndustrial Chemical Technologies’ segments areconsidered hazardous or flammable. In the event of aleak or spill in association with Company operations,the Company could be exposed to risk of materialcost, net of insurance proceeds, to remediate anycontamination.
From time to time, the Company may be party inenvironmental litigation and claims, includingremediation of properties owned or operated. Noenvironmental litigation or claims are currently beinglitigated. The Company does not expect that costsrelated to known remediation requirements will havea significant adverse effect on the Company’sconsolidated financial position or results ofoperations.
Employees
At December 31, 2014, the Company had 561employees, exclusive of existing worldwide agencyrelationships. None of the Company’s employees arecovered by a collective bargaining agreement andlabor relations are generally positive. Certaininternational locations have staffing or workarrangements that are contingent upon local workcouncils or other regulatory approvals.
Available Information and Website
The Company’s website is accessible atwww.flotekind.com. Annual reports on Form 10-K,quarterly reports on Form 10-Q, current reports on
Form 8-K and amendments to reports filed orfurnished pursuant to Section 13(a) or 15(d) of theExchange Act are available (see the “InvestorRelations” section of the Company’s website), assoon as reasonably practicable, subsequent toelectronically filing or otherwise providing reports tothe SEC. Corporate governance materials, guidelines,by-laws, and code of business conduct and ethics arealso available on the website. A copy of corporategovernance materials is available upon writtenrequest to the Company.
All material filed with the SEC’s “Public ReferenceRoom” at 100 F Street NE, Washington, DC 20549 isavailable to be read or copied. Information regardingthe “Public Reference Room” can be obtained bycontacting the SEC at 1-800-SEC-0330. Further, theSEC maintains the www.sec.gov website, whichcontains reports and other registrant information filedelectronically with the SEC.
The 2014 Annual Chief Executive OfficerCertification required by the NYSE was submitted onMay 13, 2014. The certification was not qualified inany respect. Additionally, the Company has filed allprincipal executive officer and financial officercertifications as required under Sections 302 and 906of the Sarbanes-Oxley Act of 2002 with this AnnualReport. Information with respect to the Company’sexecutive officers and directors is incorporated hereinby reference to information to be included in theproxy statement for the Company’s 2015 AnnualMeeting of Stockholders.
The Company has disclosed and will continue todisclose any changes or amendments to theCompany’s code of business conduct and ethics aswell as waivers to the code of ethics applicable toexecutive management by posting such changes orwaivers on the Company’s website.
Item 1A. Risk Factors.
The Company’s business, financial condition, resultsof operations and cash flows are subject to variousrisks and uncertainties. Readers of this report shouldnot consider any descriptions of these risk factors tobe a complete set of all potential risks that couldaffect Flotek. These factors should be carefullyconsidered together with the other information
contained in this Report and the other reports andmaterials filed by us with the SEC. Further, many ofthese risks are interrelated and could occur undersimilar business and economic conditions, and theoccurrence of certain of them may in turn cause theemergence or exacerbate the effect of others. Such acombination could materially increase the severity ofthe impact of these risks on our business, results ofoperations, financial condition, or liquidity.
6

This Annual Report contains “forward-lookingstatements,” as defined in the Private SecuritiesLitigation Reform Act of 1995, that involve risksand uncertainties. Forward-looking statementsdiscuss Company prospects, expected revenue,expenses and profits, strategic operationalinitiatives and other activity. Forward-lookingstatements also contain suppositions regardingfuture oil and natural gas industry conditions withinboth domestic and international market economies.The Company’s results could differ materially fromthose anticipated in the forward-looking statementsas a result of a variety of factors, including risksdescribed below and elsewhere. See “Forward-Looking Statements” at the beginning of thisAnnual Report.
Risks Related to the Company’s Business
The Company’s business is dependent upondomestic and international oil and natural gasindustry spending. Spending could be adverselyaffected by industry conditions or by new orincreased governmental regulations beyond theCompany’s control.
The Company is dependent upon customers’willingness to make operating and capitalexpenditures for exploration, development andproduction of oil and natural gas in both the NorthAmerican and global markets. Customers’expectations of a decline in future oil and naturalgas market prices could curtail spending therebyreducing demand for the Company’s products andservices. Industry conditions are influenced bynumerous factors over which the Company has nocontrol, including the supply of and demand for oiland natural gas, domestic and internationaleconomic conditions, political instability in oil andnatural gas producing countries and merger anddivestiture activity among oil and natural gasproducers. The volatility of oil and natural gasprices and the consequential effect on explorationand production activity could adversely impact theCompany’s customers’ activity levels. Oneindicator of drilling and production spending isfluctuation in rig count which the Company activelymonitors to gauge market conditions and forecastproduct and service demand. A reduction in drillingactivity could cause a decline in the demand for, ornegatively affect the price of, some of theCompany’s products and services. Domesticdemand for oil and natural gas could also be
uniquely affected by public attitude regardingdrilling in environmentally sensitive areas, vehicleemissions and other environmental standards,alternative fuels, taxation of oil and gas, perceptionof “excess profits” of oil and gas companies, andanticipated changes in governmental regulation andpolicy.
Demand for a significant number of Companyproducts and service is dependent on the level ofexpenditures within the oil and natural gasindustry. If current global economic conditionsand the availability of credit worsen or oil andnatural gas prices weaken for an extended periodof time, reductions in levels of customers’expenditures could have a significant adverseeffect on revenue, margins and overall operatingresults.
The global credit and economic environment couldimpact worldwide demand for energy. Crude oiland natural gas prices continue to be volatile. Asubstantial or extended decline in oil or natural gasprices could impact customers’ spending forproducts and services. Demand for a significantnumber of the Company’s products and services isdependent upon the level of expenditures within theoil and gas industry for exploration, developmentand production of crude oil and natural gasreserves. Expenditures are sensitive to oil andnatural gas prices, as well as the industry’s outlookregarding future oil and natural gas prices.Increased competition could also exert downwardpressure on prices charged for Company productsand services. Volatile economic conditions couldweaken customer exploration and productionexpenditures, causing reduced demand forCompany products and services and a significantadverse effect on the Company’s operating results.It is difficult to predict the pace of any industrygrowth, the direction of oil and natural gas prices,whether the economy will worsen, and to whatextent these conditions could affect the Company.
Reduced cash flow and capital availability couldadversely impact the financial condition of theCompany’s customers, which could result incustomer project modifications, delays orcancellations, general business disruptions, anddelay in, or nonpayment of, amounts that are owedto the Company. This could cause a negative impacton the Company’s results of operations and cashflows.
7

If certain of the Company’s suppliers were toexperience significant cash flow constraints orbecome insolvent as a result of such conditions, areduction or interruption in supplies or a significantincrease in the price of supplies could occur, andadversely impact the Company’s results ofoperations and cash flows.
The price for oil and natural gas is subject to avariety of factors, including:
• demand for energy reactive to worldwidepopulation growth, economic developmentand general economic and businessconditions;
• the ability of the Organization of PetroleumExporting Countries (“OPEC”) to set andmaintain production levels;
• production of oil and gas by non-OPECcountries;
• availability and quantity of natural gasstorage;
• import volume and pricing of LiquefiedNatural Gas;
• pipeline capacity to critical markets;• political and economic uncertainty and socio-
political unrest;• cost of exploration, production and transport
of oil and natural gas;• technological advances impacting energy
consumption; and• weather conditions.
The Company’s revolving credit facility and termloan have variable interest rates that couldincrease.
At December 31, 2014, the Company had a $75million revolving credit facility commitment, ofwhich $8.5 million was drawn. The interest rate onadvances under the revolving credit facility variesbased on the level of borrowing. Rates range(a) between PNC Bank’s base lending rate plus0.5% to 1.0% or (b) between the London InterbankOffered Rate (LIBOR) plus 1.5% to 2.0%. PNCBank’s base lending rate was 3.25% atDecember 31, 2014. The Company is required topay a monthly facility fee of 0.25% on any unusedamount under the commitment based on dailyaverages. The current credit facility remains ineffect until May 10, 2018.
The Company borrowed $50.0 million under a termloan on May 10, 2013. The interest rate on the termloan varies based on the level of borrowing underthe revolving credit facility. Rates range(a) between PNC Bank’s base lending rate plus1.25% to 1.75% or (b) between the LondonInterbank Lending Rate (LIBOR) plus 2.25% to2.75%. PNC Bank’s base lending rate was 3.25% atDecember 31, 2014. At December 31, 2014, $35.5million was outstanding under the term loan.
There can be no assurance that the revolving creditfacility and the term loan will not experiencesignificant interest rate increases.
Network disruptions, security threats and activityrelated to global cyber crime pose risks to our keyoperational, reporting and communicationsystems.
The company relies on access to informationsystems for its operations. Failures of orinterference with access to these systems, such asnetwork communications disruptions could have anadverse effect on our ability to conduct operationsor directly impact consolidated reporting. Securitybreaches pose a risk to confidential data andintellectual property which could result in damagesto our competitiveness and reputation. Thecompany has policies and procedures in place,including system monitoring and data back-upprocesses, to prevent or mitigate the effects of thesepotential disruptions or breaches, however there canbe no assurance that existing or emerging threatswill not have an adverse impact on our systems orcommunications networks.
If the Company does not manage the potentialdifficulties associated with expansion successfully,the Company’s operating results could beadversely affected.
The Company has grown over the last several yearsthrough internal growth, strategic alliances, and, toa lesser extent, strategic business/asset acquisitions.The Company believes future success will depend,in part, on the Company’s ability to adapt to marketopportunities and changes and to successfullyintegrate the operations of any businesses acquired.The following factors could result in strategicbusiness difficulties:
• lack of experienced management personnel;
8

• increased administrative burdens;• lack of customer retention;• technological obsolescence;• infrastructure, technological, communication
and logistical problems associated with large,expansive operations; and
• failure to effectively integrate acquisitions,joint ventures or strategic alliances.
If the Company fails to manage potential difficultiessuccessfully, including increased costs associatedwith growth, the Company’s operating results couldbe adversely impacted.
The Company’s ability to grow and compete couldbe adversely affected if adequate capital is notavailable.
The ability of the Company to grow and compete isreliant on the availability of adequate capital. Accessto capital is dependent, in large part, on theCompany’s cash flows from operations and theavailability of equity and debt financing. TheCompany’s term and revolving loan agreements withits bank also restrict the Company’s various capitaltransactions or participation in various businessacquisitions and combinations. The Company cannotguarantee cash flows from operations will besufficient, or that the Company will continue to beable to obtain equity or debt financing on acceptableterms, or at all, in order to realize growth strategies.As a result, the Company may not be able to financestrategic growth plans, take advantage of businessopportunities, or to respond to competitive pressures.
The Company’s future success and profitability maybe adversely affected if the Company fails to developand/or introduce new and innovative products andservices.
The oil and natural gas drilling industry ischaracterized by technological advancements thathave historically resulted in, and will likely continueto result in, substantial improvements in the scopeand quality of oilfield chemicals, drilling andartificial lift products and services function andperformance. Consequently, the Company’s future
success is dependent, in part, upon the Company’scontinued ability to timely develop innovativeproducts and services. Increasingly sophisticatedcustomer needs and the ability to timely anticipateand respond to technological and operationaladvances in the oil and natural gas drilling industry iscritical. If the Company fails to successfully developand introduce innovative products and services thatappeal to customers, or if new market entrants orcompetitors develop superior products and services,the Company’s revenue and profitability could suffer.
Consumer and industrial chemical markets thatpurchase the Company’s citrus based products arelargely influenced by consumer preference andregulatory requirements. While citrus based beverageflavorings, retail cleaning products, and finefragrances perpetually rank high in consumersurveys, the Company’s continued success requiresnew product innovation to keep pace with consumertrends and regulatory issues. If the Company fails toprovide innovative products and services to itscustomers or to introduce performance products thatcomply with new environmental regulations, theCompany’s financial performance could be impacted.
The Company may pursue strategic acquisitions,which could have an adverse impact on theCompany’s business.
The Company’s historical and potential acquisitionsinvolve risks that could adversely affect theCompany’s business. Negotiations of potentialacquisitions or integration of newly acquiredbusinesses could divert management’s attention fromother business concerns as well as be cost prohibitiveand time consuming. Acquisitions could also exposethe Company to unforeseen liabilities or risksassociated with new markets or businesses.Unforeseen operational difficulties related toacquisitions could result in diminished financialperformance or require a disproportionate amount ofthe Company’s management’s attention andresources. Additional acquisitions could result in thecommitment of capital resources without therealization of anticipated returns.
9

Unforeseen contingencies such as litigation couldadversely affect the Company’s financialcondition.
The Company is, and from time to time maybecome, a party to legal proceedings incidental tothe Company’s business involving alleged injuriesarising from the use of Company products,exposure to hazardous substances, patentinfringement, employment matters, and commercialdisputes. The defense of these lawsuits may requiresignificant expenses, divert management’sattention, and may require the Company to paydamages that could adversely affect the Company’sfinancial condition. In addition, any insurance orindemnification rights that the Company may havemay be insufficient or unavailable to protect againstpotential loss exposures.
The Company’s current insurance policies maynot adequately protect the Company’s businessfrom all potential risks.
The Company’s operations are subject to risksinherent in the oil and natural gas industry, such as,but not limited to, accidents, blowouts, explosions,fires, severe weather, oil and chemical spills, andother hazards. These conditions can result inpersonal injury or loss of life, damage to property,equipment and the environment, as well assuspension of customers’ oil and gas operations.Litigation arising from any catastrophic occurrencewhere the Company’s equipment, products orservices are being used could result in the Companybeing named as a defendant in lawsuits assertinglarge claims. The Company maintains insurancecoverage it believes is adequate and customary tothe oil and natural gas industry to mitigate liabilitiesassociated with these potential hazards. TheCompany does not have insurance against allforeseeable risks, either because insurance is notavailable or is cost-prohibitive. Consequently,losses and liabilities arising from uninsured orunderinsured events could have an adverse effect onthe Company’s business, financial condition, andresults of operations.
The Company is subject to complex foreign,federal, state and local environmental, health andsafety laws and regulations, which expose the
Company to liabilities that could adversely affectthe Company’s business, financial condition, andresults of operations.
The Company’s operations are subject to foreign,federal, state, and local laws and regulations relatedto, among other things, the protection of naturalresources, injury, health and safety considerations,waste management, and transportation of waste andother hazardous materials. The Energy ChemicalsTechnologies segment exposes the company to risksof environmental liability that could result in fines,penalties, remediation, property damage, andpersonal injury liability. In order to remaincompliant with laws and regulations, the Companymaintains permits, authorizations and certificates asrequired from regulatory authorities. Sanctions fornoncompliance with such laws and regulationscould include assessment of administrative, civiland criminal penalties, revocation of permits, andissuance of corrective action orders.
The Company could incur substantial costs toensure compliance with existing and future lawsand regulations. Laws protecting the environmenthave generally become more stringent and areexpected to continue to evolve and become morecomplex and restrictive into the future. Failure tocomply with applicable laws and regulations couldresult in material expense associated with futureenvironmental compliance and remediation. TheCompany’s costs of compliance could also increaseif existing laws and regulations are amended orreinterpreted. Such amendments or reinterpretationsof existing laws or regulations, or the adoption ofnew laws or regulations, could curtail exploratoryor developmental drilling for, and production of, oiland natural gas which, in turn, could limit demandfor the Company’s products and services. Someenvironmental laws and regulations could alsoimpose joint and strict liability, meaning that theCompany could be exposed in certain situations toincreased liabilities as a result of the Company’sconduct that was lawful at the time it occurred orconduct of, or conditions caused by, prior operatorsor other third parties. Remediation expense andother damages arising as a result of such laws andregulations could be substantial and have a materialadverse effect on the Company’s financial conditionand results of operations.
10

Material levels of the Company’s revenue arederived from customers engaged in hydraulicfracturing services, a process that creates fracturesextending from the well bore through the rockformation to enable natural gas or oil to flow moreeasily through the rock pores to a production well.Some states have adopted regulations which requireoperators to publicly disclose certain non-proprietary information. These regulations couldrequire the reporting and public disclosure of theCompany’s proprietary chemical formulas. Theadoption of any future federal or state laws or localrequirements, or the implementation of regulationsimposing reporting obligations on, or otherwiselimiting, the hydraulic fracturing process, couldincrease the difficulty of oil and natural gas wellproduction activity and could have an adverse effecton the Company’s future results of operations.
Regulation of greenhouse gases and/or climatechange could have a negative impact on theCompany’s business.
Certain scientific studies have suggested thatemissions of certain gases, commonly referred to as“greenhouse gases,” which include carbon dioxideand methane, may be contributory to the warmingeffect of the Earth’s atmosphere and other climaticchanges. In response to such studies, the issue ofclimate change and the effect of greenhouse gasemissions, in particular emissions from fossil fuels,is attracting increasing worldwide attention.Legislative and regulatory measures to addressgreenhouse gas emissions have not yet beenfinalized as of the date of this Annual Report butremain impactive across international, national,regional, and state levels.
Existing or future laws, regulations, treaties, orinternational agreements related to greenhousegases and climate change, including energyconservation or alternative energy incentives, couldhave a negative impact on the Company’soperations, if regulations resulted in a reduction inworldwide demand for oil and natural gas or globaleconomic activity. Other results could be increasedcompliance costs and additional operatingrestrictions, each of which would have a negativeimpact on the Company’s operations.
Changes in regulatory compliance obligations ofcritical suppliers may adversely impact ouroperations.
The Dodd-Frank Wall Street Reform and ConsumerProtection Act (“Dodd-Frank Act”), signed into lawon July 21, 2010, includes Section 1502, whichrequires the Securities and Exchange Commissionto adopt additional disclosure requirements relatedto certain minerals sourced from the DemocraticRepublic of Congo and surrounding countries, or“conflict minerals,” for which such conflictminerals are necessary to the functionality of aproduct manufactured, or contracted to bemanufactured, by an SEC-reporting company. Themetals covered by these rules, which were adoptedon August 22, 2012, include tin, tantalum, tungstenand gold. The Company and Company suppliers usesome of these materials in their productionprocesses.
In 2014, the Company established managementsystems and processes and completed due diligencein compliance with the requirements ofSection 1502. In May 2014 the Company filed itsfirst annual Conflict Minerals Report with the SEC.Future requirements for conducting ConflictMinerals due diligence may result in significantincreased costs to the Company. Furthermore,failure of key suppliers to provide evidence ofconflict free materials could impact the Company’sability to acquire key raw materials and/or result ishigher costs for those raw materials.
If the Company is unable to adequately protectintellectual property rights or is found to infringeupon the intellectual property rights of others, theCompany’s business is likely to be adverselyaffected.
The Company relies on a combination of patents,trademarks, non-disclosure agreements, and othersecurity measures to establish and protect theCompany’s intellectual property rights. Althoughthe Company believes that existing measures arereasonably adequate to protect intellectual propertyrights, there is no assurance that the measures takenwill prevent misappropriation of proprietaryinformation or dissuade others from independentdevelopment of similar products or services.Moreover, there is no assurance that the Companywill be able to prevent competitors from copying,reverse engineering, or otherwise obtaining and/orusing the Company’s technology and proprietaryrights for products. The Company may not be ableto enforce intellectual property rights outside of theU.S. Furthermore, the laws of certain countries in
11

which the Company’s products and services aremanufactured or marketed may not protect theCompany’s proprietary rights to the same extent asdo the laws of the U.S. Finally, parties maychallenge, invalidate, or circumvent the Company’spatents, trademarks, copyrights and trade secrets. Ineach case, the Company’s ability to compete couldbe significantly impaired.
A portion of the Company’s products are withoutpatent protection. The issuance of a patent does notguarantee validity or enforceability. Companypatents may not be valid or enforceable againstthird parties. The issuance of a patent does notguarantee that the Company has the right to use thepatented invention. Third parties may have blockingpatents that could be used to prevent the Companyfrom marketing the Company’s own patentedproducts and utilizing our patented technology.
The Company is exposed to allegations of patentand other intellectual property infringement.Furthermore, the Company could become involvedin costly litigation or proceedings regarding patentsor other intellectual property rights. If any suchclaims are asserted against the Company, theCompany could seek to obtain a license under thethird party’s intellectual property rights in order tomitigate exposure. In the event the Company cannotobtain a license, affected parties could file lawsuitsagainst the Company seeking damages (includingtreble damages) or an injunction against the sale ofthe Company’s products. These could result in theCompany having to discontinue the sale of certainproducts, increase the cost of selling products, orresult in damage to the Company’s reputation. Theaward of damages, including material royaltypayments, or the entry of an injunction orderagainst the manufacture and sale of any of theCompany’s products, could have an adverse effecton the Company’s results of operations and abilityto compete.
The Company and the Company’s customers aresubject to risks associated with doing businessoutside of the U.S., including political risk, foreignexchange risk and other uncertainties.
Revenue from the sale of products to customersoutside the U.S. was approximately 17.6% of theCompany’s 2014 annual revenue. The Companyand its customers are subject to risks inherent indoing business outside of the U.S., including:
• governmental instability;• corruption;• war and other international conflicts;• civil and labor disturbances;• requirements of local ownership;• partial or total expropriation or
nationalization;• currency devaluation; and• foreign laws and policies, each of which can
limit the movement of assets or funds orresult in the deprivation of contractual rightsor appropriation of property without faircompensation.
Collections and recovery of rental tools frominternational customers and agents could also provedifficult due to inherent uncertainties in foreign lawand judicial procedures. The Company couldexperience significant difficulty with collections orrecovery due to the political or judicial climate inforeign countries where Company operations occuror in which the Company’s products are used.
The Company’s international operations must becompliant with the Foreign Corrupt Practices Act(the “FCPA”) and other applicable U.S. laws. TheCompany could become liable under these laws foractions taken by employees or agents. Compliancewith international laws and regulations could becomemore complex and expensive thereby creatingincreased risk as the Company’s internationalbusiness portfolio grows. Further, the U.S.periodically enacts laws and imposes regulationsprohibiting or restricting trade with certain nations.The U.S. government could also change these lawsor enact new laws that could restrict or prohibit theCompany from doing business in identified foreigncountries. The Company conducts, and will continueto conduct business in currencies other than the U.S.dollar. Historically, the Company has not hedgedagainst foreign currency fluctuations. Accordingly,the Company’s profitability could be affected byfluctuations in foreign exchange rates.
The Company has no control over, and can provideno assurances that future laws and regulations willnot materially impact the Company’s ability toconduct international business.
The loss of key customers could have an adverseimpact on the Company’s results of operations andcould result in a decline in the Company’srevenue.
12

The Company has critical customer relationshipswhich are dependent upon production anddevelopment activity related to a handful ofcustomers. Revenue derived from the Company’sthree largest customers as a percentage ofconsolidated revenue for the years endedDecember 31, 2014, 2013 and 2012, totaled 29%,30% and 35%, respectively. Customer relationshipsare historically governed by purchase orders orother short-term contractual obligations as opposedto long-term contracts. The loss of one or more keycustomers could have an adverse effect on theCompany’s results of operations and could result ina decline in the Company’s revenue.
Failure to collect for goods and services sold tokey customers could have an adverse effect on theCompany’s financial results, liquidity and cashflows.
The Company performs credit analysis on potentialdomestic customers, however credit analysis doesnot provide full assurance that customers will bewilling and/or able to pay for goods and servicespurchased from the Company. Furthermore,collectability of international sales can be subject tothe laws of foreign countries which may providemore limited protection to the Company in theevent of a dispute over payment. Since sales todomestic and international customers are generallymade on an unsecured basis, there can be noassurance of collectability. If one or more majorcustomers are unwilling or unable to pay its debts tothe Company, it could have an adverse effect of theCompany’s financial results, liquidity and cashflows.
Loss of key suppliers, the inability to secure rawmaterials on a timely basis, or the Company’sinability to pass commodity price increases on tocustomers could have an adverse effect on theCompany’s ability to service customer’s needs andcould result in a loss of customers.
Materials used in servicing and manufacturingoperations as well as those purchased for sale aregenerally available on the open market frommultiple sources. Acquisition costs andtransportation of raw materials to Companyfacilities have historically been impacted byextreme weather conditions. Certain raw materialsused by the Energy Chemicals Technologiessegment are available only from limited sources;
accordingly, any disruptions to critical suppliers’operations could adversely impact the Company’soperations. Prices paid for raw materials could beaffected by energy, steel and other commodityprices; tariffs and duties on imported materials;foreign currency exchange rates; phases of thegeneral business cycle and global demand. TheDrilling Technologies and Production Technologiessegments purchase critical raw materials on theopen market and, where able, from multiplesuppliers, both domestically and internationally.
The Company maintains a three- to six-month supplyof critical mud-motor inventory parts that theCompany sources from China. This inventory stockposition approximates the lead time required tosecure these parts in order to avoid disruption ofservice to the Company’s customers. The Company’sinability to secure reasonably priced criticalinventory parts in a timely manner would adverselyaffect the Company’s ability to provide service topotential customers. The Company sources the vastmajority of motor parts from a national supplier. Aspart of the 2015 business plan, the Company isactively managing and developing relationships withback-up parts and service suppliers.
The Company currently does not hedge commodityprices. The Company may be unable to pass alongprice increases to its customers, which could resultin a decline in revenue or operating profits.
The Company’s inability to develop new productsor differentiate existing products could have anadverse effect on its ability to be responsive tocustomers’ needs and could result in a loss ofcustomers.
The Company’s ability to compete within theoilfield services business is dependent upon theability to differentiate products and services,provide superior quality and service, and maintain acompetitive cost structure. Activity levels in theCompany’s operations are driven by current andforecast commodity prices, drilling rig count, oiland natural gas production levels, and customercapital spending for drilling and production. Theregions in which the Company operates are highlycompetitive. The Company is also smaller thanmany other oil and natural gas service companiesand has fewer resources as compared to thesecompetitors. The large competitors may be betterpositioned to withstand industry downturns,
13

compete on the basis of price, and acquire newequipment and technologies, all of which couldaffect the Company’s revenue and profitability. TheCompany competes for both customers andacquisition opportunities. Competition couldadversely affect the Company’s operating profit.The Company believes that competition forproducts and services will continue to be intenseinto the foreseeable future.
If the Company loses the services of key membersof management, the Company may not be able tomanage operations and implement growthstrategies.
The Company depends on the continued service ofthe Chief Executive Officer and President, the ChiefFinancial Officer, the Executive Vice President,Operations, and the Executive Vice President,Research and Development, who possess significantexpertise and knowledge of the Company’s businessand industry. Furthermore, the Chief ExecutiveOfficer and President serves as Chairman of theBoard of Directors. The Company has entered intoemployment agreements with all of these keymembers; however, at December 31, 2014 theCompany only carries key man life insurance for theChief Executive Officer and the Executive VicePresident of Operations. Any loss or interruption ofthe services of key members of the Company’smanagement could significantly reduce theCompany’s ability to manage operations effectivelyand implement strategic business initiatives. TheCompany can provide no assurance that appropriatereplacements for key positions could be found shouldthe need arise.
Failure to maintain effective disclosure controlsand procedures and internal controls overfinancial reporting could have an adverse effecton the Company’s operations and the trading priceof the Company’s common stock.
Effective internal controls are necessary for theCompany to provide reliable financial reports,effectively prevent fraud and operate successfully asa public company. If the Company cannot providereliable financial reports or effectively prevent fraud,the Company’s reputation and operating results couldbe harmed. If the Company is unable to maintaineffective disclosure controls and procedures andinternal controls over financial reporting, theCompany may not be able to provide reliable
financial reports, which in turn could affect theCompany’s operating results or cause the Companyto fail to meet its reporting obligations. Ineffectiveinternal controls could also cause investors to loseconfidence in reported financial information, whichcould negatively affect the trading price of theCompany’s common stock, limit the ability of theCompany to access capital markets in the future, andrequire additional costs to improve internal controlsystems and procedures.
Risks Related to the Company’s Industry
General economic declines (recessions) and limitsto credit availability could have an adverse effecton exploration and production activity and resultin lower demand for the Company’s products andservices.
Continued worldwide financial and credituncertainty can reduce the availability of liquidityand credit markets to fund the continuation andexpansion of industrial business operationsworldwide. The shortage of liquidity and creditcombined with pressure on worldwide equitymarkets could continue to impact the worldwideeconomic climate. Unrest in the Middle East mayalso impact demand for the Company’s productsand services both domestically and internationally.
Demand for the Company’s products and services isdependent on oil and natural gas industry activity andexpenditure levels that are directly affected by trendsin oil and natural gas prices. Demand for theCompany’s products and services is particularlysensitive to levels of exploration, development, andproduction activity of, and the corresponding capitalspending by, oil and natural gas companies, includingnational oil companies. One indication of drilling andproduction activity and spending is rig count, whichthe Company monitors to gauge market conditions.Any prolonged reduction in oil and natural gas pricesor drop in rig count could depress current levels ofexploration, development, and production activity.Perceptions of longer-term lower oil and natural gasprices by oil and natural gas companies couldsimilarly reduce or defer major expenditures giventhe long-term nature of many large-scaledevelopment projects. Lower levels of activity couldresult in a corresponding decline in the demand forthe Company’s oil and natural gas well products andservices, which could have a material adverse effecton the Company’s revenue and profitability.
14

The Company’s consumer and industrial customerswould be adversely effected if economic activitydecreased dramatically. The Company’s primaryproduct is often used to replace less desirablesolvents in numerous consumer and industrialapplications and is more expensive than othermaterials. As economic activity decreases,consumer and industrial companies not onlyconsume less solvent, they also may relax theirenvironmental mandates and purchase cheapersolvents. The Company’s revenue and profitabilitycould be negatively impacted if demand softensbecause of weak economic activity.
Events in global credit markets can significantlyimpact the availability of credit and associatedfinancing costs for many of the Company’scustomers. Many of the Company’s customersfinance their drilling and production programsthrough third-party lenders or public debt offerings.Lack of available credit or increased costs ofborrowing could cause customers to reducespending on drilling programs, thereby reducingdemand and potentially resulting in lower prices forthe Company’s products and services. Also, thecredit and economic environment couldsignificantly impact the financial condition of somecustomers over a prolonged period, leading tobusiness disruptions and restricted ability to pay forthe Company’s products and services. TheCompany’s forward-looking statements assume thatthe Company’s lenders, insurers, and other financialinstitutions will be able to fulfill their obligationsunder various credit agreements, insurance policies,and contracts. If any of the Company’s significantlenders, insurers and others are unable to performunder such agreements, and if the Company wasunable to find suitable replacements at a reasonablecost, the Company’s results of operations, liquidity,and cash flows could be adversely impacted.
A prolonged period of depressed oil and naturalgas prices could result in reduced demand for theCompany’s products and services and adverselyaffect the Company’s business, financialcondition, and results of operations.
The markets for oil and natural gas have historicallybeen volatile. Such volatility in oil and natural gasprices, or the perception by the Company’scustomers of unpredictability in oil and natural gasprices, could adversely affect spending. The oil andnatural gas markets may be volatile in the future.
The demand for the Company’s products andservices is, in large part, driven by general levels ofexploration and production spending and drillingactivity by its customers. Decrease in oil andnatural gas prices could cause a decline inexploration and drilling activities. This, in turn,could result in lower demand for the Company’sproducts and services and could result in lowerprices for the Company’s products and services. Aprolonged decline in oil or natural gas prices couldadversely affect the Company’s business, financialcondition, and results of operations.
New and existing competitors within theCompany’s industries could have an adverse effecton results of operations.
The oil and natural gas industry is highlycompetitive. The Company’s principal competitorsinclude numerous small companies capable ofcompeting effectively in the Company’s markets ona local basis, as well as a number of largecompanies that possess substantially greaterfinancial and other resources than does theCompany. Larger competitors may be able todevote greater resources to developing, promotingand selling products and services. The Companymay also face increased competition due to theentry of new competitors including currentsuppliers that decide to sell their products andservices directly to the Company’s customers. As aresult of this competition, the Company couldexperience lower sales or greater operating costs,which could have an adverse effect on theCompany’s margins and results of operations.
Regulatory pressures, environmental activism, andlegislation could result in reduced demand for theCompany’s products and services and adverselyaffect the Company’s business, financialcondition, and results of operations.
Regulations restricting volatile organic compounds(“VOC”) exist in many states and/or communitieswhich limit demand for certain products. Althoughcitrus oil is considered a VOC, its health, safety,and environmental profile is preferred over othersolvents (e.g., BTEX), which is currently creatingnew market opportunities around the world.Changes in the perception of citrus oils as apreferred VOC, increased consumer activismagainst hydraulic fracturing or other regulatory orlegislative actions by governments could potentially
15
result in materially reduced demand for theCompany’s products and services and couldadversely affect the Company’s business, financialcondition, and results of operations.
The Company’s industry has a high rate ofemployee turnover. Difficulty attracting orretaining personnel or agents could adverselyaffect the Company’s business.
The Company operates in an industry that hashistorically been highly competitive in securingqualified personnel with the required technicalskills and experience. The Company’s servicesrequire skilled personnel able to perform physicallydemanding work. Due to industry volatility and thedemanding nature of the work, workers couldchoose to pursue employment opportunities thatoffer a more desirable work environment at wagescompetitive with the Company’s. As a result, theCompany may not be able to find qualified labor,which could limit the Company’s growth. Inaddition, the cost of attracting and retainingqualified personnel has increased over the pastseveral years due to competitive pressures. TheCompany expects labor costs will continue toincrease into the foreseeable future. In order toattract and retain qualified personnel, the Companymay be required to offer increased wages andbenefits. If the Company is unable to increase theprices of products and services to compensate forincreases in compensation, or is unable to attractand retain qualified personnel, operating resultscould be adversely affected.
Severe weather could have an adverse impact onthe Company’s business.
The Company’s business could be materially andadversely affected by severe weather conditions.Hurricanes, tropical storms, flash floods, blizzards,cold weather and other severe weather conditionscould result in curtailment of services, damage toequipment and facilities, interruption intransportation of products and materials, and loss ofproductivity. If the Company’s customers areunable to operate or are required to reduceoperations due to severe weather conditions, and asa result curtail purchases of the Company’sproducts and services, the Company’s businesscould be adversely affected.
A terrorist attack or armed conflict could harm theCompany’s business.
Terrorist activities, anti-terrorist efforts, and otherarmed conflicts involving the U.S. could adverselyaffect the U.S. and global economies and couldprevent the Company from meeting financial andother obligations. The Company could experienceloss of business, delays or defaults in paymentsfrom payors, or disruptions of fuel supplies andmarkets if pipelines, production facilities,processing plants, or refineries are direct targets orindirect casualties of an act of terror or war. Suchactivities could reduce the overall demand for oiland natural gas which, in turn, could also reduce thedemand for the Company’s products and services.Terrorist activities and the threat of potentialterrorist activities and any resulting economicdownturn could adversely affect the Company’sresults of operations, impair the ability to raisecapital, or otherwise adversely impact theCompany’s ability to realize certain businessstrategies.
Risks Related to the Company’s Securities
The market price of the Company’s common stockhas been and may continue to be volatile.
The market price of the Company’s common stockhas historically been subject to significantfluctuations. The following factors, among others,could cause the price of the Company’s commonstock to fluctuate significantly:
• variations in the Company’s quarterly resultsof operations;
• changes in market valuations of companies inthe Company’s industry;
• fluctuations in stock market prices andvolume;
• fluctuations in oil and natural gas prices;• issuances of common stock or other securities
in the future;• additions or departures of key personnel; and• announcements by the Company or the
Company’s competitors of new business,acquisitions, or joint ventures.
The stock market has experienced unusual price andvolume fluctuations in recent years that havesignificantly affected the price of common stock ofcompanies within many industries including the oil
16

and natural gas industry. Further changes can occurwithout regard to specific operating performance.The price of the Company’s common stock couldfluctuate based upon factors that have little to dowith the Company’s operational performance, andthese fluctuations could materially reduce theCompany’s stock price. The Company could be adefendant in a legal case related to a significant lossof value for the shareholders. This could beexpensive and divert management’s attention andCompany resources, as well as have an adverseeffect on the Company’s business, financialcondition, and results of operations.
An active market for the Company’s commonstock may not continue to exist or may notcontinue to exist at current trading levels.
Trading volume for the Company’s common stockhistorically has been very volatile when comparedto companies with larger market capitalizations.The Company cannot presume that an active tradingmarket for the Company’s common stock willcontinue or be sustained. Sales of a significantnumber of shares of the Company’s common stockin the public market could lower the market price ofthe Company’s stock.
The Company has no plans to pay dividends on theCompany’s common stock, and, therefore,investors will have to look to stock appreciation forreturn on investments.
The Company does not anticipate paying any cashdividends on the Company’s common stock withinthe foreseeable future. The Company currentlyintends to retain all future earnings to fund thedevelopment and growth of the Company’s businessand to meet current debt obligations. Any payment offuture dividends will be at the discretion of theCompany’s board of directors and will depend,among other things, on the Company’s earnings,financial condition, capital requirements, level ofindebtedness, statutory and contractual restrictionsapplying to the payment of dividends, and otherconsiderations deemed relevant by the board ofdirectors. Additionally, should the Company seekfuture financing or refinancing of indebtedness,covenants could restrict the payment of dividendswithout the prior written consent of lenders. Investorsmust rely on sales of common stock held after priceappreciation, which may never occur, in order torealize a return on their investment.
Certain anti-takeover provisions of the Company’scharter documents and applicable Delaware lawcould discourage or prevent others from acquiringthe Company, which may adversely affect themarket price of the Company’s common stock.
The Company’s certificate of incorporation andbylaws contain provisions that:
• permit the Company to issue, withoutstockholder approval, up to 100,000 shares ofpreferred stock, in one or more series and,with respect to each series, to fix thedesignation, powers, preferences and rights ofthe shares of the series;
• prohibit stockholders from calling specialmeetings;
• limit the ability of stockholders to act bywritten consent;
• prohibit cumulative voting; and• require advance notice for stockholder
proposals and nominations for election to theboard of directors to be acted upon atmeetings of stockholders.
In addition, Section 203 of the Delaware GeneralCorporation Law limits business combinations withowners of more than 15% of the Company’s stockwithout the approval of the board of directors.Aforementioned provisions and other similarprovisions make it more difficult for a third party toacquire the Company exclusive of negotiation. TheCompany’s board of directors could choose not tonegotiate with an acquirer deemed not beneficial toor synergistic with the Company’s strategicoutlook. If an acquirer were discouraged fromoffering to acquire the Company or prevented fromsuccessfully completing a hostile acquisition bythese anti-takeover measures, stockholders couldlose the opportunity to sell their shares at afavorable price.
Future issuance of additional shares of commonstock could cause dilution of ownership interestsand adversely affect the Company’s stock price.
The Company may, in the future, issue previouslyauthorized and unissued shares of common stock,which would result in the dilution of currentstockholders ownership interests. The Company iscurrently authorized to issue 80,000,000 shares ofcommon stock. Additional shares are subject toissuance through various equity compensation plans
17

or through the exercise of currently outstandingoptions. The potential issuance of additional shares ofcommon stock may create downward pressure on thetrading price of the Company’s common stock. TheCompany may also issue additional shares ofcommon stock or other securities that are convertibleinto or exercisable for common stock in order to raisecapital or effectuate other business purposes. Futuresales of substantial amounts of common stock, or theperception that sales could occur, could have anadverse effect on the price of the Company’scommon stock.
The Company may issue shares of preferred stockor debt securities with greater rights than theCompany’s common stock.
Subject to the rules of the NYSE, the Company’scertificate of incorporation authorizes the board ofdirectors to issue one or more additional series ofpreferred stock and to set the terms of the issuancewithout seeking approval from holders of commonstock. Currently, there are 100,000 preferred sharesauthorized, with no shares currently outstanding. Anypreferred stock that is issued may rank senior tocommon stock in terms of dividends, priority andliquidation premiums, and may have greater votingrights than holders of common stock.
The Company’s ability to use net operating losscarryforwards and tax attribute carryforwards tooffset future taxable income may be limited as aresult of transactions involving the Company’scommon stock.
Under section 382 of the Internal Revenue Code of1986, as amended, a corporation that undergoes an“ownership change” is subject to limitations on theCompany’s ability to utilize pre-change net operatinglosses (“NOLs”), and certain other tax attributes tooffset future taxable income. In general, anownership change occurs if the aggregate stockownership of certain stockholders increases by morethan 50 percentage points over such stockholders’
lowest percentage ownership during the testingperiod (generally three years). An ownership changecould limit the Company’s ability to utilize existingNOLs and tax attribute carryforwards for taxableyears including or following an identified “ownershipchange.” Transactions involving the Company’scommon stock, even those outside the Company’scontrol, such as purchases or sales by investors,within the testing period could result in an“ownership change.” Limitations imposed on theability to use NOLs and tax credits to offset futuretaxable income could require the Company to payU.S. federal income taxes in excess of that whichwould otherwise be required if such limitations werenot in effect. Net operating losses and tax attributescould expire unused, in each instance reducing oreliminating the benefit of the NOLs and taxattributes. Similar rules and limitations may apply forstate income tax purposes.
Disclaimer of Obligation to Update
Except as required by applicable law or regulation,the Company assumes no obligation (and specificallydisclaims any such obligation) to update these riskfactors or any other forward-looking statementcontained in this Annual Report to reflect actualresults, changes in assumptions or other factorsaffecting such forward-looking statements.
Item 1B. Unresolved Staff Comments.
Not applicable.
Item 2. Properties.
At December 31, 2014, the Company operated 36manufacturing and warehouse facilities in 11 U.S.states. The Company owns 15 of these facilities andthe remainder are leased with lease terms that expirefrom 2015 through 2031. In addition, the Company’scorporate office is a leased facility located inHouston, Texas. The following table sets forthfacility locations:
18

SegmentOwned/Leased Location
Energy ChemicalTechnologies Owned Marlow, Oklahoma
Owned Carthage, Texas
Owned Wheeler, Texas
Leased Raceland, Louisiana
Leased The Woodlands, Texas
Owned Waller, Texas
Owned Healdton, Oklahoma
Leased Plano, Texas
Leased Keller, Texas
Leased Coahoma, Texas
Leased Natoma, Kansas
DrillingTechnologies Owned Oklahoma City, Oklahoma
Owned Houston, Texas
Owned Midland, Texas
Owned Robstown, Texas
Owned Vernal, Utah
Owned Evanston, Wyoming
Leased Bossier City, Louisiana
Leased New Iberia, Louisiana
Leased Pocola, Oklahoma
Leased Grand Prairie, Texas
Leased Houston, Texas
Leased Midland, Texas
Leased Odessa, Texas
Leased Pittsburgh, Pennsylvania
Leased Wysox, Pennsylvania
Leased Woodward, Oklahoma
Leased Casper, Wyoming
Leased Bryan, Texas
ProductionTechnologies Owned Gillette, Wyoming
Owned Dickinson, North Dakota
Owned Vernal, Utah
Leased Farmington, New Mexico
Leased Gillette, Wyoming
Leased Denver, Colorado
Consumer andIndustrialChemicalTechnologies Owned Winter Haven, Florida
The Company considers owned and leased facilitiesto be in good condition and suitable for the conductof business.
Item 3. Legal Proceedings.
From time to time, the Company may be party toroutine litigation and other claims that arise in thenormal course of business. Management is not awareof any pending or threatened lawsuits or proceedingsthat are expected to have a material effect on theCompany’s financial position, results of operations orliquidity.
Item 4. Mine Safety Disclosures.
Not applicable.
19

PART II
Item 5. Market for Registrant’s Common Equity,Related Stockholder Matters and IssuerPurchases of Equity Securities.
The Company’s common stock began trading on theNYSE on December 27, 2007 under the stock tickersymbol “FTK.” As of the close of business onJanuary 16, 2015, there were 53,364,905 shares ofcommon stock outstanding held by approximately14,750 holders of record. The Company’s closingsale price of the common stock on the NYSE onJanuary 16, 2015 was $16.31. The Company hasnever declared or paid cash dividends on common
stock. While the Company regularly assesses thedividend policy, the Company has no current plans todeclare dividends on common stock, and intends tocontinue to use earnings and other cash in themaintenance and expansion of its business. Further,the Company’s credit facility contains provisions thatlimit its ability to pay cash dividends on its commonstock.
The following table sets forth, on a per share basis for the periods indicated, the high and low closing sales pricesof common stock as reported by the NYSE. These prices do not include retail mark-ups, mark-downs orcommissions.
Fiscal quarter ended:
2014 2013
High Low High Low
March 31, $28.19 $18.67 $16.35 $12.54
June 30, $32.66 $26.98 $18.00 $14.57
September 30, $32.22 $25.65 $23.08 $17.85
December 31, $25.23 $16.11 $23.46 $19.01
20

Stock Performance Graph
The performance graph below illustrates a five yearcomparison of cumulative total returns based on aninitial investment of $100 in the Company’s commonstock, as compared with the Russell 2000 Index andthe Philadelphia Oil Services Index for the periodbeginning December 31, 2009 through December 31,2014. The performance graph assumes $100 investedon December 31, 2009 in each of the Company’scommon stock, the Russell 2000 Index and thePhiladelphia Oil Service Index, and that all dividendswere reinvested.
The following graph should not be deemed to be filedas part of this Annual Report, does not constitutesoliciting material and should not be deemed filed orincorporated by reference into any other filing of theCompany under the Securities Act of 1933, asamended, or the Exchange Act, as amended, exceptto the extent the Company specifically incorporatesthe graph by reference.
$1,600
$1,000
$1,200
$1,400
$800
Comparison of 5 Year Cumulative Total ReturnAssumes Initial Investment of $100
on December 31, 2009
$600
$400
$200
$02009 2010 2011 2012 2013 2014Flotek Industries, Inc. Russell 2000 Index Philadelphia Oil Service Index (OSX)
December 31,2009 2010 2011 2012 2013 2014
Flotek Industries, Inc. $100 $407 $743 $910 $1,498 $1,389
Russell 2000 Index $100 $125 $118 $136 $186 $193
Philadelphia Oil Service Index (OSX) $100 $126 $111 $113 $144 $108
21

Securities Authorized for Issuance Under Equity Compensation Plans
The following table summarizes equity compensation plan information regarding equity securities authorized forissuance under individual stock option compensation agreements.
Plan category
Number of Securities to beIssued Upon Exercise of
Outstanding Options, Warrantsand Rights
Weighted-Average ExercisePrice of Outstanding Options,
Warrants and Rights
Number of SecuritiesRemaining Available forFuture Issuance Under
Equity Compensation Plans(Excluding Securities
Reflected in the Column(a))
(a) (b) (c)
Equity compensationplans approved bysecurity holders 2,723,732 $11.98 2,269,585
Equity compensationplans not approved bysecurity holders — — —
Total 2,723,732 $11.98 2,269,585
Issuer Purchases of Equity Securities
In November 2012, the Company’s Board of Directors authorized the repurchase of up to $25 million of theCompany’s common stock. Repurchases may be made in open market or privately negotiated transactions.Through December 31, 2014, the Company has repurchased $10.4 million of its common stock under thisrepurchase program and $14.6 million may yet be used to purchase shares.
Total Numberof Shares
Purchased (1)Average PricePaid per Share
Total Number of SharesPurchased as Part ofPublicly AnnouncedPlans or Programs
Maximum Dollar Valueof Shares that May Yet be
Purchased Under thePlans or Programs
October 1 toOctober 31, 2014 10,482 $21.07 — $25,000,000
November 1 toNovember 30, 2014 1,090 $21.90 — $25,000,000
December 1 toDecember 31, 2014 621,374 $16.74 621,176 $14,604,569
Total 632,946 $16.82 621,176 $14,604,569
(1) The Company purchased shares of its common stock (a) to satisfy tax withholding requirements and payment remittance obligationsrelated to period vesting of restricted shares and exercise of non-qualified stock options, (b) to satisfy payments required for commonstock upon the exercise of stock options, and (c) as part of a publicly announced repurchase program.
22

Item 6. Selected Financial Data.
The following table sets forth certain selectedhistorical financial data and should be read inconjunction with Part II, Item 7. “Management’sDiscussion and Analysis of Financial Condition andResults of Operations” and Part II, Item 8. “FinancialStatements and Supplementary Data” in this AnnualReport. The selected operating and financial positiondata as of and for each of the five years presentedhave been derived from audited consolidatedCompany financial statements, some of which appearelsewhere in this Annual Report.
During 2014, the Company made two smallacquisitions and incurred insignificant non-recurringcharges. The net income and non-recurring chargesrelated to these acquisitions do not materially affectcomparability. During 2013, the Company acquired
Florida Chemical Company, Inc. for purchaseconsideration of $106.4 million.
During 2012, the Company recorded a reduction inthe valuation allowance for deferred tax assets of$16.5 million. The Company incurred significantnon-recurring charges during 2010 through 2012.During 2012, 2011 and 2010, the Company incurredlosses on the extinguishment of debt of $7.3 million,$3.2 million and $1.0 million, respectively. During2010, the Company recorded fixed asset and otherintangible impairment charges of $9.3 million.Additionally, during 2012, 2011 and 2010, theCompany recorded a change in the fair value ofwarrant liability of $2.6 million income, $9.6 millionincome, and $21.5 million expense, respectively.
As of and for the year ended December 31,
2014 2013 2012 2011 2010(in thousands, except per share data)
Operating DataRevenue $ 449,157 $ 371,065 $ 312,828 $ 258,785 $ 146,982
Income (loss) from operations 80,888 58,726 58,621 48,888 (6,267)
Net income (loss) 53,603 36,178 49,791 31,408 (43,465)
Earnings (loss) per share – Basic $ 0.98 $ 0.70 $ 1.03 $ 0.60 $ (1.94)
Earnings (loss) per share – Diluted $ 0.97 $ 0.67 $ 0.97 $ 0.56 $ (1.94)
Financial Position DataTotal assets $ 423,276 $ 375,581 $ 219,867 $ 232,012 $ 184,807
Convertible senior notes, long-termdebt and capital lease obligations,less discount and current portion 25,398 35,690 22,455 100,613 126,682
Stockholders’ equity (deficit) 306,003 249,752 154,730 78,298 (3,453)
23
Item 7. Management’s Discussion and Analysis ofFinancial Condition and Results of Operations.
The following discussion and analysis should be readin conjunction with the Consolidated FinancialStatements and the related Notes to the ConsolidatedFinancial Statements included elsewhere in thisAnnual Report. The following information containsforward-looking statements, which are subject torisks and uncertainties. Should one or more of theserisks or uncertainties materialize, actual results coulddiffer from those expressed or implied by theforward-looking statements. See “Forward-LookingStatements” at the beginning of this Annual Report.
Executive Summary
Flotek is a global diversified, technology-drivencompany that develops and supplies oilfield products,services and equipment to the oil, gas and miningindustries, and high value compounds to companiesthat make cleaning products, cosmetics, food andbeverages, and other products that are sold inconsumer and industrial markets.
The Company’s oilfield businesses include specialtychemicals and logistics, down-hole drilling tools andproduction-related tools. Flotek’s technologies enablecustomers to drill wells more efficiently, increasewell production and decrease well operating costs.The Company also provides automated bulk materialhandling, loading facilities and blending capabilities.The Company sources citrus oil domestically andinternationally and is one of the largest processors ofcitrus oil in the world. Products produced fromprocessed citrus oil include (1) high valuecompounds used as additives by companies in theflavors and fragrances markets and(2) environmentally friendly chemicals for use innumerous industries around the world, specificallythe O&G industry.
Flotek operates in over 20 domestic and internationalmarkets, including the Gulf Coast, Southwest, RockyMountains, Northeastern and Mid-Continentalregions of the U.S., Canada, Mexico, CentralAmerica, South America, Europe, Africa, MiddleEast, Australia and Asia-Pacific. Customers includemajor integrated O&G companies, oilfield servicescompanies, independent O&G companies, pressure-pumping service companies, national and state-
owned oil companies, and international supply chainmanagement companies. The Company also servescustomers who purchase non-energy-related citrus oiland related products, including household andcommercial cleaning product companies, fragranceand cosmetic companies, and food manufacturingcompanies.
The operations of the Company are categorized intofour reportable segments: Energy ChemicalTechnologies, Consumer and Industrial ChemicalTechnologies, Drilling Technologies and ProductionTechnologies (previously referred to as Artificial LiftTechnologies).
‰ Energy Chemical Technologies designs,develops, manufactures, packages and marketsspecialty chemicals used in O&G well drilling,cementing, completion, stimulation andproduction. In addition, the Company’schemistries are used in specialized enhanced andimproved oil recovery markets (“EOR” or“IOR”). Activities in this segment also includeconstruction and management of automatedmaterial handling facilities and management ofloading facilities and blending operations foroilfield services companies.
‰ Consumer and Industrial Chemical Technologiesdesigns, develops and manufactures productsthat are sold to companies in the flavor andfragrance industries and specialty chemicalindustry. These technologies are used bybeverage and food companies, fragrancecompanies, and companies providing householdand industrial cleaning products.
‰ Drilling Technologies rents, sells, inspects,manufactures and markets down-hole drillingequipment used in energy, mining, water welland industrial drilling activities.
‰ Production Technologies assembles and marketsproduction-related equipment, including thePetrovalve™ product line of rod pumpcomponents, electric submersible pumps, gasseparators, valves and services that supportnatural gas and oil production activities.
24

Market Conditions
The Company’s success is sensitive to a number offactors, which include, but are not limited to, drillingactivity, customer demand for its advancedtechnology products, market prices for raw materialsand governmental actions.
Drilling activity levels are influenced by a number offactors, including the number of rigs in operation, thegeographical areas of rig activity, and drill rig efficiency(rig days required per well). Additional factors thatinfluence the level of drilling activity include:
‰ Historical, current, and anticipated future O&Gprices,
‰ Federal, State and local governmental actionsthat may encourage or discourage drillingactivity,
‰ Customers’ strategies relative to capital fundsallocations,
‰ Weather conditions, and‰ Technological changes to drilling methods and
economics.
Historical North American drilling activity isreflected in “TABLE A” below:
Customers’ demand for advanced technologyproducts and services provided by the Company aredependent on their recognition of the value of:
‰ Chemistries that improve the economics of theirO&G operations,
‰ Drilling products that improve drillingoperations and efficiencies,
‰ Chemistries that are economically viable,socially responsible and ecologically sound, and
‰ Production technologies that improve productionand production efficiencies in maturing wells.
Market prices for citrus oils can be influenced by:
‰ Historical, current, and anticipated futureproduction levels of the global citrus (primarilyorange) crop,
‰ Weather related risks,‰ Health and condition of citrus trees (e.g., disease
and pests), and‰ International competition and pricing pressures
resulting from natural and artificial pricinginfluences.
Governmental actions may restrict the future use ofhazardous chemicals, including but not limited to, thefollowing industrial applications:
‰ O&G drilling and completion operations,‰ O&G production operations, and‰ Non-O&G industrial solvents.
TABLE A2014 2013 2012
2014 vs. 2013% Change
2013 vs. 2012% Change
Average North American Active Drilling RigsUnited States 1,862 1,761 1,919 5.7 % (8.2)%Canada 379 353 364 7.4 % (3.0)%
Total 2,241 2,114 2,283 6.0 % (7.4)%Average U.S. Active Drilling Rigs by Type
Vertical 376 435 552 (13.6)% (21.2)%Horizontal 1,275 1,102 1,151 15.7 % (4.3)%Directional 211 224 216 (5.8)% 3.7 %
Total 1,862 1,761 1,919 5.7 % (8.2)%Oil vs. Natural Gas North American Drilling Rigs
Oil 1,745 1,606 1,621 8.7 % (0.9)%Natural Gas 496 508 662 (2.4)% (23.3)%
Total North America 2,241 2,114 2,283 6.0 % (7.4)%US Average Wells Drilled per Rig 5.20 5.23 4.92 (0.6)% 6.3 %
Source: Rig count: Baker Hughes, Inc. (www.bakerhughes.com); Rig counts are the annual average of the reported weekly rig count activity.Well count: Baker Hughes, Inc. (www.bakerhughes.com); Well counts are the annual average of the reported quarterly wells/rig activity.
25

During year ended 2014, total North Americanactive drilling rig count saw an increase whencompared to the comparable periods of 2013 but adecrease compared to 2012. The increase in 2014was primarily in horizontal rig types and rigsdrilling in oil fields. While the U.S. drilling activitydecreased by (8.2)% from 2012 to 2013, itincreased by 5.7% in 2014 compared to 2013.However, the number of wells drilled per rig perquarter in 2014 has decreased to 5.20 from 5.23 forthe same period in 2013.
Outlook for 2015
During the second half of 2014 the price of crude oildeclined dramatically with the decline continuing inearly 2015. As a result, most North Americanexploration and production companies—many ofwhich are Flotek clients—have announced plans tosignificantly reduce their exploration and drillingactivity in 2015. The Company expects the reductionin activity to create a more challenging environment inwhich to market its broad range of energytechnologies, from chemistry to drilling andproduction technologies. Although the Companyexpects demand for its oil and gas related products andservices in North America to be impacted by theseindustry conditions, the Company plans to continueaggressive marketing of its oil and gas based productsand services including its Complex nano-Fluid®
chemistries, Teledrift® product line, recentlyintroduced Stemulator® product line and growing lineof production technologies. While internationalmarkets may react differently than North Americanmarkets to the decline in crude prices, the Companyexpects similar market challenges around the globe.However, the Company believes there are a number ofnew market opportunities that remain available in thecurrent price environment.
The Company expects capital spending to beapproximately $25 million in 2015, inclusive ofapproximately $10 million for construction of majorfacilities, including the Company’s previouslyannounced Global Research & Innovationheadquarters in Houston and the Company’schemistry manufacturing and research facility nearSohar, Oman, through its joint venture with GulfEnergy. The Company believes construction ofthese facilities should generate substantial value in2016 and beyond. The Company will remain nimblein its core capital expenditure plans, adjusting asmarket conditions warrant.
The Company’s new Global Research & Innovationheadquarters in Houston will not only allow for thedevelopment of new energy chemistries but willallow expanded collaboration between clients,leaders from academia and Company scientists. Thecompany believes these collaborative opportunitieswill become an important and distinguishingcapability within the industry. The Company alsoplans to continue to expand the capabilities and useof its patent pending FracMaxTM software whichshould continue to enhance the Company’s salesand marketing efforts by validating the productionand economic benefits of the Company’s coreComplex nano-Fluid® chemistries.
The Company continues to pursue selected strategicrelationships, both domestically and internationally,to expand its business.
In January, 2014, the Company acquired EclipseIOR Services, LLC (“EOGA”), a leading enhancedoil recovery design and injection firm. EOGA’sexpertise in enhanced oil recovery processes andthe use of polymers to improve the performance ofEOR projects have been combined with theCompany’s previously existing EOR products andservices.
In April, 2014, the Company acquired 100% of themembership interests in SiteLark, LLC(“SiteLark”). SiteLark provides reservoirengineering and modeling services for a variety ofhydrocarbon applications. Its service assistsengineers with reservoir simulation, reservoirengineering and waterflood optimization.
The outlook for the Company’s consumer andindustrial chemistries will be driven by availabilityand demand for citrus oils and other bio-based rawmaterials. Current inventory and crop expectationsare sufficient to meet the Company’s needs tosupply its flavor and fragrance business as well asthe industrial markets. However, market pricevolatility may result in revenue and marginfluctuations from quarter to quarter.
Changes to global geo-political, global economicand industry events could have an impact, eitherpositive or negative, on the Company’s business. Inthe event of significant adverse changes to thedemand for oil and gas production and/or themarket price for oil and gas, the market conditionsaffecting the Company could change quickly and
26

materially. Should such adverse changes to marketconditions occur, management believes the Companyhas adequate liquidity to withstand the impact of suchchanges while continuing to make strategic capitalinvestments and acquisitions if and when opportunities
arise. In addition, management believes the Companyis well-positioned to take advantage of significantincreases in demand for its products should marketconditions improve dramatically in the near term.
Results of Operations (in thousands): Year ended December 31,
2014 2013 2012
Revenue $ 449,157 $ 371,065 $ 312,828Cost of revenue 266,198 223,538 181,209
Gross margin 182,959 147,527 131,619Gross margin % 40.7 % 39.8 % 42.1 %
Selling, general and administrative costs 87,146 78,197 66,415Selling, general and administrative costs % 19.4 % 21.1 % 21.2 %
Depreciation and amortization 9,738 7,273 4,410Research and innovation costs 4,976 3,752 3,182Gain on disposal of long-lived assets 211 (421) (1,009)
Income from operations 80,888 58,726 58,621Income from operations % 18.0 % 15.8 % 18.7 %
Change in fair value of warrant liability — — 2,649Interest and other expense, net (2,004) (1,776) (15,812)
Income before income taxes 78,884 56,950 45,458Income tax (expense) benefit (25,281) (20,772) 4,333
Net income $ 53,603 $ 36,178 $ 49,791
Net income % 11.9 % 9.7 % 15.9 %
Results for 2014 compared to 2013—Consolidated
Consolidated revenue for the year ended December 31,2014 increased $78.1 million or 21.0%, from the priorcorresponding period. The increase in revenue wasprimarily due to increased sales of stimulationchemical additives in our Energy ChemicalTechnologies segment and the incremental revenuefrom the acquisition of Florida Chemical in the secondquarter of 2013 and the 2014 acquisition of EOGA.
Consolidated gross margin for the year endedDecember 31, 2014 increased $35.4 million, or24.0%, from the prior corresponding period. Grossmargin as a percentage of revenue increased to40.7% for the year ended December 31, 2014 from39.8% from the prior corresponding period, primarilyattributable to improved margins in the drillingtechnologies segment.
Selling, general and administrative (“SG&A”)expenses are not directly attributable to products soldor services provided. SG&A costs as a percentage ofrevenue declined from 21.1% to 19.4% for the yearended December 31, 2014 compared to the priorcorresponding period as revenues grew faster thanSG&A costs. SG&A costs increased $8.9 million, or11.4%, for the year ended December 31, 2014 fromthe prior corresponding period primarily due toSG&A costs for the acquired companies discussedabove and increased headcount and associated costsrelated to the pursuit of growth opportunities.
Depreciation and amortization expense not included ingross margin, for the year ended December 31, 2014increased by $2.5 million, or 33.9% from the priorcorresponding period. This increase was primarilyattributable to the depreciation and amortization ofassets recognized as part of the acquisition of FloridaChemical in the second quarter of 2013 and theacquisition of EOGA in the first quarter of 2014.
27

Research and Innovation (“R&I”) expense for theyear ended December 31, 2014 increased $1.2million or 32.6% for the year ended December 31,2014 from the prior corresponding period. Theincrease in R&I is primarily attributable to newproduct innovation and Flotek’s commitment toremaining responsive to customer needs, increaseddemand and continued growth of our existingproduct lines.
Interest and other expense increased $0.2 million,or 12.8% for the year ended December 31, 2014compared to the prior corresponding period.
The Company recorded an income tax provision of$25.3 million, yielding an effective tax rate of32.0% for the year ended December 31, 2014compared to an income tax provision of $20.8million yielding an effective tax rate of 36.5% inthe prior corresponding period. The change in theeffective tax rate from 2013 to 2014 was primarilydue to changes in state apportionment factorsincluding the effect on state deferred tax assets andliabilities.
Results for 2013 compared to 2012—Consolidated
Consolidated revenue for the year endedDecember 31, 2013 increased $58.2 million, or18.6%, from the prior corresponding period. Theincrease in revenue was primarily due to theacquisition of Florida Chemical, which contributedincremental revenue of $50.9 million during 2013.Excluding the impact of the acquisition, 2013revenues increased $7.3 million or 2.3% whencompared with 2012, while the total average NorthAmerican drilling rig count decreased by 7.4%.Revenue increases in the Energy ChemicalTechnologies and Production Technologiessegments were partially offset by revenue declinesin the Drilling Technologies segment.
Consolidated gross margin for the year endedDecember 31, 2013 increased $15.9 million, or12.1%, from the prior corresponding period. Theincrease in gross margin was primarily due to theincrease in revenue. The gross margin percentagedecline was primarily attributable to portfolio mixresulting from the inclusion of Florida Chemical in2013 results and proportionately higher sales ofnon-proprietary products in the Energy ChemicalTechnologies segment and increasing costs ofactuated tools in the Drilling Technologies segment.
This decrease was partially offset by supply chainbenefits from the Florida Chemical acquisition andproportionately higher sales of technology tools inthe Drilling Technologies segment.
Selling, general and administrative (“SG&A”)expenses are not directly attributable to productssold or services provided. SG&A costs for the yearended December 31, 2013 increased by $11.8million, or 17.7% from the prior correspondingperiod. Excluding incremental SG&A costs of $4.9million associated with the Florida Chemicalbusiness acquired, SG&A costs increased $6.9million primarily due to costs incurred in 2013related to executive severance ($1.0 million),implementation of the Company’s new ERP system($0.8 million), and expenses related to the pursuit ofacquisitions and major initiatives in internationalmarkets ($1.7 million). Excluding these items andthe incremental SG&A costs of the FloridaChemical business, SG&A costs increased $3.4million or 5.1% primarily due to increases inheadcount, general insurance, and travel relatedcosts. SG&A costs as a percentage of revenuedecreased from 21.2% to 21.1% for the year endedDecember 31, 2013 compared to the priorcorresponding period.
Depreciation and amortization expense not includedin gross margin, for the year ended December 31,2013 increased by $2.9 million or 64.9% from theprior corresponding period. This increase wasprimarily attributable to incremental depreciationand amortization of assets recognized as part of theacquisition of Florida Chemical.
R&I expense for the year ended December 31, 2013increased $0.6 million or 17.9% from the priorcorresponding period. The increase in R&I isprimarily attributable to new product innovation,and Flotek’s commitment to remaining responsiveto increased demand and continued growth of ourproduct lines.
Interest and other expense for the year endedDecember 31, 2013 decreased by $14.0 million, or88.8% from the prior corresponding period. Thedecline in interest expense was primarily due to therepayment of the Company’s convertible notes of$50.3 million at the end of the fourth quarter of2012 and $5.2 million during the first quarter of2013.
28

The Company recorded an income tax provision of$20.8 million yielding an effective tax rate of 36.5%for the year ended December 31, 2013, compared toan income tax benefit of $4.3 million reflecting aneffective tax rate of (9.5)% for the priorcorresponding period. The Company’s effective tax
rate in 2012 was affected primarily by an $18.6million decrease in the valuation allowance against adeferred tax asset. Additionally, fluctuations ineffective tax rates have historically been impacted bynon-cash changes in the fair value of the Company’swarrant liability and permanent tax differences.
Results by Segment
Energy Chemical Technologies (dollars in thousands) Year ended December 31,
2014 2013 2012
Revenue $ 268,761 $ 200,932 $ 183,986
Gross margin $ 117,867 $ 88,536 $ 81,438
Gross margin % 43.9 % 44.1 % 44.3 %
Income from operations $ 84,846 $ 65,396 $ 65,440
Income from operations % 31.6 % 32.5 % 35.6 %
Results for 2014 compared to 2013—EnergyChemical Technologies
Energy Chemical Technologies revenue for the yearended December 31, 2014 increased $67.8 million, or33.8%, from the prior corresponding period.Excluding the incremental revenue impact of theFlorida Chemical, EOGA and SiteLark acquisitionsof $10.5 million, revenue increased $57.3 million, or28.5%, compared with the prior correspondingperiod, primarily due to the increased sales ofstimulation chemical additives, largely the result ofthe introduction of the Company’s proprietary,patent-pending FracMax™ software whichstatistically demonstrates the positive production andeconomic impact of using Flotek’s CnF® chemistriesin unconventional well completions. The FracMaxTM
software has led to a record number of newvalidation projects and accelerated commercialacceptance of the Company’s CnF® completionchemistries.
Energy Chemical Technologies gross margin for theyear ended December 31, 2014 increased $29.3million, or 33.1%, from the prior correspondingperiod primarily due to the increase in product salesrevenue. Gross margin as a percentage of revenue forthe year ended December 31, 2014 was essentiallyunchanged at 43.9% compared to the priorcorresponding period.
Income from operations for the Energy ChemicalTechnologies segment increased $19.5 million, or
29.7% for year ended December 31, 2014 comparedto the prior corresponding period. This increase isprimarily attributable to an increase in gross margin,partially offset by increased sales and marketingefforts in pursuit of growth opportunities and theCompany’s continued commitment to its researchand innovation efforts within Energy ChemicalTechnologies.
Results for 2013 compared to 2012—EnergyChemical Technologies
Energy Chemical Technologies revenue for yearended December 31, 2013 increased $16.9 million, or9.2%, from the prior corresponding period.Excluding the incremental revenue impact of theFlorida Chemical acquisition of $8.0 million, revenueincreased $8.9 million, or 4.9% from the priorcorresponding period. The increase in 2013 revenueexcluding the Florida Chemical acquisition wasprimarily due to an increase in sales of stimulationchemicals of $7.5 million, or 4.6%. Throughout theyear, customers increased usage of stimulationchemicals in the Rockies, South Texas and otherNorth American basins.
Energy Chemical Technologies’ gross margin for theyear ended December 31, 2013 increased $7.1million, or 8.7% from the prior corresponding period.Gross margin percentage for 2013 declined 0.2%compared to the prior corresponding period primarilyattributable to product portfolio mix resulting fromproportionately higher sales of non-proprietary
29

products partially offset by the supply chain benefitsof the Florida Chemical acquisition.
Income from operations for the Energy ChemicalTechnologies segment was relatively flat for the yearended December 31, 2013 compared to 2012. Income
from operations percentage for 2013 decreased 3.1%compared to the 2012. The decrease in income fromoperations percentage is primarily related toincreased R&I, sales staff and travel costs incurred inpursuit of growth opportunities.
Consumer and Industrial Chemical Technologies(dollars in thousands)
Year ended December 31,
2014 2013 2012
Revenue $ 51,091 $ 42,927 $ —
Gross margin $ 12,897 $ 10,659 $ —
Gross margin % 25.2 % 24.8 % — %
Income from operations $ 6,558 $ 6,260 $ —
Income from operations % 12.8 % 14.6 % — %
Results for 2014 compared to 2013—Consumer andIndustrial Chemical Technologies
CICT revenue for the year ended December 31, 2014increased $8.2 million or 19.0%, from the priorcorresponding period, as the segment was created inthe second quarter of 2013 upon the acquisition ofFlorida Chemical.
CICT gross margin for the year ended December 31,2014 increased $2.2 million, or 21.0% from the priorcorresponding period primarily due to the segmentbeing created in the second quarter of 2013 upon theacquisition of Florida Chemical. Gross margin as apercentage of revenue increased to 25.2% for theyear ended December 31, 2014 compared to 24.8%from the prior corresponding period.
Income from operations for the CICT segmentincreased $0.3 million, or 4.8%, for the year endedDecember 31, 2014 from the prior correspondingperiod primarily due to the increased revenuebetween the two periods.
Results for 2013 compared to 2012—Consumer andIndustrial Chemical Technologies
CICT revenue for the year ended December 31, 2013was $42.9 million. Revenue for the year ended
December 31, 2013 is incremental to the Companyfor the period as this is a new segment acquiredduring the second quarter of 2013. CICT revenue isprimarily driven by demand for d-Limonene andother bio-based chemistries produced for a multitudeof industries, as well as from citrus isolates producedfor the flavor and fragrance industry. Revenue forCICT is subject to market seasonality and availabilityof raw materials.
CICT gross margin for the year to date period endedDecember 31, 2013 contributed incrementally to theCompany’s overall consolidated margin as part of thenew segment of business acquired in May 2013. Theprimary drivers of the margins of the CICT segmentare demand for the Company’s bio-based chemistriesand the high value flavor and fragrance isolates. Thegeneral direction of the citrus oil markets andseasonality of flavor compounds can also impactmargin results.
Income from operations for year to date period endedDecember 31, 2013 contributed incrementally to theCompany’s overall consolidated income fromoperations over the comparable period of 2012.
30
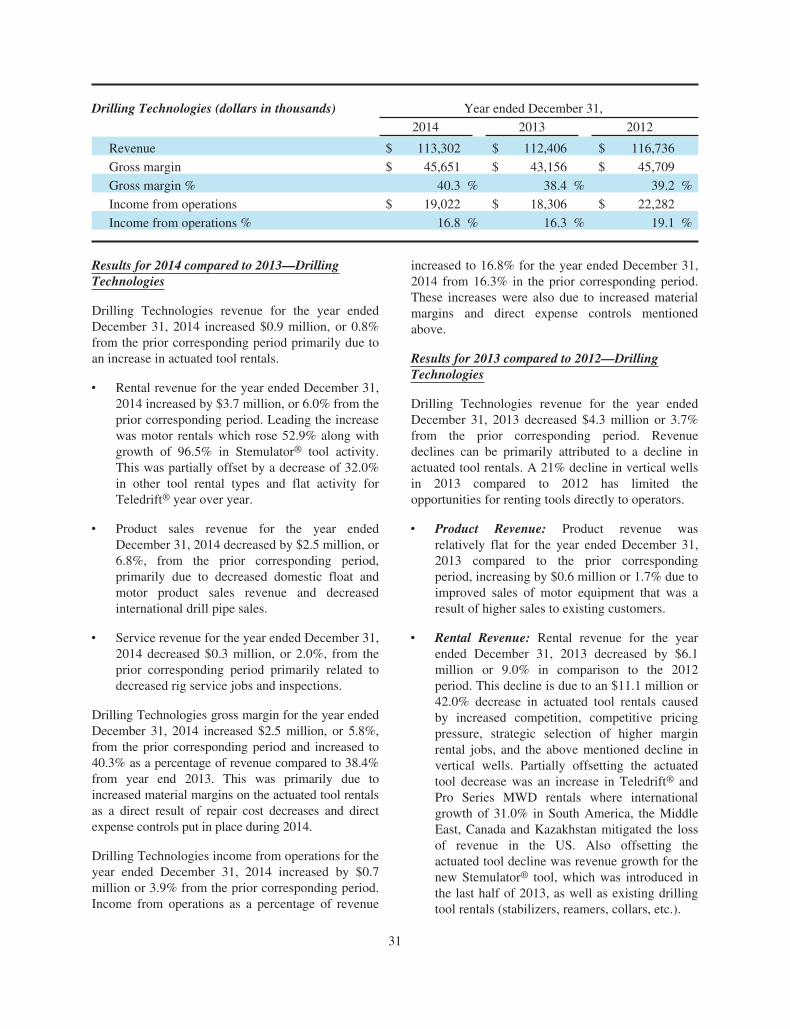
Drilling Technologies (dollars in thousands) Year ended December 31,
2014 2013 2012
Revenue $ 113,302 $ 112,406 $ 116,736
Gross margin $ 45,651 $ 43,156 $ 45,709
Gross margin % 40.3 % 38.4 % 39.2 %
Income from operations $ 19,022 $ 18,306 $ 22,282
Income from operations % 16.8 % 16.3 % 19.1 %
Results for 2014 compared to 2013—DrillingTechnologies
Drilling Technologies revenue for the year endedDecember 31, 2014 increased $0.9 million, or 0.8%from the prior corresponding period primarily due toan increase in actuated tool rentals.
‰ Rental revenue for the year ended December 31,2014 increased by $3.7 million, or 6.0% from theprior corresponding period. Leading the increasewas motor rentals which rose 52.9% along withgrowth of 96.5% in Stemulator® tool activity.This was partially offset by a decrease of 32.0%in other tool rental types and flat activity forTeledrift® year over year.
‰ Product sales revenue for the year endedDecember 31, 2014 decreased by $2.5 million, or6.8%, from the prior corresponding period,primarily due to decreased domestic float andmotor product sales revenue and decreasedinternational drill pipe sales.
‰ Service revenue for the year ended December 31,2014 decreased $0.3 million, or 2.0%, from theprior corresponding period primarily related todecreased rig service jobs and inspections.
Drilling Technologies gross margin for the year endedDecember 31, 2014 increased $2.5 million, or 5.8%,from the prior corresponding period and increased to40.3% as a percentage of revenue compared to 38.4%from year end 2013. This was primarily due toincreased material margins on the actuated tool rentalsas a direct result of repair cost decreases and directexpense controls put in place during 2014.
Drilling Technologies income from operations for theyear ended December 31, 2014 increased by $0.7million or 3.9% from the prior corresponding period.Income from operations as a percentage of revenue
increased to 16.8% for the year ended December 31,2014 from 16.3% in the prior corresponding period.These increases were also due to increased materialmargins and direct expense controls mentionedabove.
Results for 2013 compared to 2012—DrillingTechnologies
Drilling Technologies revenue for the year endedDecember 31, 2013 decreased $4.3 million or 3.7%from the prior corresponding period. Revenuedeclines can be primarily attributed to a decline inactuated tool rentals. A 21% decline in vertical wellsin 2013 compared to 2012 has limited theopportunities for renting tools directly to operators.
‰ Product Revenue: Product revenue wasrelatively flat for the year ended December 31,2013 compared to the prior correspondingperiod, increasing by $0.6 million or 1.7% due toimproved sales of motor equipment that was aresult of higher sales to existing customers.
‰ Rental Revenue: Rental revenue for the yearended December 31, 2013 decreased by $6.1million or 9.0% in comparison to the 2012period. This decline is due to an $11.1 million or42.0% decrease in actuated tool rentals causedby increased competition, competitive pricingpressure, strategic selection of higher marginrental jobs, and the above mentioned decline invertical wells. Partially offsetting the actuatedtool decrease was an increase in Teledrift® andPro Series MWD rentals where internationalgrowth of 31.0% in South America, the MiddleEast, Canada and Kazakhstan mitigated the lossof revenue in the US. Also offsetting theactuated tool decline was revenue growth for thenew Stemulator® tool, which was introduced inthe last half of 2013, as well as existing drillingtool rentals (stabilizers, reamers, collars, etc.).
31

‰ Service Revenue: The service revenue for theyear ended December 31, 2013 increased $1.1million, or 8.7% from the prior correspondingperiod. The increased service revenue wasprimarily related to increased rig installations,inspections and increased pricing of servicesoffered in the market.
Drilling Technologies gross margin for the yearended December 31, 2013 decreased by $2.6 million,or 5.6%, from the prior corresponding period due tothe sales decrease and actuated tool cost increases.As a percentage of revenue gross margin declined by
only 0.8% as a result of actuated tool cost increasespartially offset by an improved product mix resultingfrom proportionately higher sales of higher marginTeledrift® series tools, Stemulator® tool and otherdrilling tools and services.
Drilling Technologies income from operations for theyear ended December 31, 2013 decreased by $4.0million, or 17.8% and by 2.8% as a percentage ofrevenue from the prior corresponding period. Thisdecline was primarily due to the lower revenue andgross margins, increased sales force related costs,medical costs, and general insurance expenses.
Production Technologies (dollars in thousands) Year ended December 31,
2014 2013 2012
Revenue $ 16,003 $ 14,800 $ 12,106
Gross margin $ 6,544 $ 5,176 $ 4,472
Gross margin % 40.9 % 35.0 % 36.9 %
Income from operations $ 3,246 $ 3,060 $ 3,395
Income from operations % 20.3 % 20.7 % 28.0 %
Results for 2014 compared to 2013—ProductionTechnologies
Revenue for the Production Technologies segment forthe year ended December 31, 2014 revenue increasedby $1.2 million, or 8.1% from the prior correspondingperiod as sales of PetrovalveTM tools and lifting unitsrose by $4.6 million, or 152.9% in 2014. Offsettingthose revenue increases was a decrease in equipmentsales and related services of $3.5 million, or 31.1% incoal-bed methane related business.
Production Technologies gross margin increased by$1.4 million, or 26.4% for the year endedDecember 31, 2104. Gross margin as a percentage ofrevenue increased to 40.9% compared to 35.0%, fromthe prior corresponding period, primarily due to thehigher margins associated with the internationalvalve sales and slight improvement in margins onpump equipment.
Income from operations increased by $0.2 million, or6.1% for the year ended December 31, 2014, fromthe prior corresponding period, primarily due to theincreased material margins mentioned above partiallyoffset by SG&A expenses which increased by 55.6%due to costs attributable to employee-relatedexpenses as the segment continues to refocus andreposition for growth in the market.
Results for 2013 compared to 2012—ProductionTechnologies
Production Technologies revenue is primarilyderived from coal bed methane (“CBM”) drillingactivity, and is impacted by the price of natural gas;although the segment is starting to diversify intomore oil related equipment sales and service.Revenue for the Production Technologies segmentfor the year ended December 31, 2013 increased by$2.7 million, or 22.3% from the prior correspondingperiod. The introduction of SSI Lift Systems in thesecond half of 2013; as well as increased pump andpump equipment sales led to the revenue increase.This increase is due to a slight rebound in the gasworkover drilling market, additional installations in2013, and more oil related equipment sales.
Production Technologies gross margins increased forthe year ended December 31, 2013 by $0.7 million or15.7% from the prior corresponding period due to theincreased sales. As a percentage of revenue, grossmargin has declined by 1.9% from the priorcorresponding period as the increase in revenue in 2013is almost entirely made up of oil related surface pumpequipment which carries much lower margins than theinternational valve sales, which were flat year over year.
32
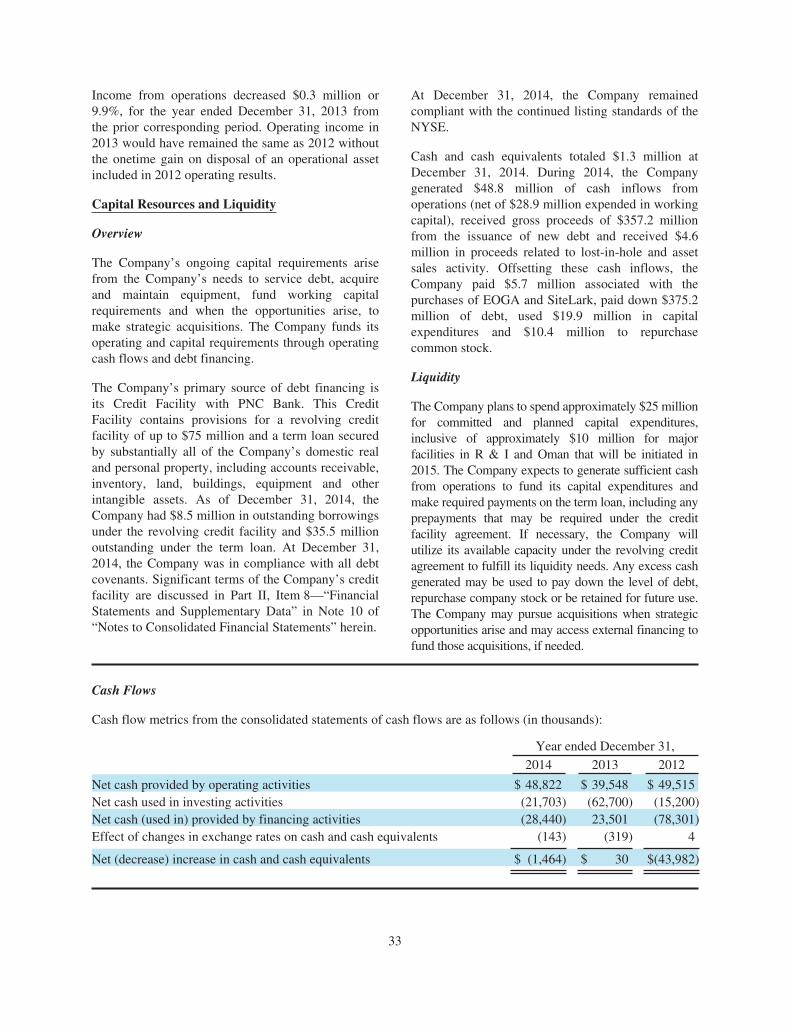
Income from operations decreased $0.3 million or9.9%, for the year ended December 31, 2013 fromthe prior corresponding period. Operating income in2013 would have remained the same as 2012 withoutthe onetime gain on disposal of an operational assetincluded in 2012 operating results.
Capital Resources and Liquidity
Overview
The Company’s ongoing capital requirements arisefrom the Company’s needs to service debt, acquireand maintain equipment, fund working capitalrequirements and when the opportunities arise, tomake strategic acquisitions. The Company funds itsoperating and capital requirements through operatingcash flows and debt financing.
The Company’s primary source of debt financing isits Credit Facility with PNC Bank. This CreditFacility contains provisions for a revolving creditfacility of up to $75 million and a term loan securedby substantially all of the Company’s domestic realand personal property, including accounts receivable,inventory, land, buildings, equipment and otherintangible assets. As of December 31, 2014, theCompany had $8.5 million in outstanding borrowingsunder the revolving credit facility and $35.5 millionoutstanding under the term loan. At December 31,2014, the Company was in compliance with all debtcovenants. Significant terms of the Company’s creditfacility are discussed in Part II, Item 8—“FinancialStatements and Supplementary Data” in Note 10 of“Notes to Consolidated Financial Statements” herein.
At December 31, 2014, the Company remainedcompliant with the continued listing standards of theNYSE.
Cash and cash equivalents totaled $1.3 million atDecember 31, 2014. During 2014, the Companygenerated $48.8 million of cash inflows fromoperations (net of $28.9 million expended in workingcapital), received gross proceeds of $357.2 millionfrom the issuance of new debt and received $4.6million in proceeds related to lost-in-hole and assetsales activity. Offsetting these cash inflows, theCompany paid $5.7 million associated with thepurchases of EOGA and SiteLark, paid down $375.2million of debt, used $19.9 million in capitalexpenditures and $10.4 million to repurchasecommon stock.
Liquidity
The Company plans to spend approximately $25 millionfor committed and planned capital expenditures,inclusive of approximately $10 million for majorfacilities in R & I and Oman that will be initiated in2015. The Company expects to generate sufficient cashfrom operations to fund its capital expenditures andmake required payments on the term loan, including anyprepayments that may be required under the creditfacility agreement. If necessary, the Company willutilize its available capacity under the revolving creditagreement to fulfill its liquidity needs. Any excess cashgenerated may be used to pay down the level of debt,repurchase company stock or be retained for future use.The Company may pursue acquisitions when strategicopportunities arise and may access external financing tofund those acquisitions, if needed.
Cash Flows
Cash flow metrics from the consolidated statements of cash flows are as follows (in thousands):
Year ended December 31,
2014 2013 2012
Net cash provided by operating activities $ 48,822 $ 39,548 $ 49,515Net cash used in investing activities (21,703) (62,700) (15,200)Net cash (used in) provided by financing activities (28,440) 23,501 (78,301)Effect of changes in exchange rates on cash and cash equivalents (143) (319) 4
Net (decrease) increase in cash and cash equivalents $ (1,464) $ 30 $(43,982)
33
Operating Activities
During 2014, 2013 and 2012, cash from operatingactivities totaled $48.8 million, $39.5 million and$49.5 million, respectively. Consolidated netearnings for 2014 totaled $53.6 million, comparedto consolidated net earnings of $36.2 million for2013 and consolidated net earnings of $49.8 millionfor 2012.
Noncash items recognized in 2014 totaled $24.2million, consisting primarily of depreciation andamortization expense ($17.8 million), stockcompensation expense ($10.5 million), changes todeferred income taxes ($1.5 million) and provisionsrelated to accounts receivables and inventories($0.8 million) partially offset by gain on sale ofassets ($3.4 million) and excess tax benefit relatedto share-based awards ($3.4 million).
Noncash items recognized in 2013 totaled $22.7million, consisting primarily of depreciation andamortization expense ($15.1 million), stockcompensation expense ($10.9 million), provisionsrelated to accounts receivables and inventories($1.9 million) partially offset by gains on the sale ofassets ($4.6 million) and excess tax benefit relatedto share-based awards ($1.7 million).
Noncash items recognized in 2012 totaled $10.4million, consisting primarily of depreciation andamortization expense ($11.6 million), amortization ofdeferred financing costs and accretion of debtdiscount ($4.7 million), share-based compensationexpense ($13.4 million) and non-cash losses on theearly extinguishment of debt ($4.8 million), partiallyoffset by deferred income taxes ($18.7 million) netgains on asset disposals ($4.8 million) and changes inthe fair value of the warrant liability ($2.6 million).
During 2014 changes in working capital used $28.9million, primarily consisting of increasedinventories ($23.1 million), higher receivables($13.7 million), increased other current assets ($6.4million), partially offset by higher payables ($13.1million) and higher income taxes payables ($1.4million).
During 2013 changes in working capital used $19.3million in cash, primarily consisting of lowerpayables ($21.3 million), higher receivables ($9.9million), partially offset by lower inventories ($4.5million), higher accrued liabilities ($4.1 million)and higher income taxes payables ($2.2 million).
During 2012 changes in working capital used $10.6million in cash. Changes in working capital during2012 reflected our increased activity levels, with theuse being driven primarily by increased inventories($9.4 million), increased other current assets ($2.1million) accrued liabilities ($1.9 million) andinterest payable ($2.0 million), partially offset bydecreased accounts receivable ($1.8 million) andincreased accounts payable ($2.5 million), and adecrease in income taxes payable ($0.4 million).
Investing Activities
During 2014 investing activities used cash of $21.7million, including $19.9 million in capitalexpenditures and $5.7 million associated with thepurchase of Eclipse IOR Services, LLC andSiteLark, LLC, partially offset by proceeds fromsales of assets ($4.6 million).
During 2013 investing activities used cash of $62.7million, including ($53.4) million associated withthe purchase of Florida Chemical, ($15.0) million incapital expenditures partially offset by proceedsfrom sales of assets ($5.8 million). Capitalexpenditures for 2013 decreased when compared to2012 primarily due to lower spending on bothdrilling technologies facilities expansion and theCompany’s new ERP system.
During 2012, investing activities used cash of $15.2million. Capital expenditures were $20.7 millionand were partially offset with proceeds from thesale of assets of $5.5 million.
Financing Activities
During 2014, financing activities used cash of $28.4million primarily related to the net repayment of therevolving line of credit ($7.8 million), payments onthe term loan ($10.3 million) and net equity relatedtransactions ($10.0 million) primarily therepurchase of common stock.
During 2013, financing activities generated $23.5million primarily related to borrowings under theCompany’s term loan ($26.2 million), andrevolving line of credit ($16.3 million), partiallyoffset by debt payments ($13.2 million) and equityrelated transactions ($4.5 million) primarilypurchase of treasury stock. The increase borrowingsunder the term loan and the revolving line of creditwere related to the Company’s acquisition ofFlorida Chemical.
34

Financing activities used $78.3 million in cash during2012 for the payments on capital lease obligationsand the retirement of convertible notes ($102.4million) and the purchases of treasury stock for taxwithholding purposes ($2.0 million). Cash outflowsfor financing activities were partially offset byproceeds from the issuance of our 2012 Term Loan($25.0 million).
Although the Company has no immediate intention toaccess the capital markets, the Company intends tofile a “universal” shelf registration with the Securitiesand Exchange Commission in the future. This shelfregistration statement will register the issuance andsale from time to time of various securities by theCompany, including but not limited to senior notes,subordinated notes, preferred stock, common stock,and warrants. Once this shelf registration statement isfiled with the Securities and Exchange Commissionand becomes effective, the Company will have thefinancial flexibility to access the capital marketsquickly and efficiently from time to time as the needmay arise.
Off-Balance Sheet Arrangements
There have been no transactions that generaterelationships with unconsolidated entities or financialpartnerships, such as entities often referred to as“structured finance” or “special purpose entities”
(“SPEs”), established for the purpose of facilitatingoff-balance sheet arrangements or other contractuallynarrow or limited purposes. As of December 31,2014, the Company was not involved in anyunconsolidated SPEs.
The Company has not made any guarantees tocustomers or vendors nor does the Company haveany off-balance sheet arrangements or commitmentsthat have, or are reasonably likely to have, a currentor future effect on the Company’s financialcondition, change in financial condition, revenue,expenses, results of operations, liquidity, capitalexpenditures or capital resources that are material toinvestors.
Contractual Obligations
Cash flows from operations are dependent on avariety of factors, including fluctuations in operatingresults, accounts receivable collections, inventorymanagement, and the timing of payments for goodsand services. Correspondingly, the impact ofcontractual obligations on the Company’s liquidityand capital resources in future periods is analyzed inconjunction with such factors.
Material contractual obligations consist of repaymentof amounts borrowed under the Company’s CreditFacility and payment of operating lease obligations.
Contractual obligations at December 31, 2014 are as follows (in thousands):
Payments Due by Period
TotalLess than
1 year 1 - 3 years 3 -5 yearsMore than
5 years
Term loan $ 35,541 $ 10,143 $ 14,286 $ 11,112 $ -Estimated interest expense on term loan (1) 3,262 1,369 1,696 197 -Borrowings under revolving credit facility (2) 8,500 8,500 - - -Operating lease obligations 25,208 2,440 4,921 3,929 13,918
Total $ 72,511 $ 22,452 $ 20,903 $ 15,238 $ 13,918
(1) For the purpose of this calculation, interest rates on variable rate obligations remain unchanged from December 31, 2014.(2) The borrowing is classified as current debt. The weighted-average interest rate was 3.75% at December 31, 2014.
Critical Accounting Policies and Estimates
The Company’s consolidated financial statementshave been prepared in accordance with accountingprinciples generally accepted in the United States ofAmerica (“GAAP”). Preparation of these statementsrequires management to make judgments, estimatesand assumptions that affect the amounts of assets and
liabilities in the financial statements and revenue andexpenses during the reporting period. Significantaccounting policies are described in Note 2“Summary of Significant Accounting Policies” in theNotes to the Consolidated Financial Statements. TheCompany believes the following accounting policiesare critical due to the significant, subjective andcomplex judgments and estimates required when
35

preparing the consolidated financial statements. TheCompany regularly reviews judgments, assumptionsand estimates to the critical accounting policies.
Revenue Recognition
Revenue for product sales and services isrecognized when all of the following criteria havebeen met: (a) persuasive evidence of anarrangement exists, (b) products are shipped orservices rendered to the customer and all significantrisks and rewards of ownership have passed to thecustomer, (c) the price to the customer is fixed anddeterminable, and (d) collectability is reasonablyassured. The Company’s products and services aresold based on a purchase order and/or contract andhave fixed or determinable prices. There is typicallyno right of return or any significant post-deliveryobligations. Probability of collection is assessed ona customer-by-customer basis.
Revenue and associated accounts receivable in theEnergy Chemicals technologies, Consumer andIndustrial Chemical Technologies, DrillingTechnologies and Production Technologies segmentsare recorded at the agreed price when theaforementioned conditions are met. Generally asigned proof of obligation is obtained from thecustomer (delivery ticket or field bill for usage).Deposits and other funds received in advance ofdelivery are deferred until the transfer of ownershipis complete.
The Logistics division of chemicals recognizesrevenue related to design and construction oversightcontracts using the percentage-of-completion methodof accounting, measured by the percentage of costsincurred to date proportionate to the total estimatedcosts of completion. This calculated percentage isapplied to the total estimated revenue at completionto calculate revenue earned to date. Contract costsinclude all direct labor and material costs, as well asindirect costs related to manufacturing andconstruction operations. General and administrativecosts are charged to expense as incurred. Changes injob performance metrics and estimated profitability,including those arising from contract bonus andpenalty provisions and final contract settlements,may periodically result in revisions to revenue andexpenses and are recognized in the period in whichsuch revisions become probable. Known oranticipated losses on contracts are recognized whensuch amounts become probable and estimable.
Within the Drilling segment, revenue is recognizedupon receipt of a signed and dated field billingticket from the customer. Customers are chargedcontractually agreed amounts for oilfield rentalequipment damaged or lost-in-hole (“LIH”). LIHproceeds are recognized as revenue and theassociated carrying value is charged to cost of sales.
Revenue for equipment sold by the ProductionTechnologies segment is recorded net of any creditissued for return of an item for refurbishment underthe equipment exchange program.
Sales tax collected from customers is not includedin revenue but rather is accrued as a liability forfuture remittance to the respective taxingauthorities.
Allowance for Doubtful Accounts
The Company performs ongoing credit evaluationsof customers and grants credit based upon historicalpayment history, financial condition and industryexpectations as available. Determination of thecollectability of amounts due from customersrequires the Company to use estimates and makejudgments regarding future events and trends,including monitoring customers’ payment historyand current credit worthiness in order to determinethat collectability is reasonably assured. TheCompany also considers the overall businessclimate in which its customers operate.
These uncertainties require the Company to makefrequent judgments and estimates regarding acustomers’ ability to pay amounts due in order toassess and quantify an appropriate allowance fordoubtful accounts. The primary factors used toquantify the allowance are customer delinquency,bankruptcy, and the Company’s estimate of itsability to collect outstanding receivables based onthe number of days a receivable has beenoutstanding.
The majority of the Company’s customers operatein the energy industry. The cyclical nature of theindustry may affect customers’ operatingperformance and cash flows, which could impactthe Company’s ability to collect on theseobligations. Additionally, some customers arelocated in international areas that are inherentlysubject to risks of economic, political and civilinstability.
36
The Company continues to monitor the economicclimate in which its customers operate and theaging of its accounts receivable. The allowance fordoubtful accounts is based on the aging of accountsand an individual assessment of each invoice. AtDecember 31, 2014, the allowance was 1.1% ofgross accounts receivable, compared to anallowance of 1.3% a year earlier. While creditlosses have historically been within expectationsand the provisions established, should actual write-offs differ from estimates, revisions to theallowance would be required.
Inventory Reserves
Inventories consist of raw materials, work-in-process and finished goods and are stated at thelower of cost or market, using the weighted-averagecost method. Finished goods inventories includeraw materials, direct labor and production overhead.The Company’s inventory reserve represents theexcess of the inventory carrying value over theamount expected to be realized from the ultimatesale or other disposal of the inventory.
The Company regularly reviews inventoryquantities on hand and records provisions orimpairments for excess or obsolete inventory basedon the Company’s forecast of product demand,historical usage of inventory on hand, marketconditions, production and procurementrequirements and technological developments.Significant or unanticipated changes in marketconditions or Company forecasts could affect theamount and timing of provisions for excess andobsolete inventory and inventory impairments.
Significant changes have not been made in themethodology used to estimate the reserve for excessand obsolete inventory or impairments during thepast three years. Specific assumptions are updatedat the date of each evaluation to consider Companyexperience and current industry trends. Significantjudgment is required to predict the potential impactwhich the current business climate and evolvingmarket conditions could have on the Company’sassumptions. Changes which may occur in theenergy industry are hard to predict and they mayoccur rapidly. To the extent that changes in marketconditions result in adjustments to managementassumptions, impairment losses could be realized infuture periods.
At December 31, 2014, the Company recordedimpairments for all inventory items recognized inthe allowance for excess and obsolete inventory.
Business Combinations
The Company allocates the fair value of purchaseconsideration to the assets acquired, liabilitiesassumed, and any non-controlling interests in theacquired entity generally based on their fair valuesat the acquisition date. The excess of the fair valueof purchase consideration over the fair value ofthese assets acquired, liabilities assumed and anynon-controlling interests in the acquired entity isrecorded as goodwill. The primary items thatgenerate goodwill include the value of the synergiesbetween the acquired company and Flotek and thevalue of the acquired assembled workforce.Acquisition-related expenses are recognizedseparately from the business acquisition and arerecognized as expenses as incurred.
The purchase price allocation process requires themanagement to make significant estimates andassumptions at the acquisition date with the respectto the fair value of:
‰ intangible assets acquired from the acquiree;‰ tax assets and liabilities assumed from the
acquiree;‰ stock awards assumed from the acquiree that
are included in the purchase price; and‰ pre-acquisition obligations and contingencies
assumed from the acquiree.
Although the Company believes the assumptionsand estimates it has made in the past have beenreasonable and appropriate, they are based in part orhistorical experience and information obtained fromthe management of the acquired companies and areinherently uncertain.
Goodwill
Goodwill is not subject to amortization, but is testedfor impairment annually during the fourth quarter,or more frequently if an event occurs orcircumstances change that would indicate apotential impairment. These circumstances mayinclude, but are not limited to, a significant adversechange in the business climate, unanticipatedcompetition, or a change in projected operations orresults of a reporting unit. Goodwill is tested for
37

impairment at a reporting unit level. AtDecember 31, 2014, only three reporting units,Energy Chemical Technologies, Consumer andIndustrial Chemical Technologies and DrillingTechnologies, have a goodwill balance.
During annual goodwill impairment testing in 2014,2013 and 2012, the Company first assessedqualitative factors to determine whether it wasnecessary to perform the two-step goodwillimpairment test that the Company has historicallyused. Based on its qualitative assessment, theCompany concluded that there was no indication ofthe need for an impairment of goodwill as of thefourth quarter of 2014, 2013 or 2012, and thereforeno further testing was required.
If impairment testing is required, the Company usesa two-step process. The first step is to compare theestimated fair value of each reporting unit whichhas goodwill to its carrying amount, includinggoodwill. To determine fair value estimates, theCompany uses the income approach based ondiscounted cash flow analyses, combined with amarket-based approach. The market-based approachconsiders valuation comparisons of recent publicsale transactions of similar businesses and earningsmultiples of publicly traded businesses operating inindustries consistent with the reporting unit. If thefair value of a reporting unit is less than its carryingvalue, the second step of the impairment test isperformed to determine the amount of impairment,if any. The second step compares the implied fairvalue of the reporting unit goodwill with thecarrying amount of the goodwill. If the carryingamount of the reporting unit’s goodwill exceeds itsimplied value, an impairment loss is recognized inan amount equal to that excess.
The Company determines fair value using widelyaccepted valuation techniques, including discountedcash flows and market multiples analyses, andthrough use of independent fixed asset valuationfirms, as appropriate. These types of analysescontain uncertainties as they require management tomake assumptions and to apply judgmentsregarding industry economic factors and theprofitability of future business strategies. TheCompany’s policy is to conduct impairment testingbased on current business strategies, taking intoconsideration current industry and economicconditions, as well as the Company’s future
expectations. Key assumptions used in thediscounted cash flow valuation model include,among others, discount rates, growth rates, cashflow projections and terminal value rates. Discountrates and cash flow projections are the mostsensitive and susceptible to change as they requiresignificant management judgment. Discount ratesare determined using a weighted average cost ofcapital (“WACC”). The WACC considers marketand industry data, as well as Company-specific riskfactors for each reporting unit in determining theappropriate discount rate to be used. The discountrate utilized for each reporting unit is indicative ofthe return an investor would expect to receive forinvesting in a similar business. Management usesindustry considerations and Company-specifichistorical and projected results to develop cash flowprojections for each reporting unit. Additionally, aspart of the market multiples approach, the Companyutilizes market data from publicly traded entitieswhose businesses operate in industries comparableto the Company’s reporting units, adjusted forcertain factors that increase comparability.
The Company cannot predict the occurrence ofevents or circumstances that could adversely affectthe fair value of goodwill. Such events may include,but are not limited to, deterioration of the economicenvironment, increases in the Company’s weightedaverage cost of capital, material negative changes inrelationships with significant customers, reductionsin valuations of other public companies in theCompany’s industry, or strategic decisions made inresponse to economic and competitive conditions. Ifactual results are not consistent with the Company’scurrent estimates and assumptions, impairment ofgoodwill could be required.
Long-Lived Assets Other than Goodwill
Long-lived assets other than goodwill consist ofproperty and equipment and intangible assets thathave determinable and indefinite lives. TheCompany makes judgments and estimates regardingthe carrying value of these assets, includingamounts to be capitalized, depreciation andamortization methods to be applied, estimateduseful lives and possible impairments. Property andequipment and intangible assets with determinablelives are tested for impairment whenever events orchanges in circumstances indicate the carryingvalue of the asset may not be recoverable.
38

For property and equipment, events orcircumstances indicating possible impairment mayinclude a significant decrease in market value or asignificant change in the business climate. Animpairment loss is recognized when the carryingamount of an asset exceeds the estimatedundiscounted future cash flows expected to resultfrom the use of the asset and its eventualdisposition. The amount of the impairment loss isthe excess of the asset’s carrying value over its fairvalue. Fair value is generally determined using anappraisal by an independent valuation firm or byusing a discounted cash flow analysis.
For intangible assets with definite lives, events orcircumstances indicating possible impairment mayinclude an adverse change in the extent or mannerin which the asset is being used or a change in theassessment of future operations. The Companyassesses the recoverability of the carrying amountby preparing estimates of future revenue, marginsand cash flows. If the sum of expected future cashflows (undiscounted and without interest charges) isless than the carrying amount, an impairment loss isrecognized. The impairment loss recognized is theamount by which the carrying amount exceeds thefair value. Fair value of these assets may bedetermined by a variety of methodologies,including discounted cash flows.
Intangible assets with indefinite lives are notsubject to amortization, but are tested forimpairment annually during the fourth quarter, ormore frequently if an event occurs or circumstanceschange that would indicate a potential impairment.These circumstances may include, but are notlimited to, a significant adverse change in thebusiness climate, unanticipated competition, or achange in projected operations or results of areporting unit.
In 2014, while testing annual indefinite livedintangible assets for impairment, the Company firstassessed qualitative factors to determine whether itwas necessary to perform the impairment test.Based on its qualitative assessment, the Companyconcluded that there was no indication of the needfor an impairment of indefinite lived intangibles asof the fourth quarter of 2014, and therefore nofurther testing was required.
If impairment testing for the indefinite livedintangible assets is required, the Company thenperforms the quantitative impairment test. Thequantitative impairment test for an indefinite-livedintangible asset consists of a comparison of the fairvalue of the asset with its carrying amount. If thecarrying amount of an intangible asset exceeds itsfair value, an impairment loss is recognized in anamount equal to that excess. Fair value of theseassets may be determined by a variety ofmethodologies, including discounted cash flows.
The development of future net undiscounted cashflow projections requires management projectionsof future sales and profitability trends and theestimation of remaining useful lives of assets. Theseprojections are consistent with those projections theCompany uses to internally manage operations.When potential impairment is identified, adiscounted cash flow valuation model similar tothat used to value goodwill at the reporting unitlevel, incorporating discount rates commensuratewith risks associated with each asset, is used todetermine the fair value of the asset in order tomeasure potential impairment. Discount rates aredetermined by using a WACC. Estimated revenueand WACC assumptions are the most sensitive andsusceptible to change in the long-lived assetanalysis as they require significant managementjudgment. The Company believes the assumptionsused are reflective of what a market participantwould have used in calculating fair value.
Valuation methodologies utilized to evaluate long-lived assets other than goodwill for impairmentwere consistent with prior periods. Specificassumptions discussed above are updated at eachtest date to consider current industry and Company-specific risk factors from the perspective of amarket participant. The current business climate issubject to evolving market conditions and requiressignificant management judgment to interpret thepotential impact to the Company’s assumptions. Tothe extent that changes in the current businessclimate result in adjustments to managementprojections, impairment losses may be recognizedin future periods.
No impairment was recorded for property andequipment and intangible assets with indefinite ordeterminable lives during 2014, 2013 and 2012.
39

Warrant Liability
Prior to June 2012, the Company used the Black-Scholes option-pricing model to estimate the fairvalue of its warrant liability. On June 14, 2012,provisions in the Company’s outstanding warrantswere amended to eliminate anti-dilution priceadjustment provisions as well as cash settlementprovisions of a change of control event. Uponamendment the warrants met the requirements forclassification as equity. All fluctuations in the fairvalue of the warrant liability prior to June 2012were recognized as non-cash income or expenseitems within the Statement of Operations. Historicalnon-cash fair value accounting methodology for thewarrant liability is no longer required due to thecontractual amendment.
Fair Value Measurements
Fair value is defined as the amount that would bereceived for the sale of an asset or paid for thetransfer of a liability in an orderly transactionbetween unrelated third party market participants atthe measurement date. In determination of fairvalue measurements for assets and liabilities theCompany considers the principal, or mostadvantageous market, and assumptions that marketparticipants would use when pricing the asset orliability. The Company categorizes financial assetsand liabilities using a three-tiered fair valuehierarchy, based upon the nature of the inputs usedin the determination of fair value. Inputs referbroadly to the assumptions that market participantswould use in pricing an asset or liability and may beobservable or unobservable. Significant judgmentsand estimates are required, particularly when inputsare based on pricing for similar assets or liabilities,pricing in non-active markets or when unobservableinputs are required.
Income Taxes
The Company’s tax provision is subject tojudgments and estimates necessitated by thecomplexity of existing regulatory tax statutes andthe effect of these upon the Company due tooperations in multiple tax jurisdictions. Income taxexpense is based on taxable income, statutory taxrates and tax planning opportunities available in thevarious jurisdictions in which the Companyoperates. The Company’s income tax expense will
fluctuate from year to year as the amount of pretaxincome fluctuates. Changes in tax laws, and theCompany’s profitability within and across thejurisdictions may impact the Company’s taxliability. While the annual tax provision is based onthe best information available to the Company atthe time of preparation, several years may elapsebefore the ultimate tax liabilities are determined.
The Company uses the liability method inaccounting for income taxes. Deferred tax assetsand liabilities are recognized for temporarydifferences between financial statement carryingamounts and the tax bases of assets and liabilities,and are measured using the tax rates expected to bein effect when the differences reverse. Deferred taxassets are also recognized for operating loss and taxcredit carry forwards. The effect on deferred taxassets and liabilities of a change in tax rates isrecognized in the results of operations in the periodthat includes the enactment date. A valuationallowance is used to reduce deferred tax assetswhen uncertainty exists regarding their realization.
A valuation allowance is recorded to reducepreviously recorded tax assets when it becomesmore-likely-than-not such assets will not berealized. The Company evaluates, at least annually,net operating loss carry forwards and other netdeferred tax assets and considers all availableevidence, both positive and negative, to determinewhether, a valuation allowance is necessary relativeto net operating loss carry forwards and other netdeferred tax assets. In making this determination,the Company considers cumulative losses in recentyears as significant negative evidence. TheCompany considers recent years to mean thecurrent year plus the two preceding years. TheCompany considers the recent cumulative incomeor loss position of its filings groups as objectivelyverifiable evidence for the projection of futureincome, which consists primarily of determining theaverage of the pre-tax income of the current andprior two years after adjusting for certain items notindicative of future performance. Based on thisanalysis, the Company determines whether avaluation allowance is necessary.
In 2009, general economic deterioration and, inparticular, a downturn in the oil and gas industryhad a negative impact on earnings. The Companyincurred losses and, during the three months ended
40

September 30, 2009, it violated certain debtcovenants. As a result, the Company disclosed thatit might not be able to continue as a going concernif it was unable to secure additional financing andsuccessfully implement corrective actions to remainlisted on the NYSE. The Company was unable toproject income from future events or theconsideration of tax planning strategies.Accordingly, at September 30, 2009, managementdetermined it was appropriate to record a fullvaluation allowance against its deferred tax assets.
The Company’s tax filing group with net operatingloss carryforwards continued to have operatinglosses during each quarter of 2010. Beginning withthe first quarter of 2011, this tax filing groupreturned to profitability. Profits continued duringeach subsequent quarter of 2011 and during eachquarter of 2012. As of December 31, 2012, this taxfiling group was no longer in a cumulative lossposition for the most recent 12-quarter period. Thecalculated average annual income for this 12-quarter period, adjusted for a nonrecurringimpairment of fixed assets in 2010, was $3 million.The calculated average annual income wasprojected for future years in the loss carryforwardperiod. This projection of income and reversingtemporary differences demonstrated that the netoperating loss would be fully utilized during thecarryforward period.
The Company weighed the negative evidence of theexistence of a recent cumulative loss more heavilythan the positive evidence of a return to profitabilityduring 2011 and 2012. Not being in a cumulativeloss position as of December 31, 2012 removed thesignificant negative evidence. In addition, the taxfiling group now had eight consecutive quarters ofprofitability, and projections of income based onobjectively verifiable positive evidence providedadditional positive evidence. The Company alsoconsidered other factors, including a determinationthat there were no unsettled circumstances that, ifunfavorably resolved, would adversely affect futureoperations or profit levels in future years and thefact that the Company does not operate in atraditionally cyclical business. Based on the weightof the above positive evidence and a lack ofnegative evidence, the Company removed thevaluation allowance for deferred tax assets of $16.5million at December 31, 2012 and recognized areduction of deferred federal income tax expense.
The tax filing group was in a cumulative lossposition for the most recent 12-quarter periodsended on March 31, June 30 and September 30,2012.
The Company periodically identifies and evaluatesuncertain tax positions. This process considers theamounts and probability of various outcomes thatcould be realized upon final settlement. Liabilitiesfor uncertain tax positions are based on a two-stepprocess. The actual benefits ultimately realized maydiffer from the Company’s estimates. Changes infacts, circumstances, and new information mayrequire a change in recognition and measurementestimates for certain individual tax positions. Anychanges in estimates are recorded in results ofoperations in the period in which the change occurs.At December 31, 2014, the Company performed anevaluation of its various tax positions andconcluded that it did not have significant uncertaintax positions requiring disclosure. The Company’spolicy is to record interest and penalties related toincome tax matters as income tax expense.
Share-Based Compensation
The Company has stock-based incentive planswhich are authorized to issue stock options,restricted stock and other incentive awards. Stock-based compensation expense for stock options andrestricted stock is determined based upon estimatedgrant-date fair value. This fair value for the stockoptions is calculated using the Black-Scholesoption-pricing model and is recognized as expenseover the requisite service period. The option-pricingmodel requires the input of highly subjectiveassumptions, including expected stock pricevolatility and expected option life. For all stock-based incentive plans, the Company estimates anexpected forfeiture rate and recognizes expenseonly for those shares expected to vest. Theestimated forfeiture rate is based on historicalexperience. To the extent actual forfeiture ratesdiffer from the estimate, stock-based compensationexpense is adjusted accordingly.
Loss Contingencies
The Company is subject to a variety of losscontingencies that could arise during theCompany’s conduct of business. Managementconsiders the likelihood of a loss or the impairment
41

of an asset or the incurrence of a liability, as well asthe Company’s ability to reasonably estimate theamount of loss in determining potential losscontingencies. An estimated loss contingency isaccrued when it is probable that a liability has beenincurred or an asset has been impaired and theamount of loss can be reasonably estimated.Accruals for loss contingencies have not beenrecorded during the past three years. The Companyregularly evaluates current information available todetermine whether such accruals should be made oradjusted.
Recent Accounting Pronouncements
Recent accounting pronouncements which mayimpact the Company are described in Part II,Item 8. — “Financial Statements andSupplementary Data,” Note 2 — Summary ofSignificant Accounting Policies in Notes toConsolidated Financial Statements.
Item 7A. Quantitative and QualitativeDisclosures About Market Risk.
The Company is exposed to market risk fromchanges in interest rates, and to a limited extent,commodity prices and foreign currency exchangerates. Market risk is measured as the potentialnegative impact on earnings, cash flows or fairvalues resulting from a hypothetical change ininterest rates, commodity prices or foreign currencyexchange rates over the next year. The Companymanages exposure to market risks at the corporatelevel. The portfolio of interest-sensitive assets andliabilities is monitored and adjusted to provideliquidity necessary to satisfy anticipated short-termneeds. The Company’s risk management policiesallow the use of specified financial instruments forhedging purposes only. Speculation on interest ratesor foreign currency rates is not permitted. TheCompany does not consider any of these riskmanagement activities to be material.
Interest Rate Risk
The Company is exposed to the impact of interestrate changes on any outstanding indebtedness underthe revolving credit facility agreement and the termloan agreement both of which have a variableinterest rate. The interest rate on advances under therevolving credit facility varies based on the level of
borrowing under the revolving credit facility. Ratesrange (a) between PNC Bank’s base lending rateplus 0.5% to 1.0% or (b) between the LondonInterbank Offered Rate (LIBOR) plus 1.5% to2.0%. PNC Bank’s base lending rate was 3.25% atDecember 31, 2014 and would have permittedborrowing at rates ranging between 3.75% and4.25%. The Company is required to pay a monthlyfacility fee of 0.25% on any unused amount underthe commitment based on daily averages. AtDecember 31, 2014, $8.5 million was outstandingunder the revolving credit facility as base rate loansat an interest rate of 3.75%.
The Company increased borrowing to $50.0 millionunder the term loan on May 10, 2013. Monthlyprincipal payments of $0.6 million are required.The unpaid balance of the term loan is due May 10,2018. The interest rate on the term loan varies basedon the level of borrowing under the revolving creditfacility. Rates range (a) between PNC Bank’s baselending rate plus 1.25% to 1.75% or (b) between theLondon Interbank Offered Rate (LIBOR) plus2.25% to 2.75%. At December 31, 2014, $35.5million was outstanding under the term loan, with$0.5 million borrowed as base rate loans at aninterest rate of 4.50% and $35.0 million borrowedas LIBOR loans at an interest rate of 2.41%.
Foreign Currency Exchange Risk
The Company presently has limited exposure toforeign currency risk. During 2014, less than 1% ofrevenue was demarcated in non-US dollarcurrencies, and virtually all assets and liabilities ofthe Company are denominated in US dollars.However, as the Company expands its internationaloperations, non-US denominated activity is likely toincrease. The Company has historically performedno swaps and no foreign currency hedges. TheCompany may utilize swaps or foreign currencyhedges in the future.
Commodity Risk
The Company is one of the largest processors ofcitrus oils in the world, and therefore has acommodity risk inherent in orange harvests. Inrecent years, citrus greening has disrupted citrusfruit production in Florida and Brazil which causedraw material feedstock cost to increase. TheCompany believes that adequate global supply isavailable to meet the Company’s needs and the
42

needs of general chemistry markets at this time. TheCompany relies upon diverse, long-term strategicsupply relationships to meet its raw material needswhich are expected to remain in place for theforeseeable future. Price increases have been passedalong to the Company’s customers. The Companypresently does not have any futures contracts and itdoes not plan to utilize these in the foreseeablefuture.
43
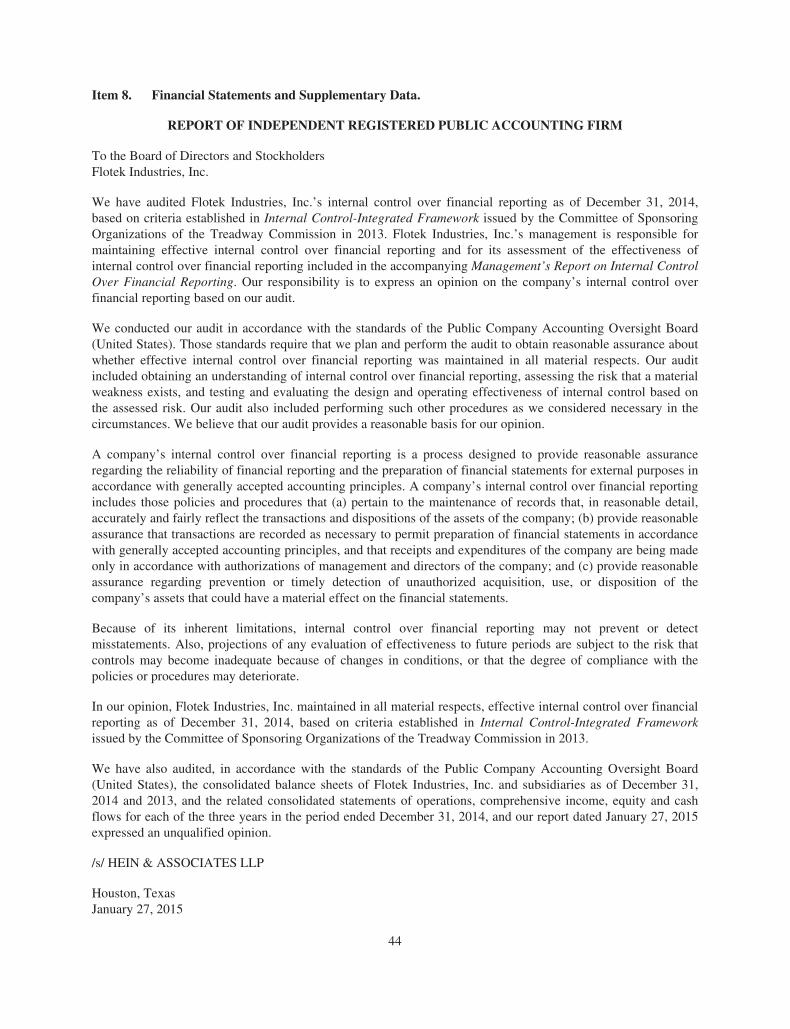
Item 8. Financial Statements and Supplementary Data.
REPORT OF INDEPENDENT REGISTERED PUBLIC ACCOUNTING FIRM
To the Board of Directors and StockholdersFlotek Industries, Inc.
We have audited Flotek Industries, Inc.’s internal control over financial reporting as of December 31, 2014,based on criteria established in Internal Control-Integrated Framework issued by the Committee of SponsoringOrganizations of the Treadway Commission in 2013. Flotek Industries, Inc.’s management is responsible formaintaining effective internal control over financial reporting and for its assessment of the effectiveness ofinternal control over financial reporting included in the accompanying Management’s Report on Internal ControlOver Financial Reporting. Our responsibility is to express an opinion on the company’s internal control overfinancial reporting based on our audit.
We conducted our audit in accordance with the standards of the Public Company Accounting Oversight Board(United States). Those standards require that we plan and perform the audit to obtain reasonable assurance aboutwhether effective internal control over financial reporting was maintained in all material respects. Our auditincluded obtaining an understanding of internal control over financial reporting, assessing the risk that a materialweakness exists, and testing and evaluating the design and operating effectiveness of internal control based onthe assessed risk. Our audit also included performing such other procedures as we considered necessary in thecircumstances. We believe that our audit provides a reasonable basis for our opinion.
A company’s internal control over financial reporting is a process designed to provide reasonable assuranceregarding the reliability of financial reporting and the preparation of financial statements for external purposes inaccordance with generally accepted accounting principles. A company’s internal control over financial reportingincludes those policies and procedures that (a) pertain to the maintenance of records that, in reasonable detail,accurately and fairly reflect the transactions and dispositions of the assets of the company; (b) provide reasonableassurance that transactions are recorded as necessary to permit preparation of financial statements in accordancewith generally accepted accounting principles, and that receipts and expenditures of the company are being madeonly in accordance with authorizations of management and directors of the company; and (c) provide reasonableassurance regarding prevention or timely detection of unauthorized acquisition, use, or disposition of thecompany’s assets that could have a material effect on the financial statements.
Because of its inherent limitations, internal control over financial reporting may not prevent or detectmisstatements. Also, projections of any evaluation of effectiveness to future periods are subject to the risk thatcontrols may become inadequate because of changes in conditions, or that the degree of compliance with thepolicies or procedures may deteriorate.
In our opinion, Flotek Industries, Inc. maintained in all material respects, effective internal control over financialreporting as of December 31, 2014, based on criteria established in Internal Control-Integrated Frameworkissued by the Committee of Sponsoring Organizations of the Treadway Commission in 2013.
We have also audited, in accordance with the standards of the Public Company Accounting Oversight Board(United States), the consolidated balance sheets of Flotek Industries, Inc. and subsidiaries as of December 31,2014 and 2013, and the related consolidated statements of operations, comprehensive income, equity and cashflows for each of the three years in the period ended December 31, 2014, and our report dated January 27, 2015expressed an unqualified opinion.
/s/ HEIN & ASSOCIATES LLP
Houston, TexasJanuary 27, 2015
44

REPORT OF INDEPENDENT REGISTERED PUBLIC ACCOUNTING FIRM
To the Board of Directors and StockholdersFlotek Industries, Inc.
We have audited the accompanying consolidated balance sheets of Flotek Industries, Inc. and subsidiaries as ofDecember 31, 2014 and 2013, and the related consolidated statements of operations, comprehensive income,equity and cash flows for each of the three years in the period ended December 31, 2014. These financialstatements are the responsibility of the company’s management. Our responsibility is to express an opinion onthese financial statements based on our audits.
We conducted our audits in accordance with the standards of the Public Company Accounting Oversight Board(United States). Those standards require that we plan and perform the audit to obtain reasonable assurance aboutwhether the financial statements are free of material misstatement. An audit includes examining, on a test basis,evidence supporting the amounts and disclosures in the financial statements. An audit also includes assessing theaccounting principles used and significant estimates made by management, as well as evaluating the overallfinancial statement presentation. We believe that our audits provide a reasonable basis for our opinion.
In our opinion, the consolidated financial statements referred to above present fairly, in all material respects, thefinancial position of Flotek Industries, Inc. and subsidiaries as of December 31, 2014 and 2013, and the results oftheir operations and their cash flows for each of the three years in the period ended December 31, 2014, inconformity with U.S. generally accepted accounting principles.
We have also audited, in accordance with the standards of the Public Company Accounting Oversight Board(United States), Flotek Industries, Inc. and subsidiaries’ internal control over financial reporting as ofDecember 31, 2014, based on criteria established in Internal Control-Integrated Framework issued by theCommittee of Sponsoring Organizations of the Treadway Commission in 2013, and our report dated January 27,2015 expressed an unqualified opinion on the effectiveness of Flotek Industries, Inc.’s internal control overfinancial reporting.
/s/ HEIN & ASSOCIATES LLP
Houston, TexasJanuary 27, 2015
45

FLOTEK INDUSTRIES, INC.CONSOLIDATED BALANCE SHEETS
(in thousands, except share data)December 31,
2014 2013
ASSETSCurrent assets:
Cash and cash equivalents $ 1,266 $ 2,730Accounts receivable, net of allowance for doubtful accounts of $847 and
$872 at December 31, 2014 and 2013, respectively 78,624 65,016Inventories, net 85,958 63,132Deferred tax assets, net 2,696 2,522Other current assets 11,055 4,261
Total current assets 179,599 137,661Property and equipment, net 86,111 79,114Goodwill 71,131 66,271Deferred tax assets, net 12,907 15,012Other intangible assets, net 73,528 77,523
TOTAL ASSETS $ 423,276 $ 375,581
LIABILITIES AND EQUITYCurrent liabilities:
Accounts payable $ 33,185 $ 19,899Accrued liabilities 12,314 12,778Income taxes payable 1,307 3,361Interest payable 93 111Current portion of long-term debt 18,643 26,415
Total current liabilities 65,542 62,564Long-term debt, less current portion 25,398 35,690Deferred tax liabilities, net 25,982 27,575
Total liabilities 116,922 125,829
Commitments and contingenciesEquity:
Cumulative convertible preferred stock, $0.0001 par value, 100,000 sharesauthorized; no shares issued and outstanding - -
Common stock, $0.0001 par value, 80,000,000 shares authorized; 54,633,726shares issued and 53,357,811 shares outstanding at December 31, 2014;58,265,911 shares issued and 51,804,078 shares outstanding atDecember 31, 2013 5 6
Additional paid-in capital 254,233 266,122Accumulated other comprehensive income (loss) (502) (359)Retained earnings (accumulated deficit) 52,762 (841)Treasury stock, at cost; 449,397 and 5,394,178 shares at December 31, 2014
and 2013, respectively (495) (15,176)
Flotek Industries, Inc. stockholders’ equity 306,003 249,752Noncontrolling interests 351 -
Total equity 306,354 249,752
TOTAL LIABILITIES AND EQUITY $ 423,276 $ 375,581
See accompanying Notes to Consolidated Financial Statements.
46
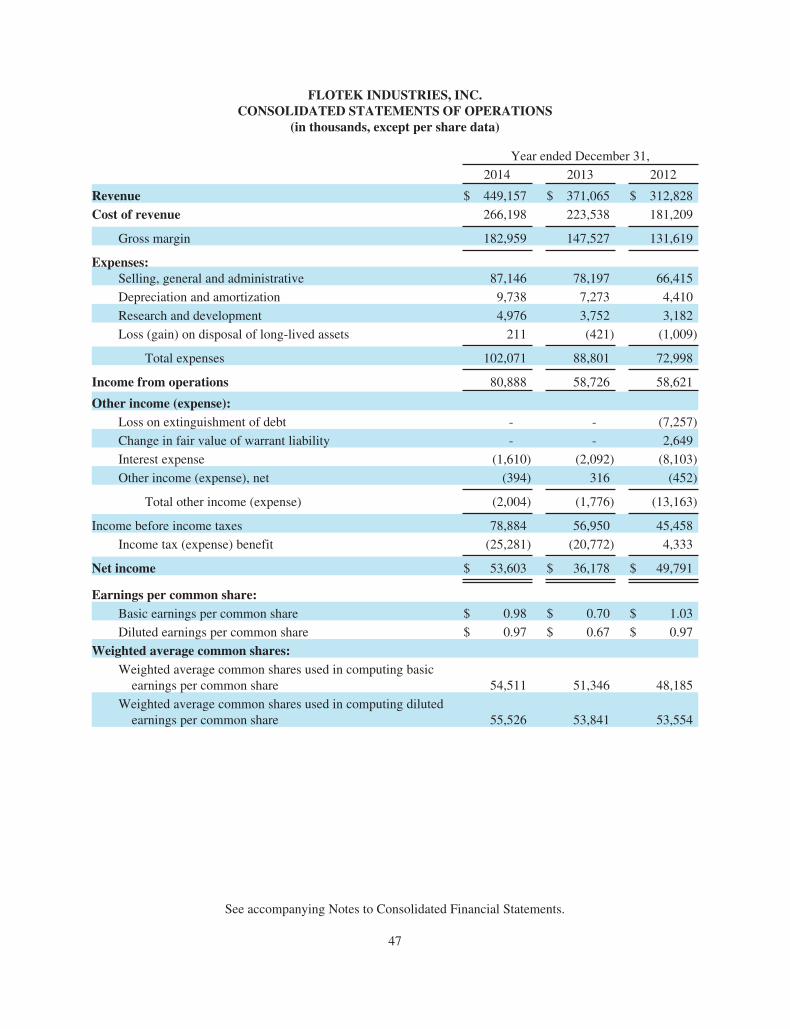
FLOTEK INDUSTRIES, INC.CONSOLIDATED STATEMENTS OF OPERATIONS
(in thousands, except per share data)
Year ended December 31,
2014 2013 2012
Revenue $ 449,157 $ 371,065 $ 312,828
Cost of revenue 266,198 223,538 181,209
Gross margin 182,959 147,527 131,619
Expenses:Selling, general and administrative 87,146 78,197 66,415
Depreciation and amortization 9,738 7,273 4,410
Research and development 4,976 3,752 3,182
Loss (gain) on disposal of long-lived assets 211 (421) (1,009)
Total expenses 102,071 88,801 72,998
Income from operations 80,888 58,726 58,621
Other income (expense):Loss on extinguishment of debt - - (7,257)
Change in fair value of warrant liability - - 2,649
Interest expense (1,610) (2,092) (8,103)
Other income (expense), net (394) 316 (452)
Total other income (expense) (2,004) (1,776) (13,163)
Income before income taxes 78,884 56,950 45,458
Income tax (expense) benefit (25,281) (20,772) 4,333
Net income $ 53,603 $ 36,178 $ 49,791
Earnings per common share:Basic earnings per common share $ 0.98 $ 0.70 $ 1.03
Diluted earnings per common share $ 0.97 $ 0.67 $ 0.97
Weighted average common shares:Weighted average common shares used in computing basic
earnings per common share 54,511 51,346 48,185
Weighted average common shares used in computing dilutedearnings per common share 55,526 53,841 53,554
See accompanying Notes to Consolidated Financial Statements.
47
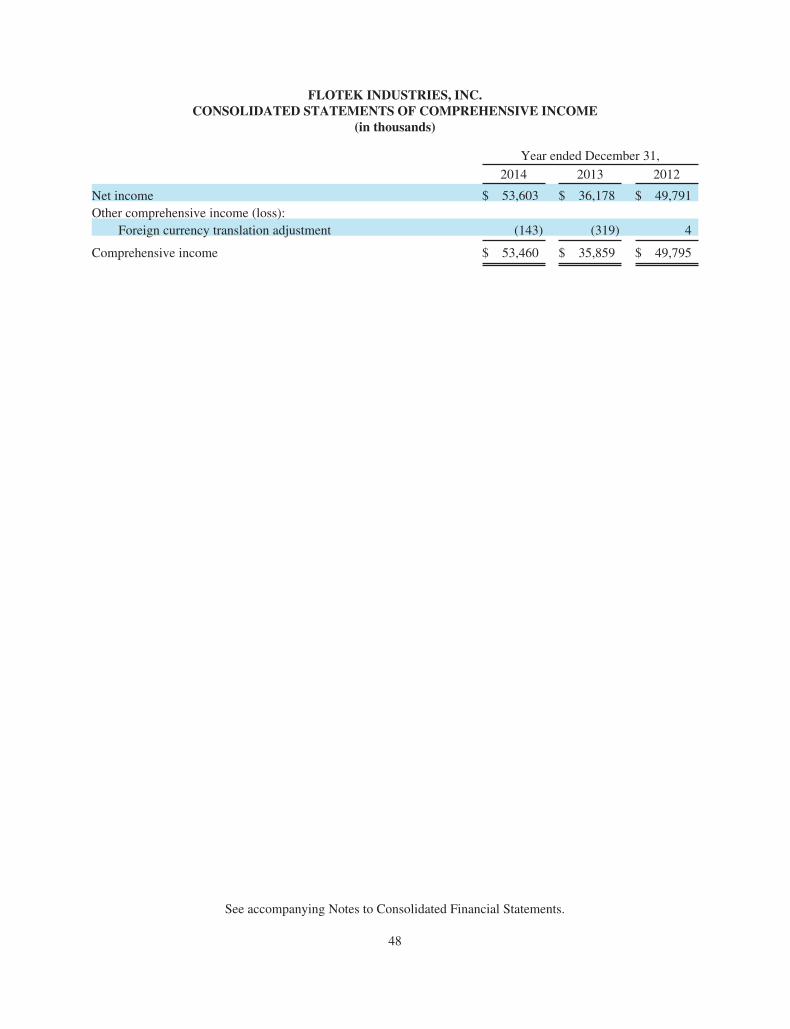
FLOTEK INDUSTRIES, INC.CONSOLIDATED STATEMENTS OF COMPREHENSIVE INCOME
(in thousands)
Year ended December 31,
2014 2013 2012
Net income $ 53,603 $ 36,178 $ 49,791Other comprehensive income (loss):
Foreign currency translation adjustment (143) (319) 4
Comprehensive income $ 53,460 $ 35,859 $ 49,795
See accompanying Notes to Consolidated Financial Statements.
48
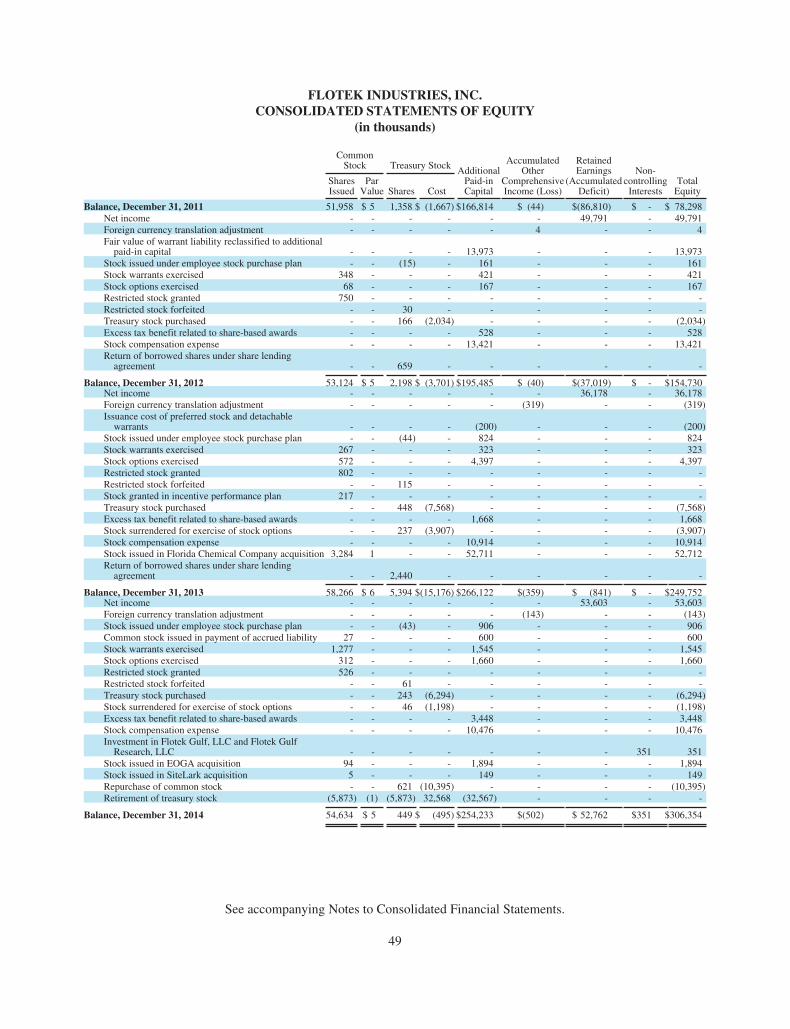
FLOTEK INDUSTRIES, INC.CONSOLIDATED STATEMENTS OF EQUITY
(in thousands)
CommonStock Treasury Stock Additional
Paid-inCapital
AccumulatedOther
ComprehensiveIncome (Loss)
RetainedEarnings
(AccumulatedDeficit)
Non-controllingInterests
TotalEquity
SharesIssued
ParValue Shares Cost
Balance, December 31, 2011 51,958 $ 5 1,358 $ (1,667) $166,814 $ (44) $(86,810) $ - $ 78,298Net income - - - - - - 49,791 - 49,791Foreign currency translation adjustment - - - - - 4 - - 4Fair value of warrant liability reclassified to additional
paid-in capital - - - - 13,973 - - - 13,973Stock issued under employee stock purchase plan - - (15) - 161 - - - 161Stock warrants exercised 348 - - - 421 - - - 421Stock options exercised 68 - - - 167 - - - 167Restricted stock granted 750 - - - - - - - -Restricted stock forfeited - - 30 - - - - - -Treasury stock purchased - - 166 (2,034) - - - - (2,034)Excess tax benefit related to share-based awards - - - - 528 - - - 528Stock compensation expense - - - - 13,421 - - - 13,421Return of borrowed shares under share lending
agreement - - 659 - - - - - -
Balance, December 31, 2012 53,124 $ 5 2,198 $ (3,701) $195,485 $ (40) $(37,019) $ - $154,730Net income - - - - - - 36,178 - 36,178Foreign currency translation adjustment - - - - - (319) - - (319)Issuance cost of preferred stock and detachable
warrants - - - - (200) - - - (200)Stock issued under employee stock purchase plan - - (44) - 824 - - - 824Stock warrants exercised 267 - - - 323 - - - 323Stock options exercised 572 - - - 4,397 - - - 4,397Restricted stock granted 802 - - - - - - - -Restricted stock forfeited - - 115 - - - - - -Stock granted in incentive performance plan 217 - - - - - - - -Treasury stock purchased - - 448 (7,568) - - - - (7,568)Excess tax benefit related to share-based awards - - - - 1,668 - - - 1,668Stock surrendered for exercise of stock options - - 237 (3,907) - - - - (3,907)Stock compensation expense - - - - 10,914 - - - 10,914Stock issued in Florida Chemical Company acquisition 3,284 1 - - 52,711 - - - 52,712Return of borrowed shares under share lending
agreement - - 2,440 - - - - - -
Balance, December 31, 2013 58,266 $ 6 5,394 $(15,176) $266,122 $(359) $ (841) $ - $249,752Net income - - - - - - 53,603 - 53,603Foreign currency translation adjustment - - - - - (143) - - (143)Stock issued under employee stock purchase plan - - (43) - 906 - - - 906Common stock issued in payment of accrued liability 27 - - - 600 - - - 600Stock warrants exercised 1,277 - - - 1,545 - - - 1,545Stock options exercised 312 - - - 1,660 - - - 1,660Restricted stock granted 526 - - - - - - - -Restricted stock forfeited - - 61 - - - - - -Treasury stock purchased - - 243 (6,294) - - - - (6,294)Stock surrendered for exercise of stock options - - 46 (1,198) - - - - (1,198)Excess tax benefit related to share-based awards - - - - 3,448 - - - 3,448Stock compensation expense - - - - 10,476 - - - 10,476Investment in Flotek Gulf, LLC and Flotek Gulf
Research, LLC - - - - - - - 351 351Stock issued in EOGA acquisition 94 - - - 1,894 - - - 1,894Stock issued in SiteLark acquisition 5 - - - 149 - - - 149Repurchase of common stock - - 621 (10,395) - - - - (10,395)Retirement of treasury stock (5,873) (1) (5,873) 32,568 (32,567) - - - -
Balance, December 31, 2014 54,634 $ 5 449 $ (495) $254,233 $(502) $ 52,762 $351 $306,354
See accompanying Notes to Consolidated Financial Statements.
49

FLOTEK INDUSTRIES, INC.CONSOLIDATED STATEMENTS OF CASH FLOWS
(in thousands)
Year ended December 31,
2014 2013 2012Cash flows from operating activities:
Net income $ 53,603 $ 36,178 $ 49,791Adjustments to reconcile net income to net cash provided by
operating activities:Change in fair value of warrant liability - - (2,649)Depreciation and amortization 17,848 15,109 11,583Amortization of deferred financing costs 343 169 946Accretion of debt discount - 55 3,710Provision for doubtful accounts 481 570 512Provision for inventory reserves and market adjustments 358 1,330 2,079Gain on sale of assets (3,407) (4,565) (4,819)Stock compensation expense 10,476 10,914 13,421Deferred income tax provision (benefit) 1,502 793 (18,746)Excess in tax benefit related to share-based awards (3,448) (1,668) (528)Non-cash loss on extinguishment of debt - - 4,841Changes in current assets and liabilities:
Restricted cash - 150 -Accounts receivable (13,749) (9,862) 1,796Inventories (23,096) 4,523 (9,368)Other current assets (6,388) 936 (2,073)Accounts payable 13,147 (21,326) 2,527Accrued liabilities (224) 4,053 (1,894)Income taxes payable 1,394 2,194 369Interest payable (18) (5) (1,983)
Net cash provided by operating activities 48,822 39,548 49,515
Cash flows from investing activities:Capital expenditures (19,907) (15,007) (20,701)Proceeds from sale of assets 4,639 5,788 5,521Payments for acquisitions, net of cash acquired (5,704) (53,396) -Purchase of patents and other intangible assets (731) (85) (20)
Net cash used in investing activities (21,703) (62,700) (15,200)
Cash flows from financing activities:Repayments of indebtedness (10,292) (13,206) (102,438)Proceeds from borrowings - 26,190 25,000Borrowings on revolving credit facility 357,183 313,396 -Repayments on revolving credit facility (364,955) (297,124) -Debt issuance costs (399) (1,293) (106)Issuance costs of preferred stock and detachable warrants - (200) -Excess tax benefit related to share-based awards 3,448 1,668 528Purchase of treasury stock (6,294) (7,568) (2,034)Proceeds from sale of common stock 906 824 161Repurchase of common stock (10,395) - -Proceeds from exercise of stock options 462 491 167Proceeds from exercise of warrants 1,545 323 421Proceeds from noncontrolling interest 351 - -
Net cash (used in) provided by financing activities (28,440) 23,501 (78,301)
Effect of changes in exchange rates on cash and cash equivalents (143) (319) 4
Net (decrease) increase in cash and cash equivalents (1,464) 30 (43,982)Cash and cash equivalents at beginning of year 2,730 2,700 46,682
Cash and cash equivalents at end of year $ 1,266 $ 2,730 $ 2,700
See accompanying Notes to Consolidated Financial Statements.
50
FLOTEK INDUSTRIES, INC.NOTES TO CONSOLIDATED FINANCIAL STATEMENTS
Note 1 — Organization and Nature of Operations
Flotek Industries, Inc. (“Flotek” or the “Company”)is a global, diversified, technology-driven supplier ofenergy chemicals and consumer and industrialchemicals and is a global developer and supplier ofdrilling, completion and production technologies andrelated services.
Flotek’s strategic focus, and that of its diversifiedsubsidiaries (collectively referred to as the“Company”), includes energy related chemicaltechnologies, drilling and production technologies,and consumer and industrial chemical technologies.Within energy technologies, the Company providesoilfield specialty chemicals and logistics, down-holedrilling tools and production related tools used in theenergy and mining industries. Flotek’s products andservices enable customers to drill wells moreefficiently, to realize increased production from bothnew and existing wells and to decrease future welloperating costs. Major customers include leadingoilfield service providers, pressure-pumping servicecompanies, onshore and offshore drilling contractors,
and major and independent oil and gas explorationand production companies. Within consumer andindustrial chemical technologies, the Companyprovides products for the flavor and fragranceindustry and the industrial chemical industry. Majorcustomers include food and beverage companies,fragrance companies, and companies providinghousehold and industrial cleaning products.
The Company is headquartered in Houston, Texas,with operating locations in Colorado, Florida,Louisiana, New Mexico, North Dakota, Oklahoma,Pennsylvania, Texas, Utah, Wyoming, Canada, theNetherlands and the Middle East. Flotek’s productsare marketed both domestically and internationally,with international presence and/or initiatives in over20 countries.
Flotek was initially incorporated under the laws ofthe Province of British Columbia on May 17, 1985.On October 23, 2001, Flotek changed its corporatedomicile to the state of Delaware.
Note 2 — Summary of Significant AccountingPolicies
Basis of Presentation
The Company’s consolidated financial statementshave been prepared in accordance with theaccounting principles generally accepted in theUnited States of America (“GAAP”).
The consolidated financial statements include theaccounts of Flotek Industries, Inc. and all wholly-owned subsidiary corporations. Where Flotek ownsless than 100% of the share capital of its subsidiaries,but is still considered to have sufficient ownership tocontrol the business, results of the businessoperations are consolidated within the Company’sfinancial statements. The ownership interests held byother parties are shown as noncontrolling interests.
All significant intercompany accounts andtransactions have been eliminated in consolidation.The Company does not have investments in anyunconsolidated subsidiaries.
Cash Equivalents
Cash equivalents consist of highly liquid investmentswith maturities of three months or less at the date ofpurchase.
Cash Management
The Company uses a controlled disbursementaccount for its main cash account. Under this system,outstanding checks can be in excess of the cashbalances at the bank before the disbursement accountis funded, creating a book overdraft. Book overdraftson this account are presented as a current liability inaccounts payable in the consolidated balance sheets.
Accounts Receivable and Allowance for DoubtfulAccounts
Accounts receivable arise from product sales, productrentals and services and are stated at estimated netrealizable value. This value incorporates anallowance for doubtful accounts to reflect any lossanticipated on accounts receivable balances. TheCompany regularly evaluates its accounts receivable
51
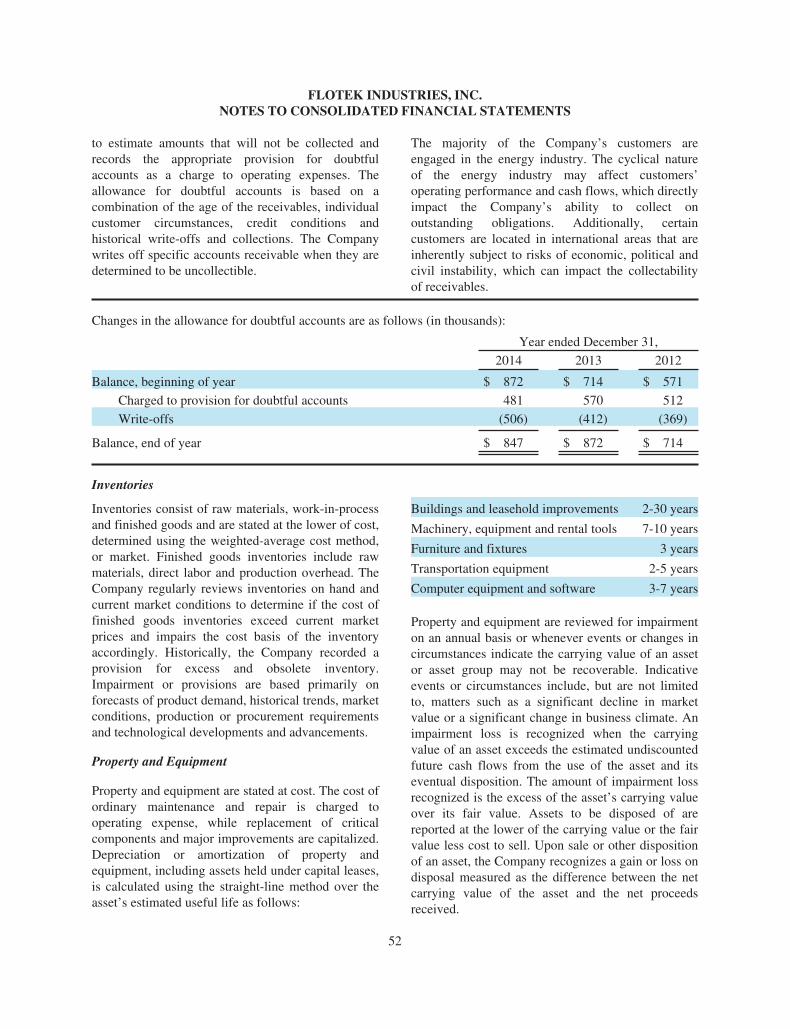
FLOTEK INDUSTRIES, INC.NOTES TO CONSOLIDATED FINANCIAL STATEMENTS
to estimate amounts that will not be collected andrecords the appropriate provision for doubtfulaccounts as a charge to operating expenses. Theallowance for doubtful accounts is based on acombination of the age of the receivables, individualcustomer circumstances, credit conditions andhistorical write-offs and collections. The Companywrites off specific accounts receivable when they aredetermined to be uncollectible.
The majority of the Company’s customers areengaged in the energy industry. The cyclical natureof the energy industry may affect customers’operating performance and cash flows, which directlyimpact the Company’s ability to collect onoutstanding obligations. Additionally, certaincustomers are located in international areas that areinherently subject to risks of economic, political andcivil instability, which can impact the collectabilityof receivables.
Changes in the allowance for doubtful accounts are as follows (in thousands):
Year ended December 31,
2014 2013 2012
Balance, beginning of year $ 872 $ 714 $ 571
Charged to provision for doubtful accounts 481 570 512
Write-offs (506) (412) (369)
Balance, end of year $ 847 $ 872 $ 714
Inventories
Inventories consist of raw materials, work-in-processand finished goods and are stated at the lower of cost,determined using the weighted-average cost method,or market. Finished goods inventories include rawmaterials, direct labor and production overhead. TheCompany regularly reviews inventories on hand andcurrent market conditions to determine if the cost offinished goods inventories exceed current marketprices and impairs the cost basis of the inventoryaccordingly. Historically, the Company recorded aprovision for excess and obsolete inventory.Impairment or provisions are based primarily onforecasts of product demand, historical trends, marketconditions, production or procurement requirementsand technological developments and advancements.
Property and Equipment
Property and equipment are stated at cost. The cost ofordinary maintenance and repair is charged tooperating expense, while replacement of criticalcomponents and major improvements are capitalized.Depreciation or amortization of property andequipment, including assets held under capital leases,is calculated using the straight-line method over theasset’s estimated useful life as follows:
Buildings and leasehold improvements 2-30 years
Machinery, equipment and rental tools 7-10 years
Furniture and fixtures 3 years
Transportation equipment 2-5 years
Computer equipment and software 3-7 years
Property and equipment are reviewed for impairmenton an annual basis or whenever events or changes incircumstances indicate the carrying value of an assetor asset group may not be recoverable. Indicativeevents or circumstances include, but are not limitedto, matters such as a significant decline in marketvalue or a significant change in business climate. Animpairment loss is recognized when the carryingvalue of an asset exceeds the estimated undiscountedfuture cash flows from the use of the asset and itseventual disposition. The amount of impairment lossrecognized is the excess of the asset’s carrying valueover its fair value. Assets to be disposed of arereported at the lower of the carrying value or the fairvalue less cost to sell. Upon sale or other dispositionof an asset, the Company recognizes a gain or loss ondisposal measured as the difference between the netcarrying value of the asset and the net proceedsreceived.
52

FLOTEK INDUSTRIES, INC.NOTES TO CONSOLIDATED FINANCIAL STATEMENTS
Internal Use Computer Software Costs
Direct costs incurred to purchase and developcomputer software for internal use are capitalizedduring the application development andimplementation stages. These software costs havebeen for enterprise-level business and financesoftware that is customized to meet the Company’sspecific operational needs. Capitalized costs areincluded in property and equipment and areamortized on a straight-line basis over the estimateduseful life of the software beginning when thesoftware project is substantially complete and placedin service. Costs incurred during the preliminaryproject stage and costs for training, data conversionand maintenance are expensed as incurred.
The Company amortizes software costs using thestraight-line method over the expected life of thesoftware, generally 3 to 7 years. The unamortizedamount of capitalized software was $4.1 million atDecember 31, 2014.
Goodwill
Goodwill is the excess of cost of an acquired entityover the amounts assigned to identifiable assetsacquired and liabilities assumed in a businesscombination. Goodwill is not subject toamortization, but is tested for impairment annuallyduring the fourth quarter, or more frequently if anevent occurs or circumstances change that wouldindicate a potential impairment. Thesecircumstances may include an adverse change in thebusiness climate or a change in the assessment offuture operations of a reporting unit.
The Company assesses whether a goodwillimpairment exists using both qualitative andquantitative assessments. The qualitativeassessment involves determining whether events orcircumstances exist that indicate it is more likelythan not that the fair value of a reporting unit is lessthan its carrying amount, including goodwill. If,based on this qualitative assessment, it isdetermined that it is not more likely than not thatthe fair value of a reporting unit is less than itscarrying amount, the Company does not perform aquantitative assessment.
If the qualitative assessment indicates that it is morelikely than not that the fair value of a reporting unitis less than its carrying amount or if the Companyelects not to perform a qualitative assessment, aquantitative assessment or two-step impairment testis performed to determine whether goodwillimpairment exists at the reporting unit.
The first step is to compare the estimated fair valueof each reporting unit with goodwill to its carryingamount, including goodwill. To determine fairvalue estimates, the Company uses the incomeapproach based on discounted cash flow analyses,combined with a market-based approach. Themarket-based approach considers valuationcomparisons of recent public sale transactions ofsimilar businesses and earnings multiples ofpublicly traded businesses operating in industriesconsistent with the reporting unit. If the fair valueof a reporting unit is less than its carrying amount,the second step of the impairment test is performedto determine the amount of impairment loss, if any.The second step compares the implied fair value ofthe reporting unit goodwill with the carryingamount of that goodwill. If the carrying amount ofthe reporting unit’s goodwill exceeds its impliedfair value, an impairment loss is recognized in anamount equal to that excess.
Other Intangible Assets
The Company’s other intangible assets have finiteand indefinite lives and consist of customerrelationships, trademarks and brand names andpurchased patents.
The cost of intangible assets with finite lives isamortized using the straight-line method over theestimated period of economic benefit, ranging from2 to 20 years. Asset lives are adjusted wheneverthere is a change in the estimated period ofeconomic benefit. No residual value has beenassigned to these intangible assets.
Intangible assets with finite lives are tested forimpairment whenever events or changes incircumstances indicate the carrying value may not berecoverable. These conditions may include a changein the extent or manner in which the asset is being
53

FLOTEK INDUSTRIES, INC.NOTES TO CONSOLIDATED FINANCIAL STATEMENTS
used or a change in future operations. The Companyassesses the recoverability of the carrying amount bypreparing estimates of future revenue, margins andcash flows. If the sum of expected future cash flows(undiscounted and without interest charges) is lessthan the carrying amount, an impairment loss isrecognized. The impairment loss recognized is theamount by which the carrying amount exceeds thefair value. Fair value of these assets may bedetermined by a variety of methodologies, includingdiscounted cash flow models.
Intangible assets with indefinite lives are notsubject to amortization, but are tested forimpairment annually during the fourth quarter, ormore frequently if an event occurs or circumstanceschange that would indicate a potential impairment.These circumstances may include, but are notlimited to, a significant adverse change in thebusiness climate, unanticipated competition, or achange in projected operations or results of areporting unit.
The Company assesses whether an indefinite livedintangible impairment exists using both qualitativeand quantitative assessments. The qualitativeassessment involves determining whether events orcircumstances exist that indicate it is more likelythan not that the fair value of the indefinite livedintangible is less than its carrying amount. If, basedon this qualitative assessment, it is determined thatit is not more likely than not that the fair value ofthe indefinite lived intangible is less than itscarrying amount, the Company does not perform aquantitative assessment.
If the qualitative assessment indicates that it is morelikely than not that the indefinite-lived intangibleasset is impaired or if the Company elects to notperform a qualitative assessment, the Company thenperforms the quantitative impairment test. Thequantitative impairment test for an indefinite-livedintangible asset consists of a comparison of the fairvalue of the asset with its carrying amount. If thecarrying amount of an intangible asset exceeds itsfair value, an impairment loss is recognized in anamount equal to that excess. Fair value of theseassets may be determined by a variety ofmethodologies, including discounted cash flows.
Warrant Liability
Prior to June 2012, the Company used the Black-Scholes option-pricing model to estimate the fairvalue of its warrant liability. On June 14, 2012,provisions in the Company’s outstanding warrantswere amended to eliminate anti-dilution priceadjustment provisions and remove cash settlementprovisions in the event of a change of control. Uponamendment, the warrants met the requirements forclassification as equity. All fluctuations in the fairvalue of the warrant liability prior to June 2012were recognized as non-cash income or expenseitems within the statement of operations. The fairvalue accounting methodology for the warrantliability is no longer required.
Business Combinations
The Company includes the results of operations ofits acquisitions in its consolidated results,prospectively from the date of acquisition.Acquisitions are accounted for by applying theacquisitions method. The Company allocates thefair value of purchase consideration to the assetsacquired, liabilities assumed, and any non-controlling interests in the acquired entity generallybased on their fair values at the acquisition date.The excess of the fair value of purchaseconsideration over the fair value of these assetsacquired, liabilities assumed and any non-controlling interests in the acquired entity isrecorded as goodwill. The primary items thatgenerate goodwill include the value of the synergiesbetween the acquired company and Flotek and thevalue of the acquired assembled workforce.Acquisition-related expenses are recognizedseparately from the business acquisition and arerecognized as expenses as incurred.
Fair Value Measurements
The Company categorizes financial assets andliabilities using a three-tier fair value hierarchy,based on the nature of the inputs used to determinefair value. Inputs refer broadly to assumptionsmarket participants would use to value an asset orliability and may be observable or unobservable.The hierarchy gives the highest priority to quoted
54

FLOTEK INDUSTRIES, INC.NOTES TO CONSOLIDATED FINANCIAL STATEMENTS
prices in active markets for identical assets orliabilities (level 1) and the lowest priority tounobservable inputs (level 3). “Level 1”measurements are measurements using quotedprices in active markets for identical assets andliabilities. “Level 2” measurements aremeasurements using quoted prices in markets thatare not active or that are based on quoted prices forsimilar assets or liabilities. “Level 3” measurementsare measurements that use significant unobservableinputs which require a company to develop its ownassumptions. When determining the fair value ofassets and liabilities, the Company uses the mostreliable measurement available.
Revenue Recognition
Revenue for product sales and services isrecognized when all of the following criteria havebeen met: (i) persuasive evidence of an arrangementexists, (ii) products are shipped or services renderedto the customer and significant risks and rewards ofownership have passed to the customer, (iii) theprice to the customer is fixed and determinable and(iv) collectability is reasonably assured. Productsand services are sold with fixed or determinableprices and do not include right of return provisionsor other significant post-delivery obligations.Deposits and other funds received in advance ofdelivery are deferred until the transfer of ownershipis complete. Shipping and handling costs arereflected in cost of revenue. Taxes collected are notincluded in revenue, rather taxes are accrued forfuture remittance to governmental authorities.
The Logistics division of chemicals recognizesrevenue from design and construction oversightcontracts under the percentage-of-completionmethod of accounting, measured by the percentageof “costs incurred to date” to the “total estimatedcosts of completion.” This percentage is applied tothe “total estimated revenue at completion” tocalculate proportionate revenue earned to date.Contracts for services are inclusive of direct laborand material costs, as well as, indirect costs ofoperations. General and administrative costs arecharged to expense as incurred. Changes in jobperformance metrics and estimated profitability,including contract bonus or penalty provisions and
final contract settlements, are recognized in theperiod such revisions appear probable. Known oranticipated losses on contracts are recognized in fullwhen amounts are probable and estimable. Bulkmaterial loading revenue is recognized as servicesare performed.
Drilling revenue is recognized upon receipt of asigned and dated field billing ticket from thecustomer. Customers are charged contractuallyagreed amounts for oilfield rental equipmentdamaged or lost-in-hole (“LIH”). LIH proceeds arerecognized as revenue and the associated carryingvalue is charged to cost of sales. LIH revenuetotaled $4.7 million, $5.9 million and $4.2 millionfor the years ended December 31, 2014, 2013 and2012, respectively.
The Company generally is not contractuallyobligated to accept returns, except for defectiveproducts. Typically products determined to bedefective are replaced or the customer is issued acredit memo. Based on historical return rates, noprovision is made for returns at the time of sale. Allcosts associated with product returns are expensedas incurred.
Foreign Currency Translation
Financial statements of foreign subsidiaries areprepared using the currency of the primaryeconomic environment of the foreign subsidiaries,as the functional currency. Assets and liabilities offoreign subsidiaries are translated into U.S. dollarsat exchange rates in effect as of the end of identifiedreporting periods. Revenue and expensetransactions are translated using the averagemonthly exchange rate for the reporting period.Resultant translation adjustments are recognized asother comprehensive income (loss) withinstockholders’ equity.
Comprehensive Income (Loss)
Comprehensive income (loss) encompasses allchanges in stockholders’ equity except those arisingfrom investments from, and distributions tostockholders. The Company’s comprehensiveincome (loss) includes net income and foreigncurrency translation adjustments.
55

FLOTEK INDUSTRIES, INC.NOTES TO CONSOLIDATED FINANCIAL STATEMENTS
Research and Development Costs
Expenditures for research activities relating toproduct development and improvement are chargedto expense as incurred.
Income Taxes
The Company has two U.S. tax filing groups whichfile separate U.S. Federal tax returns. Taxableincome of one return cannot be offset by taxattributes, including net operating losses, of theother return.
The Company uses the liability method inaccounting for income taxes. Deferred tax assetsand liabilities are recognized for temporarydifferences between financial statement carryingamounts and the tax bases of assets and liabilities,and are measured using the tax rates expected to bein effect when the differences reverse. Deferred taxassets and liabilities are recognized related to theanticipated future tax effects of temporarydifferences between the financial statement basisand the tax basis of the Company’s assets andliabilities using statutory tax rates at the applicableyear end. Deferred tax assets are also recognized foroperating loss and tax credit carry forwards. Theeffect on deferred tax assets and liabilities of achange in tax rates is recognized in the results ofoperations in the period that includes the enactmentdate. A valuation allowance is used to reducedeferred tax assets when uncertainty existsregarding their realization.
A valuation allowance is recorded to reducepreviously recorded tax assets when it becomesmore-likely-than-not that such assets will not berealized. The Company evaluates, at least annually,net operating loss carry forwards and other netdeferred tax assets and considers all availableevidence, both positive and negative, to determinewhether a valuation allowance is necessary relativeto net operating loss carry forwards and other netdeferred tax assets. In making this determination,the Company considers cumulative losses in recentyears as significant negative evidence. TheCompany considers recent years to mean thecurrent year plus the two preceding years. TheCompany considers the recent cumulative income
or loss position of its filings groups as objectivelyverifiable evidence for the projection of futureincome, which consists primarily of determining theaverage of the pre-tax income of the current andprior two years after adjusting for certain items notindicative of future performance. Based on thisanalysis, the Company determines whether avaluation allowance is necessary.
U.S. Federal income taxes are not provided onunremitted earnings of subsidiaries operatingoutside the U.S. because it is the Company’sintention to permanently reinvest undistributedearnings in the subsidiary. These earnings wouldbecome subject to income tax if they were remittedas dividends or loaned to a U.S. affiliate.Determination of the amount of unrecognizeddeferred U.S. income tax liability on theseunremitted earnings is not practicable.
The Company has performed an evaluation andconcluded that there are no significant uncertain taxpositions requiring recognition in the Company’sfinancial statements.
The Company’s policy is to record interest andpenalties related to income tax matters as incometax expense.
Earnings Per Share
Basic earnings per common share is calculated bydividing net income available to commonstockholders by the weighted average number ofcommon shares outstanding for the period. Dilutedearnings per share is calculated by dividing netincome attributable to common stockholders,adjusted for the effect of assumed conversions ofconvertible notes and preferred stock, by theweighted average number of common sharesoutstanding, including potentially dilutive commonshare equivalents, if the effect is dilutive.Potentially dilutive common shares equivalentsconsist of incremental shares of common stockissuable upon exercise of stock options andwarrants, settlement of restricted stock units, andconversion of convertible notes and convertiblepreferred stock.
56

FLOTEK INDUSTRIES, INC.NOTES TO CONSOLIDATED FINANCIAL STATEMENTS
Debt Issuance Costs
Costs related to debt issuance are capitalized andamortized as interest expense over the term of therelated debt using the straight-line method, whichapproximates the effective interest method. Uponthe repayment of debt, the Company accelerates therecognition of an appropriate amount of the costs asinterest expense.
Capitalization of Interest
Interest costs are capitalized for qualifying in-process software development projects.Capitalization of interest commences whenactivities to prepare the asset are in progress, andexpenditures and borrowing costs are beingincurred. Interest costs are capitalized until theassets are ready for their intended use. Capitalizedinterest is added to the cost of the underlying assetsand amortized over the estimated useful lives of theassets. During the year ended December 31, 2012,$0.1 million of interest was capitalized.
Stock-Based Compensation
Stock-based compensation expense for share-basedpayments, related to stock option and restrictedstock awards, is recognized based on their grant-date fair values. The Company recognizescompensation expense, net of estimated forfeitures,on a straight-line basis over the requisite serviceperiod of the award. Estimated forfeitures are basedon historical experience.
Use of Estimates
The preparation of financial statements inconformity with GAAP requires management tomake estimates and assumptions that affect reportedamounts of assets and liabilities, disclosure ofcontingent assets and liabilities and reportedamounts of revenue and expenses. Actual resultscould differ from these estimates.
Significant items subject to estimates andassumptions include application of the percentage-of-completion method of revenue recognition, thecarrying amount and useful lives of property andequipment and intangible assets, impairment
assessments, share-based compensation expenseand valuation allowances for accounts receivable,inventories, and deferred tax assets.
Reclassifications
Certain prior year amounts have been reclassified toconform to the current year presentation. Thereclassifications did not impact net income.
New Accounting Pronouncements
(a) Application of New Accounting Standards
Effective January 1, 2014, the Company adoptedthe accounting guidance in Accounting StandardsUpdate (“ASU”) No. 2013-11, “Presentation of anUnrecognized Tax Benefit When a Net OperatingLoss Carryforward, a Similar Tax Loss, or a TaxCredit Carryforward Exists,” which providesguidance for reporting unrecognized tax benefitswhen a net operating loss carryforward, a similartax loss, or a tax credit carryforward exists at thereporting date. The guidance requires anunrecognized tax benefit to be presented as adecrease in a deferred tax asset where a netoperating loss, a similar tax loss, or a tax creditcarryforward exists and certain criteria are met.Implementation of this standard did not have amaterial effect on the consolidated financialstatements.
(b) New Accounting Requirements andDisclosures
In April 2014, the Financial Accounting StandardsBoard (“FASB”) issued ASU No. 2014-08,“Presentation of Financial Statements andProperty, Plant, and Equipment—ReportingDiscontinued Operations and Disclosures ofDisposals of Components of an Entity,” whichamends the definition of a discontinued operationby raising the threshold for a disposal to qualify asdiscontinued operations. The ASU will also requireentities to provide additional disclosures aboutdiscontinued operations as well as disposaltransactions that do not meet the discontinuedoperations criteria. The pronouncement is effectiveprospectively for all disposals (except disposalsclassified as held for sale before the adoption date)
57

FLOTEK INDUSTRIES, INC.NOTES TO CONSOLIDATED FINANCIAL STATEMENTS
of components initially classified as held for sale inperiods beginning on or after December 15, 2014.Early adoption is permitted. The Company iscurrently evaluating this guidance and does notexpect that adoption will have a material effect on theconsolidated financial statements.
In May 2014, the FASB issued ASU No. 2014-09,“Revenue from Contracts with Customers.” The ASUwill supersede most of the existing revenuerecognition requirements in U.S. GAAP and willrequire entities to recognize revenue at an amountthat reflects the consideration to which the Companyexpects to be entitled in exchange for transferringgoods or services to a customer. The new standardalso requires significantly expanded disclosuresregarding the qualitative and quantitative informationof an entity’s nature, amount, timing, and uncertaintyof revenue and cash flows arising from contracts withcustomers. The pronouncement is effective forannual reporting periods beginning afterDecember 15, 2016, including interim periods withinthat reporting period and is to be appliedretrospectively, with early application not permitted.The Company is currently evaluating the impact thepronouncement will have on the consolidatedfinancial statements and related disclosures.
In June 2014, the FASB issued ASU No. 2014-12,“Accounting for Share-Based Payments When theTerms of an Award Provide That a PerformanceTarget Could Be Achieved after the Requisite ServicePeriod.” The ASU requires that a performance targetthat affects vesting and that could be achieved afterthe requisite service period be treated as aperformance condition. As such, the performancetarget should not be reflected in estimating the grant-date fair value of the award. The ASU is effective forannual reporting periods beginning afterDecember 15, 2015, with early adoption permitted.The Company is evaluating the potential impacts ofthe new standard on its existing stock-basedcompensation plans.
In November 2014, the FASB issued ASU No. 2014-17, “Business Combinations: Pushdown Accounting.”This ASU provides companies with the option toapply pushdown accounting in its separate financialstatements upon occurrence of an event in which anacquirer obtains control of the acquired entity. Theelection to apply pushdown accounting can be madeeither in the period in which the change of controloccurred, or in a subsequent period. This ASU iseffective on November 18, 2014. Implementation ofthis standard is not expected to have a material effecton the consolidated financial statements.
Note 3 — Acquisitions
On May 10, 2013, the Company acquired FloridaChemical Company, Inc. (“Florida Chemical”), oneof the world’s largest processors of citrus oils and apioneer in solvent, chemical synthesis, and flavor andfragrance applications from citrus oils. FloridaChemical has been an innovator in creating highperformance, bio-based products for a variety ofindustries, including applications in the oil and gasindustry. The acquisition brings a portfolio of highperformance renewable and sustainable chemistriesthat perform well in the oil and gas industry as wellas non-energy related markets. This expands theCompany’s business into consumer and industrialchemical technologies which provide products for theflavor and fragrance industry and the specialtychemical industry. These technologies are used bybeverage and food companies, fragrance companies,
and companies providing household and industrialcleaning products.
The Company acquired 100% of the outstandingshares of Florida Chemical’s common stock. Thepurchase consideration transferred was as follows (inthousands):
Cash $ 49,500Common stock (3,284,180 shares) 52,711Repayment of debt 4,227
Total purchase price $106,438
The allocation of the purchase consideration wasbased upon the estimated fair value of the tangibleand identifiable intangible assets acquired and
58
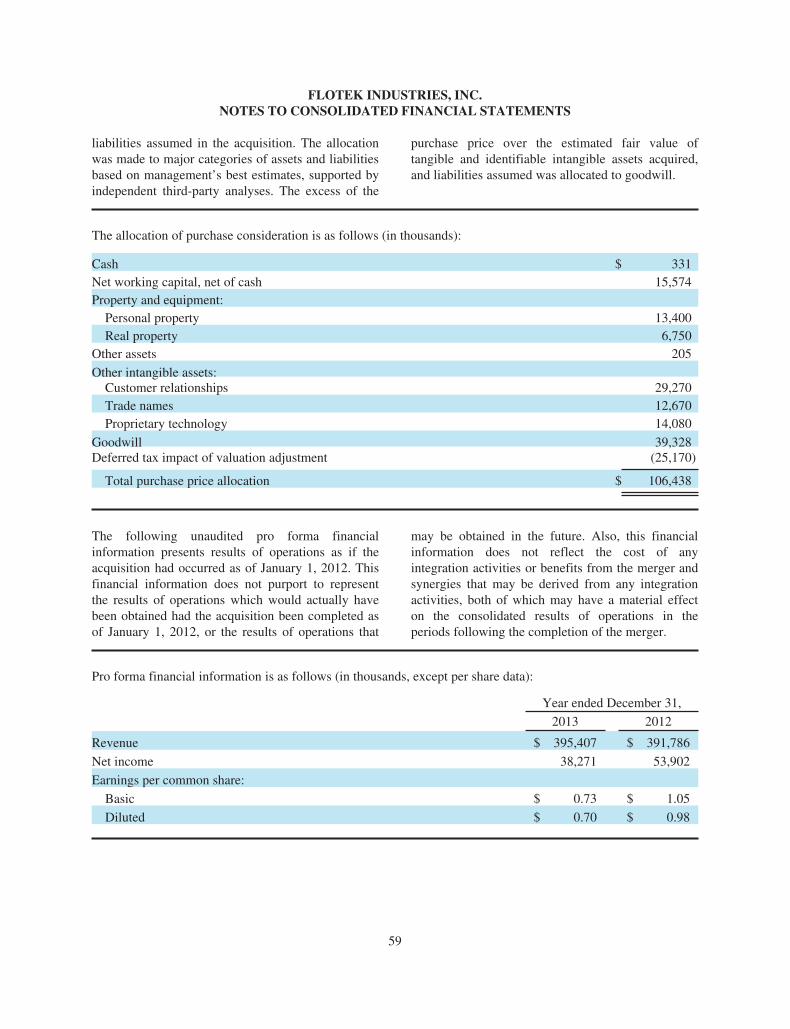
FLOTEK INDUSTRIES, INC.NOTES TO CONSOLIDATED FINANCIAL STATEMENTS
liabilities assumed in the acquisition. The allocationwas made to major categories of assets and liabilitiesbased on management’s best estimates, supported byindependent third-party analyses. The excess of the
purchase price over the estimated fair value oftangible and identifiable intangible assets acquired,and liabilities assumed was allocated to goodwill.
The allocation of purchase consideration is as follows (in thousands):
Cash $ 331Net working capital, net of cash 15,574Property and equipment:
Personal property 13,400Real property 6,750
Other assets 205
Other intangible assets:Customer relationships 29,270Trade names 12,670Proprietary technology 14,080
Goodwill 39,328Deferred tax impact of valuation adjustment (25,170)
Total purchase price allocation $ 106,438
The following unaudited pro forma financialinformation presents results of operations as if theacquisition had occurred as of January 1, 2012. Thisfinancial information does not purport to representthe results of operations which would actually havebeen obtained had the acquisition been completed asof January 1, 2012, or the results of operations that
may be obtained in the future. Also, this financialinformation does not reflect the cost of anyintegration activities or benefits from the merger andsynergies that may be derived from any integrationactivities, both of which may have a material effecton the consolidated results of operations in theperiods following the completion of the merger.
Pro forma financial information is as follows (in thousands, except per share data):
Year ended December 31,
2013 2012
Revenue $ 395,407 $ 391,786
Net income 38,271 53,902
Earnings per common share:
Basic $ 0.73 $ 1.05
Diluted $ 0.70 $ 0.98
59

FLOTEK INDUSTRIES, INC.NOTES TO CONSOLIDATED FINANCIAL STATEMENTS
Pro forma adjustments include, but are not limited to,adjustments for amortization expense for acquiredfinite lived intangible assets, depreciation expense forthe fair value of acquired property and equipment,interest expense for increased long-term debt andrevolving credit facility borrowings required for theacquisition, and income tax expense on FloridaChemical income before income taxes. In addition,pro forma adjustments eliminate historicalamortization, depreciation, and interest expense fromthe pro forma results of operations.
The acquisition was financed through increased longterm debt of $25 million, additional borrowings onthe Company’s revolving credit facility of $28.7million and the issuance of 3.3 million shares of theCompany’s common stock. Results of FloridaChemical’s operations are included in the Company’sconsolidated financial statements from the date ofacquisition. The Company’s consolidated statementsof operations for the year ended December 31, 2013include $50.9 million of revenue and $10.0 million ofincome from operations related to the operations ofFlorida Chemical.
The Company incurred $1.4 million of acquisitioncosts in connection with the transaction which havebeen expensed as incurred and included in selling,general and administrative expenses.
During the quarter ended September 30, 2014, theCompany identified and recorded a final adjustmentrelated to the acquisition of Florida Chemical.
Current deferred tax assets were increased by $1.2million with a corresponding decrease to goodwillwithin the consumer and industrial chemicaltechnologies reporting unit. This final adjustmentwas not significant relative to the total considerationpaid for Florida Chemical and, therefore, the finaladjustment has not been retrospectively applied to theCompany’s balance sheet as of December 31, 2013.This adjustment, if recorded in 2013, would have hadno impact on the 2013 consolidated statements ofoperations and cash flows.
On January 1, 2014, the Company acquired 100% ofthe membership interests in Eclipse IOR Services,LLC (“EOGA”), a leading Enhanced Oil Recovery(“EOR”) design and injection firm, for $5.3 millionin cash consideration, net of cash received, and94,354 shares of the Company’s common stock.EOGA’s enhanced oil recovery processes and its useof polymers to improve the performance of EORprojects has been combined with the Company’sexisting EOR products and services.
On April 1, 2014, the Company acquired 100% of themembership interests in SiteLark, LLC (“SiteLark”)for $0.4 million in cash and 5,327 shares of theCompany’s common stock. SiteLark providesreservoir engineering and modeling services for avariety of hydrocarbon applications. Its servicesinclude proprietary software which assists engineerswith reservoir simulation, reservoir engineering andwaterflood optimization.
60

FLOTEK INDUSTRIES, INC.NOTES TO CONSOLIDATED FINANCIAL STATEMENTS
Note 4 — Supplemental Cash Flow Information
Supplemental cash flow information is as follows (in thousands):
Year ended December 31,
2014 2013 2012
Supplemental non-cash investing and financing activities:
Value of common stock issued in acquisitions $ 2,043 $52,711 $ -
Final Florida Chemical acquisition adjustment 1,162 - -
Fair value of warrant liability reclassified to additional paid-incapital - - 13,973
Value of common stock issued in payment of accrued liability 600 - -
Equipment acquired through capital leases - 754 1,263
Exercise of stock options by common stock surrender 1,198 3,907 -
Supplemental cash payment information:
Interest paid $ 1,285 $ 1,859 $ 5,521
Income taxes paid 22,389 17,783 14,049
Note 5 — Revenue
The Company differentiates revenue and cost of revenue based on whether the source of revenue is attributable toproducts, rentals or services. Revenue and cost of revenue by source are as follows (in thousands):
Year ended December 31,
2014 2013 2012
Revenue:
Products $ 354,356 $ 282,639 $ 224,777
Rentals 65,549 62,042 67,938
Services 29,252 26,384 20,113
$ 449,157 $ 371,065 $ 312,828
Cost of Revenue:
Products $ 214,417 $ 180,800 $ 135,367
Rentals 31,285 24,987 30,618
Services 12,385 9,916 8,051
Depreciation 8,111 7,835 7,173
$ 266,198 $ 223,538 $ 181,209
61

FLOTEK INDUSTRIES, INC.NOTES TO CONSOLIDATED FINANCIAL STATEMENTS
Note 6 — Inventories
Inventories are as follows (in thousands):
December 31,
2014 2013
Raw materials $31,581 $13,953Work-in-process 3,129 1,904Finished goods 51,248 50,019Inventories 85,958 65,876
Less reserve for excess and obsolete inventory - (2,744)
Inventories, net $85,958 $63,132
Changes in the reserve for excess and obsolete inventory are as follows (in thousands):
Year ended December 31,
2014 2013 2012
Balance, beginning of year $ 2,744 $ 2,752 $ 2,679Charged to costs and expenses 358 1,330 882Deductions (3,102) (1,338) (809)
Balance, end of the year $ - $ 2,744 $ 2,752
At December 31, 2014, the Company recorded a $2.0 million write-down of inventory to recognize impairmentof all items identified and included in the reserve for excess and obsolete inventory. At December 31, 2012, theCompany recorded a $1.2 million write-down of inventory with a market value less than its cost.
Note 7 — Property and Equipment
Property and equipment are as follows (in thousands):
December 31
2014 2013
Land $ 6,780 $ 5,088Buildings and leasehold improvements 33,765 32,269Machinery, equipment and rental tools 80,731 71,073Equipment in progress 7,299 4,601Furniture and fixtures 2,528 2,400Transportation equipment 6,566 6,340Computer equipment and software 7,605 7,617Property and equipment 145,274 129,388
Less accumulated depreciation (59,163) (50,274)
Property and equipment, net $ 86,111 $ 79,114
Depreciation expense, including expense recorded in cost of revenue, totaled $13.1 million, $11.2 million and$9.5 million for the years ended December 31, 2014, 2013 and 2012, respectively.
During the years ended December 31, 2014, 2013 and 2012, no impairments were recognized related to propertyand equipment.
62

FLOTEK INDUSTRIES, INC.NOTES TO CONSOLIDATED FINANCIAL STATEMENTS
Note 8 — Goodwill
The Company had five reporting units, EnergyChemical Technologies, Consumer and IndustrialChemical Technologies, Drilling Tools, Teledrift®,and Production Technologies, of which only threehad an existing goodwill balance at December 31,2014. For segment reporting purposes, DownholeTools and the Teledrift® reporting units are includedwithin the Drilling Technologies segment.
During May 2013, as a result of the Florida Chemicalacquisition, the Company recognized $39.3 millionof goodwill. During the fair value assessmentprocess, the Company identified two separatereporting units, one of which was consolidated withinthe Energy Chemical Technologies segment and theother was identified as the Consumer and IndustrialChemical Technologies reporting unit and segment.The Company recognized $18.7 million of additionalgoodwill within the Energy Chemical Technologiesreporting unit and $20.6 million of goodwill within
the Consumer and Industrial Chemical Technologiesreporting unit. During the year ended December 31,2014, the Company recorded a final adjustmentrelated to the acquisition of Florida Chemical thatreduced goodwill by $1.2 million (see Note 3). Thenet addition to goodwill will not be deductible forincome tax purposes.
Goodwill is tested for impairment annually in thefourth quarter, or more frequently if circumstancesindicate a potential impairment. During annualgoodwill impairment testing during the years endedDecember 31, 2014, 2013 and 2012, the Companyfirst assessed qualitative factors to determine whetherit was necessary to perform the two-step goodwillimpairment test that the Company has historicallyused. The Company concluded that it was not more-likely-than-not that goodwill was impaired as of thefourth quarter of each year, and therefore, furthertesting was not required.
Changes in the carrying value of goodwill for each reporting unit are as follows (in thousands):
EnergyChemical
Technologies
Consumerand
IndustrialChemical
TechnologiesDownhole
Tools Teledrift®Production
Technologies TotalBalance at December 31, 2012:Goodwill $ 11,610 $ - $ 43,009 $ 46,396 $ 5,861 $ 106,876Accumulated impairment losses - - (43,009) (31,063) (5,861) (79,933)
Goodwill balance, net 11,610 - - 15,333 - 26,943Activity during the year 2013:
Goodwill impairmentrecognized - - - - - -
Acquisition goodwill recognized 18,686 20,642 - - - 39,328
Balance at December 31, 2013:Goodwill 30,296 20,642 43,009 46,396 5,861 146,204Accumulated impairment losses - - (43,009) (31,063) (5,861) (79,933)
Goodwill balance, net 30,296 20,642 - 15,333 - 66,271Activity during the year 2014:
Goodwill impairmentrecognized - - - - - -
Acquisition goodwill recognized 6,022 (1,162) - - - 4,860
Balance at December 31, 2014:Goodwill 36,318 19,480 43,009 46,396 5,861 151,064Accumulated impairment losses - - (43,009) (31,063) (5,861) (79,933)
Goodwill balance, net $ 36,318 $ 19,480 $ - $ 15,333 $ - $ 71,131
63

FLOTEK INDUSTRIES, INC.NOTES TO CONSOLIDATED FINANCIAL STATEMENTS
Note 9 — Other Intangible Assets
Other intangible assets are as follows (in thousands):
December 31,
2014 2013
CostAccumulatedAmortization Cost
AccumulatedAmortization
Finite lived intangible assets:
Patents and technology $20,061 $ 4,569 $18,996 $ 3,244
Customer lists 52,607 11,829 52,607 9,018
Trademarks and brand names 7,191 2,706 7,191 2,053
Other - - 191 -
Total finite lived intangible assets acquired 79,859 19,104 78,985 14,315
Deferred financing costs 1,655 512 1,392 169
Total amortizable intangible assets 81,514 $19,616 80,377 $14,484
Indefinite lived intangible assets:
Trademarks and brand names 11,630 11,630
Total other intangible assets $93,144 $92,007
Carrying value:
Other intangible assets, net $73,528 $77,523
With the acquisition of Florida Chemical on May 10,2013, the Company recorded increases in finite livedintangible assets of $14.1 million in patents andtechnology, $29.3 million in customer lists and $1.0million in trademarks and brand names. In addition,the Company recorded $11.6 million in indefinitelived trademarks and brand names. These acquiredintangible assets were recorded at fair value as of thedate of acquisition. Amortization of these otherintangible assets will not be deductible for incometax purposes.
Intangible assets acquired are amortized on astraight-line basis over two to 20 years. Amortization
of intangible assets acquired totaled $4.8 million,$3.9 million and $2.1 million for the years end endedDecember 31, 2014, 2013 and 2012, respectively.
Amortization of deferred financing costs totaled $0.3million, $0.2 million and $0.9 million for the yearsended December 31, 2014, 2013 and 2012,respectively. During the years ended December 31,2013 and 2012, the carrying value of deferredfinancing costs was reduced by less than $0.1 millionand by $1.8 million, respectively, upon repaymentsof the Company’s convertible senior notes.
64
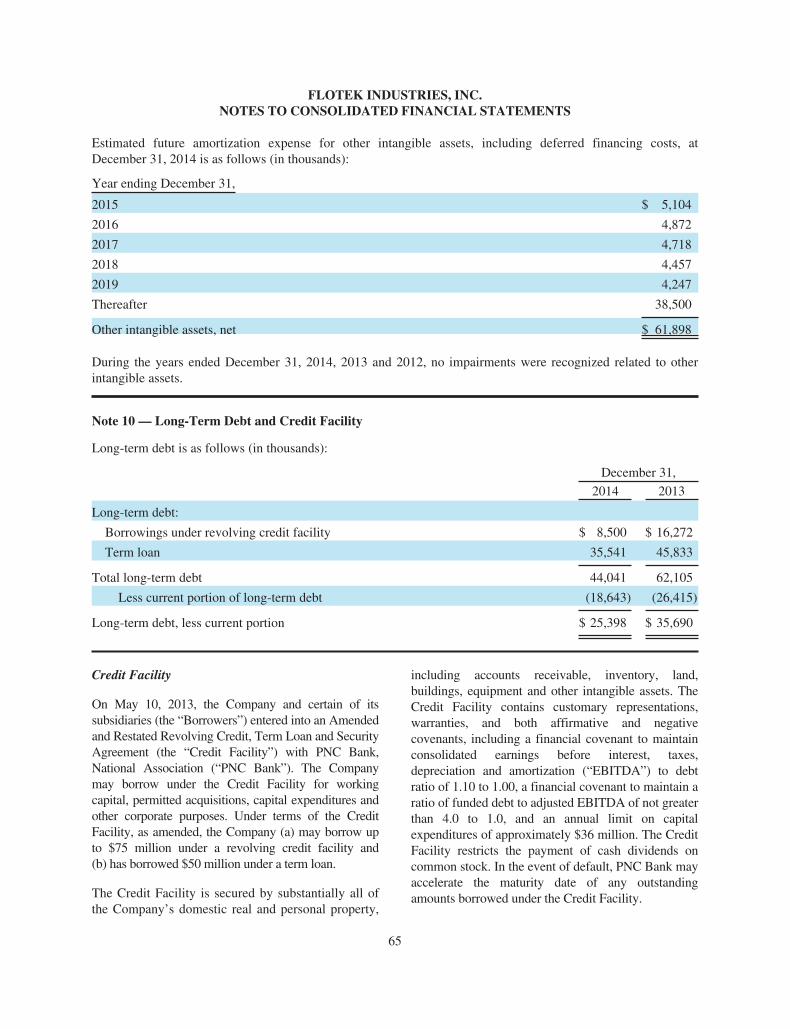
FLOTEK INDUSTRIES, INC.NOTES TO CONSOLIDATED FINANCIAL STATEMENTS
Estimated future amortization expense for other intangible assets, including deferred financing costs, atDecember 31, 2014 is as follows (in thousands):
Year ending December 31,
2015 $ 5,104
2016 4,872
2017 4,718
2018 4,457
2019 4,247
Thereafter 38,500
Other intangible assets, net $ 61,898
During the years ended December 31, 2014, 2013 and 2012, no impairments were recognized related to otherintangible assets.
Note 10 — Long-Term Debt and Credit Facility
Long-term debt is as follows (in thousands):
December 31,
2014 2013
Long-term debt:
Borrowings under revolving credit facility $ 8,500 $ 16,272
Term loan 35,541 45,833
Total long-term debt 44,041 62,105
Less current portion of long-term debt (18,643) (26,415)
Long-term debt, less current portion $ 25,398 $ 35,690
Credit Facility
On May 10, 2013, the Company and certain of itssubsidiaries (the “Borrowers”) entered into an Amendedand Restated Revolving Credit, Term Loan and SecurityAgreement (the “Credit Facility”) with PNC Bank,National Association (“PNC Bank”). The Companymay borrow under the Credit Facility for workingcapital, permitted acquisitions, capital expenditures andother corporate purposes. Under terms of the CreditFacility, as amended, the Company (a) may borrow upto $75 million under a revolving credit facility and(b) has borrowed $50 million under a term loan.
The Credit Facility is secured by substantially all ofthe Company’s domestic real and personal property,
including accounts receivable, inventory, land,buildings, equipment and other intangible assets. TheCredit Facility contains customary representations,warranties, and both affirmative and negativecovenants, including a financial covenant to maintainconsolidated earnings before interest, taxes,depreciation and amortization (“EBITDA”) to debtratio of 1.10 to 1.00, a financial covenant to maintain aratio of funded debt to adjusted EBITDA of not greaterthan 4.0 to 1.0, and an annual limit on capitalexpenditures of approximately $36 million. The CreditFacility restricts the payment of cash dividends oncommon stock. In the event of default, PNC Bank mayaccelerate the maturity date of any outstandingamounts borrowed under the Credit Facility.
65
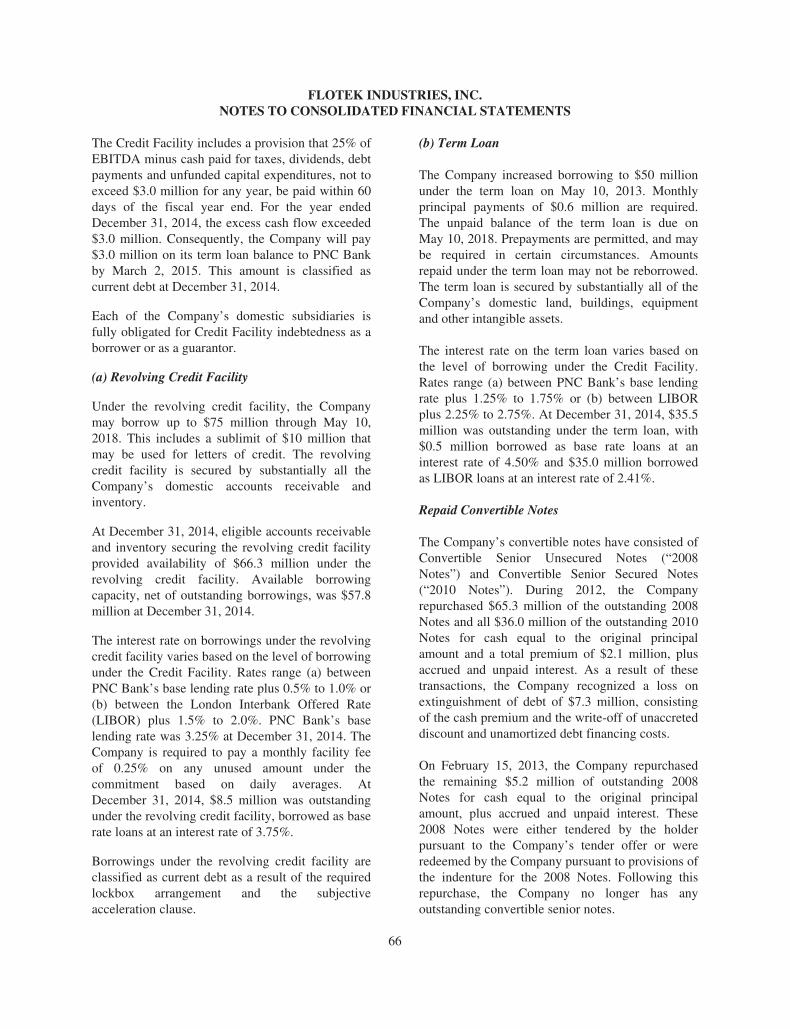
FLOTEK INDUSTRIES, INC.NOTES TO CONSOLIDATED FINANCIAL STATEMENTS
The Credit Facility includes a provision that 25% ofEBITDA minus cash paid for taxes, dividends, debtpayments and unfunded capital expenditures, not toexceed $3.0 million for any year, be paid within 60days of the fiscal year end. For the year endedDecember 31, 2014, the excess cash flow exceeded$3.0 million. Consequently, the Company will pay$3.0 million on its term loan balance to PNC Bankby March 2, 2015. This amount is classified ascurrent debt at December 31, 2014.
Each of the Company’s domestic subsidiaries isfully obligated for Credit Facility indebtedness as aborrower or as a guarantor.
(a) Revolving Credit Facility
Under the revolving credit facility, the Companymay borrow up to $75 million through May 10,2018. This includes a sublimit of $10 million thatmay be used for letters of credit. The revolvingcredit facility is secured by substantially all theCompany’s domestic accounts receivable andinventory.
At December 31, 2014, eligible accounts receivableand inventory securing the revolving credit facilityprovided availability of $66.3 million under therevolving credit facility. Available borrowingcapacity, net of outstanding borrowings, was $57.8million at December 31, 2014.
The interest rate on borrowings under the revolvingcredit facility varies based on the level of borrowingunder the Credit Facility. Rates range (a) betweenPNC Bank’s base lending rate plus 0.5% to 1.0% or(b) between the London Interbank Offered Rate(LIBOR) plus 1.5% to 2.0%. PNC Bank’s baselending rate was 3.25% at December 31, 2014. TheCompany is required to pay a monthly facility feeof 0.25% on any unused amount under thecommitment based on daily averages. AtDecember 31, 2014, $8.5 million was outstandingunder the revolving credit facility, borrowed as baserate loans at an interest rate of 3.75%.
Borrowings under the revolving credit facility areclassified as current debt as a result of the requiredlockbox arrangement and the subjectiveacceleration clause.
(b) Term Loan
The Company increased borrowing to $50 millionunder the term loan on May 10, 2013. Monthlyprincipal payments of $0.6 million are required.The unpaid balance of the term loan is due onMay 10, 2018. Prepayments are permitted, and maybe required in certain circumstances. Amountsrepaid under the term loan may not be reborrowed.The term loan is secured by substantially all of theCompany’s domestic land, buildings, equipmentand other intangible assets.
The interest rate on the term loan varies based onthe level of borrowing under the Credit Facility.Rates range (a) between PNC Bank’s base lendingrate plus 1.25% to 1.75% or (b) between LIBORplus 2.25% to 2.75%. At December 31, 2014, $35.5million was outstanding under the term loan, with$0.5 million borrowed as base rate loans at aninterest rate of 4.50% and $35.0 million borrowedas LIBOR loans at an interest rate of 2.41%.
Repaid Convertible Notes
The Company’s convertible notes have consisted ofConvertible Senior Unsecured Notes (“2008Notes”) and Convertible Senior Secured Notes(“2010 Notes”). During 2012, the Companyrepurchased $65.3 million of the outstanding 2008Notes and all $36.0 million of the outstanding 2010Notes for cash equal to the original principalamount and a total premium of $2.1 million, plusaccrued and unpaid interest. As a result of thesetransactions, the Company recognized a loss onextinguishment of debt of $7.3 million, consistingof the cash premium and the write-off of unaccreteddiscount and unamortized debt financing costs.
On February 15, 2013, the Company repurchasedthe remaining $5.2 million of outstanding 2008Notes for cash equal to the original principalamount, plus accrued and unpaid interest. These2008 Notes were either tendered by the holderpursuant to the Company’s tender offer or wereredeemed by the Company pursuant to provisions ofthe indenture for the 2008 Notes. Following thisrepurchase, the Company no longer has anyoutstanding convertible senior notes.
66

FLOTEK INDUSTRIES, INC.NOTES TO CONSOLIDATED FINANCIAL STATEMENTS
The convertible notes were guaranteed bysubstantially all of the Company’s wholly ownedsubsidiaries. Flotek Industries, Inc., the parentcompany, is a holding company with noindependent assets or operations. The guaranteesprovided by the Company’s subsidiaries were fulland unconditional, and joint and several. Anysubsidiaries of the Company that were notguarantors were deemed to be “minor” subsidiariesin accordance with SEC Regulation S-X, Rule 3-10,“Financial Statements of Guarantors and Issuers ofGuaranteed Securities Registered or BeingRegistered.”
Share Lending Agreement
Concurrent with the offering of the 2008 Notes, theCompany entered into a share lending agreement(the “Share Lending Agreement”) with theunderwriter (the “Borrower”). The Company loaned3.8 million shares of its common stock (the“Borrowed Shares”) to the Borrower for a periodcommencing February 11, 2008 and ending on thedate the 2008 Notes were paid. The Borrower waspermitted to use the Borrowed Shares only for thepurpose of directly or indirectly facilitating the saleof the 2008 Notes and for the establishment ofhedge positions by holders of the 2008 Notes. TheCompany did not require collateral to mitigate anyinherent or associated risk of the Share LendingAgreement.
The Company did not receive any proceeds for theBorrowed Shares, but did receive a nominal loanfee of $0.0001 for each share loaned. The Borrowerretained all proceeds from sales of Borrowed Sharespursuant to the Share Lending Agreement. Uponconversion or replacement of the 2008 Notes, thenumber of Borrowed Shares proportionate to theconverted or repaid notes were to be returned to theCompany. The Borrowed Shares were issued andoutstanding for corporate law purposes.Accordingly, holders of Borrowed Shares possessed
all of the rights of a holder of the Company’soutstanding shares, including the right to vote theshares on all matters submitted to a vote ofstockholders and the right to receive any dividendsor other distributions declared or paid onoutstanding shares of common stock. Under theShare Lending Agreement, the Borrower agreed topay to the Company, within one business day after apayment date, an amount equal to any cashdividends that the Company paid on the BorrowedShares, and to pay or deliver to the Company, upontermination of the loan of Borrowed Shares, anyother distribution, in liquidation or otherwise, thatthe Company made on the Borrowed Shares.
To the extent the Borrowed Shares loaned under theShare Lending Agreement were not sold or returnedto the Company, the Borrower agreed to not voteany borrowed shares of which the Borrower was theowner of record. The Borrower also agreed, underthe Share Lending Agreement, to not transfer ordispose of any borrowed shares unless such transferor disposition was pursuant to a registrationstatement that was effective under the SecuritiesAct of 1933, as amended. Investors that purchasedshares from the Borrower, and all subsequenttransferees of such purchasers, were entitled to thesame voting rights, with respect to owned shares, asany other holder of common stock.
Through December 31, 2012, the Borrower returned1,360,442 shares of the Company’s borrowedcommon stock. On January 22, 2013, the remaining2,439,558 shares of the Company’s common stockwere returned to the Company and the ShareLending Agreement was terminated. Noconsideration was paid by the Company for thereturn of the Borrowed Shares.
Shares that had been loaned under the ShareLending Agreement were not consideredoutstanding for the purpose of computing andreporting earnings per common share.
67

FLOTEK INDUSTRIES, INC.NOTES TO CONSOLIDATED FINANCIAL STATEMENTS
Debt Maturities
Maturities of long-term debt at December 31, 2014 are as follows (in thousands):
Year ending December 31,
RevolvingCredit
Facility Term Loan Total
2015 $ 8,500 $ 10,143 $ 18,643
2016 - 7,143 7,143
2017 - 7,143 7,143
2018 - 11,112 11,112
Total $ 8,500 $ 35,541 $ 44,041
Note 11 — Fair Value Measurements
Fair value is defined as the amount that would bereceived for selling an asset or paid to transfer aliability in an orderly transaction between marketparticipants at the measurement date. The Companycategorizes financial assets and liabilities into thethree levels of the fair value hierarchy. The hierarchyprioritizes the inputs to valuation techniques used tomeasure fair value and bases categorization withinthe hierarchy on the lowest level of input that isavailable and significant to the fair valuemeasurement.
‰ Level 1 — Quoted prices in active markets foridentical assets or liabilities;
‰ Level 2 — Observable inputs other than Level 1,such as quoted prices for similar assets orliabilities, quoted prices in markets that are notactive, or other inputs that are observable or canbe corroborated by observable market data forsubstantially the full term of the assets orliabilities; and
‰ Level 3 — Significant unobservable inputs thatare supported by little or no market activity orthat are based on the reporting entity’sassumptions about the inputs.
Liabilities Measured at Fair Value on a RecurringBasis
At December 31, 2014 and 2013, no liabilities wererequired to be measured at fair value on a recurringbasis. There were no transfers in or out of eitherLevel 1 or Level 2 fair value measurements duringthe years ended December 31, 2014 and 2013.During the year ended December 31, 2012, $2.6million of non-cash gains were recognized as fairvalue adjustments within Level 3 of the fair valuemeasurement hierarchy. The change resulted fromthe change in the fair value of the exercisable andcontingent warrants outstanding.
On June 14, 2012, provisions in the Company’sExercisable and Contingent Warrant Certificateswere amended to eliminate anti-dilution priceadjustment provisions and remove cash settlementprovisions of a change of control event. Uponamendment, the warrants met the requirements forclassification as equity. All fluctuations in the fairvalue of the warrant liability prior to June 2012,estimated using a Black-Scholes option pricingmodel, were recognized as non-cash income orexpense items within the statement of operations. Thefair value accounting methodology for the warrantliability is no longer required following thecontractual amendment.
During the years ended December 31, 2014 and2013, there were no transfers in or out of the Level 3hierarchy.
68

FLOTEK INDUSTRIES, INC.NOTES TO CONSOLIDATED FINANCIAL STATEMENTS
Assets Measured at Fair Value on a NonrecurringBasis
The Company’s non-financial assets, includingproperty and equipment, goodwill and otherintangible assets are measured at fair value on a non-recurring basis and are subject to fair valueadjustment in certain circumstances. No impairmentof any of these assets was recognized during theyears ended December 31, 2014, 2013 and 2012.
Fair Value of Other Financial Instruments
The carrying amounts of certain financialinstruments, including cash and cash equivalents,accounts receivable, accounts payable and accruedexpenses, approximate fair value due to the short-term nature of these accounts. The Company had nocash equivalents at December 31, 2014 or 2013.
The carrying value and estimated fair value of the Company’s long-term debt are as follows (in thousands):
December 31,
2014 2013
Carrying Value Fair Value Carrying Value Fair Value
Borrowings under revolving credit facility $ 8,500 $ 8,500 $ 16,272 $ 16,272
Term loan 35,541 35,541 45,833 45,833
The carrying value of borrowings under the revolving credit facility and the term loan approximate their fairvalue because the interest rate is variable.
Note 12 — Earnings Per Share
Basic earnings per common share is calculated bydividing net income by the weighted average numberof common shares outstanding for the period. Dilutedearnings per common share is calculated by dividingnet income, adjusted for the effect of assumedconversion of convertible notes, by the weightedaverage number of common shares outstandingcombined with dilutive common share equivalentsoutstanding, if the effect is dilutive.
In connection with the sale of the 2008 Notes, theCompany entered into a Share Lending Agreementfor 3.8 million shares of the Company’s commonstock (see Note 10). Contractual undertakings of theBorrower had the effect of substantially eliminatingthe economic dilution that otherwise would resultfrom the issuance of the Borrowed Shares, and allshares outstanding under the Share LendingAgreement were contractually obligated to bereturned to the Company. As a result, shares loaned
under the Share Lending Agreement were notconsidered outstanding for the purpose of computingand reporting earnings per common share. The ShareLending Agreement was terminated on January 22,2013 upon the return of all Borrowed Shares to theCompany.
On February 15, 2013, the Company repurchased theremaining $5.2 million of outstanding 2008 Notes forcash. Following this repurchase, the Company nolonger has any outstanding convertible senior notes.For the year ended December 31, 2013, theCompany’s convertible notes were excluded from thecalculation of diluted earnings per common share asinclusion was anti-dilutive. In addition, for the yearsended December 31, 2013 and 2012, approximately0.1 million stock options with an exercise price inexcess of the average market price of the Company’scommon stock were excluded from the calculation ofdiluted earnings per common share.
69

FLOTEK INDUSTRIES, INC.NOTES TO CONSOLIDATED FINANCIAL STATEMENTS
Basic and diluted earnings per common share are as follows (in thousands, except per share data):
Year ended December 31,
2014 2013 2012
Net income attributable to common stockholders—Basic $ 53,603 $ 36,178 $ 49,791
Impact of assumed conversions:
Interest on convertible notes - - 1,959
Net income attributable to common stockholders—Diluted $ 53,603 $ 36,178 $ 51,750
Weighted average common shares outstanding—Basic 54,511 51,346 48,185
Assumed conversions:
Incremental common shares from warrants 121 1,355 1,560
Incremental common shares from stock options 880 1,133 992
Incremental common shares from restricted stock units 14 7 116
Incremental common shares from convertible senior notes - - 2,701
Weighted average common shares outstanding—Diluted 55,526 53,841 53,554
Basic earnings per common share $ 0.98 $ 0.70 $ 1.03
Diluted earnings per common share $ 0.97 $ 0.67 $ 0.97
Note 13 — Income Taxes
Components of the income tax expense (benefit) are as follows (in thousands):
Year ended December 31,
2014 2013 2012
Current:Federal $21,468 $15,225 $ 12,072
State 684 3,322 1,450
Foreign 1,627 1,432 891
Total current 23,779 19,979 14,413
Deferred:
Federal 2,573 1,336 (18,836)
State (1,071) (543) 90
Total deferred 1,502 793 (18,746)
Income tax expense (benefit) $25,281 $20,772 $ (4,333)
70
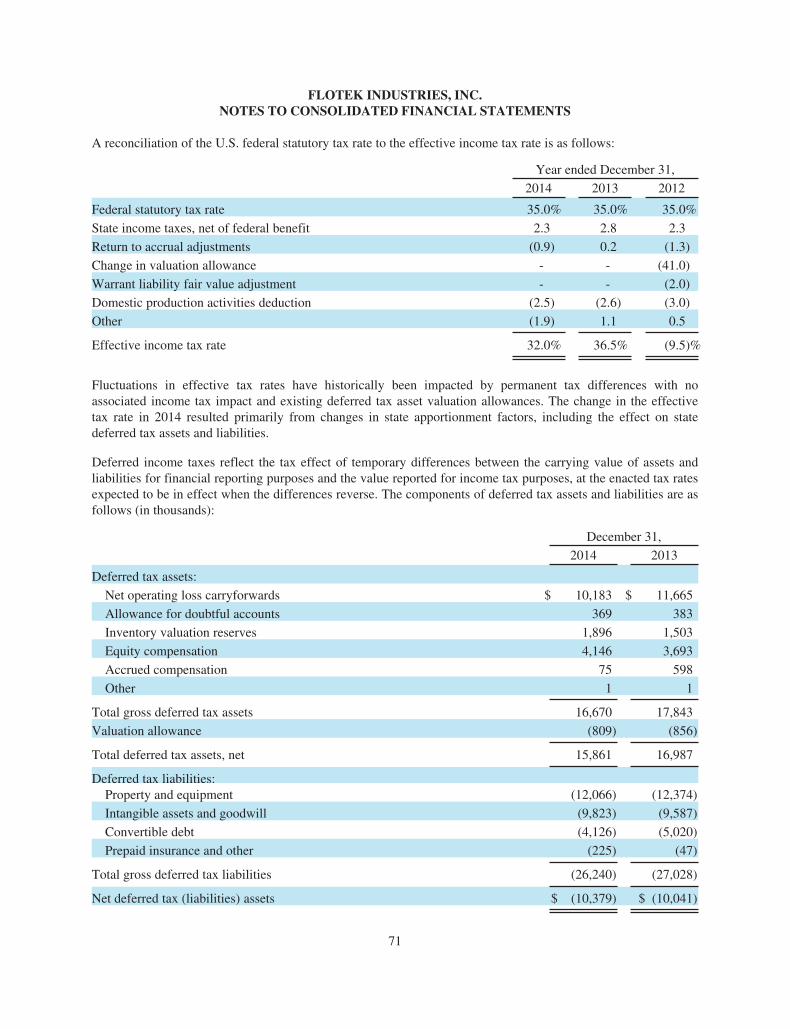
FLOTEK INDUSTRIES, INC.NOTES TO CONSOLIDATED FINANCIAL STATEMENTS
A reconciliation of the U.S. federal statutory tax rate to the effective income tax rate is as follows:
Year ended December 31,
2014 2013 2012
Federal statutory tax rate 35.0% 35.0% 35.0%
State income taxes, net of federal benefit 2.3 2.8 2.3
Return to accrual adjustments (0.9) 0.2 (1.3)
Change in valuation allowance - - (41.0)
Warrant liability fair value adjustment - - (2.0)
Domestic production activities deduction (2.5) (2.6) (3.0)
Other (1.9) 1.1 0.5
Effective income tax rate 32.0% 36.5% (9.5)%
Fluctuations in effective tax rates have historically been impacted by permanent tax differences with noassociated income tax impact and existing deferred tax asset valuation allowances. The change in the effectivetax rate in 2014 resulted primarily from changes in state apportionment factors, including the effect on statedeferred tax assets and liabilities.
Deferred income taxes reflect the tax effect of temporary differences between the carrying value of assets andliabilities for financial reporting purposes and the value reported for income tax purposes, at the enacted tax ratesexpected to be in effect when the differences reverse. The components of deferred tax assets and liabilities are asfollows (in thousands):
December 31,
2014 2013
Deferred tax assets:
Net operating loss carryforwards $ 10,183 $ 11,665
Allowance for doubtful accounts 369 383
Inventory valuation reserves 1,896 1,503
Equity compensation 4,146 3,693
Accrued compensation 75 598
Other 1 1
Total gross deferred tax assets 16,670 17,843
Valuation allowance (809) (856)
Total deferred tax assets, net 15,861 16,987
Deferred tax liabilities:Property and equipment (12,066) (12,374)
Intangible assets and goodwill (9,823) (9,587)
Convertible debt (4,126) (5,020)
Prepaid insurance and other (225) (47)
Total gross deferred tax liabilities (26,240) (27,028)
Net deferred tax (liabilities) assets $ (10,379) $ (10,041)
71

FLOTEK INDUSTRIES, INC.NOTES TO CONSOLIDATED FINANCIAL STATEMENTS
Deferred taxes are presented in the balance sheets as follows (in thousands):
December 31,
2014 2013
Current deferred tax assets $ 2,696 $ 2,522
Non-current deferred tax assets 12,907 15,102
Non-current deferred tax liabilities (25,982) (27,575)
Net deferred tax (liabilities) assets $ (10,379) $ (10,041)
During the year ended December 31, 2014, theCompany recorded a final adjustment related to theacquisition of Florida Chemical that increased currentdeferred tax assets by $1.2 million (see Note 3).
As of December 31, 2014, the Company had U.S. netoperating loss carryforwards of $26.3 million, expiringin various amounts in 2028 through 2030. The abilityto utilize net operating losses and other tax attributescould be subject to a significant limitation if theCompany were to undergo an “ownership change” forpurposes of Section 382 of the Tax Code.
The Company’s corporate organizational structurerequires the filing of two separate consolidated U.S.Federal income tax returns. Taxable income of onegroup (“Group A”) cannot be offset by tax attributes,including net operating losses of the other group(“Group B”). The Company considers all availableevidence, both positive and negative, to determinewhether a valuation allowance is necessary. TheCompany considers cumulative losses in recent yearsas significant negative evidence. The Companyconsiders recent years to mean the current year plusthe two preceding years.
Prior to December 31, 2012, the Company did not havesufficient positive evidence to overcome the existenceof a cumulative loss in Group B and thus, prior toDecember 31, 2012, maintained a full valuationallowance against deferred tax assets of that group. Asof December 31, 2012, Group B was no longer in acumulative loss position. Accordingly, the Companyconsidered the objectively verifiable positive evidencefor projecting future income, which included primarilydetermining the average of the pre-tax income of thecurrent and prior two years after adjusting for certainitems not indicative of future performance. Based on
this analysis, the Company determined a valuationallowance was no longer necessary for the group’s U.S.federal deferred tax assets. Accordingly, the Companydecreased its valuation allowance by $16.5 million atDecember 31, 2012 and recognized a reduction ofdeferred federal income tax expense. As Group Bcontinues to be in a cumulative loss position as ofDecember 31, 2014 in certain state jurisdictions, theCompany has determined that a valuation allowance of$0.8 million is required for deferred tax assets.
The Company has not calculated U.S. taxes onunremitted earnings of certain non-U.S. subsidiariesdue to the Company’s intent to reinvest theunremitted earnings of the non-U.S. subsidiaries. AtDecember 31, 2014, the Company had approximately$2.9 million in unremitted earnings outside the U.S.which were not included for U.S. tax purposes. U.S.income tax liability would be incurred if these fundswere remitted to the U.S. It is not practicable toestimate the amount of the deferred tax liability onsuch unremitted earnings.
The Company has performed an evaluation andconcluded that there are no significant uncertain taxpositions requiring recognition in the Company’sfinancial statements. The evaluation was performedfor the tax years which remain subject to examinationby tax jurisdictions as of December 31, 2014 whichare the years ended December 31, 2011 throughDecember 31, 2014 for U.S. federal taxes and theyears ended December 31, 2010 throughDecember 31, 2014 for state tax jurisdictions.
The Company’s policy is to record penalties andinterest related to income tax matters as income taxexpense.
72

FLOTEK INDUSTRIES, INC.NOTES TO CONSOLIDATED FINANCIAL STATEMENTS
Note 14 — Convertible Preferred Stock and StockWarrants
In August 2009, the Company sold convertiblepreferred stock with detachable warrants to purchaseshares of the Company’s common stock. InFebruary 2011, the Company exercised itscontractual right to mandatorily convert alloutstanding shares of convertible preferred stock intoshares of common stock. Currently, the Company hasno issued or outstanding shares of preferred stock.
Due to the anti-dilution price adjustment provisionsestablished at the issuance date, the warrants weredeemed to be a liability and were recorded at fair valueat the date of issuance. The warrant liability was adjustedto fair value at the end of each reporting period throughthe statement of operations during the period the anti-dilution price adjustment provisions were in effect. OnJune 14, 2012, contractual provisions within theCompany’s warrant agreements were modified toeliminate the anti-dilution price adjustment provisions ofthe warrants and remove the cash settlement provisionsin the event of a change of control. The amendedwarrants then qualified to be classified as equity.Accordingly, the Company revalued the warrants as ofJune 14, 2012, the date of contractual amendment. Thechange in fair value of the warrant liability compared tothe fair value on December 31, 2011, $2.6 million, wasrecognized in income during 2012. The revalued warrant
liability of $14.0 million was reclassified to additionalpaid-in capital on June 14, 2012. There were no longerfair value adjustments because the warrants continued tomeet the criteria for equity classification.
The Company used the Black-Scholes option-pricingmodel to estimate the fair value of the warrantliability for each reporting period. On June 14, 2012,the date the warrants were amended, inputs into thefair value calculation included the actual remainingterm of the warrants, a volatility rate of 58.1%, arisk-free rate of return of 0.36%, and an assumeddividend rate of zero.
During the years ended December 31, 2013 and2012, warrants were exercised to purchase 267,000shares and 348,350 shares, respectively, of theCompany’s common stock for which the Companyreceived cash proceeds of $0.3 million and $0.4million, respectively.
On February 7, 2014, warrants were exercised topurchase 1,277,250 shares of the Company’scommon stock at $1.21 per share. The Companyreceived cash proceeds of $1.5 million in connectionwith the warrants exercised. Following this exercise,the Company no longer has any outstanding warrants.
Note 15 — Common Stock
The Company’s Certificate of Incorporation, as amended November 9, 2009, authorizes the Company to issue upto 80 million shares of common stock, par value $0.0001 per share, and 100,000 shares of one or more series ofpreferred stock, par value $0.0001 per share.
A reconciliation of the changes in common shares issued is as follows:
Year ended December 31,
2014 2013
Shares issued at the beginning of the year 58,265,911 53,123,978Issued in purchase of Florida Chemical Company, Inc. - 3,284,180Issued in purchases of Eclipse IOR Services, LLC and SiteLark, LLC 99,681 -Issued in payment of accrued liability 27,101 -Issued upon exercise of warrants 1,277,250 267,000Issued from restricted stock units - 217,089Issued as restricted stock award grants 525,120 802,164Issued upon exercise of stock options 311,954 571,500Retirement of treasury shares (5,873,291) -
Shares issued at the end of the year 54,633,726 58,265,911
73

FLOTEK INDUSTRIES, INC.NOTES TO CONSOLIDATED FINANCIAL STATEMENTS
Stock-Based Incentive Plans
Stockholders approved long term incentive plans in2014, 2010, 2007, 2005 and 2003 (the “2014 Plan,”the “2010 Plan,” the “2007 Plan,” the “2005 Plan” andthe “2003 Plan,” respectively) under which theCompany may grant equity awards to officers, keyemployees, and non-employee directors in the form ofstock options, restricted stock and certain otherincentive awards. The maximum number of shares thatmay be issued under the 2014 Plan, 2010 Plan, 2007Plan and 2005 Plan are 2.7 million, 6.0 million,2.2 million and 1.9 million, respectively. ADecember 31, 2014, the Company had a total of2.3 million shares remaining to be granted under the2014 Plan, 2010 Plan, 2007 Plan and 2005 Plan.Shares may no longer be granted under the 2003 Plan.
Stock Options
All stock options are granted with an exercise priceequal to the market value of the Company’s commonstock on the date of grant. Options expire no laterthan ten years from the date of grant and generallyvest in four years or less. Proceeds received fromstock option exercises are credited to common stockand additional paid-in capital, as appropriate. TheCompany uses historical data to estimate pre-vestingoption forfeitures. Estimates are adjusted when actualforfeitures differ from the estimate. Stock-basedcompensation expense is recorded for all equityawards expected to vest.
The fair value of stock options at the date of grant iscalculated using the Black-Scholes option pricingmodel. The risk free interest rate is based on theimplied yield of U.S. Treasury zero-coupon securitiesthat correspond to the expected life of the option.Volatility is estimated based on historical and impliedvolatilities of the Company’s stock and of identifiedcompanies considered to be representative peers of theCompany. The expected life of awards grantedrepresents the period of time the options are expectedto remain outstanding. The Company uses the“simplified” method which is permitted for companiesthat cannot reasonably estimate the expected life ofoptions based on historical share option exerciseexperience. The Company does not expect to paydividends on common stock. No options were grantedto employees during 2014, 2013 or 2012.
The Black-Scholes option valuation model wasdeveloped to estimate the fair value of traded optionsthat have no vesting restrictions and are fully-transferable. Because option valuation models requirethe use of subjective assumptions, changes in theseassumptions can materially affect the fair valuecalculation. The Company’s options are notcharacteristic of traded options; therefore, the optionvaluation models do not necessarily provide areliable measure of the fair value of options.
Stock option activity for the year ended December 31, 2014 is as follows:
Options Shares
Weighted-AverageExercise
Price
Weighted-AverageRemaining
Contractual Term(in years)
AggregateIntrinsic Value
Outstanding as of January 1, 2014 1,864,042 $ 4.95Exercised (311,954) 5.32Forfeited (7,128) 17.58Expired - -
Outstanding as of December 31, 2014 1,544,960 $ 4.81 1.81 $ 21,497,484
Vested or expected to vest atDecember 31, 2014 1,544,960 $ 4.81 1.81 $ 21,497,484
Options exercisable as of
December 31, 2014 1,544,960 $ 4.81 1.81 $ 21,497,484
74

FLOTEK INDUSTRIES, INC.NOTES TO CONSOLIDATED FINANCIAL STATEMENTS
The total intrinsic value of stock options exercisedduring the years ended December 31, 2014, 2013 and2012 was $6.0 million, $5.6 million and $0.6 million,respectively. The total fair value of stock optionsvesting during the years ended December 31, 2014was less than $0.1 million, and was $4.2 million and$0.5 million for the years ended December 31, 2013and 2012, respectively.
At December 31, 2014, the Company had recognizedall compensation expense related to stock options.
Restricted Stock
The Company grants employees either time-vestingor performance-based restricted shares in accordancewith terms specified in the Restricted Stock
Agreements (“RSAs”). Time-vesting restricted sharesvest after a stipulated period of time has elapsedsubsequent to the date of grant, generally three tofour years. Certain time-vested shares have also beenissued with a portion of the shares granted vestingimmediately. Performance-based restricted shares areissued with performance criteria defined over adesignated performance period and vest only when,and if, the outlined performance criteria are met.During the year ended December 31, 2014,approximately 62% of the restricted shares grantedwere time-vesting and the remainder wereperformance-based. Grantees of restricted sharesretain voting rights for the granted shares.
Restricted stock share activity for the year ended December 31, 2014 is as follows:
Restricted Stock Shares Shares
Weighted-Average Fair
Value at Date ofGrant
Non-vested at January 1, 2014 1,067,655 $ 12.78Granted 349,544 27.29RSAs converted from 2013 restricted stock units 175,576 16.35Vested (705,566) 13.65Forfeited (60,691) 14.89
Non-vested at December 31, 2014 826,518 $ 18.78
The weighted-average grant-date fair value ofrestricted stock granted during the years endedDecember 31, 2014, 2013 and 2012 was $27.29,$15.17 and $11.03 per share, respectively. The totalfair value of restricted stock that vested during theyears ended December 31, 2014, 2013 and 2012 was$10.2 million, $8.4 million and $5.4 million,respectively.
At December 31, 2014, there was $10.7 million ofunrecognized compensation expense related to non-vested restricted stock. The unrecognizedcompensation expense is expected to be recognizedover a weighted-average period of 1.8 years.
75

FLOTEK INDUSTRIES, INC.NOTES TO CONSOLIDATED FINANCIAL STATEMENTS
Restricted Stock Units
During the year ended December 31, 2014, theCompany granted performance-based restricted stockunits (“RSUs”) that will be converted into 352,254
shares of common stock. These shares, which will beissued as RSAs, will vest in equal one-half trancheson December 31, 2015 and 2016.
Restricted stock unit share activity for the year ended December 31, 2014 is as follows:
Restricted Stock Unit Shares Shares
Weighted-Average Fair
Value at Date ofGrant
RSU share equivalents at January 1, 2014 175,576 $ 16.352013 RSUs converted to RSAs in 2014 (175,576) 16.35Share equivalents earned in 2014 352,254 24.66
RSU share equivalents at December 31, 2014 352,254 $ 24.66
At December 31, 2014, there was $6.8 million ofunrecognized compensation expense related to 2014restricted stock units. The unrecognizedcompensation expense is expected to be recognizedover a weighted-average period of 2.0 years.
Employee Stock Purchase Plan
The Company’s Employee Stock Purchase Plan(ESPP) was approved by stockholders on May 18,2012. The Company registered 500,000 shares of itscommon stock, currently held as treasury shares, forissuance under the ESPP. The purpose of the ESPP isto provide employees with an opportunity topurchase shares of the Company’s common stockthrough accumulated payroll deductions. The ESPPallows participants to purchase common stock at apurchase price equal to 85% of the fair market valueof the common stock on the last business day of athree-month offering period which coincides withcalendar quarters. The first quarterly offering periodbegan on October 1, 2012. Payroll deductions maynot exceed 10% of an employee’s compensation andparticipants may not purchase more than 1,000 sharesin any one offering period. The fair value of thediscount associated with shares purchased under theplan is recognized as share-based compensationexpense and was $0.2 million, $0.1 million and lessthan $0.1 million during the years endedDecember 31, 2014, 2013 and 2012, respectively.The total fair value of the shares purchased under the
plan during the years ended December 31, 2014,2013 and 2012 was $1.1 million, $0.9 million and$0.2 million, respectively. The employee paymentassociated with participation in the plan was satisfiedthrough payroll deductions.
Share-Based Compensation Expense
Non-cash share-based compensation expense relatedto stock options, restricted stock, restricted stock unitgrants and stock purchased under the Company’sESPP was $10.5 million, $10.9 million and $13.4million during the years ended December 31, 2014,2013 and 2012, respectively.
Treasury Stock
The Company accounts for treasury stock using thecost method and includes treasury stock as acomponent of stockholders’ equity. During the yearsended December 31, 2014 and 2013, the Companypurchased 243,005 shares and 448,121 shares,respectively, of the Company’s common stock atmarket value as payment of income tax withholdingowed by employees upon the vesting of restrictedshares and the exercise of stock options. Shares issuedas restricted stock awards to employees that wereforfeited are accounted for as treasury stock. Duringthe years ended December 31, 2014 and 2013, sharessurrendered for the exercise of stock options were46,208 and 237,267, respectively. These surrenderedshares are also accounted for as treasury stock.
76

FLOTEK INDUSTRIES, INC.NOTES TO CONSOLIDATED FINANCIAL STATEMENTS
During the year ended December 31, 2013, JPMorgan Chase & Co. returned 2,439,558 shares ofthe Company’s common stock that had beenborrowed under the Share Lending Agreement. Theseshares were then included in treasury stock.
Retirement of Treasury Stock
On December 31, 2014, the Company retired5,873,291 shares of its treasury stock with anaggregate cost of $32.6 million. The retirement wasrecorded as reductions of $32.6 million in treasurystock, $1,000 in common stock and $32.6 million inadditional paid-in capital.
All retired treasury shares are canceled and returnedto the status of authorized but unissued shares. Theretirement of treasury stock had no impact on theCompany’s total consolidated stockholder’s equity.
Stock Repurchase Program
In November 2012, the Company’s Board ofDirectors authorized the repurchase of up to $25million of the Company’s common stock.Repurchases may be made in the open market orthrough privately negotiated transactions. InDecember 2014, the Company repurchased 621,176shares of its outstanding common stock on the openmarket at a cost of $10.4 million, inclusive oftransaction costs, or an average price of $16.74 pershare.
As of December 31, 2014, the Company has $14.6million remaining under its share repurchaseprogram.
Note 16 — Commitments and Contingencies
Litigation
The Company is subject to routine litigation andother claims that arise in the normal course ofbusiness. Management is not aware of any pending orthreatened lawsuits or proceedings that are expectedto have a material effect on the Company’s financialposition, results of operations or liquidity.
Operating Lease Commitments
The Company has operating leases for office space,vehicles and equipment. Future minimum leasepayments under operating leases at December 31,2014 are as follows (in thousands):
Year ending December 31,
MinimumLease
Payments
2015 $ 2,4402016 2,6472017 2,2742018 2,0602019 1,869Thereafter 13,918
Total $ 25,208
Rent expense under operating leases totaled $2.2million, $1.7 million and $1.9 million during theyears ended December 31, 2014, 2013 and 2012,respectively.
401(k) Retirement Plan
The Company maintains a 401(k) retirement plan forthe benefit of eligible employees in the U.S. Allemployees are eligible to participate in the plan uponemployment. The Company matches 100% ofemployee 401(k) contributions of up to 2% of qualifiedcompensation. During the years ended December 31,2014, 2013 and 2012, compensation expense included$0.7 million, $0.6 million and $0.5 million,respectively, related to the Company’s 401(k) match.
Concentrations and Credit Risk
The majority of the Company’s revenue is derivedfrom the oil and gas industry. Customers includemajor oilfield services companies, major integratedoil and natural gas companies, independent oil andnatural gas companies, pressure pumping servicecompanies and state-owned national oil companies.This concentration of customers in one industryincreases credit and business risks.
77

FLOTEK INDUSTRIES, INC.NOTES TO CONSOLIDATED FINANCIAL STATEMENTS
The Company is subject to significant concentrations ofcredit risk within trade accounts receivable as theCompany does not generally require collateral as support
for trade receivables. In addition, the majority of theCompany’s cash is maintained at a major financialinstitution and balances often exceed insurable amounts.
Note 17 — Business Segment, Geographic andMajor Customer Information
Segment Information
Operating segments are defined as components of anenterprise for which separate financial information isavailable that is regularly evaluated by chiefoperating decision-makers in deciding how toallocate resources and assess performance. Theoperations of the Company are categorized into fourreportable segments: Energy Chemical Technologies,Consumer and Industrial Chemical Technologies,Drilling Technologies and Production Technologies.
‰ Energy Chemical Technologies designs,develops, manufactures, packages and marketsspecialty chemicals used in oil and natural gaswell drilling, cementing, completion,stimulation, and production. In addition, theCompany’s chemistries are used in specializedenhanced and improved oil recovery markets(“EOR” or “IOR”). Activities in this segmentalso include construction and management ofautomated material handling facilities andmanagement of loading facilities and blendingoperations for oilfield services companies.
‰ Consumer and Industrial Chemical Technologiesdesigns, develops and manufactures productsthat are sold to companies in the flavor and
fragrance industry and the specialty chemicalindustry. These technologies are used bybeverage and food companies, fragrancecompanies, and companies providing householdand industrial cleaning products.
‰ Drilling Technologies rents, inspects,manufactures and markets downhole drillingequipment used in energy, mining, water welland industrial drilling activities.
‰ Production Technologies assembles and marketsproduction-related equipment, including thePetrovalveTM product line of rod pumpcomponents, electric submersible pumps, gasseparators, valves and services that supportnatural gas and oil production activities.
The Company evaluates performance based upon avariety of criteria. The primary financial measure issegment operating income. Various functions,including certain sales and marketing activities andgeneral and administrative activities, are providedcentrally by the corporate office. Costs associatedwith corporate office functions, other corporateincome and expense items, and income taxes, are notallocated to reportable segments.
78

FLOTEK INDUSTRIES, INC.NOTES TO CONSOLIDATED FINANCIAL STATEMENTS
Summarized financial information of the reportable segments is as follows (in thousands):
As of and for theyear ended December 31,
EnergyChemical
Technologies
Consumer andIndustrialChemical
TechnologiesDrilling
TechnologiesProduction
Technologies
Corporateand
Other Total
2014Net revenue from external
customers $268,761 $51,091 $113,302 $16,003 $ - $449,157
Gross margin 117,867 12,897 45,651 6,544 - 182,959
Income (loss) from operations 84,846 6,558 19,022 3,246 (32,784) 80,888
Depreciation and amortization 4,401 2,138 9,808 327 1,174 17,848
Total assets 156,596 87,412 147,584 21,843 9,841 423,276
Capital expenditures 6,983 115 9,626 942 2,241 19,907
2013Net revenue from external
customers $200,932 $42,927 $112,406 $14,800 $ - $371,065
Gross margin 88,536 10,659 43,156 5,176 - 147,527
Income (loss) from operations 65,396 6,260 18,306 3,060 (34,296) 58,726
Depreciation and amortization 3,160 1,126 9,632 250 941 15,109
Total assets 127,119 86,640 135,738 16,647 9,437 375,581
Capital expenditures 5,225 183 6,326 1,749 1,524 15,007
2012Net revenue from external
customers $183,986 $ - $116,736 $12,106 $ - $312,828
Gross margin 81,438 - 45,709 4,472 - 131,619
Income (loss) from operations 65,440 - 22,282 3,395 (32,496) 58,621
Depreciation and amortization 1,765 - 9,115 206 497 11,583
Total assets 59,195 - 118,771 11,189 30,712 219,867
Capital expenditures 3,553 - 12,264 77 4,807 20,701
Geographic Information
Revenue by country is based on the location where services are provided and products are used. No individualcountry other than the United States (“U.S.”) accounted for more than 10% of revenue. Revenue by geographiclocation is as follows (in thousands):
Year ended December 31,
2014 2013 2012
U.S. $ 370,087 $ 319,649 $ 272,945
Other countries 79,070 51,416 39,883
Total $ 449,157 $ 371,065 $ 312,828
Long-lived assets held in countries other than the U.S. are not considered material to the consolidated financialstatements.
79

FLOTEK INDUSTRIES, INC.NOTES TO CONSOLIDATED FINANCIAL STATEMENTS
Major Customers
Revenue from major customers, as a percentage of consolidated revenue, is as follows:
Year ended December 31,2014 2013 2012
Customer A 16.1% 16.2% 15.6%
Customer B * * 10.0%
* This customer did not account for more than 10% of revenue.
Over 94% of the revenue from major customers noted above was from the Energy Chemical Technologiessegment.
Note 18 — Quarterly Financial Data (Unaudited)
FirstQuarter
SecondQuarter
ThirdQuarter
FourthQuarter Total
(in thousands, except per share data)2014Revenue $ 102,575 $ 105,318 $ 116,761 $ 124,503 $ 449,157
Gross margin 43,681 42,310 46,078 50,890 182,959
Net income 12,018 11,041 14,272 16,272 53,603
Earnings per share (1):
Basic $ 0.22 $ 0.20 $ 0.26 $ 0.30 $ 0.98
Diluted $ 0.22 $ 0.20 $ 0.26 $ 0.29 $ 0.97
2013Revenue $ 78,243 $ 93,586 $ 98,388 $ 100,848 $ 371,065
Gross margin 32,630 37,594 37,502 39,801 147,527
Net income 7,765 8,440 8,968 11,005 36,178
Earnings per share (1):Basic $ 0.16 $ 0.17 $ 0.17 $ 0.21 $ 0.70
Diluted $ 0.15 $ 0.16 $ 0.16 $ 0.20 $ 0.67
(1) The sum of the quarterly earnings per share (basic and diluted) may not agree to the earnings per share for the year due to the timing ofcommon stock issuances.
80

Item 9. Changes in and Disagreements WithAccountants on Accounting and FinancialDisclosure.
Not applicable.
Item 9A. Controls and Procedures.
Evaluation of Disclosure Controls and Procedures
The Company’s disclosure controls and proceduresare designed to ensure that information required to bedisclosed by the Company in reports filed orsubmitted under the Securities Exchange Act of1934, as amended (the “Exchange Act”), is recorded,processed, summarized and reported within the timeperiods specified in the SEC’s rules and forms. TheCompany’s disclosure controls and procedures arealso designed to ensure such information isaccumulated and communicated to management,including the principal executive and principalfinancial officers, as appropriate to allow timelydecisions regarding required disclosures. There areinherent limitations to the effectiveness of anysystem of disclosure controls and procedures,including the possibility of human error and thecircumvention or overriding of controls andprocedures. Accordingly, even effective disclosurecontrols and procedures can only provide reasonableassurance that control objectives are attained. TheCompany’s disclosure controls and procedures aredesigned to provide such reasonable assurance.
The Company’s management, with the participationof the principal executive and principal financialofficers, evaluated the effectiveness of the design andoperation of the Company’s disclosure controls andprocedures as of December 31, 2014, as required byRule 13a-15(e) of the Exchange Act. Based upon thatevaluation, the principal executive and principalfinancial officers have concluded that the Company’sdisclosure controls and procedures were effective asof December 31, 2014.
Management’s Report on Internal Control overFinancial Reporting
The Company’s management is responsible forestablishing and maintaining adequate internalcontrol over financial reporting, as defined in Rule13a-15(f) of the Exchange Act. The Company’smanagement, including the principal executive andprincipal financial officers, assessed the effectivenessof internal control over financial reporting as ofDecember 31, 2014, based on criteria issued by theCommittee of Sponsoring Organizations of theTreadway Commission (2013 Framework) (“COSO”)in “Internal Control – Integrated Framework.” Uponevaluation, the Company’s management hasconcluded that the Company’s internal control overfinancial reporting was effective in connection withthe preparation of the consolidated financialstatements as of December 31, 2014.
The effectiveness of the Company’s internal controlover financial reporting as of December 31, 2014 hasbeen audited by Hein & Associates LLP, anindependent registered public accounting firm, asstated in their report which is included herein.
Changes in Internal Control Over FinancialReporting
There have been no changes in the Company’ssystem of internal control over financial reportingduring the three months ended December 31, 2014that have materially affected, or are reasonably likelyto materially affect, the Company’s internal controlover financial reporting.
Item 9B. Other Information.
None.
81

PART III
Item 10. Directors, Executive Officers andCorporate Governance.
The information required by this Item isincorporated by reference to the Company’sDefinitive Proxy Statement for the 2015 AnnualMeeting of Stockholders to be filed with the SECwithin 120 days of year end.
Item 11. Executive Compensation.
The information required by this Item isincorporated by reference to the Company’sDefinitive Proxy Statement for the 2015 AnnualMeeting of Stockholders to be filed with the SECwithin 120 days of year end.
Item 12. Security Ownership of CertainBeneficial Owners and Management and RelatedStockholder Matters.
The information required by this Item isincorporated by reference to the Company’sDefinitive Proxy Statement for the 2015 AnnualMeeting of Stockholders to be filed with the SECwithin 120 days of year end.
Item 13. Certain Relationships and RelatedTransactions, and Director Independence.
The information required by this Item isincorporated by reference to the Company’sDefinitive Proxy Statement for the 2015 AnnualMeeting of Stockholders to be filed with the SECwithin 120 days of year end.
Item 14. Principal Accountant Fees andServices.
The information required by this Item isincorporated by reference to the Company’sDefinitive Proxy Statement for the 2015 AnnualMeeting of Stockholders to be filed with the SECwithin 120 days of year end.
82

PART IV
Item 15. Exhibits and Financial Statement Schedules.
EXHIBIT INDEX
ExhibitNumber Exhibit Title
2.1 Agreement and Plan of Merger dated May 10, 2013, by and among Flotek Industries, Inc., FlotekAcquisition Inc. and Florida Chemical Company, Inc. (incorporated by reference to Exhibit 2.1 to theCompany’s Form 8-K filed on May 13, 2013).
3.1 Amended and Restated Certificate of Incorporation (incorporated by reference to Exhibit 3.1 to theCompany’s Form 10-Q for the quarter ended September 30, 2007).
3.2 Certificate of Designations for Series A Cumulative Convertible Preferred Stock datedAugust 11, 2009 (incorporated by reference to Exhibit 3.1 to the Company’s Form 8-K filed onAugust 17, 2009).
3.3 Certificate of Amendment to the Amended and Restated Certificate of Incorporation (incorporated byreference to Exhibit 3.1 to the Company’s Form 10-Q for the quarter ended September 30, 2009).
3.4 Amended and Restated Bylaws, dated December 9, 2014 (incorporated by reference to Exhibit 3.1 tothe Company’s Form 8-K filed on December 10, 2014).
4.1 Form of Certificate of Common Stock (incorporated by reference to Appendix E to the Company’sDefinitive Proxy Statement filed on September 27, 2001).
4.2 Form of Certificate of Series A Cumulative Convertible Preferred Stock (incorporated by referenceto Exhibit A to the Certificate of Designations for Series A Cumulative Convertible Preferred Stockfiled as Exhibit 3.1 to the Company’s Form 8-K filed on August 17, 2009).
4.3 Form of Warrant to Purchase Common Stock of the Company, dated August 31, 2000 (incorporatedby reference to Exhibit 4.3 to the Company’s Registration Statement on Form SB-2 (File no. 333-129308) filed on October 28, 2005).
4.4 Form of Exercisable Warrant, dated August 11, 2009 (incorporated by reference to Exhibit 4.1 to theCompany’s Form 8-K filed on August 17, 2009).
4.5 Form of Contingent Warrant, dated August 11, 2009 (incorporated by reference to Exhibit 4.2 to theCompany’s Form 8-K filed on August 17, 2009).
4.6 Amendment to Warrant to Purchase Common Stock, dated June 14, 2012, by and among theCompany and each of the holders party thereto (incorporated by reference to Exhibit 10.1 to theCompany’s Form 8-K filed on June 18, 2012).
4.7 Amendment to Amended and Restated Warrant to Purchase Common Stock, dated as of February 5,2014 (incorporated by reference to Exhibit 10.1 to the Company’s Form 8-K filed on February 11,2014).
10.1 2003 Long-Term Incentive Plan (incorporated by reference to Exhibit 10.1 to the Company’sRegistration Statement on Form S-8 filed on October 27, 2005).
10.2 2005 Long-Term Incentive Plan (incorporated by reference to Exhibit 10.2 to the Company’sRegistration Statement on Form S-8 filed on October 27, 2005).
10.3 2007 Long-Term Incentive Plan (incorporated by reference to Exhibit 10.6 to the Company’sForm 10-K for the year ended December 31, 2007).
10.4 Exclusive License Agreement, dated April 3, 2006, among the Company, USA Petrovalve, Inc. andTotal Well Solutions, LLC (incorporated by reference to Exhibit 10.2 to the Company’s Form 10-QSB for the quarter ended June 30, 2006).
10.5 Form of Unit Purchase Agreement, dated August 11, 2009 (incorporated by reference to Exhibit 10.1 tothe Company’s Form 8-K filed on August 12, 2009).
10.6 Indenture, dated as of March 31, 2010, among the Company, the subsidiary guarantors named thereinand U.S. Bank National Association (incorporated by reference to Exhibit 4.1 to the Company’sForm 8-K filed on April 6, 2010).
10.7 2010 Long-Term Incentive Plan (incorporated by reference to Appendix A to the Company’s DefinitiveProxy Statement filed on July 13, 2010).
10.8 Form of Subscription Agreement (incorporated by reference to Exhibit 4.7 to the Company’sRegistration Statement on Form S-3 (File No. 333-174199) filed on May 13, 2011).
83

ExhibitNumber Exhibit Title
10.9 Non-Qualified Stock Option Agreement, dated April 8, 2011, between the Company and SteveReeves (incorporated by reference to Exhibit 10.5 to the Company’s Form 10-Q for the quarter endedJune 30, 2011).
10.10 Non-Qualified Stock Option Agreement, dated April 8, 2011, between the Company and John W.Chisholm (incorporated by reference to Exhibit 10.7 to the Company’s Form 10-Q for the quarterended June 30, 2011).
10.11 Revolving Credit and Security Agreement dated as of September 23, 2011 (incorporated byreference to Exhibit 10.1 to the Company’s Form 8-K filed on September 26, 2011).
10.12 Guaranty dated September 23, 2011 (incorporated by reference to Exhibit 10.2 to the Company’sForm 8-K filed on September 26, 2011).
10.13 Security Agreement dated September 23, 2011 (incorporated by reference to Exhibit 10.3 to theCompany’s Form 8-K filed on September 26, 2011).
10.14 Intellectual Property Security Agreement dated September 23, 2011 (incorporated by reference toExhibit 10.4 to the Company’s Form 8-K filed on September 26, 2011).
10.15 Lien Subordination and Intercreditor Agreement dated as of September 23, 2011 (incorporated byreference to Exhibit 10.5 to the Company’s Form 8-K filed on September 26, 2011).
10.16 Third Amended and Restated Service Agreement, dated as of March 5, 2012, by and among theCompany, Protechnics II, Inc. and Chisholm Management, Inc. (incorporated by reference toExhibit 10.1 to the Company’s Form 8-K filed on March 12, 2012).
10.17 Employment Agreement, dated June 1, 2012, between the Company and Steve Reeves(incorporated by reference to Exhibit 10.1 to the Company’s Form 8-K filed on May 21, 2012).
10.18 Second Amendment to Revolving Credit and Security Agreement dated as of November 12, 2012(incorporated by reference to Exhibit 10.1 to the Company’s Form 8-K filed on November 14,2012).
10.19 Third Amendment to Revolving Credit and Security Agreement dated as of December 14, 2012(incorporated by reference to Exhibit 10.1 to the Company’s Form 8-K filed on December 17,2012).
10.20 Fourth Amendment to Revolving Credit Security Agreement dated as of December 27, 2012(incorporated by reference to Exhibit 10.1 to the Company’s Form 8-K filed on December 28,2012).
10.21 Employment Agreement, dated effective March 13, 2013 between the Company and H. RichardWalton (incorporated by reference to Exhibit 10.1 to the Company’s Form 8-K filed on March 15,2013).
10.22 Restricted Stock Agreement, dated effective March 13, 2013 between the Company and H.Richard Walton (incorporated by reference to Exhibit 10.2 to the Company’s Form 8-K filed onMarch 15, 2013).
10.23 Fourth Amended and Restated Service Agreement, dated as of April 1, 2013 between theCompany, Protechnics II, Inc. and Chisholm Management, Inc. (incorporated by reference toExhibit 10.1 to the Company’s Form 8-K filed on April 3, 2013).
10.24 Letter Agreement, dated as of April 1, 2013 between the Company and John Chisholm(incorporated by reference to Exhibit 10.2 to the Company’s Form 8-K filed on April 3, 2013).
10.25 Registration Rights Agreement dated May 10, 2013, by and among Flotek Industries, Inc. and thestockholders party thereto (incorporated by reference to Exhibit 10.1 to the Company’s Form 8-Kfiled on May 13, 2013).
10.26 Amended and Restated Revolving Credit, Term Loan and Security Agreement dated May 10, 2013(incorporated by reference to Exhibit 10.2 to the Company’s Form 8-K filed on May 13, 2013).
10.27 Amendment to Employment Agreement dated June 1, 2012 between the Company and Steven A.Reeves, effective June 23, 2013 (incorporated by reference to Exhibit 10.5 to the Company’s Form10-Q for the quarter ended June 30, 2013).
10.28 Amendment to Employment Agreement dated November 10, 2011 between the Company andKevin Fisher, effective June 23, 2013 (incorporated by reference to Exhibit 10.6 to the Company’sForm 10-Q for the quarter ended June 30, 2013).
10.29 First Amendment to Amended and Restated Revolving Credit, Term Loan and Security Agreementdated December 31, 2013 (incorporated by reference to Exhibit 10.1 to the Company’s Form 8-Kfiled on January 7, 2014).
84

ExhibitNumber Exhibit Title
10.30 Employment Agreement, dated effective February 5, 2014 between the Company and Joshua A.Snively, Sr. (incorporated by reference to Exhibit 10.2 to the Company’s Form 8-K filed onFebruary 11, 2014).
10.31 Restricted Stock Agreement, dated effective February 5, 2014 between the Company and JoshuaA. Snively, Sr. (incorporated by reference to Exhibit 10.3 to the Company’s Form 8-K filed onFebruary 11, 2014).
10.32 2014 Long-Term Incentive Plan (incorporated by reference to Exhibit A to the Company’sDefinitive Proxy Statement filed on April 18, 2014).
10.33 Fifth Amended and Restated Service Agreement, dated as of April 15, 2014, between theCompany, Protechnics II, Inc. and Chisholm Management, Inc. (incorporated by reference toExhibit 10.1 to the Company’s Form 8-K filed on April 21, 2014).
10.34 Letter Agreement, dated as of April 15, 2014, between the Company and John Chisholm(incorporated by reference to Exhibit 10.2 to the Company’s Form 8-K filed on April 21, 2014).
10.35 Second Amendment to Amended and Restated Revolving Credit, Term Loan and SecurityAgreement dated December 5, 2014 (incorporated by reference to Exhibit 10.1 to the Company’sForm 8-K filed on December 10, 2014).
10.36 Employment Agreement, dated effective December 31, 2014 between the Company and SteveReeves (incorporated by reference to Exhibit 10.1 to the Company’s Form 8-K filed on January 7,2015).
21* List of Subsidiaries.23* Consent of Hein & Associates LLP.31.1* Rule 13a-14(a) Certification of Principal Executive Officer.31.2* Rule 13a-14(a) Certification of Principal Financial Officer.32.1* Section 1350 Certification of Principal Executive Officer.32.2* Section 1350 Certification of Principal Financial Officer.101.INS** XBRL Instance Document.101.SCH** XBRL Schema Document.101.CAL** XBRL Calculation Linkbase Document.101.LAB** XBRL Label Linkbase Document.101.PRE** XBRL Presentation Linkbase Document.101.DEF** XBRL Definition Linkbase Document.
* Filed herewith.** Furnished with this Form 10-K, not filed.
85

SIGNATURES
Pursuant to the requirements of Section 13 or 15(d) of the Securities Exchange Act of 1934, the registrant hasduly caused this report to be signed on its behalf by the undersigned, thereunto duly authorized.
FLOTEK INDUSTRIES, INC.
By: /s/ JOHN W. CHISHOLM
John W. ChisholmPresident, Chief Executive Officer andChairman of the Board
Date: January 27, 2015
Pursuant to the requirements of the Securities Exchange Act of 1934, this report has been signed below by thefollowing persons on behalf of the registrant and in the capacities and on the dates indicated.
Signature Title Date
/s/ JOHN W. CHISHOLM President, Chief Executive Officer and January 27, 2015
John W. Chisholm Chairman of the Board(Principal Executive Officer)
/s/ H. RICHARD WALTON Chief Financial Officer January 27, 2015
H. Richard Walton (Principal Financial Officer andPrincipal Accounting Officer)
/s/ KENNETH T. HERN Director January 27, 2015
Kenneth T. Hern
/s/ JOHN S. REILAND Director January 27, 2015
John S. Reiland
/s/ L.V. “BUD” MCGUIRE Director January 27, 2015
L.V. “Bud” McGuire
/s/ L. MELVIN COOPER Director January 27, 2015
L. Melvin Cooper
/s/ CARLA S. HARDY Director January 27, 2015
Carla S. Hardy
/s/ TED D. BROWN Director January 27, 2015
Ted D. Brown
86

[THIS PAGE INTENTIONALLY LEFT BLANK]

EXHIBIT 21
FLOTEK INDUSTRIES, INC.LIST OF SUBSIDIARIES
CESI Chemical, Inc.
Oklahoma Corporation
Flotek Ecuador Investments, LLC
Texas Limited Liability Company
CESI Manufacturing, LLC
Oklahoma Limited Liability Company
Flotek Ecuador Management, LLC
Texas Limited Liability Company
Material Translogistics, Inc.
Texas Corporation
Flotek Chemical Ecuador Cia. Ltda.
Ecuador Limited Liability Company
Flotek Industries FZE
Jebel Ali Free Zone Establishment
Florida Chemical Company, Inc.
Delaware Corporation
FraxMax Analytics, LLC
Texas Limited Liability Company
FC Pro, LLC
Delaware Limited Liability Company
Padko International Incorporated
Oklahoma Corporation
FCC International, Inc.
Florida Corporation
Petrovalve International, Inc.
Alberta Corporation
Eclipse IOR Services, LLC
Texas Limited Liability Company
Petrovalve, Inc.
Delaware Corporation
SiteLark, LLC
Texas Limited Liability Company
USA Petrovalve, Inc.
Texas Corporation
Flotek Gulf, LLC
Omani Limited Liability Company
Turbeco, Inc.
Texas Corporation
Flotek Gulf Research, LLC
Omani Limited Liability Company
Flotek Export, Inc.
Texas Corporation
Flotek Industries Holding Ltd.
England and Wales Corporation
Flotek Paymaster, Inc.
Texas Corporation
Flotek Industries UK Ltd.
England and Wales Corporation
Teledrift Company
Delaware Corporation
Flotek Technologies ULC
British Columbia Unlimited Liability Company
Flotek International, Inc.
Delaware Corporation

EXHIBIT 23
CONSENT OF INDEPENDENT REGISTERED PUBLIC ACCOUNTING FIRM
We hereby consent to the incorporation by reference in the Registration Statements filed on Form S-8 (Nos. 333-129268, 333-157276, 333-172596, 333-174983, 333-183617 and 333-198757) and on Form S-3 (Nos. 333-161552, 333-166442, 333-166443, 333-173806, 333-174199 and 333-189555) of Flotek Industries, Inc. andsubsidiaries (the “Company”) of our reports dated January 27, 2015, relating to the consolidated financialstatements of Flotek Industries, Inc. and subsidiaries as of December 31, 2014 and 2013, and for each of the threeyears in the period ended December 31, 2014, and to the Company’s internal control over financial reporting,which are included in the Company’s Annual Report on Form 10-K for the year ended December 31, 2014, asfiled with the Securities and Exchange Commission on January 27, 2015.
We also consent to the reference to our firm under the heading “Experts” in such Registration Statements.
/s/ Hein & Associates LLP
Houston, TexasJanuary 27, 2015

Exhibit 31.1
CERTIFICATION
I, John W. Chisholm, certify that:
1. I have reviewed this Annual Report on Form 10-K of Flotek Industries, Inc.;
2. To the best of my knowledge, this report does not contain any untrue statement of a material fact or omit tostate a material fact necessary to make the statements made, in light of the circumstances under which suchstatements were made, not misleading with respect to the period covered by this report;
3. To the best of my knowledge, the financial statements, and other financial information included in this report,fairly present in all material respects the financial condition, results of operations and cash flows of the registrantas of, and for, the periods presented in this report;
4. The registrant’s other certifying officer and I are responsible for establishing and maintaining disclosurecontrols and procedures (as defined in Exchange Act Rules 13a-15(e) and 15d-15(e)) and internal control overfinancial reporting (as defined in Exchange Act Rules 13a-15(f) and 15d-15(f)) for the registrant and have:
(a) Designed such disclosure controls and procedures, or caused such disclosure controls and procedures to bedesigned under our supervision, to ensure that material information relating to the registrant, including itsconsolidated subsidiaries, is made known to us by others within those entities, particularly during the period inwhich this report is being prepared;
(b) Designed such internal control over financial reporting, or caused such internal control over financialreporting to be designed under our supervision, to provide reasonable assurance regarding the reliability offinancial reporting and the preparation of financial statements for external purposes in accordance with generallyaccepted accounting principles;
(c) Evaluated the effectiveness of the registrant’s disclosure controls and procedures and presented in this reportour conclusions about the effectiveness of the disclosure controls and procedures, as of the end of the periodcovered by this report based on such evaluation; and
(d) Disclosed in this report any change in the registrant’s internal control over financial reporting that occurredduring the registrant’s most recent fiscal quarter that has materially affected, or is reasonably likely to materiallyaffect, the registrant’s internal control over financial reporting; and
5. The registrant’s other certifying officer and I have disclosed, based on our most recent evaluation of internalcontrol over financial reporting, to the registrant’s auditors and the audit committee of the registrant’s board ofdirectors:
(a) All significant deficiencies and material weaknesses in the design or operation of internal control overfinancial reporting which are reasonably likely to adversely affect the registrant’s ability to record, process,summarize and report financial information; and
(b) Any fraud, whether or not material, that involves management or other employees who have a significant rolein the registrant’s internal control over financial reporting.
/s/ JOHN W. CHISHOLM
John W. ChisholmPresident, Chief Executive Officer andChairman of the Board
Date: January 27, 2015
Exhibit 31.2
CERTIFICATION
I, H. Richard Walton, certify that:
1. I have reviewed this Annual Report on Form 10-K of Flotek Industries, Inc.;
2. To the best of my knowledge, this report does not contain any untrue statement of a material fact or omit tostate a material fact necessary to make the statements made, in light of the circumstances under which suchstatements were made, not misleading with respect to the period covered by this report;
3. To the best of my knowledge, the financial statements, and other financial information included in this report,fairly present in all material respects the financial condition, results of operations and cash flows of the registrantas of, and for, the periods presented in this report;
4. The registrant’s other certifying officer and I are responsible for establishing and maintaining disclosurecontrols and procedures (as defined in Exchange Act Rules 13a-15(e) and 15d-15(e)) and internal control overfinancial reporting (as defined in Exchange Act Rules 13a-15(f) and 15d-15(f)) for the registrant and have:
(a) Designed such disclosure controls and procedures, or caused such disclosure controls and procedures to bedesigned under our supervision, to ensure that material information relating to the registrant, including itsconsolidated subsidiaries, is made known to us by others within those entities, particularly during the period inwhich this report is being prepared;
(b) Designed such internal control over financial reporting, or caused such internal control over financialreporting to be designed under our supervision, to provide reasonable assurance regarding the reliability offinancial reporting and the preparation of financial statements for external purposes in accordance with generallyaccepted accounting principles;
(c) Evaluated the effectiveness of the registrant’s disclosure controls and procedures and presented in this reportour conclusions about the effectiveness of the disclosure controls and procedures, as of the end of the periodcovered by this report based on such evaluation; and
(d) Disclosed in this report any change in the registrant’s internal control over financial reporting that occurredduring the registrant’s most recent fiscal quarter that has materially affected, or is reasonably likely to materiallyaffect, the registrant’s internal control over financial reporting; and
5. The registrant’s other certifying officer and I have disclosed, based on our most recent evaluation of internalcontrol over financial reporting, to the registrant’s auditors and the audit committee of the registrant’s board ofdirectors:
(a) All significant deficiencies and material weaknesses in the design or operation of internal control overfinancial reporting which are reasonably likely to adversely affect the registrant’s ability to record, process,summarize and report financial information; and
(b) Any fraud, whether or not material, that involves management or other employees who have a significant rolein the registrant’s internal control over financial reporting.
/s/ H. RICHARD WALTON
H. Richard WaltonChief Financial Officer
Date: January 27, 2015

Exhibit 32.1
CERTIFICATION PURSUANT TO18 U.S.C. SECTION 1350,
AS ADOPTED PURSUANT TOSECTION 906 OF THE SARBANES-OXLEY ACT OF 2002
In connection with the Annual Report of Flotek Industries, Inc. (the “Company”) on Form 10-K for the yearended December 31, 2014, as filed with the Securities and Exchange Commission on the date hereof (the“Report”), the undersigned hereby certifies, pursuant to 18 U.S.C. §1350, as adopted pursuant to § 906 of theSarbanes-Oxley Act of 2002, that:
(1) The Report fully complies with the requirements of section 13(a) or 15(d) of the Securities Exchange Act of1934; and
(2) The information contained in the Report fairly presents, in all material respects, the financial condition andresults of operations of the Company.
/s/ JOHN W. CHISHOLM
John W. ChisholmPresident, Chief Executive Officer andChairman of the Board
Date: January 27, 2015
Exhibit 32.2
CERTIFICATION PURSUANT TO18 U.S.C. SECTION 1350,
AS ADOPTED PURSUANT TOSECTION 906 OF THE SARBANES-OXLEY ACT OF 2002
In connection with the Annual Report of Flotek Industries, Inc. (the “Company”) on Form 10-K for the yearended December 31, 2014, as filed with the Securities and Exchange Commission on the date hereof (the“Report”), the undersigned hereby certifies, pursuant to 18 U.S.C. §1350, as adopted pursuant to § 906 of theSarbanes-Oxley Act of 2002, that:
(1) The Report fully complies with the requirements of section 13(a) or 15(d) of the Securities Exchange Act of1934; and
(2) The information contained in the Report fairly presents, in all material respects, the financial condition andresults of operations of the Company.
/s/ H. RICHARD WALTON
H. Richard WaltonChief Financial Officer
Date: January 27, 2015


CORPORATE DIRECTORY
Board of Directors
John W. ChisholmChairman of the Board
Kenneth T. HernLead DirectorChairman, Governance & Nominating CommitteeMember, Compensation CommitteeMember, Audit Committee
Ted BrownDirectorMember, Governance & Nominating Committee
L. Melvin CooperDirectorMember, Compensation CommitteeMember, Audit CommitteeMember, Governance & Nominating Committee
Carla Schulz HardyDirectorChairwoman, Compensation CommitteeMember, Governance & Nominating Committee
L.V. “Bud” McGuireDirectorMember, Compensation CommitteeMember, Governance & Nominating Committee
John S. ReilandDirectorChairman, Audit CommitteeMember, Compensation CommitteeMember, Governance & Nominating Committee
Executive Officers
John W. ChisholmChief Executive Officer and President
Steve ReevesExecutive Vice President, Operations
H. Richard WaltonExecutive Vice President, Chief Financial Officer
Josh SnivelyExecutive Vice President, Research & InnovationPresident of Florida Chemical Company, Inc.
SHAREHOLDER INFORMATION
Annual Meeting
Friday, April 24, 2015 – 2:00pm CDTFlotek Industries, Inc. Headquarters10603 W. Sam Houston Pkwy. N.Suite 300Houston, TX 77064
Stock Exchange Listing
The Company’s common stock tradeson the New York Stock Exchange,under the symbol “FTK.”
Transfer Agent
American Stock Transfer & Trust Company6201 15th Ave.Brooklyn, New York 11219800-937-5449
Auditors
Hein and Associates, LLP500 Dallas St Suittee 22990000Houston, TX 770002713-850-9814
©2015 FLOTEK INDUSTRIES, INCKate Damrich Lloyd Design
