2013 wage & fringe benefit report - ntma€¦ · dear member: i am pleased to present the 2013...
TRANSCRIPT
2013 Wage & Fringe Benefit
Report
Figures Based on 2012 Compensation Data
Confidential
NTMA

2013 Wage & Fringe Benefit
Report
Figures Based on 2012 Compensation Data
Confidential
PREPARED BY:
Mackay Research Group 4494 Coolidge Place Boulder, CO 80303
www.mackayresearchgroup.com
© National Tooling & Machining Association, 2013

Dear Member: I am pleased to present the 2013 Wage and Fringe Benefit Report, available exclusively to NTMA members. This report contains comprehensive, up-to-date wage and fringe benefit statistics for the precision custom manufacturing industry. Compiled from responses by 264 survey participants, covering over 25,592 employees in 37 wage classifications, the data presented in the following tables will help you see how competitive you are. The survey results are presented as follows:
Hourly Employee Wage Summary (by job description) Regional Analysis Sales Volume Analysis Line of Business Analysis
To gain the most benefit from this report, we recommend that you study the results carefully, comparing local/chapter, regional and national statistics to your company's wage and fringe benefit structure. A sample individual Annual Wage and Benefit Summary is also provided at the end of the report. Many members find it useful to calculate the total wage & benefit summary for each employee and share the overall hourly wage rate with them as a valuable means of employee communications. NTMA thanks those members who contributed data for this vital report. If you have any questions concerning this report, please contact Cindy Minn with NTMA at (800) 248-6862. Cordially, Dave Tilstone NTMA President

NTMA 2013 Wage & Fringe Benefit Report
Table Of Contents Introduction ........................................................................................................................................... 1
Hourly Employee Wage Summary ........................................................................................................ 2
Regional Analysis ................................................................................................................................. 3
New England (Connecticut, Maine, Massachusetts, New Hampshire, Rhode Island, Vermont) ........................ 15 Connecticut (CTMA)................................................................................................................... 15 Massachusetts (Boston Chapter) .................................................................................................. 15
Mid Atlantic (Delaware, Maryland, New Jersey, New York, Pennsylvania, Virginia, Washington D.C., West Virginia) .. 27 New York ................................................................................................................................. 27 Pennsylvania (Pittsburgh Chapter, Philadelphia/Delaware Valley Chapter) ................................................ 27
Southeast (Alabama, Florida, Georgia, Mississippi, North Carolina, South Carolina, Tennessee) ...................... 27 Nashville Chapter...................................................................................................................... 27
Midwest (Illinois, Indiana, Kentucky, Michigan, Minnesota, Ohio, Wisconsin)................................................. 39 Indiana (Michiana Chapter, Indianaoplis Chapter) .............................................................................. 39 Ohio (Cleveland Chapter) .............................................................................................................. 39
North Central (Colorado, Iowa, Kansas, Missouri, Montana, Nebraska, North Dakota, South Dakota, Utah, Wyoming) ... 51 Missouri (St. Louis Chapter, Kansas City Chapter) ................................................................................. 51 Colorado (Rocky Mountain Chapter) ................................................................................................. 51
West (Arizona, California, Idaho, Nevada, Oregon, Washington) ................................................................. 63 Arizona ..................................................................................................................................... 63 California (Los Angeles Chapter) ................................................................................................... 63
Sales Volume Analysis........................................................................................................................ 75
Line of Business Analysis (Tools & Dies, Molds, General Precision Machining, Aerospace Machining & Fabrication, Special Machines, Production Operations, Diversified) ............................................................................... 87
Annual Wage and Benefit Summary Sample .......................................................................................................................................... 99 Worksheet ................................................................................................................................... 100
Prepared For: Prepared By: National Tooling & Machining Association Mackay Research Group 6363 Oak Tree Boulevard 4494 Coolidge Place Independence, OH 44131 Boulder, CO 80303 800-248-6862 (voice) 720-890-4255 (voice) 720-890-8719 (fax) www.ntma.org www.mackayresearchgroup.com
© 2013 NTMA

1
Introduction
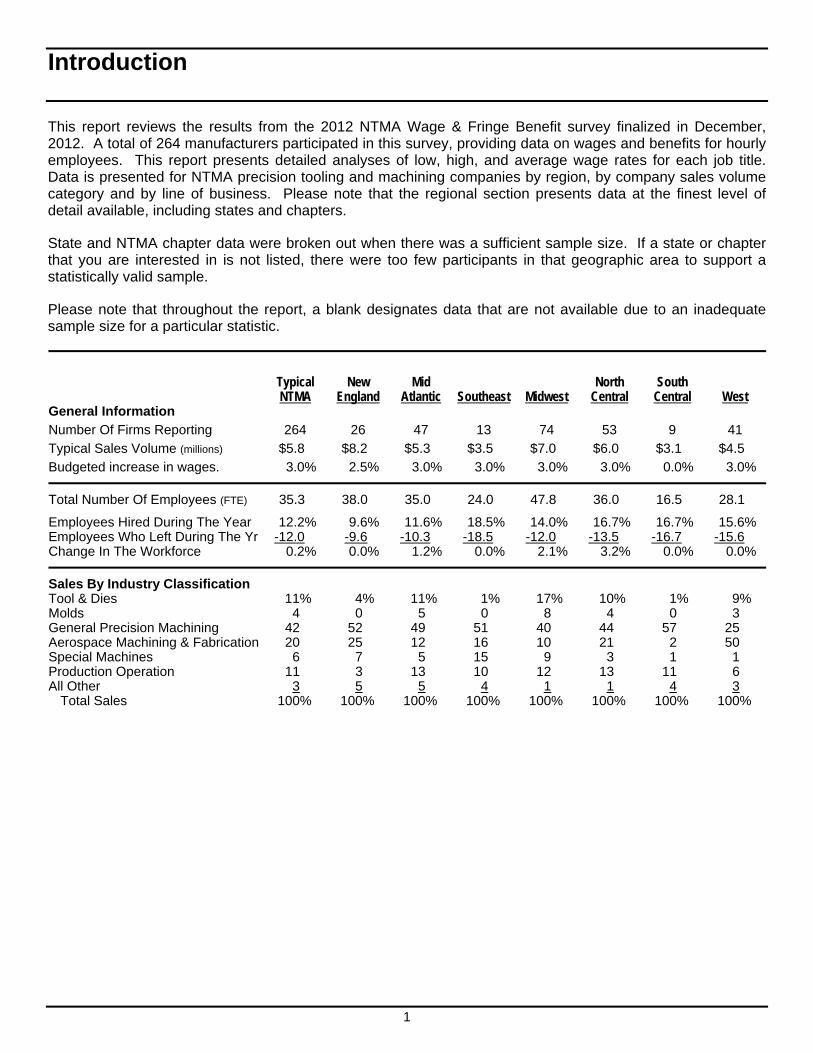
This report reviews the results from the 2012 NTMA Wage & Fringe Benefit survey finalized in December, 2012. A total of 264 manufacturers participated in this survey, providing data on wages and benefits for hourly employees. This report presents detailed analyses of low, high, and average wage rates for each job title. Data is presented for NTMA precision tooling and machining companies by region, by company sales volume category and by line of business. Please note that the regional section presents data at the finest level of detail available, including states and chapters.
State and NTMA chapter data were broken out when there was a sufficient sample size. If a state or chapter that you are interested in is not listed, there were too few participants in that geographic area to support a statistically valid sample.
Please note that throughout the report, a blank designates data that are not available due to an inadequate sample size for a particular statistic.
Typical New Mid North South NTMA England Atlantic Southeast Midwest Central Central West General Information
Number Of Firms Reporting 264 26 47 13 74 53 9 41
Typical Sales Volume (millions) $5.8 $8.2 $5.3 $3.5 $7.0 $6.0 $3.1 $4.5
Budgeted increase in wages. 3.0% 2.5% 3.0% 3.0% 3.0% 3.0% 0.0% 3.0%
Total Number Of Employees (FTE) 35.3 38.0 35.0 24.0 47.8 36.0 16.5 28.1
Employees Hired During The Year 12.2% 9.6% 11.6% 18.5% 14.0% 16.7% 16.7% 15.6% Employees Who Left During The Yr -12.0 -9.6 -10.3 -18.5 -12.0 -13.5 -16.7 -15.6 Change In The Workforce 0.2% 0.0% 1.2% 0.0% 2.1% 3.2% 0.0% 0.0%
Sales By Industry Classification Tool & Dies 11% 4% 11% 1% 17% 10% 1% 9% Molds 4 0 5 0 8 4 0 3 General Precision Machining 42 52 49 51 40 44 57 25 Aerospace Machining & Fabrication 20 25 12 16 10 21 2 50 Special Machines 6 7 5 15 9 3 1 1 Production Operation 11 3 13 10 12 13 11 6 All Other 3 5 5 4 1 1 4 3
Total Sales 100% 100% 100% 100% 100% 100% 100% 100%
2
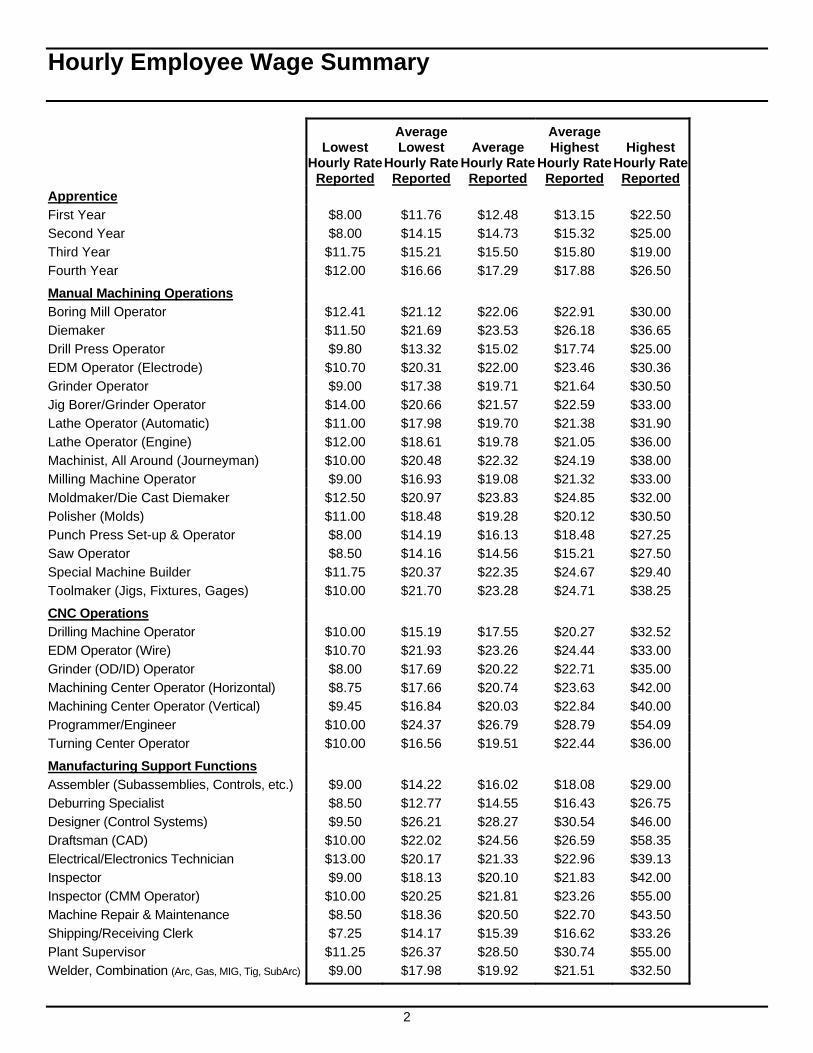
Hourly Employee Wage Summary
Lowest Hourly Rate
Reported
Average Lowest
Hourly Rate Reported
Average Hourly Rate
Reported
Average Highest
Hourly Rate Reported
Highest Hourly Rate
Reported Apprentice
First Year $8.00 $11.76 $12.48 $13.15 $22.50
Second Year $8.00 $14.15 $14.73 $15.32 $25.00
Third Year $11.75 $15.21 $15.50 $15.80 $19.00
Fourth Year $12.00 $16.66 $17.29 $17.88 $26.50
Manual Machining Operations
Boring Mill Operator $12.41 $21.12 $22.06 $22.91 $30.00
Diemaker $11.50 $21.69 $23.53 $26.18 $36.65
Drill Press Operator $9.80 $13.32 $15.02 $17.74 $25.00
EDM Operator (Electrode) $10.70 $20.31 $22.00 $23.46 $30.36
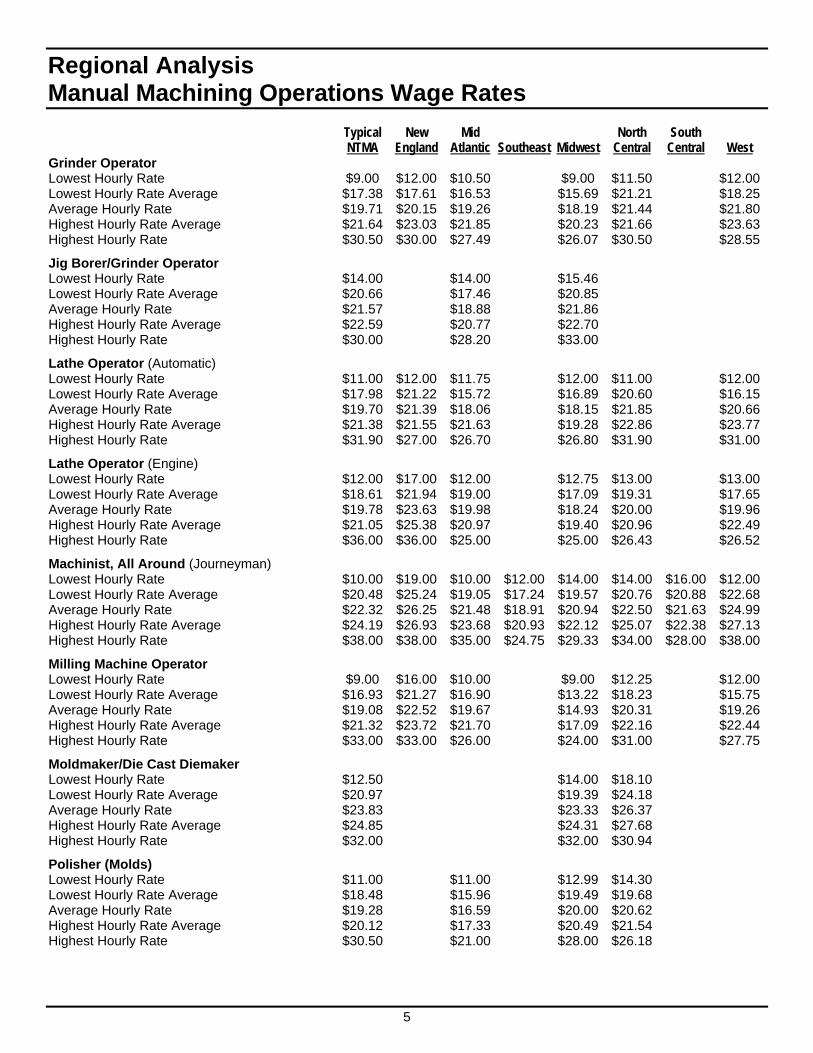
Grinder Operator $9.00 $17.38 $19.71 $21.64 $30.50
Jig Borer/Grinder Operator $14.00 $20.66 $21.57 $22.59 $33.00
Lathe Operator (Automatic) $11.00 $17.98 $19.70 $21.38 $31.90
Lathe Operator (Engine) $12.00 $18.61 $19.78 $21.05 $36.00
Machinist, All Around (Journeyman) $10.00 $20.48 $22.32 $24.19 $38.00
Milling Machine Operator $9.00 $16.93 $19.08 $21.32 $33.00
Moldmaker/Die Cast Diemaker $12.50 $20.97 $23.83 $24.85 $32.00
Polisher (Molds) $11.00 $18.48 $19.28 $20.12 $30.50
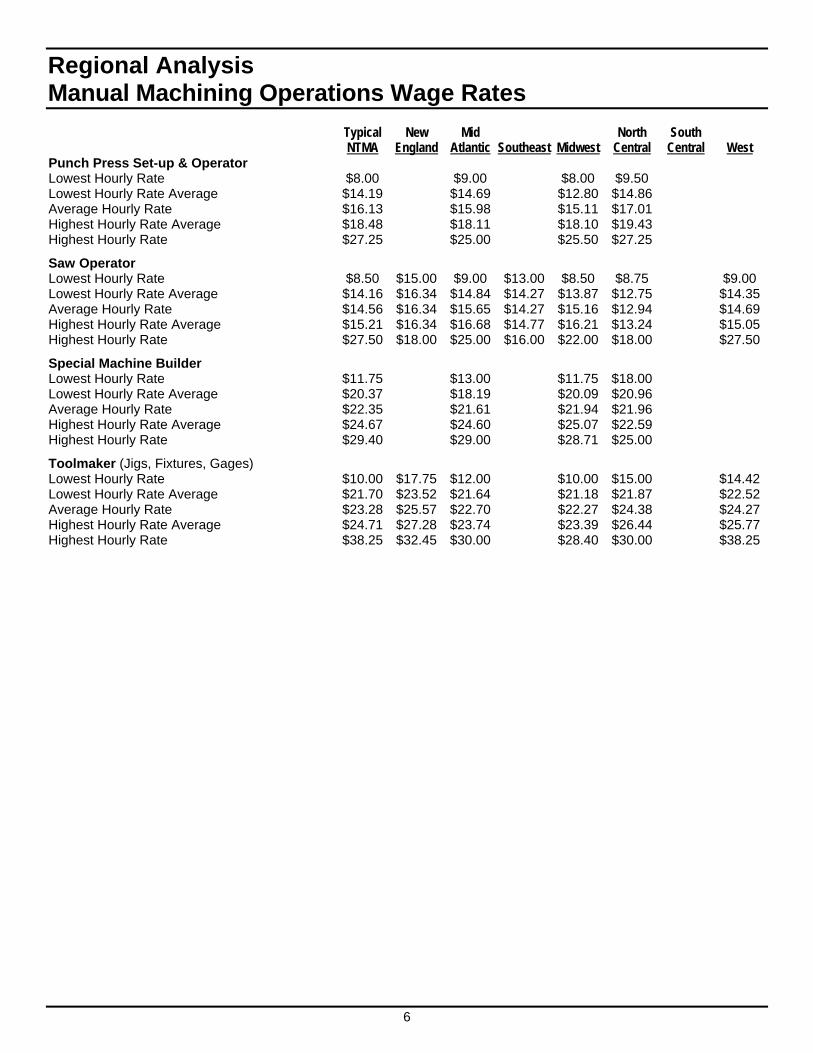
Punch Press Set-up & Operator $8.00 $14.19 $16.13 $18.48 $27.25
Saw Operator $8.50 $14.16 $14.56 $15.21 $27.50
Special Machine Builder $11.75 $20.37 $22.35 $24.67 $29.40
Toolmaker (Jigs, Fixtures, Gages) $10.00 $21.70 $23.28 $24.71 $38.25
CNC Operations
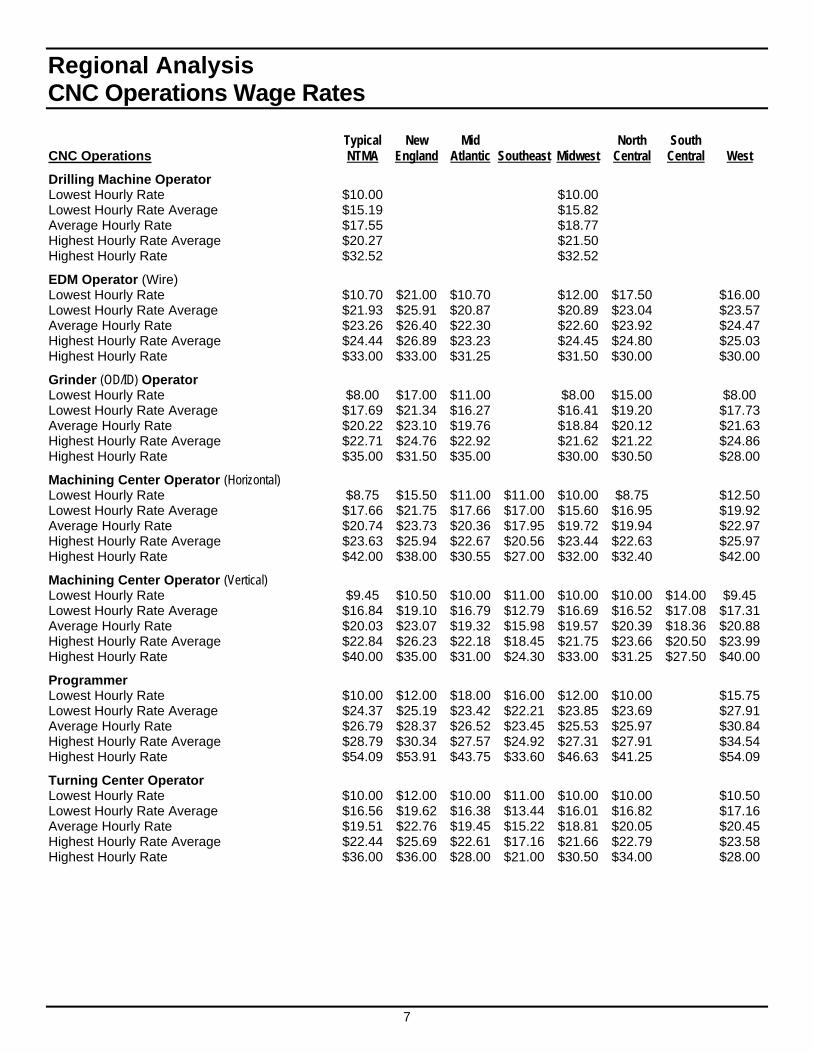
Drilling Machine Operator $10.00 $15.19 $17.55 $20.27 $32.52
EDM Operator (Wire) $10.70 $21.93 $23.26 $24.44 $33.00
Grinder (OD/ID) Operator $8.00 $17.69 $20.22 $22.71 $35.00
Machining Center Operator (Horizontal) $8.75 $17.66 $20.74 $23.63 $42.00
Machining Center Operator (Vertical) $9.45 $16.84 $20.03 $22.84 $40.00
Programmer/Engineer $10.00 $24.37 $26.79 $28.79 $54.09
Turning Center Operator $10.00 $16.56 $19.51 $22.44 $36.00
Manufacturing Support Functions
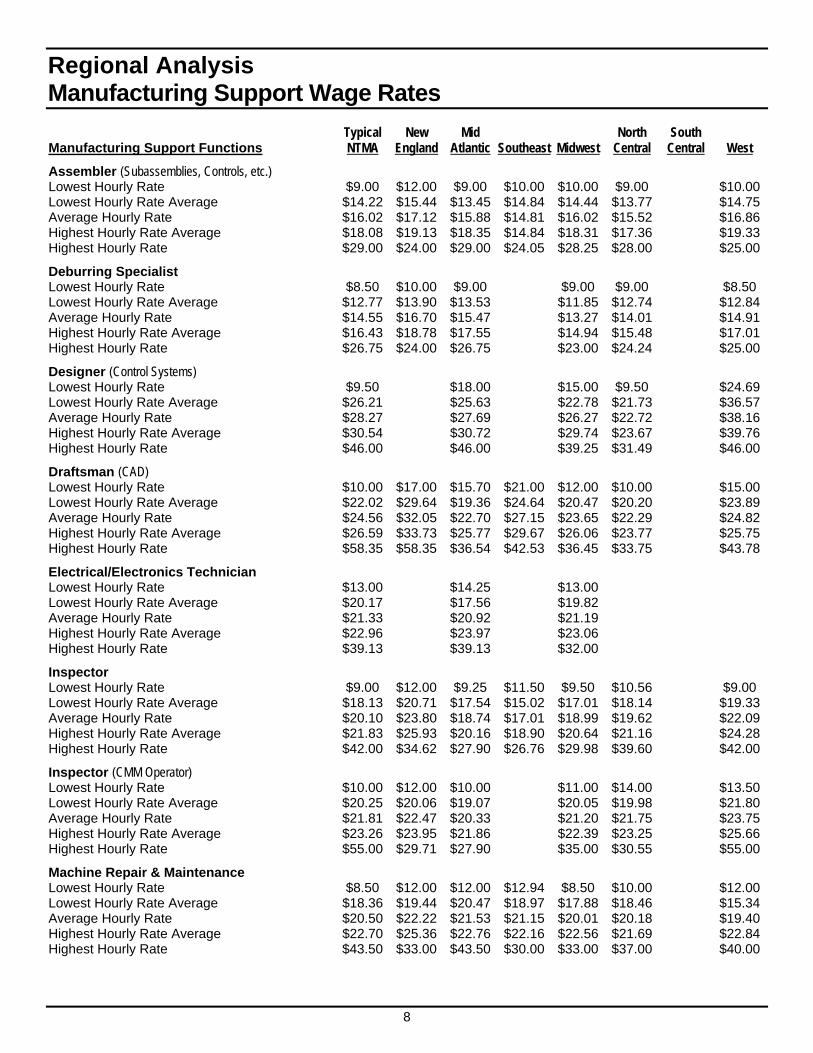
Assembler (Subassemblies, Controls, etc.) $9.00 $14.22 $16.02 $18.08 $29.00
Deburring Specialist $8.50 $12.77 $14.55 $16.43 $26.75
Designer (Control Systems) $9.50 $26.21 $28.27 $30.54 $46.00
Draftsman (CAD) $10.00 $22.02 $24.56 $26.59 $58.35
Electrical/Electronics Technician $13.00 $20.17 $21.33 $22.96 $39.13
Inspector $9.00 $18.13 $20.10 $21.83 $42.00
Inspector (CMM Operator) $10.00 $20.25 $21.81 $23.26 $55.00
Machine Repair & Maintenance $8.50 $18.36 $20.50 $22.70 $43.50
Shipping/Receiving Clerk $7.25 $14.17 $15.39 $16.62 $33.26
Plant Supervisor $11.25 $26.37 $28.50 $30.74 $55.00
Welder, Combination (Arc, Gas, MIG, Tig, SubArc) $9.00 $17.98 $19.92 $21.51 $32.50
3
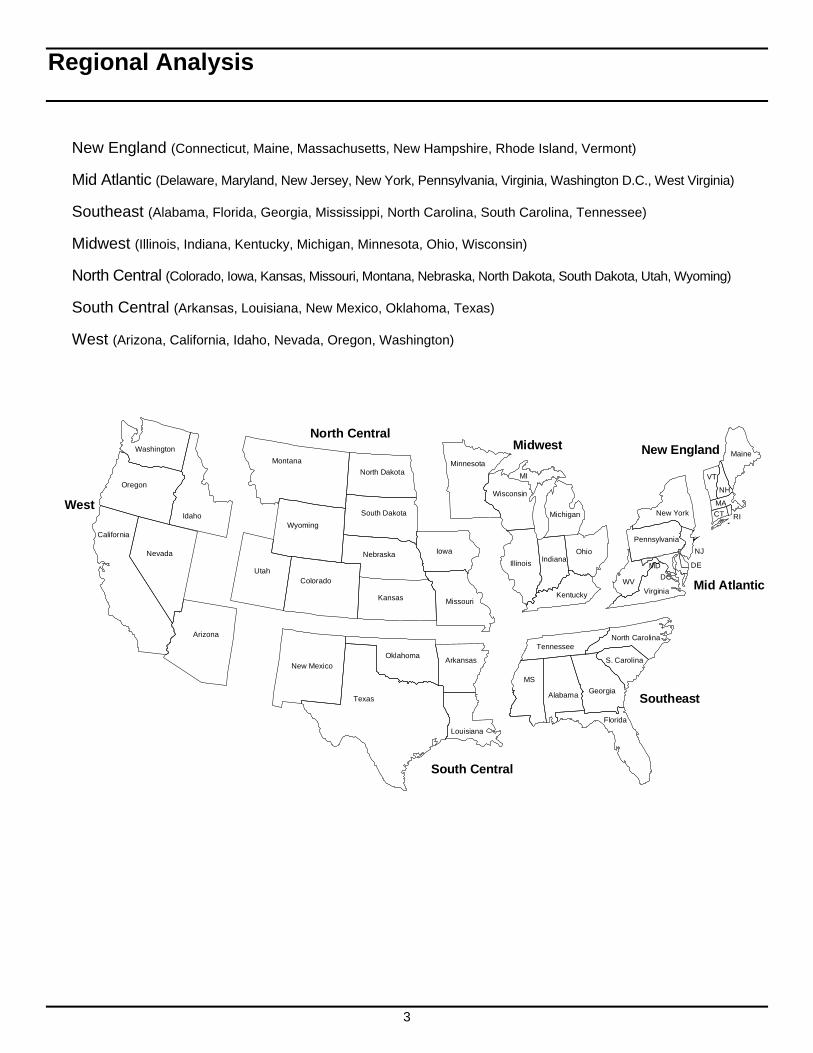
Regional Analysis
New England (Connecticut, Maine, Massachusetts, New Hampshire, Rhode Island, Vermont)
Mid Atlantic (Delaware, Maryland, New Jersey, New York, Pennsylvania, Virginia, Washington D.C., West Virginia)
Southeast (Alabama, Florida, Georgia, Mississippi, North Carolina, South Carolina, Tennessee)
Midwest (Illinois, Indiana, Kentucky, Michigan, Minnesota, Ohio, Wisconsin)
North Central (Colorado, Iowa, Kansas, Missouri, Montana, Nebraska, North Dakota, South Dakota, Utah, Wyoming)
South Central (Arkansas, Louisiana, New Mexico, Oklahoma, Texas)
West (Arizona, California, Idaho, Nevada, Oregon, Washington)
Maine
VT
NH
MA
CT RI
VirginiaWV
Pennsylvania
New York
MD
NJ
DE
DC
New England
MS
AlabamaGeorgia
Florida
TennesseeNorth Carolina
S. Carolina
Southeast
New Mexico
Texas
OklahomaArkansas
Louisiana
South Central
Kentucky
Minnesota
IllinoisIndiana
Ohio
Michigan
Wisconsin
MI
MidwestMontana
Wyoming
North Dakota
South Dakota
Nebraska
UtahColorado
Kansas Missouri
Iowa
North CentralWashington
Oregon
California
Nevada
Arizona
IdahoWest
Mid Atlantic
4
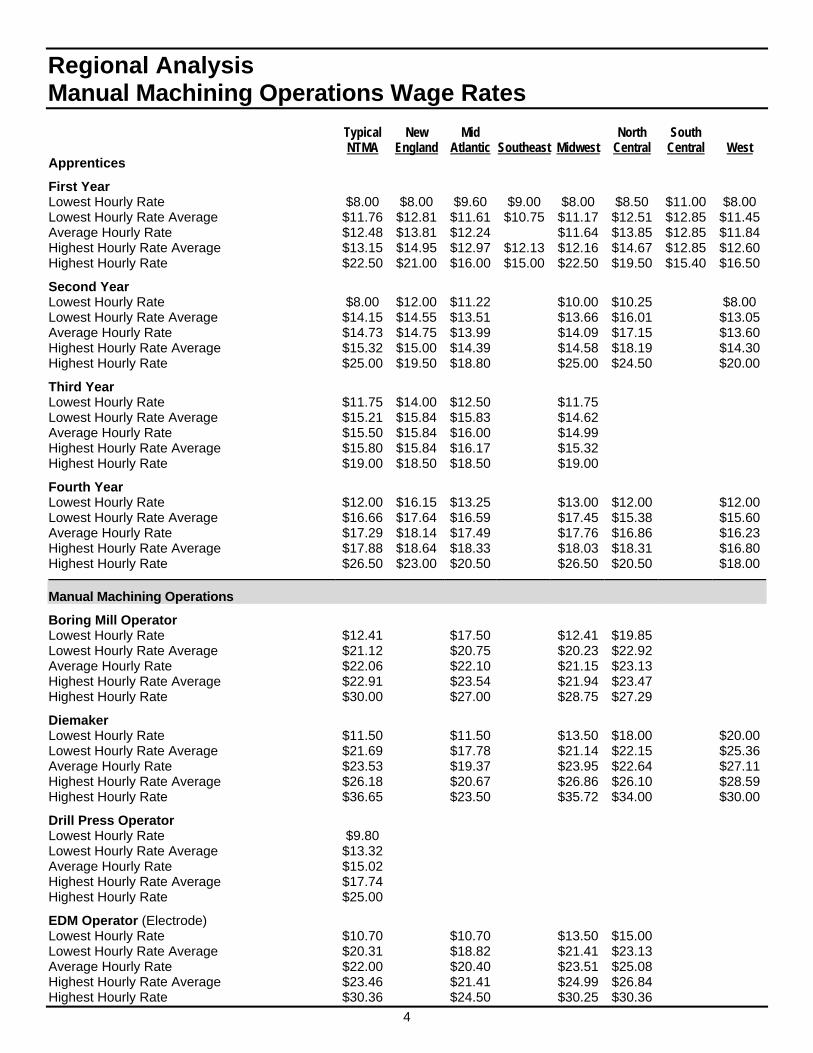
Regional Analysis Manual Machining Operations Wage Rates Typical New Mid North South NTMA England Atlantic Southeast Midwest Central Central West Apprentices
First Year Lowest Hourly Rate $8.00 $8.00 $9.60 $9.00 $8.00 $8.50 $11.00 $8.00 Lowest Hourly Rate Average $11.76 $12.81 $11.61 $10.75 $11.17 $12.51 $12.85 $11.45Average Hourly Rate $12.48 $13.81 $12.24 $11.64 $13.85 $12.85 $11.84Highest Hourly Rate Average $13.15 $14.95 $12.97 $12.13 $12.16 $14.67 $12.85 $12.60Highest Hourly Rate $22.50 $21.00 $16.00 $15.00 $22.50 $19.50 $15.40 $16.50
Second Year Lowest Hourly Rate $8.00 $12.00 $11.22 $10.00 $10.25 $8.00 Lowest Hourly Rate Average $14.15 $14.55 $13.51 $13.66 $16.01 $13.05Average Hourly Rate $14.73 $14.75 $13.99 $14.09 $17.15 $13.60Highest Hourly Rate Average $15.32 $15.00 $14.39 $14.58 $18.19 $14.30Highest Hourly Rate $25.00 $19.50 $18.80 $25.00 $24.50 $20.00
Third Year Lowest Hourly Rate $11.75 $14.00 $12.50 $11.75 Lowest Hourly Rate Average $15.21 $15.84 $15.83 $14.62 Average Hourly Rate $15.50 $15.84 $16.00 $14.99 Highest Hourly Rate Average $15.80 $15.84 $16.17 $15.32 Highest Hourly Rate $19.00 $18.50 $18.50 $19.00
Fourth Year Lowest Hourly Rate $12.00 $16.15 $13.25 $13.00 $12.00 $12.00Lowest Hourly Rate Average $16.66 $17.64 $16.59 $17.45 $15.38 $15.60Average Hourly Rate $17.29 $18.14 $17.49 $17.76 $16.86 $16.23Highest Hourly Rate Average $17.88 $18.64 $18.33 $18.03 $18.31 $16.80Highest Hourly Rate $26.50 $23.00 $20.50 $26.50 $20.50 $18.00
Manual Machining Operations
Boring Mill Operator Lowest Hourly Rate $12.41 $17.50 $12.41 $19.85 Lowest Hourly Rate Average $21.12 $20.75 $20.23 $22.92 Average Hourly Rate $22.06 $22.10 $21.15 $23.13 Highest Hourly Rate Average $22.91 $23.54 $21.94 $23.47 Highest Hourly Rate $30.00 $27.00 $28.75 $27.29
Diemaker Lowest Hourly Rate $11.50 $11.50 $13.50 $18.00 $20.00Lowest Hourly Rate Average $21.69 $17.78 $21.14 $22.15 $25.36Average Hourly Rate $23.53 $19.37 $23.95 $22.64 $27.11Highest Hourly Rate Average $26.18 $20.67 $26.86 $26.10 $28.59Highest Hourly Rate $36.65 $23.50 $35.72 $34.00 $30.00
Drill Press Operator Lowest Hourly Rate $9.80 Lowest Hourly Rate Average $13.32 Average Hourly Rate $15.02 Highest Hourly Rate Average $17.74 Highest Hourly Rate $25.00
EDM Operator (Electrode) Lowest Hourly Rate $10.70 $10.70 $13.50 $15.00 Lowest Hourly Rate Average $20.31 $18.82 $21.41 $23.13 Average Hourly Rate $22.00 $20.40 $23.51 $25.08 Highest Hourly Rate Average $23.46 $21.41 $24.99 $26.84 Highest Hourly Rate $30.36 $24.50 $30.25 $30.36
5
Regional Analysis Manual Machining Operations Wage Rates Typical New Mid North South NTMA England Atlantic Southeast Midwest Central Central West Grinder Operator Lowest Hourly Rate $9.00 $12.00 $10.50 $9.00 $11.50 $12.00Lowest Hourly Rate Average $17.38 $17.61 $16.53 $15.69 $21.21 $18.25Average Hourly Rate $19.71 $20.15 $19.26 $18.19 $21.44 $21.80Highest Hourly Rate Average $21.64 $23.03 $21.85 $20.23 $21.66 $23.63Highest Hourly Rate $30.50 $30.00 $27.49 $26.07 $30.50 $28.55
Jig Borer/Grinder Operator Lowest Hourly Rate $14.00 $14.00 $15.46 Lowest Hourly Rate Average $20.66 $17.46 $20.85 Average Hourly Rate $21.57 $18.88 $21.86 Highest Hourly Rate Average $22.59 $20.77 $22.70 Highest Hourly Rate $30.00 $28.20 $33.00
Lathe Operator (Automatic) Lowest Hourly Rate $11.00 $12.00 $11.75 $12.00 $11.00 $12.00Lowest Hourly Rate Average $17.98 $21.22 $15.72 $16.89 $20.60 $16.15Average Hourly Rate $19.70 $21.39 $18.06 $18.15 $21.85 $20.66Highest Hourly Rate Average $21.38 $21.55 $21.63 $19.28 $22.86 $23.77Highest Hourly Rate $31.90 $27.00 $26.70 $26.80 $31.90 $31.00
Lathe Operator (Engine) Lowest Hourly Rate $12.00 $17.00 $12.00 $12.75 $13.00 $13.00Lowest Hourly Rate Average $18.61 $21.94 $19.00 $17.09 $19.31 $17.65Average Hourly Rate $19.78 $23.63 $19.98 $18.24 $20.00 $19.96Highest Hourly Rate Average $21.05 $25.38 $20.97 $19.40 $20.96 $22.49Highest Hourly Rate $36.00 $36.00 $25.00 $25.00 $26.43 $26.52
Machinist, All Around (Journeyman) Lowest Hourly Rate $10.00 $19.00 $10.00 $12.00 $14.00 $14.00 $16.00 $12.00Lowest Hourly Rate Average $20.48 $25.24 $19.05 $17.24 $19.57 $20.76 $20.88 $22.68Average Hourly Rate $22.32 $26.25 $21.48 $18.91 $20.94 $22.50 $21.63 $24.99Highest Hourly Rate Average $24.19 $26.93 $23.68 $20.93 $22.12 $25.07 $22.38 $27.13Highest Hourly Rate $38.00 $38.00 $35.00 $24.75 $29.33 $34.00 $28.00 $38.00
Milling Machine Operator Lowest Hourly Rate $9.00 $16.00 $10.00 $9.00 $12.25 $12.00Lowest Hourly Rate Average $16.93 $21.27 $16.90 $13.22 $18.23 $15.75Average Hourly Rate $19.08 $22.52 $19.67 $14.93 $20.31 $19.26Highest Hourly Rate Average $21.32 $23.72 $21.70 $17.09 $22.16 $22.44Highest Hourly Rate $33.00 $33.00 $26.00 $24.00 $31.00 $27.75
Moldmaker/Die Cast Diemaker Lowest Hourly Rate $12.50 $14.00 $18.10 Lowest Hourly Rate Average $20.97 $19.39 $24.18 Average Hourly Rate $23.83 $23.33 $26.37 Highest Hourly Rate Average $24.85 $24.31 $27.68 Highest Hourly Rate $32.00 $32.00 $30.94
Polisher (Molds) Lowest Hourly Rate $11.00 $11.00 $12.99 $14.30 Lowest Hourly Rate Average $18.48 $15.96 $19.49 $19.68 Average Hourly Rate $19.28 $16.59 $20.00 $20.62 Highest Hourly Rate Average $20.12 $17.33 $20.49 $21.54 Highest Hourly Rate $30.50 $21.00 $28.00 $26.18
6
Regional Analysis Manual Machining Operations Wage Rates Typical New Mid North South NTMA England Atlantic Southeast Midwest Central Central West Punch Press Set-up & Operator Lowest Hourly Rate $8.00 $9.00 $8.00 $9.50 Lowest Hourly Rate Average $14.19 $14.69 $12.80 $14.86 Average Hourly Rate $16.13 $15.98 $15.11 $17.01 Highest Hourly Rate Average $18.48 $18.11 $18.10 $19.43 Highest Hourly Rate $27.25 $25.00 $25.50 $27.25
Saw Operator Lowest Hourly Rate $8.50 $15.00 $9.00 $13.00 $8.50 $8.75 $9.00 Lowest Hourly Rate Average $14.16 $16.34 $14.84 $14.27 $13.87 $12.75 $14.35Average Hourly Rate $14.56 $16.34 $15.65 $14.27 $15.16 $12.94 $14.69Highest Hourly Rate Average $15.21 $16.34 $16.68 $14.77 $16.21 $13.24 $15.05Highest Hourly Rate $27.50 $18.00 $25.00 $16.00 $22.00 $18.00 $27.50
Special Machine Builder Lowest Hourly Rate $11.75 $13.00 $11.75 $18.00 Lowest Hourly Rate Average $20.37 $18.19 $20.09 $20.96 Average Hourly Rate $22.35 $21.61 $21.94 $21.96 Highest Hourly Rate Average $24.67 $24.60 $25.07 $22.59 Highest Hourly Rate $29.40 $29.00 $28.71 $25.00
Toolmaker (Jigs, Fixtures, Gages) Lowest Hourly Rate $10.00 $17.75 $12.00 $10.00 $15.00 $14.42Lowest Hourly Rate Average $21.70 $23.52 $21.64 $21.18 $21.87 $22.52Average Hourly Rate $23.28 $25.57 $22.70 $22.27 $24.38 $24.27Highest Hourly Rate Average $24.71 $27.28 $23.74 $23.39 $26.44 $25.77Highest Hourly Rate $38.25 $32.45 $30.00 $28.40 $30.00 $38.25
7
Regional Analysis CNC Operations Wage Rates Typical New Mid North South CNC Operations NTMA England Atlantic Southeast Midwest Central Central West
Drilling Machine Operator Lowest Hourly Rate $10.00 $10.00 Lowest Hourly Rate Average $15.19 $15.82 Average Hourly Rate $17.55 $18.77 Highest Hourly Rate Average $20.27 $21.50 Highest Hourly Rate $32.52 $32.52
EDM Operator (Wire) Lowest Hourly Rate $10.70 $21.00 $10.70 $12.00 $17.50 $16.00Lowest Hourly Rate Average $21.93 $25.91 $20.87 $20.89 $23.04 $23.57Average Hourly Rate $23.26 $26.40 $22.30 $22.60 $23.92 $24.47Highest Hourly Rate Average $24.44 $26.89 $23.23 $24.45 $24.80 $25.03Highest Hourly Rate $33.00 $33.00 $31.25 $31.50 $30.00 $30.00
Grinder (OD/ID) Operator Lowest Hourly Rate $8.00 $17.00 $11.00 $8.00 $15.00 $8.00 Lowest Hourly Rate Average $17.69 $21.34 $16.27 $16.41 $19.20 $17.73Average Hourly Rate $20.22 $23.10 $19.76 $18.84 $20.12 $21.63Highest Hourly Rate Average $22.71 $24.76 $22.92 $21.62 $21.22 $24.86Highest Hourly Rate $35.00 $31.50 $35.00 $30.00 $30.50 $28.00
Machining Center Operator (Horizontal) Lowest Hourly Rate $8.75 $15.50 $11.00 $11.00 $10.00 $8.75 $12.50Lowest Hourly Rate Average $17.66 $21.75 $17.66 $17.00 $15.60 $16.95 $19.92Average Hourly Rate $20.74 $23.73 $20.36 $17.95 $19.72 $19.94 $22.97Highest Hourly Rate Average $23.63 $25.94 $22.67 $20.56 $23.44 $22.63 $25.97Highest Hourly Rate $42.00 $38.00 $30.55 $27.00 $32.00 $32.40 $42.00
Machining Center Operator (Vertical) Lowest Hourly Rate $9.45 $10.50 $10.00 $11.00 $10.00 $10.00 $14.00 $9.45 Lowest Hourly Rate Average $16.84 $19.10 $16.79 $12.79 $16.69 $16.52 $17.08 $17.31Average Hourly Rate $20.03 $23.07 $19.32 $15.98 $19.57 $20.39 $18.36 $20.88Highest Hourly Rate Average $22.84 $26.23 $22.18 $18.45 $21.75 $23.66 $20.50 $23.99Highest Hourly Rate $40.00 $35.00 $31.00 $24.30 $33.00 $31.25 $27.50 $40.00
Programmer Lowest Hourly Rate $10.00 $12.00 $18.00 $16.00 $12.00 $10.00 $15.75Lowest Hourly Rate Average $24.37 $25.19 $23.42 $22.21 $23.85 $23.69 $27.91Average Hourly Rate $26.79 $28.37 $26.52 $23.45 $25.53 $25.97 $30.84Highest Hourly Rate Average $28.79 $30.34 $27.57 $24.92 $27.31 $27.91 $34.54Highest Hourly Rate $54.09 $53.91 $43.75 $33.60 $46.63 $41.25 $54.09
Turning Center Operator Lowest Hourly Rate $10.00 $12.00 $10.00 $11.00 $10.00 $10.00 $10.50Lowest Hourly Rate Average $16.56 $19.62 $16.38 $13.44 $16.01 $16.82 $17.16Average Hourly Rate $19.51 $22.76 $19.45 $15.22 $18.81 $20.05 $20.45Highest Hourly Rate Average $22.44 $25.69 $22.61 $17.16 $21.66 $22.79 $23.58Highest Hourly Rate $36.00 $36.00 $28.00 $21.00 $30.50 $34.00 $28.00
8
Regional Analysis Manufacturing Support Wage Rates Typical New Mid North South Manufacturing Support Functions NTMA England Atlantic Southeast Midwest Central Central West
Assembler (Subassemblies, Controls, etc.) Lowest Hourly Rate $9.00 $12.00 $9.00 $10.00 $10.00 $9.00 $10.00Lowest Hourly Rate Average $14.22 $15.44 $13.45 $14.84 $14.44 $13.77 $14.75Average Hourly Rate $16.02 $17.12 $15.88 $14.81 $16.02 $15.52 $16.86Highest Hourly Rate Average $18.08 $19.13 $18.35 $14.84 $18.31 $17.36 $19.33Highest Hourly Rate $29.00 $24.00 $29.00 $24.05 $28.25 $28.00 $25.00
Deburring Specialist Lowest Hourly Rate $8.50 $10.00 $9.00 $9.00 $9.00 $8.50 Lowest Hourly Rate Average $12.77 $13.90 $13.53 $11.85 $12.74 $12.84Average Hourly Rate $14.55 $16.70 $15.47 $13.27 $14.01 $14.91Highest Hourly Rate Average $16.43 $18.78 $17.55 $14.94 $15.48 $17.01Highest Hourly Rate $26.75 $24.00 $26.75 $23.00 $24.24 $25.00
Designer (Control Systems) Lowest Hourly Rate $9.50 $18.00 $15.00 $9.50 $24.69Lowest Hourly Rate Average $26.21 $25.63 $22.78 $21.73 $36.57Average Hourly Rate $28.27 $27.69 $26.27 $22.72 $38.16Highest Hourly Rate Average $30.54 $30.72 $29.74 $23.67 $39.76Highest Hourly Rate $46.00 $46.00 $39.25 $31.49 $46.00
Draftsman (CAD) Lowest Hourly Rate $10.00 $17.00 $15.70 $21.00 $12.00 $10.00 $15.00Lowest Hourly Rate Average $22.02 $29.64 $19.36 $24.64 $20.47 $20.20 $23.89Average Hourly Rate $24.56 $32.05 $22.70 $27.15 $23.65 $22.29 $24.82Highest Hourly Rate Average $26.59 $33.73 $25.77 $29.67 $26.06 $23.77 $25.75Highest Hourly Rate $58.35 $58.35 $36.54 $42.53 $36.45 $33.75 $43.78
Electrical/Electronics Technician Lowest Hourly Rate $13.00 $14.25 $13.00 Lowest Hourly Rate Average $20.17 $17.56 $19.82 Average Hourly Rate $21.33 $20.92 $21.19 Highest Hourly Rate Average $22.96 $23.97 $23.06 Highest Hourly Rate $39.13 $39.13 $32.00
Inspector Lowest Hourly Rate $9.00 $12.00 $9.25 $11.50 $9.50 $10.56 $9.00 Lowest Hourly Rate Average $18.13 $20.71 $17.54 $15.02 $17.01 $18.14 $19.33Average Hourly Rate $20.10 $23.80 $18.74 $17.01 $18.99 $19.62 $22.09Highest Hourly Rate Average $21.83 $25.93 $20.16 $18.90 $20.64 $21.16 $24.28Highest Hourly Rate $42.00 $34.62 $27.90 $26.76 $29.98 $39.60 $42.00
Inspector (CMM Operator) Lowest Hourly Rate $10.00 $12.00 $10.00 $11.00 $14.00 $13.50Lowest Hourly Rate Average $20.25 $20.06 $19.07 $20.05 $19.98 $21.80Average Hourly Rate $21.81 $22.47 $20.33 $21.20 $21.75 $23.75Highest Hourly Rate Average $23.26 $23.95 $21.86 $22.39 $23.25 $25.66Highest Hourly Rate $55.00 $29.71 $27.90 $35.00 $30.55 $55.00
Machine Repair & Maintenance Lowest Hourly Rate $8.50 $12.00 $12.00 $12.94 $8.50 $10.00 $12.00Lowest Hourly Rate Average $18.36 $19.44 $20.47 $18.97 $17.88 $18.46 $15.34Average Hourly Rate $20.50 $22.22 $21.53 $21.15 $20.01 $20.18 $19.40Highest Hourly Rate Average $22.70 $25.36 $22.76 $22.16 $22.56 $21.69 $22.84Highest Hourly Rate $43.50 $33.00 $43.50 $30.00 $33.00 $37.00 $40.00
9
Regional Analysis Manufacturing Support Wage Rates Typical New Mid North South Manufacturing Support Functions NTMA England Atlantic Southeast Midwest Central Central West
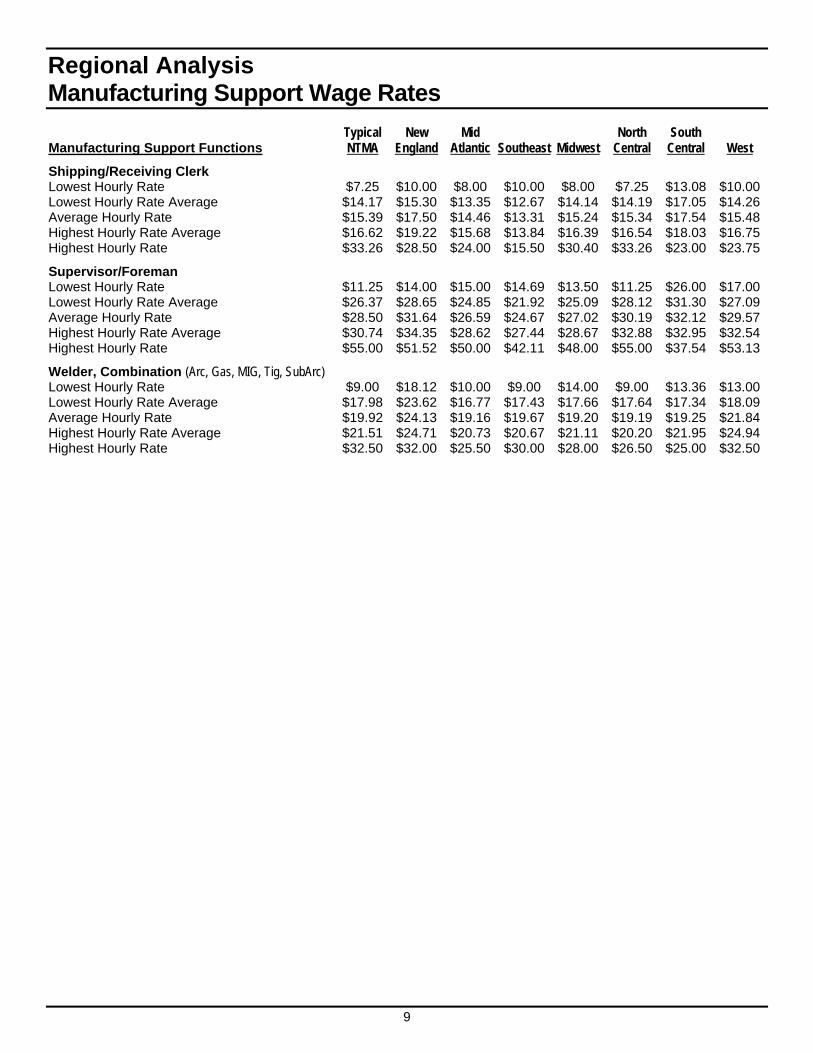
Shipping/Receiving Clerk Lowest Hourly Rate $7.25 $10.00 $8.00 $10.00 $8.00 $7.25 $13.08 $10.00Lowest Hourly Rate Average $14.17 $15.30 $13.35 $12.67 $14.14 $14.19 $17.05 $14.26Average Hourly Rate $15.39 $17.50 $14.46 $13.31 $15.24 $15.34 $17.54 $15.48Highest Hourly Rate Average $16.62 $19.22 $15.68 $13.84 $16.39 $16.54 $18.03 $16.75Highest Hourly Rate $33.26 $28.50 $24.00 $15.50 $30.40 $33.26 $23.00 $23.75
Supervisor/Foreman Lowest Hourly Rate $11.25 $14.00 $15.00 $14.69 $13.50 $11.25 $26.00 $17.00Lowest Hourly Rate Average $26.37 $28.65 $24.85 $21.92 $25.09 $28.12 $31.30 $27.09Average Hourly Rate $28.50 $31.64 $26.59 $24.67 $27.02 $30.19 $32.12 $29.57Highest Hourly Rate Average $30.74 $34.35 $28.62 $27.44 $28.67 $32.88 $32.95 $32.54Highest Hourly Rate $55.00 $51.52 $50.00 $42.11 $48.00 $55.00 $37.54 $53.13
Welder, Combination (Arc, Gas, MIG, Tig, SubArc) Lowest Hourly Rate $9.00 $18.12 $10.00 $9.00 $14.00 $9.00 $13.36 $13.00Lowest Hourly Rate Average $17.98 $23.62 $16.77 $17.43 $17.66 $17.64 $17.34 $18.09Average Hourly Rate $19.92 $24.13 $19.16 $19.67 $19.20 $19.19 $19.25 $21.84Highest Hourly Rate Average $21.51 $24.71 $20.73 $20.67 $21.11 $20.20 $21.95 $24.94Highest Hourly Rate $32.50 $32.00 $25.50 $30.00 $28.00 $26.50 $25.00 $32.50
10
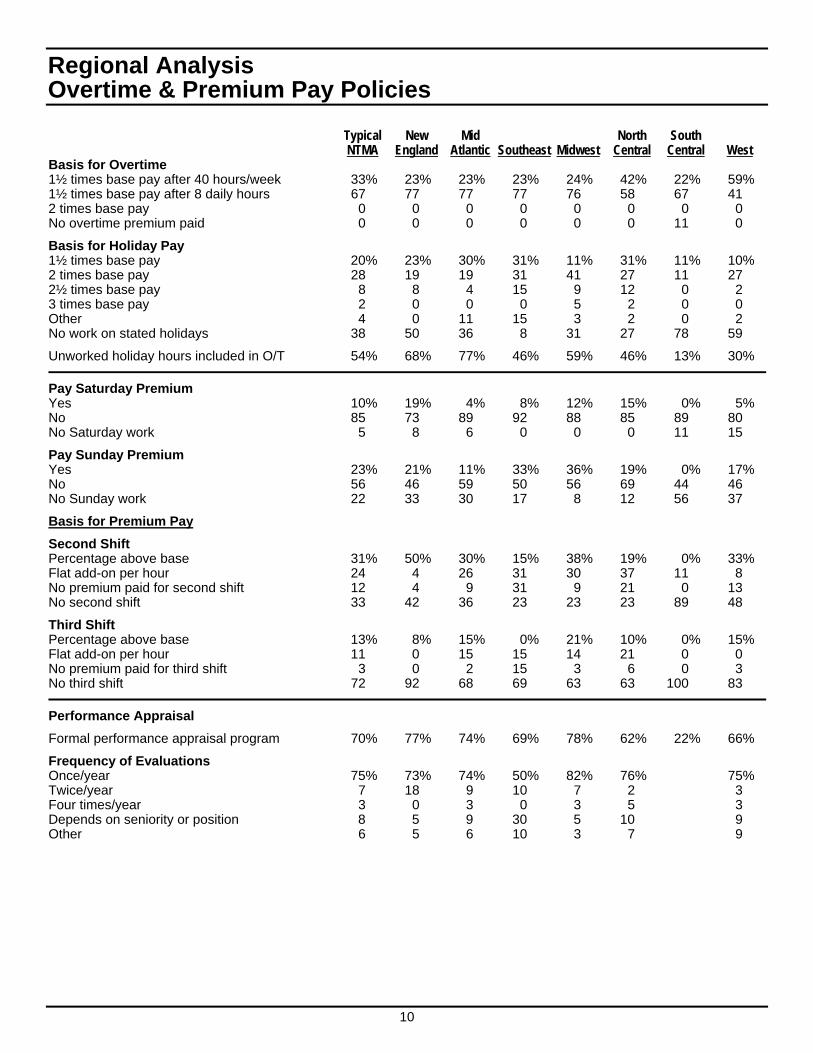
Regional Analysis Overtime & Premium Pay Policies Typical New Mid North South NTMA England Atlantic Southeast Midwest Central Central West Basis for Overtime 1½ times base pay after 40 hours/week 33% 23% 23% 23% 24% 42% 22% 59% 1½ times base pay after 8 daily hours 67 77 77 77 76 58 67 41 2 times base pay 0 0 0 0 0 0 0 0 No overtime premium paid 0 0 0 0 0 0 11 0
Basis for Holiday Pay 1½ times base pay 20% 23% 30% 31% 11% 31% 11% 10% 2 times base pay 28 19 19 31 41 27 11 27 2½ times base pay 8 8 4 15 9 12 0 2 3 times base pay 2 0 0 0 5 2 0 0 Other 4 0 11 15 3 2 0 2 No work on stated holidays 38 50 36 8 31 27 78 59
Unworked holiday hours included in O/T 54% 68% 77% 46% 59% 46% 13% 30%
Pay Saturday Premium Yes 10% 19% 4% 8% 12% 15% 0% 5% No 85 73 89 92 88 85 89 80 No Saturday work 5 8 6 0 0 0 11 15
Pay Sunday Premium Yes 23% 21% 11% 33% 36% 19% 0% 17% No 56 46 59 50 56 69 44 46 No Sunday work 22 33 30 17 8 12 56 37
Basis for Premium Pay
Second Shift Percentage above base 31% 50% 30% 15% 38% 19% 0% 33% Flat add-on per hour 24 4 26 31 30 37 11 8 No premium paid for second shift 12 4 9 31 9 21 0 13 No second shift 33 42 36 23 23 23 89 48
Third Shift Percentage above base 13% 8% 15% 0% 21% 10% 0% 15% Flat add-on per hour 11 0 15 15 14 21 0 0 No premium paid for third shift 3 0 2 15 3 6 0 3 No third shift 72 92 68 69 63 63 100 83
Performance Appraisal
Formal performance appraisal program 70% 77% 74% 69% 78% 62% 22% 66%
Frequency of Evaluations Once/year 75% 73% 74% 50% 82% 76% 75% Twice/year 7 18 9 10 7 2 3 Four times/year 3 0 3 0 3 5 3 Depends on seniority or position 8 5 9 30 5 10 9 Other 6 5 6 10 3 7 9
11
Regional Analysis Safety Policies Typical New Mid North South NTMA England Atlantic Southeast Midwest Central Central West
Provision of Safety Glasses
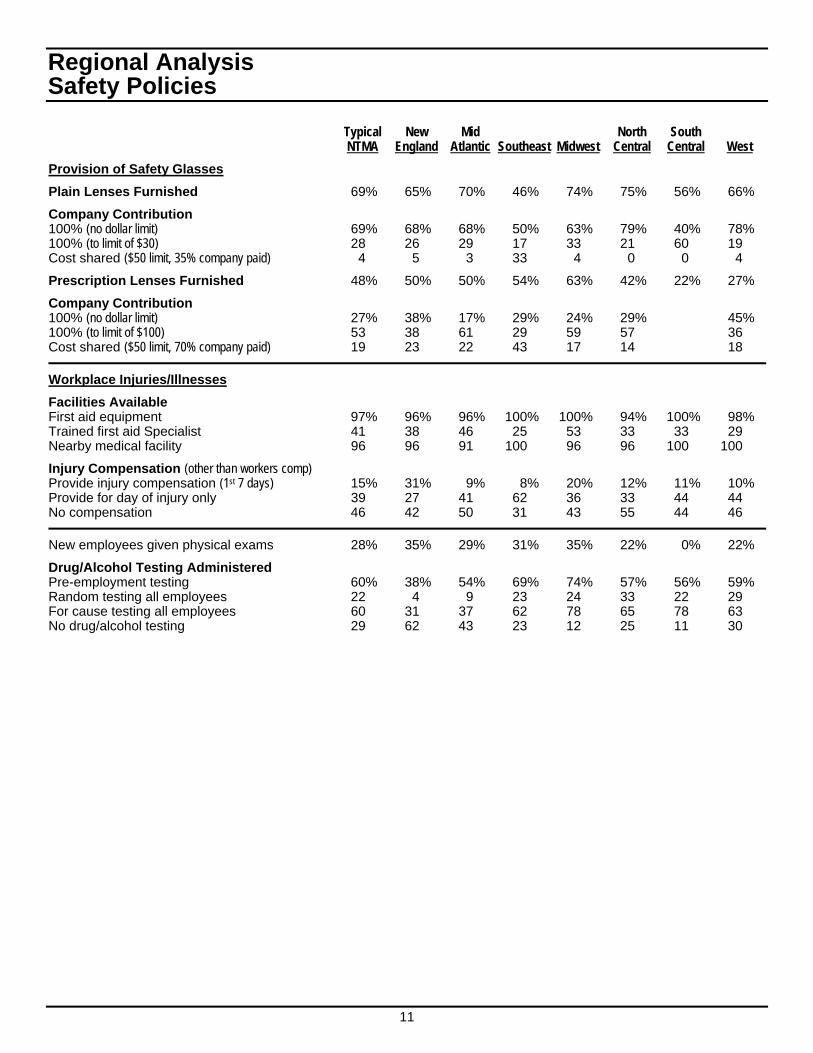
Plain Lenses Furnished 69% 65% 70% 46% 74% 75% 56% 66%
Company Contribution 100% (no dollar limit) 69% 68% 68% 50% 63% 79% 40% 78% 100% (to limit of $30) 28 26 29 17 33 21 60 19 Cost shared ($50 limit, 35% company paid) 4 5 3 33 4 0 0 4
Prescription Lenses Furnished 48% 50% 50% 54% 63% 42% 22% 27%
Company Contribution 100% (no dollar limit) 27% 38% 17% 29% 24% 29% 45% 100% (to limit of $100) 53 38 61 29 59 57 36 Cost shared ($50 limit, 70% company paid) 19 23 22 43 17 14 18
Workplace Injuries/Illnesses
Facilities Available First aid equipment 97% 96% 96% 100% 100% 94% 100% 98% Trained first aid Specialist 41 38 46 25 53 33 33 29 Nearby medical facility 96 96 91 100 96 96 100 100
Injury Compensation (other than workers comp) Provide injury compensation (1st 7 days) 15% 31% 9% 8% 20% 12% 11% 10% Provide for day of injury only 39 27 41 62 36 33 44 44 No compensation 46 42 50 31 43 55 44 46
New employees given physical exams 28% 35% 29% 31% 35% 22% 0% 22%
Drug/Alcohol Testing Administered Pre-employment testing 60% 38% 54% 69% 74% 57% 56% 59% Random testing all employees 22 4 9 23 24 33 22 29 For cause testing all employees 60 31 37 62 78 65 78 63 No drug/alcohol testing 29 62 43 23 12 25 11 30
12
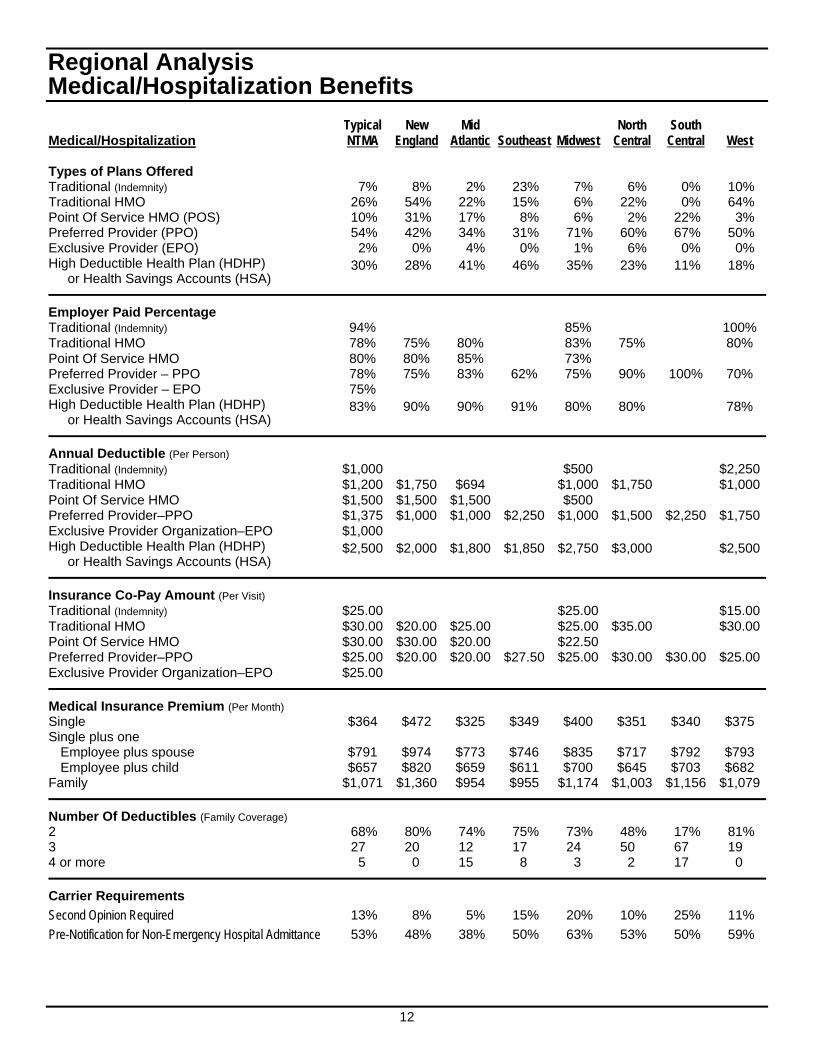
Regional Analysis Medical/Hospitalization Benefits Typical New Mid North South Medical/Hospitalization NTMA England Atlantic Southeast Midwest Central Central West Types of Plans Offered Traditional (Indemnity) 7% 8% 2% 23% 7% 6% 0% 10% Traditional HMO 26% 54% 22% 15% 6% 22% 0% 64% Point Of Service HMO (POS) 10% 31% 17% 8% 6% 2% 22% 3% Preferred Provider (PPO) 54% 42% 34% 31% 71% 60% 67% 50% Exclusive Provider (EPO) 2% 0% 4% 0% 1% 6% 0% 0% High Deductible Health Plan (HDHP)
or Health Savings Accounts (HSA) 30% 28% 41% 46% 35% 23% 11% 18%
Employer Paid Percentage Traditional (Indemnity) 94% 85% 100% Traditional HMO 78% 75% 80% 83% 75% 80% Point Of Service HMO 80% 80% 85% 73% Preferred Provider – PPO 78% 75% 83% 62% 75% 90% 100% 70% Exclusive Provider – EPO 75% High Deductible Health Plan (HDHP)
or Health Savings Accounts (HSA) 83% 90% 90% 91% 80% 80% 78%
Annual Deductible (Per Person) Traditional (Indemnity) $1,000 $500 $2,250Traditional HMO $1,200 $1,750 $694 $1,000 $1,750 $1,000Point Of Service HMO $1,500 $1,500 $1,500 $500 Preferred Provider–PPO $1,375 $1,000 $1,000 $2,250 $1,000 $1,500 $2,250 $1,750Exclusive Provider Organization–EPO $1,000 High Deductible Health Plan (HDHP)
or Health Savings Accounts (HSA) $2,500 $2,000 $1,800 $1,850 $2,750 $3,000 $2,500
Insurance Co-Pay Amount (Per Visit) Traditional (Indemnity) $25.00 $25.00 $15.00Traditional HMO $30.00 $20.00 $25.00 $25.00 $35.00 $30.00Point Of Service HMO $30.00 $30.00 $20.00 $22.50 Preferred Provider–PPO $25.00 $20.00 $20.00 $27.50 $25.00 $30.00 $30.00 $25.00Exclusive Provider Organization–EPO $25.00
Medical Insurance Premium (Per Month) Single $364 $472 $325 $349 $400 $351 $340 $375 Single plus one
Employee plus spouse $791 $974 $773 $746 $835 $717 $792 $793 Employee plus child $657 $820 $659 $611 $700 $645 $703 $682
Family $1,071 $1,360 $954 $955 $1,174 $1,003 $1,156 $1,079
Number Of Deductibles (Family Coverage) 2 68% 80% 74% 75% 73% 48% 17% 81% 3 27 20 12 17 24 50 67 19 4 or more 5 0 15 8 3 2 17 0
Carrier Requirements
Second Opinion Required 13% 8% 5% 15% 20% 10% 25% 11%
Pre-Notification for Non-Emergency Hospital Admittance 53% 48% 38% 50% 63% 53% 50% 59%
13
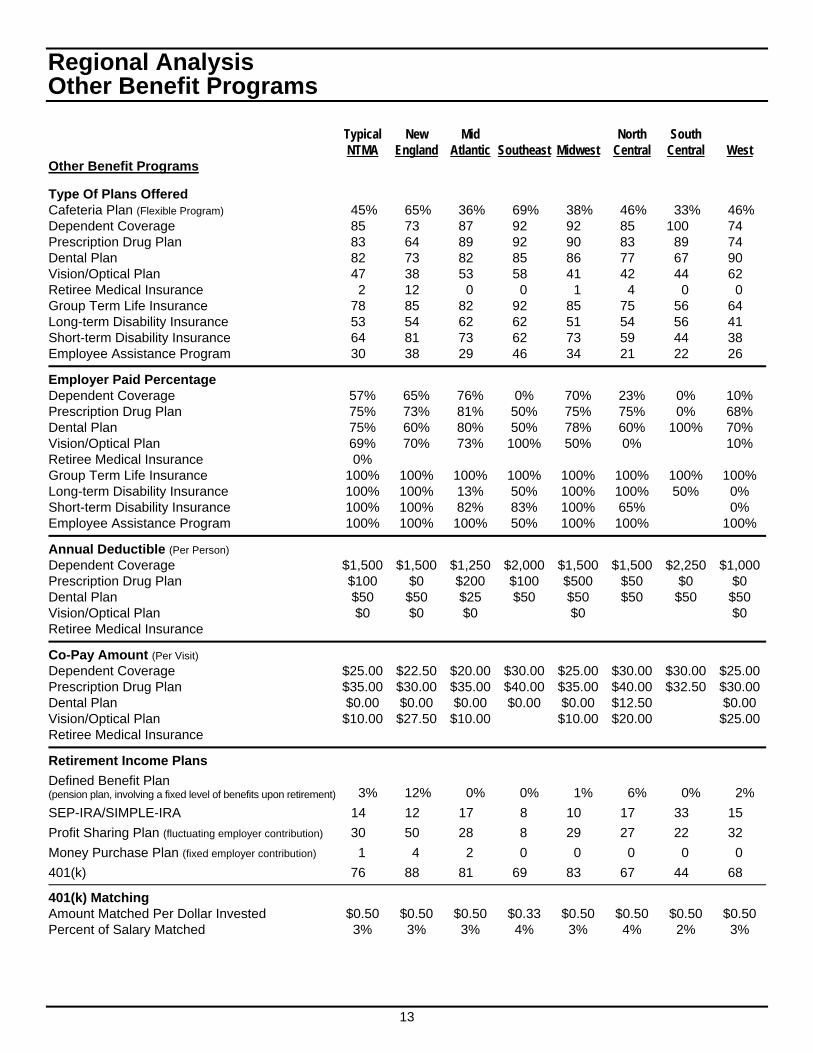
Regional Analysis Other Benefit Programs Typical New Mid North South NTMA England Atlantic Southeast Midwest Central Central West Other Benefit Programs
Type Of Plans Offered Cafeteria Plan (Flexible Program) 45% 65% 36% 69% 38% 46% 33% 46% Dependent Coverage 85 73 87 92 92 85 100 74 Prescription Drug Plan 83 64 89 92 90 83 89 74 Dental Plan 82 73 82 85 86 77 67 90 Vision/Optical Plan 47 38 53 58 41 42 44 62 Retiree Medical Insurance 2 12 0 0 1 4 0 0 Group Term Life Insurance 78 85 82 92 85 75 56 64 Long-term Disability Insurance 53 54 62 62 51 54 56 41 Short-term Disability Insurance 64 81 73 62 73 59 44 38 Employee Assistance Program 30 38 29 46 34 21 22 26
Employer Paid Percentage Dependent Coverage 57% 65% 76% 0% 70% 23% 0% 10% Prescription Drug Plan 75% 73% 81% 50% 75% 75% 0% 68% Dental Plan 75% 60% 80% 50% 78% 60% 100% 70% Vision/Optical Plan 69% 70% 73% 100% 50% 0% 10% Retiree Medical Insurance 0% Group Term Life Insurance 100% 100% 100% 100% 100% 100% 100% 100% Long-term Disability Insurance 100% 100% 13% 50% 100% 100% 50% 0% Short-term Disability Insurance 100% 100% 82% 83% 100% 65% 0% Employee Assistance Program 100% 100% 100% 50% 100% 100% 100%
Annual Deductible (Per Person) Dependent Coverage $1,500 $1,500 $1,250 $2,000 $1,500 $1,500 $2,250 $1,000Prescription Drug Plan $100 $0 $200 $100 $500 $50 $0 $0 Dental Plan $50 $50 $25 $50 $50 $50 $50 $50 Vision/Optical Plan $0 $0 $0 $0 $0 Retiree Medical Insurance
Co-Pay Amount (Per Visit) Dependent Coverage $25.00 $22.50 $20.00 $30.00 $25.00 $30.00 $30.00 $25.00Prescription Drug Plan $35.00 $30.00 $35.00 $40.00 $35.00 $40.00 $32.50 $30.00Dental Plan $0.00 $0.00 $0.00 $0.00 $0.00 $12.50 $0.00 Vision/Optical Plan $10.00 $27.50 $10.00 $10.00 $20.00 $25.00Retiree Medical Insurance
Retirement Income Plans
Defined Benefit Plan (pension plan, involving a fixed level of benefits upon retirement) 3% 12% 0% 0% 1% 6% 0% 2%
SEP-IRA/SIMPLE-IRA 14 12 17 8 10 17 33 15
Profit Sharing Plan (fluctuating employer contribution) 30 50 28 8 29 27 22 32
Money Purchase Plan (fixed employer contribution) 1 4 2 0 0 0 0 0
401(k) 76 88 81 69 83 67 44 68
401(k) Matching Amount Matched Per Dollar Invested $0.50 $0.50 $0.50 $0.33 $0.50 $0.50 $0.50 $0.50 Percent of Salary Matched 3% 3% 3% 4% 3% 4% 2% 3%
14
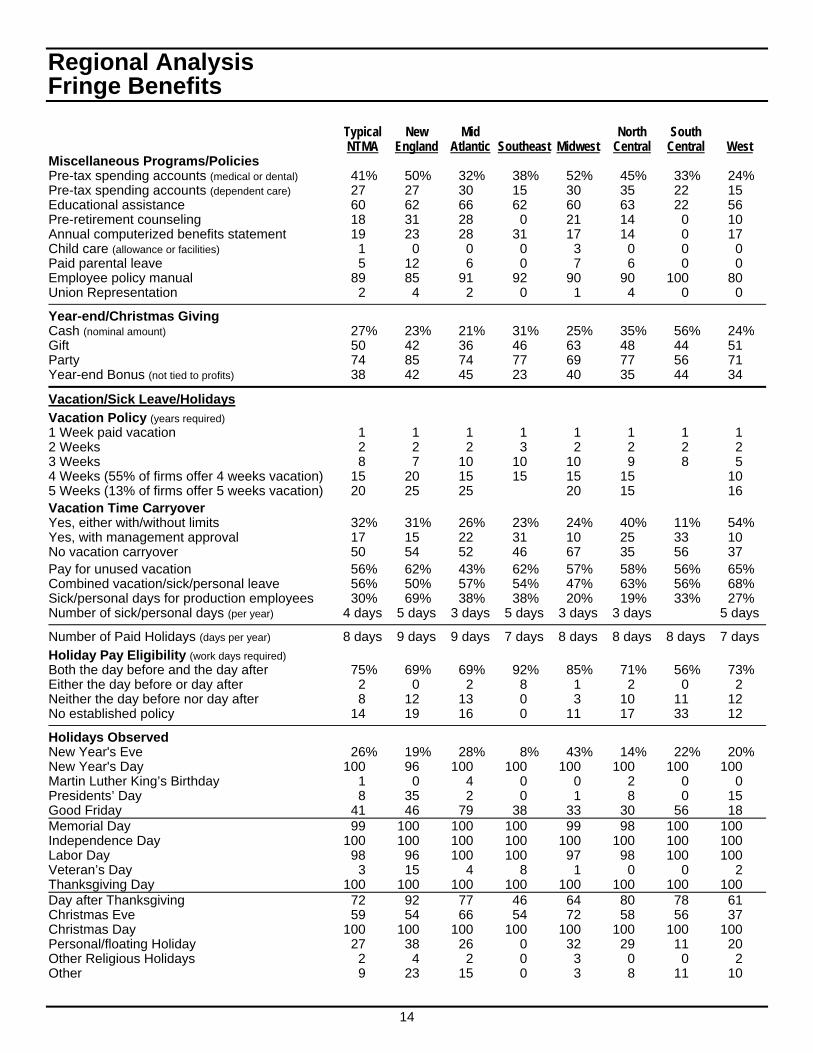
Regional Analysis Fringe Benefits Typical New Mid North South NTMA England Atlantic Southeast Midwest Central Central West Miscellaneous Programs/Policies Pre-tax spending accounts (medical or dental) 41% 50% 32% 38% 52% 45% 33% 24% Pre-tax spending accounts (dependent care) 27 27 30 15 30 35 22 15 Educational assistance 60 62 66 62 60 63 22 56 Pre-retirement counseling 18 31 28 0 21 14 0 10 Annual computerized benefits statement 19 23 28 31 17 14 0 17 Child care (allowance or facilities) 1 0 0 0 3 0 0 0 Paid parental leave 5 12 6 0 7 6 0 0 Employee policy manual 89 85 91 92 90 90 100 80 Union Representation 2 4 2 0 1 4 0 0
Year-end/Christmas Giving Cash (nominal amount) 27% 23% 21% 31% 25% 35% 56% 24% Gift 50 42 36 46 63 48 44 51 Party 74 85 74 77 69 77 56 71 Year-end Bonus (not tied to profits) 38 42 45 23 40 35 44 34
Vacation/Sick Leave/Holidays
Vacation Policy (years required) 1 Week paid vacation 1 1 1 1 1 1 1 1 2 Weeks 2 2 2 3 2 2 2 2 3 Weeks 8 7 10 10 10 9 8 5 4 Weeks (55% of firms offer 4 weeks vacation) 15 20 15 15 15 15 10 5 Weeks (13% of firms offer 5 weeks vacation) 20 25 25 20 15 16 Vacation Time Carryover Yes, either with/without limits 32% 31% 26% 23% 24% 40% 11% 54% Yes, with management approval 17 15 22 31 10 25 33 10 No vacation carryover 50 54 52 46 67 35 56 37 Pay for unused vacation 56% 62% 43% 62% 57% 58% 56% 65% Combined vacation/sick/personal leave 56% 50% 57% 54% 47% 63% 56% 68% Sick/personal days for production employees 30% 69% 38% 38% 20% 19% 33% 27% Number of sick/personal days (per year) 4 days 5 days 3 days 5 days 3 days 3 days 5 days
Number of Paid Holidays (days per year) 8 days 9 days 9 days 7 days 8 days 8 days 8 days 7 days
Holiday Pay Eligibility (work days required) Both the day before and the day after 75% 69% 69% 92% 85% 71% 56% 73% Either the day before or day after 2 0 2 8 1 2 0 2 Neither the day before nor day after 8 12 13 0 3 10 11 12 No established policy 14 19 16 0 11 17 33 12
Holidays Observed New Year's Eve 26% 19% 28% 8% 43% 14% 22% 20% New Year's Day 100 96 100 100 100 100 100 100 Martin Luther King’s Birthday 1 0 4 0 0 2 0 0 Presidents’ Day 8 35 2 0 1 8 0 15 Good Friday 41 46 79 38 33 30 56 18 Memorial Day 99 100 100 100 99 98 100 100 Independence Day 100 100 100 100 100 100 100 100 Labor Day 98 96 100 100 97 98 100 100 Veteran’s Day 3 15 4 8 1 0 0 2 Thanksgiving Day 100 100 100 100 100 100 100 100 Day after Thanksgiving 72 92 77 46 64 80 78 61 Christmas Eve 59 54 66 54 72 58 56 37 Christmas Day 100 100 100 100 100 100 100 100 Personal/floating Holiday 27 38 26 0 32 29 11 20 Other Religious Holidays 2 4 2 0 3 0 0 2 Other 9 23 15 0 3 8 11 10
15
New England Region (CT, MA)
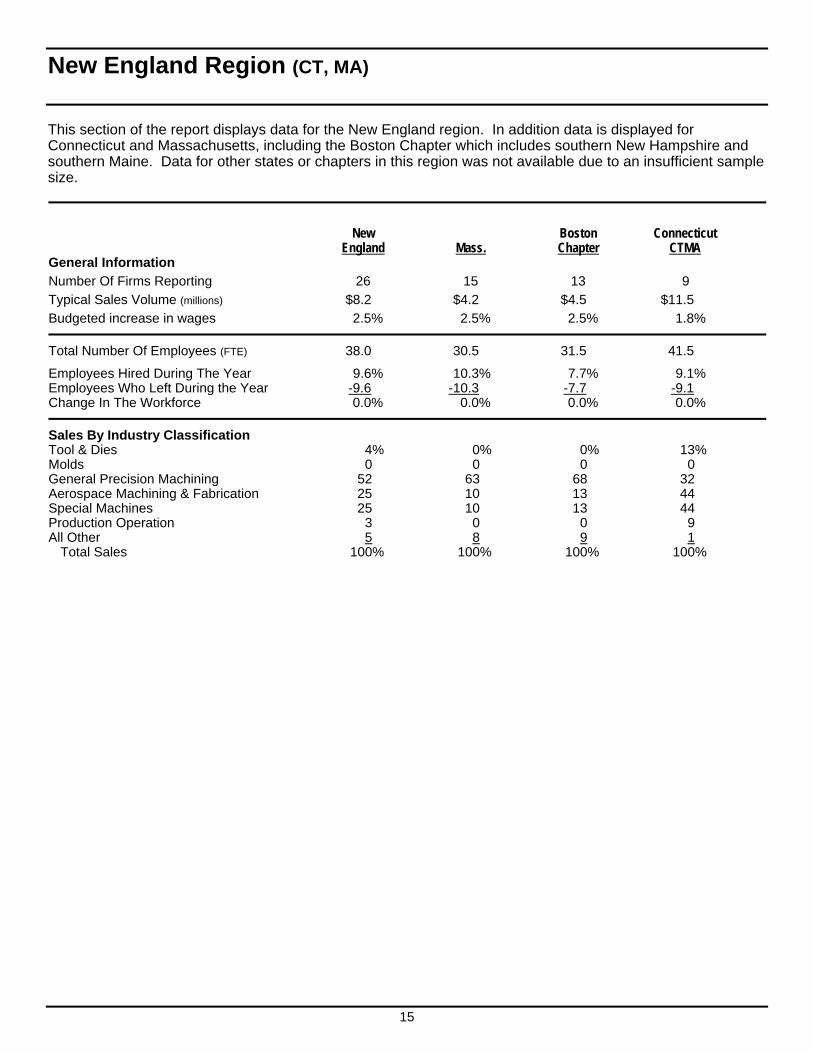
This section of the report displays data for the New England region. In addition data is displayed for Connecticut and Massachusetts, including the Boston Chapter which includes southern New Hampshire and southern Maine. Data for other states or chapters in this region was not available due to an insufficient sample size.
New Boston Connecticut England Mass. Chapter CTMA General Information
Number Of Firms Reporting 26 15 13 9
Typical Sales Volume (millions) $8.2 $4.2 $4.5 $11.5
Budgeted increase in wages 2.5% 2.5% 2.5% 1.8%
Total Number Of Employees (FTE) 38.0 30.5 31.5 41.5
Employees Hired During The Year 9.6% 10.3% 7.7% 9.1% Employees Who Left During the Year -9.6 -10.3 -7.7 -9.1 Change In The Workforce 0.0% 0.0% 0.0% 0.0%
Sales By Industry Classification Tool & Dies 4% 0% 0% 13% Molds 0 0 0 0 General Precision Machining 52 63 68 32 Aerospace Machining & Fabrication 25 10 13 44 Special Machines 25 10 13 44 Production Operation 3 0 0 9 All Other 5 8 9 1
Total Sales 100% 100% 100% 100%
16
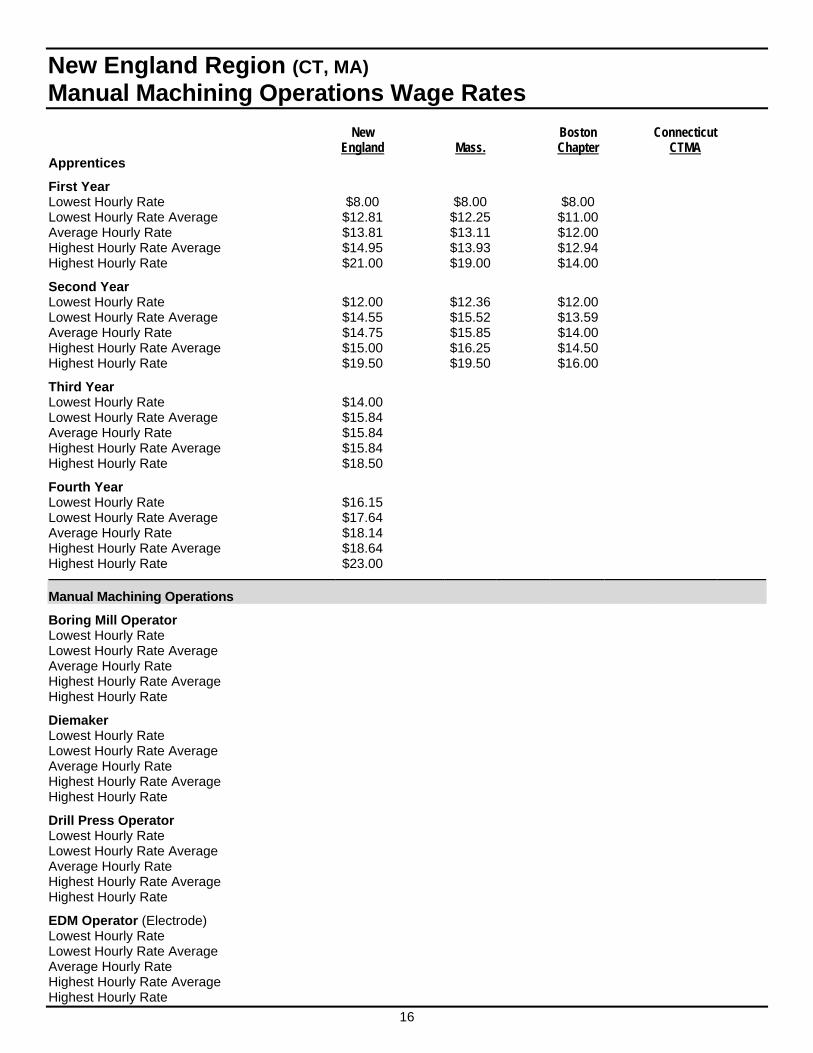
New England Region (CT, MA) Manual Machining Operations Wage Rates New Boston Connecticut England Mass. Chapter CTMA Apprentices
First Year Lowest Hourly Rate $8.00 $8.00 $8.00 Lowest Hourly Rate Average $12.81 $12.25 $11.00 Average Hourly Rate $13.81 $13.11 $12.00 Highest Hourly Rate Average $14.95 $13.93 $12.94 Highest Hourly Rate $21.00 $19.00 $14.00
Second Year Lowest Hourly Rate $12.00 $12.36 $12.00 Lowest Hourly Rate Average $14.55 $15.52 $13.59 Average Hourly Rate $14.75 $15.85 $14.00 Highest Hourly Rate Average $15.00 $16.25 $14.50 Highest Hourly Rate $19.50 $19.50 $16.00
Third Year Lowest Hourly Rate $14.00 Lowest Hourly Rate Average $15.84 Average Hourly Rate $15.84 Highest Hourly Rate Average $15.84 Highest Hourly Rate $18.50
Fourth Year Lowest Hourly Rate $16.15 Lowest Hourly Rate Average $17.64 Average Hourly Rate $18.14 Highest Hourly Rate Average $18.64 Highest Hourly Rate $23.00
Manual Machining Operations
Boring Mill Operator Lowest Hourly Rate Lowest Hourly Rate Average Average Hourly Rate Highest Hourly Rate Average Highest Hourly Rate
Diemaker Lowest Hourly Rate Lowest Hourly Rate Average Average Hourly Rate Highest Hourly Rate Average Highest Hourly Rate
Drill Press Operator Lowest Hourly Rate Lowest Hourly Rate Average Average Hourly Rate Highest Hourly Rate Average Highest Hourly Rate
EDM Operator (Electrode) Lowest Hourly Rate Lowest Hourly Rate Average Average Hourly Rate Highest Hourly Rate Average Highest Hourly Rate
17
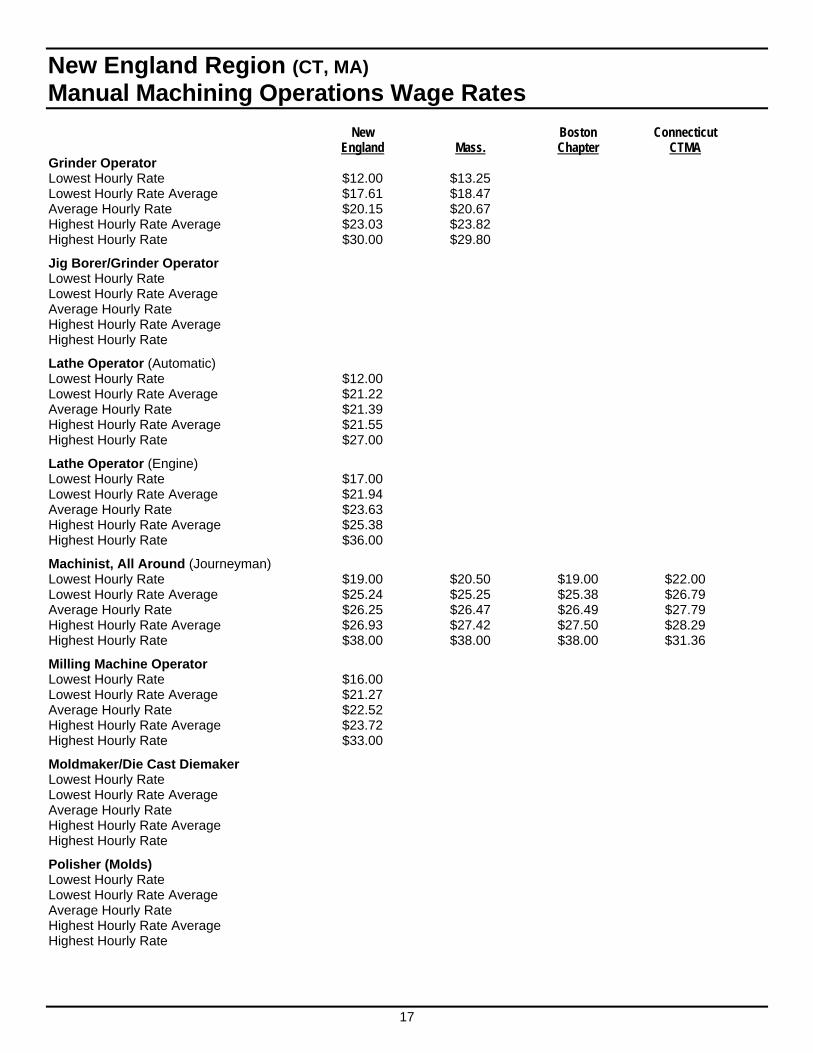
New England Region (CT, MA) Manual Machining Operations Wage Rates New Boston Connecticut England Mass. Chapter CTMA Grinder Operator Lowest Hourly Rate $12.00 $13.25 Lowest Hourly Rate Average $17.61 $18.47 Average Hourly Rate $20.15 $20.67 Highest Hourly Rate Average $23.03 $23.82 Highest Hourly Rate $30.00 $29.80
Jig Borer/Grinder Operator Lowest Hourly Rate Lowest Hourly Rate Average Average Hourly Rate Highest Hourly Rate Average Highest Hourly Rate
Lathe Operator (Automatic) Lowest Hourly Rate $12.00 Lowest Hourly Rate Average $21.22 Average Hourly Rate $21.39 Highest Hourly Rate Average $21.55 Highest Hourly Rate $27.00
Lathe Operator (Engine) Lowest Hourly Rate $17.00 Lowest Hourly Rate Average $21.94 Average Hourly Rate $23.63 Highest Hourly Rate Average $25.38 Highest Hourly Rate $36.00
Machinist, All Around (Journeyman) Lowest Hourly Rate $19.00 $20.50 $19.00 $22.00 Lowest Hourly Rate Average $25.24 $25.25 $25.38 $26.79 Average Hourly Rate $26.25 $26.47 $26.49 $27.79 Highest Hourly Rate Average $26.93 $27.42 $27.50 $28.29 Highest Hourly Rate $38.00 $38.00 $38.00 $31.36
Milling Machine Operator Lowest Hourly Rate $16.00 Lowest Hourly Rate Average $21.27 Average Hourly Rate $22.52 Highest Hourly Rate Average $23.72 Highest Hourly Rate $33.00
Moldmaker/Die Cast Diemaker Lowest Hourly Rate Lowest Hourly Rate Average Average Hourly Rate Highest Hourly Rate Average Highest Hourly Rate
Polisher (Molds) Lowest Hourly Rate Lowest Hourly Rate Average Average Hourly Rate Highest Hourly Rate Average Highest Hourly Rate
18
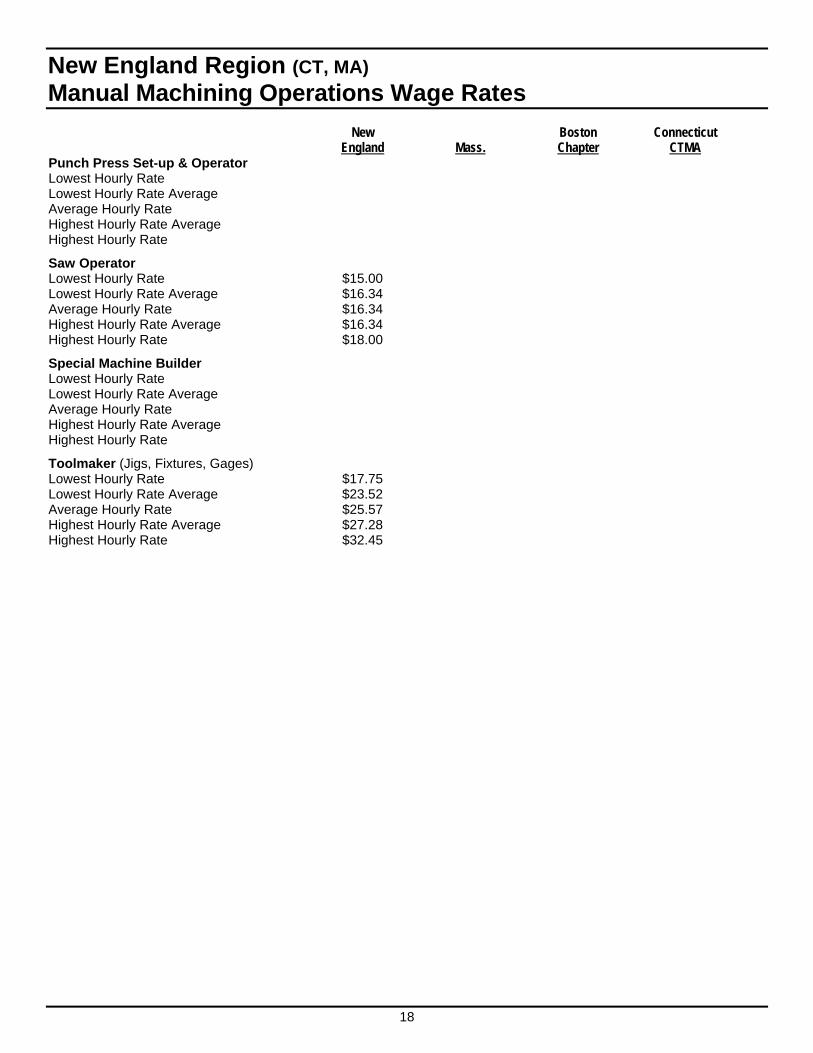
New England Region (CT, MA) Manual Machining Operations Wage Rates New Boston Connecticut England Mass. Chapter CTMA Punch Press Set-up & Operator Lowest Hourly Rate Lowest Hourly Rate Average Average Hourly Rate Highest Hourly Rate Average Highest Hourly Rate
Saw Operator Lowest Hourly Rate $15.00 Lowest Hourly Rate Average $16.34 Average Hourly Rate $16.34 Highest Hourly Rate Average $16.34 Highest Hourly Rate $18.00
Special Machine Builder Lowest Hourly Rate Lowest Hourly Rate Average Average Hourly Rate Highest Hourly Rate Average Highest Hourly Rate
Toolmaker (Jigs, Fixtures, Gages) Lowest Hourly Rate $17.75 Lowest Hourly Rate Average $23.52 Average Hourly Rate $25.57 Highest Hourly Rate Average $27.28 Highest Hourly Rate $32.45
19
New England Region (CT, MA) CNC Operations Wage Rates New Boston Connecticut CNC Operations England Mass. Chapter CTMA
Drilling Machine Operator Lowest Hourly Rate Lowest Hourly Rate Average Average Hourly Rate Highest Hourly Rate Average Highest Hourly Rate
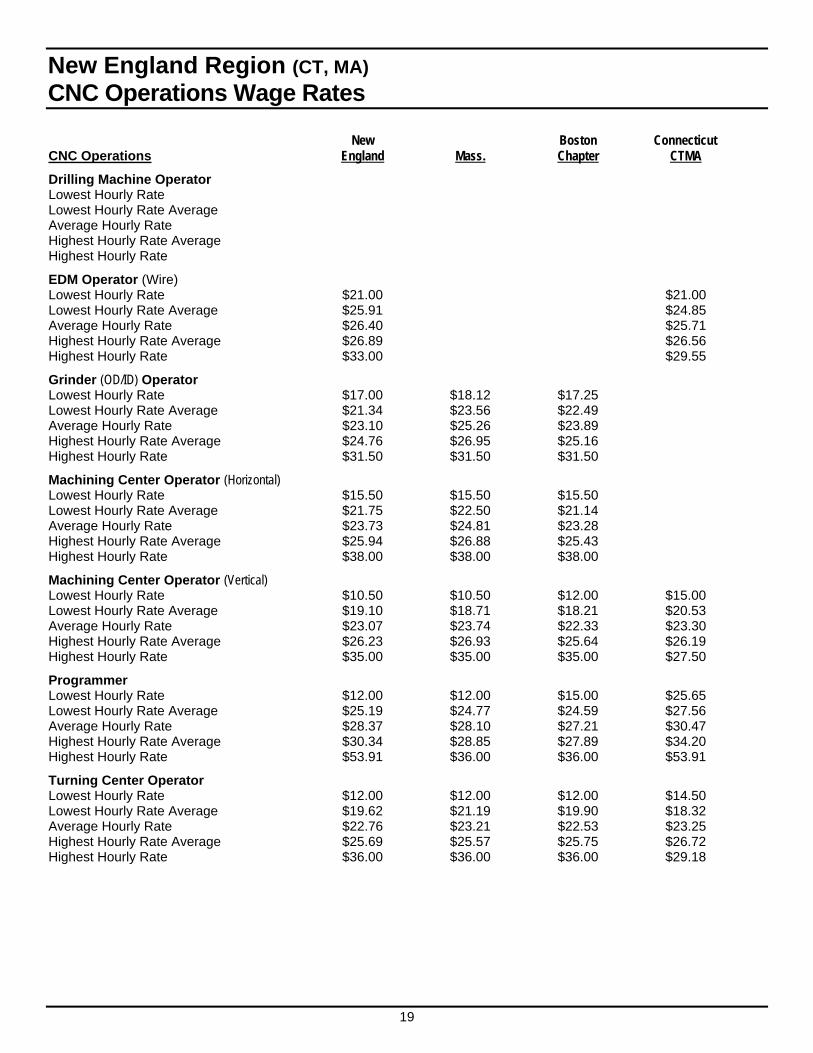
EDM Operator (Wire) Lowest Hourly Rate $21.00 $21.00 Lowest Hourly Rate Average $25.91 $24.85 Average Hourly Rate $26.40 $25.71 Highest Hourly Rate Average $26.89 $26.56 Highest Hourly Rate $33.00 $29.55
Grinder (OD/ID) Operator Lowest Hourly Rate $17.00 $18.12 $17.25 Lowest Hourly Rate Average $21.34 $23.56 $22.49 Average Hourly Rate $23.10 $25.26 $23.89 Highest Hourly Rate Average $24.76 $26.95 $25.16 Highest Hourly Rate $31.50 $31.50 $31.50
Machining Center Operator (Horizontal) Lowest Hourly Rate $15.50 $15.50 $15.50 Lowest Hourly Rate Average $21.75 $22.50 $21.14 Average Hourly Rate $23.73 $24.81 $23.28 Highest Hourly Rate Average $25.94 $26.88 $25.43 Highest Hourly Rate $38.00 $38.00 $38.00
Machining Center Operator (Vertical) Lowest Hourly Rate $10.50 $10.50 $12.00 $15.00 Lowest Hourly Rate Average $19.10 $18.71 $18.21 $20.53 Average Hourly Rate $23.07 $23.74 $22.33 $23.30 Highest Hourly Rate Average $26.23 $26.93 $25.64 $26.19 Highest Hourly Rate $35.00 $35.00 $35.00 $27.50
Programmer Lowest Hourly Rate $12.00 $12.00 $15.00 $25.65 Lowest Hourly Rate Average $25.19 $24.77 $24.59 $27.56 Average Hourly Rate $28.37 $28.10 $27.21 $30.47 Highest Hourly Rate Average $30.34 $28.85 $27.89 $34.20 Highest Hourly Rate $53.91 $36.00 $36.00 $53.91
Turning Center Operator Lowest Hourly Rate $12.00 $12.00 $12.00 $14.50 Lowest Hourly Rate Average $19.62 $21.19 $19.90 $18.32 Average Hourly Rate $22.76 $23.21 $22.53 $23.25 Highest Hourly Rate Average $25.69 $25.57 $25.75 $26.72 Highest Hourly Rate $36.00 $36.00 $36.00 $29.18
20
New England Region (CT, MA) Manufacturing Support Wage Rates New Boston Connecticut Manufacturing Support Functions England Mass. Chapter CTMA
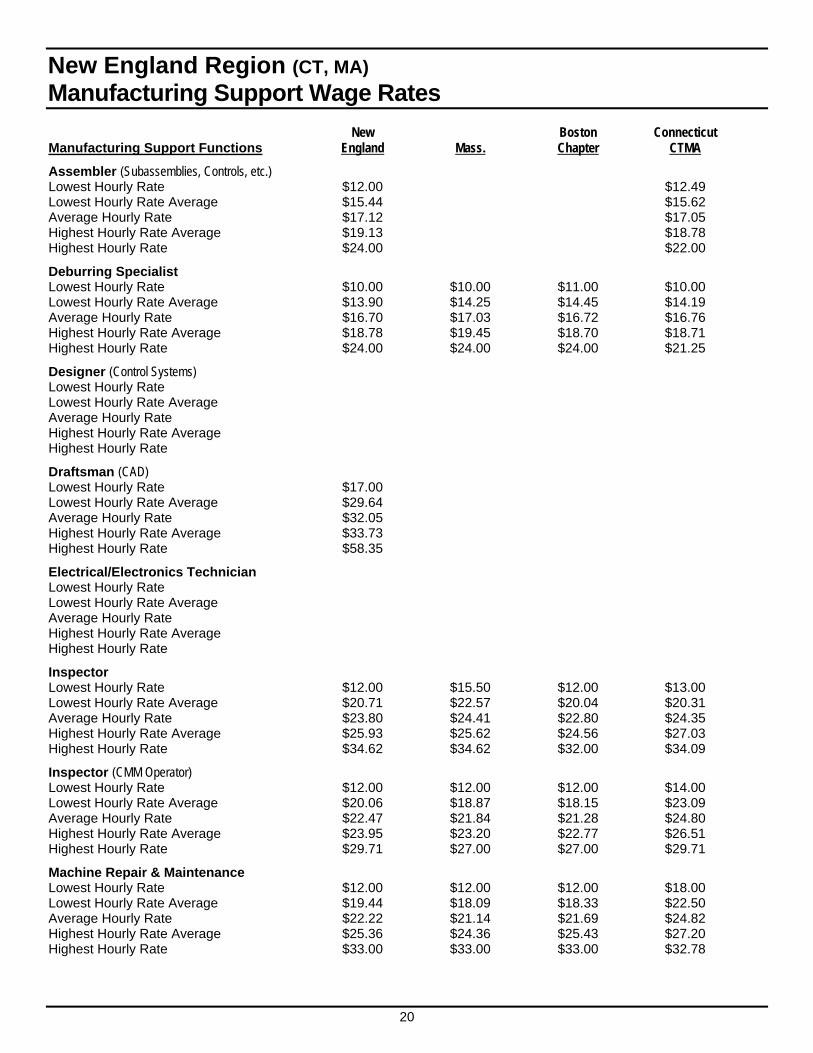
Assembler (Subassemblies, Controls, etc.) Lowest Hourly Rate $12.00 $12.49 Lowest Hourly Rate Average $15.44 $15.62 Average Hourly Rate $17.12 $17.05 Highest Hourly Rate Average $19.13 $18.78 Highest Hourly Rate $24.00 $22.00
Deburring Specialist Lowest Hourly Rate $10.00 $10.00 $11.00 $10.00 Lowest Hourly Rate Average $13.90 $14.25 $14.45 $14.19 Average Hourly Rate $16.70 $17.03 $16.72 $16.76 Highest Hourly Rate Average $18.78 $19.45 $18.70 $18.71 Highest Hourly Rate $24.00 $24.00 $24.00 $21.25
Designer (Control Systems) Lowest Hourly Rate Lowest Hourly Rate Average Average Hourly Rate Highest Hourly Rate Average Highest Hourly Rate
Draftsman (CAD) Lowest Hourly Rate $17.00 Lowest Hourly Rate Average $29.64 Average Hourly Rate $32.05 Highest Hourly Rate Average $33.73 Highest Hourly Rate $58.35
Electrical/Electronics Technician Lowest Hourly Rate Lowest Hourly Rate Average Average Hourly Rate Highest Hourly Rate Average Highest Hourly Rate
Inspector Lowest Hourly Rate $12.00 $15.50 $12.00 $13.00 Lowest Hourly Rate Average $20.71 $22.57 $20.04 $20.31 Average Hourly Rate $23.80 $24.41 $22.80 $24.35 Highest Hourly Rate Average $25.93 $25.62 $24.56 $27.03 Highest Hourly Rate $34.62 $34.62 $32.00 $34.09
Inspector (CMM Operator) Lowest Hourly Rate $12.00 $12.00 $12.00 $14.00 Lowest Hourly Rate Average $20.06 $18.87 $18.15 $23.09 Average Hourly Rate $22.47 $21.84 $21.28 $24.80 Highest Hourly Rate Average $23.95 $23.20 $22.77 $26.51 Highest Hourly Rate $29.71 $27.00 $27.00 $29.71
Machine Repair & Maintenance Lowest Hourly Rate $12.00 $12.00 $12.00 $18.00 Lowest Hourly Rate Average $19.44 $18.09 $18.33 $22.50 Average Hourly Rate $22.22 $21.14 $21.69 $24.82 Highest Hourly Rate Average $25.36 $24.36 $25.43 $27.20 Highest Hourly Rate $33.00 $33.00 $33.00 $32.78
21
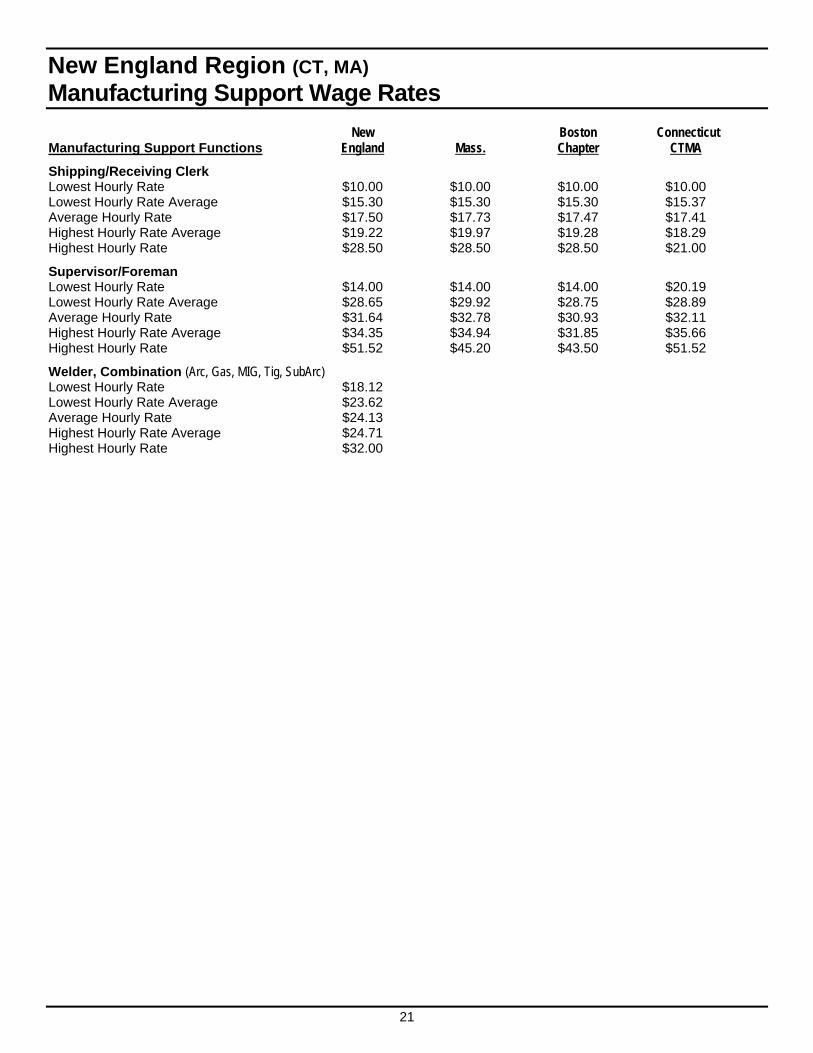
New England Region (CT, MA) Manufacturing Support Wage Rates New Boston Connecticut Manufacturing Support Functions England Mass. Chapter CTMA
Shipping/Receiving Clerk Lowest Hourly Rate $10.00 $10.00 $10.00 $10.00 Lowest Hourly Rate Average $15.30 $15.30 $15.30 $15.37 Average Hourly Rate $17.50 $17.73 $17.47 $17.41 Highest Hourly Rate Average $19.22 $19.97 $19.28 $18.29 Highest Hourly Rate $28.50 $28.50 $28.50 $21.00
Supervisor/Foreman Lowest Hourly Rate $14.00 $14.00 $14.00 $20.19 Lowest Hourly Rate Average $28.65 $29.92 $28.75 $28.89 Average Hourly Rate $31.64 $32.78 $30.93 $32.11 Highest Hourly Rate Average $34.35 $34.94 $31.85 $35.66 Highest Hourly Rate $51.52 $45.20 $43.50 $51.52
Welder, Combination (Arc, Gas, MIG, Tig, SubArc) Lowest Hourly Rate $18.12 Lowest Hourly Rate Average $23.62 Average Hourly Rate $24.13 Highest Hourly Rate Average $24.71 Highest Hourly Rate $32.00
22
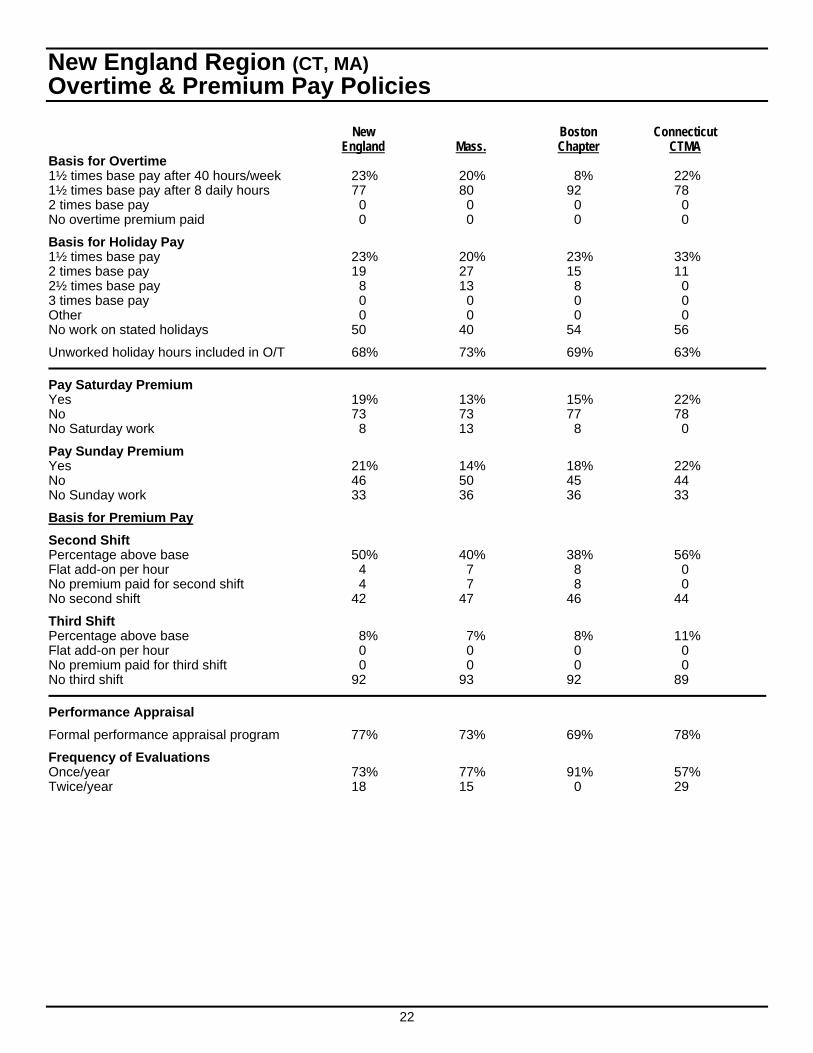
New England Region (CT, MA) Overtime & Premium Pay Policies New Boston Connecticut England Mass. Chapter CTMA Basis for Overtime 1½ times base pay after 40 hours/week 23% 20% 8% 22% 1½ times base pay after 8 daily hours 77 80 92 78 2 times base pay 0 0 0 0 No overtime premium paid 0 0 0 0
Basis for Holiday Pay 1½ times base pay 23% 20% 23% 33% 2 times base pay 19 27 15 11 2½ times base pay 8 13 8 0 3 times base pay 0 0 0 0 Other 0 0 0 0 No work on stated holidays 50 40 54 56
Unworked holiday hours included in O/T 68% 73% 69% 63%
Pay Saturday Premium Yes 19% 13% 15% 22% No 73 73 77 78 No Saturday work 8 13 8 0
Pay Sunday Premium Yes 21% 14% 18% 22% No 46 50 45 44 No Sunday work 33 36 36 33
Basis for Premium Pay
Second Shift Percentage above base 50% 40% 38% 56% Flat add-on per hour 4 7 8 0 No premium paid for second shift 4 7 8 0 No second shift 42 47 46 44
Third Shift Percentage above base 8% 7% 8% 11% Flat add-on per hour 0 0 0 0 No premium paid for third shift 0 0 0 0 No third shift 92 93 92 89
Performance Appraisal
Formal performance appraisal program 77% 73% 69% 78%
Frequency of Evaluations Once/year 73% 77% 91% 57% Twice/year 18 15 0 29
23
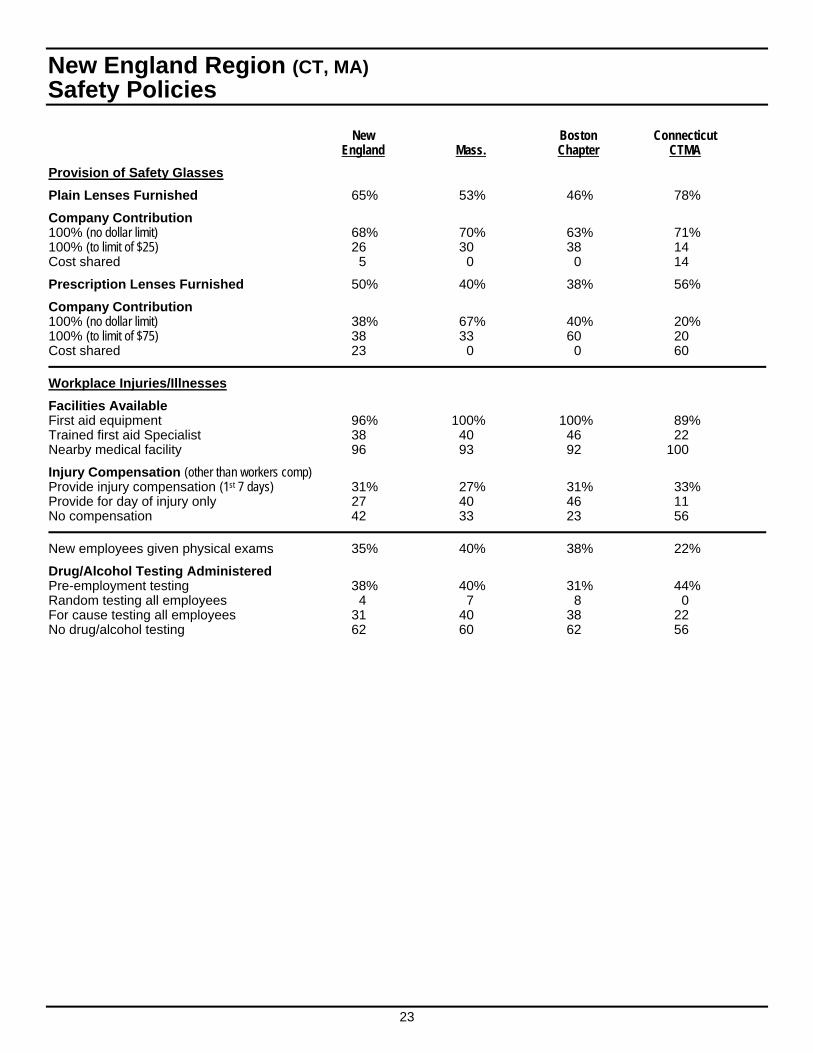
New England Region (CT, MA) Safety Policies New Boston Connecticut England Mass. Chapter CTMA
Provision of Safety Glasses
Plain Lenses Furnished 65% 53% 46% 78%
Company Contribution 100% (no dollar limit) 68% 70% 63% 71% 100% (to limit of $25) 26 30 38 14 Cost shared 5 0 0 14
Prescription Lenses Furnished 50% 40% 38% 56%
Company Contribution 100% (no dollar limit) 38% 67% 40% 20% 100% (to limit of $75) 38 33 60 20 Cost shared 23 0 0 60
Workplace Injuries/Illnesses
Facilities Available First aid equipment 96% 100% 100% 89% Trained first aid Specialist 38 40 46 22 Nearby medical facility 96 93 92 100
Injury Compensation (other than workers comp) Provide injury compensation (1st 7 days) 31% 27% 31% 33% Provide for day of injury only 27 40 46 11 No compensation 42 33 23 56
New employees given physical exams 35% 40% 38% 22%
Drug/Alcohol Testing Administered Pre-employment testing 38% 40% 31% 44% Random testing all employees 4 7 8 0 For cause testing all employees 31 40 38 22 No drug/alcohol testing 62 60 62 56
24
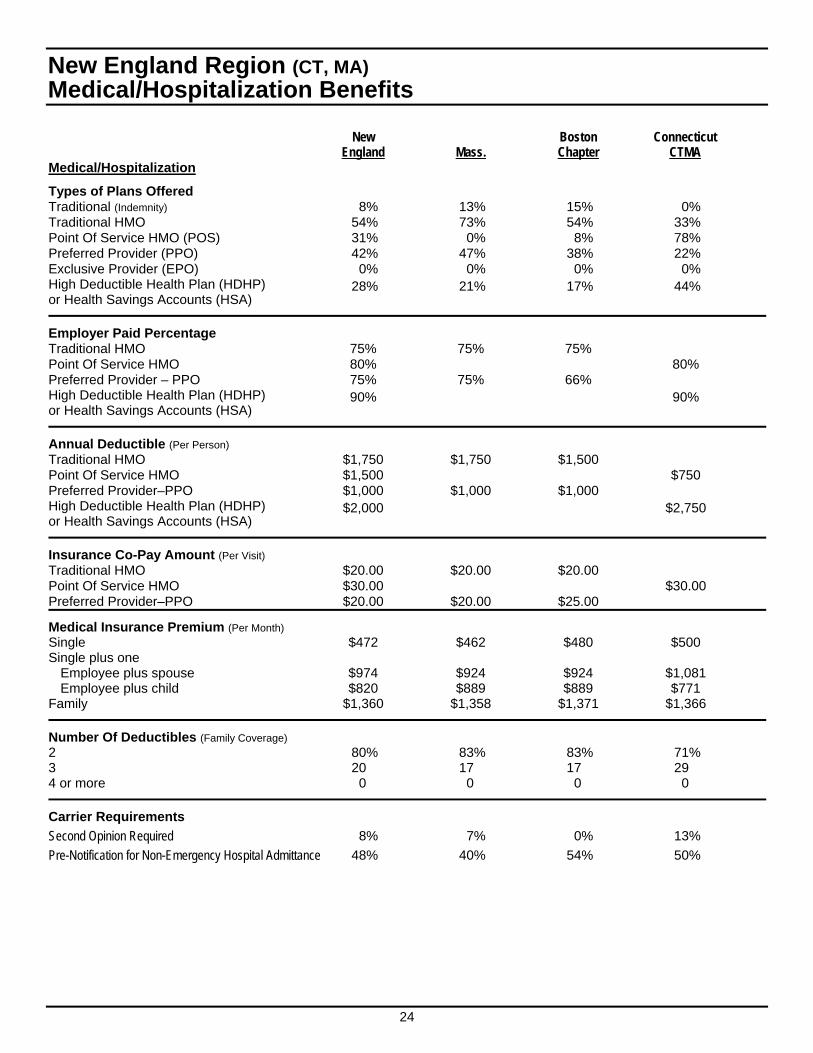
New England Region (CT, MA) Medical/Hospitalization Benefits
New Boston Connecticut England Mass. Chapter CTMA
Medical/Hospitalization
Types of Plans Offered Traditional (Indemnity) 8% 13% 15% 0% Traditional HMO 54% 73% 54% 33% Point Of Service HMO (POS) 31% 0% 8% 78% Preferred Provider (PPO) 42% 47% 38% 22% Exclusive Provider (EPO) 0% 0% 0% 0% High Deductible Health Plan (HDHP) or Health Savings Accounts (HSA)
28% 21% 17% 44%
Employer Paid Percentage Traditional HMO 75% 75% 75% Point Of Service HMO 80% 80% Preferred Provider – PPO 75% 75% 66% High Deductible Health Plan (HDHP) or Health Savings Accounts (HSA)
90% 90%
Annual Deductible (Per Person) Traditional HMO $1,750 $1,750 $1,500 Point Of Service HMO $1,500 $750 Preferred Provider–PPO $1,000 $1,000 $1,000 High Deductible Health Plan (HDHP) or Health Savings Accounts (HSA)
$2,000 $2,750
Insurance Co-Pay Amount (Per Visit) Traditional HMO $20.00 $20.00 $20.00 Point Of Service HMO $30.00 $30.00 Preferred Provider–PPO $20.00 $20.00 $25.00
Medical Insurance Premium (Per Month) Single $472 $462 $480 $500 Single plus one
Employee plus spouse $974 $924 $924 $1,081 Employee plus child $820 $889 $889 $771
Family $1,360 $1,358 $1,371 $1,366
Number Of Deductibles (Family Coverage) 2 80% 83% 83% 71% 3 20 17 17 29 4 or more 0 0 0 0
Carrier Requirements
Second Opinion Required 8% 7% 0% 13%
Pre-Notification for Non-Emergency Hospital Admittance 48% 40% 54% 50%
25
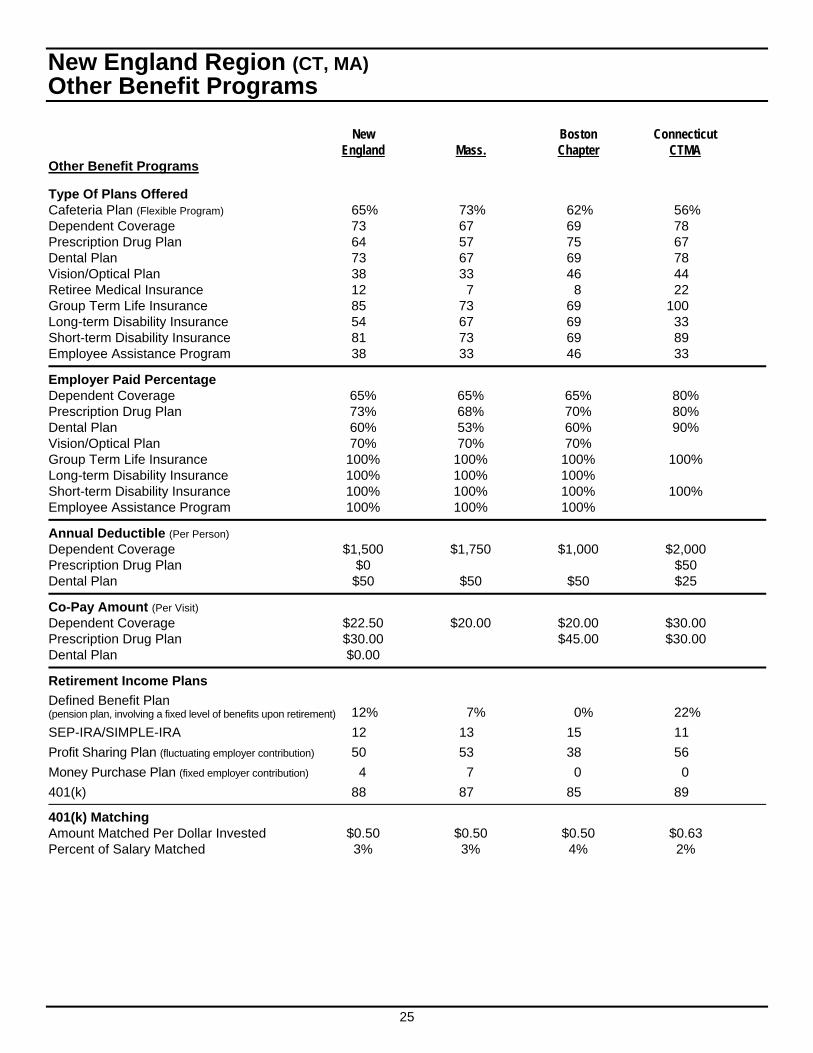
New England Region (CT, MA) Other Benefit Programs New Boston Connecticut England Mass. Chapter CTMA Other Benefit Programs
Type Of Plans Offered Cafeteria Plan (Flexible Program) 65% 73% 62% 56% Dependent Coverage 73 67 69 78 Prescription Drug Plan 64 57 75 67 Dental Plan 73 67 69 78 Vision/Optical Plan 38 33 46 44 Retiree Medical Insurance 12 7 8 22 Group Term Life Insurance 85 73 69 100 Long-term Disability Insurance 54 67 69 33 Short-term Disability Insurance 81 73 69 89 Employee Assistance Program 38 33 46 33
Employer Paid Percentage Dependent Coverage 65% 65% 65% 80% Prescription Drug Plan 73% 68% 70% 80% Dental Plan 60% 53% 60% 90% Vision/Optical Plan 70% 70% 70% Group Term Life Insurance 100% 100% 100% 100% Long-term Disability Insurance 100% 100% 100% Short-term Disability Insurance 100% 100% 100% 100% Employee Assistance Program 100% 100% 100%
Annual Deductible (Per Person) Dependent Coverage $1,500 $1,750 $1,000 $2,000 Prescription Drug Plan $0 $50 Dental Plan $50 $50 $50 $25
Co-Pay Amount (Per Visit) Dependent Coverage $22.50 $20.00 $20.00 $30.00 Prescription Drug Plan $30.00 $45.00 $30.00 Dental Plan $0.00
Retirement Income Plans
Defined Benefit Plan (pension plan, involving a fixed level of benefits upon retirement) 12% 7% 0% 22%
SEP-IRA/SIMPLE-IRA 12 13 15 11
Profit Sharing Plan (fluctuating employer contribution) 50 53 38 56
Money Purchase Plan (fixed employer contribution) 4 7 0 0
401(k) 88 87 85 89
401(k) Matching Amount Matched Per Dollar Invested $0.50 $0.50 $0.50 $0.63 Percent of Salary Matched 3% 3% 4% 2%
26
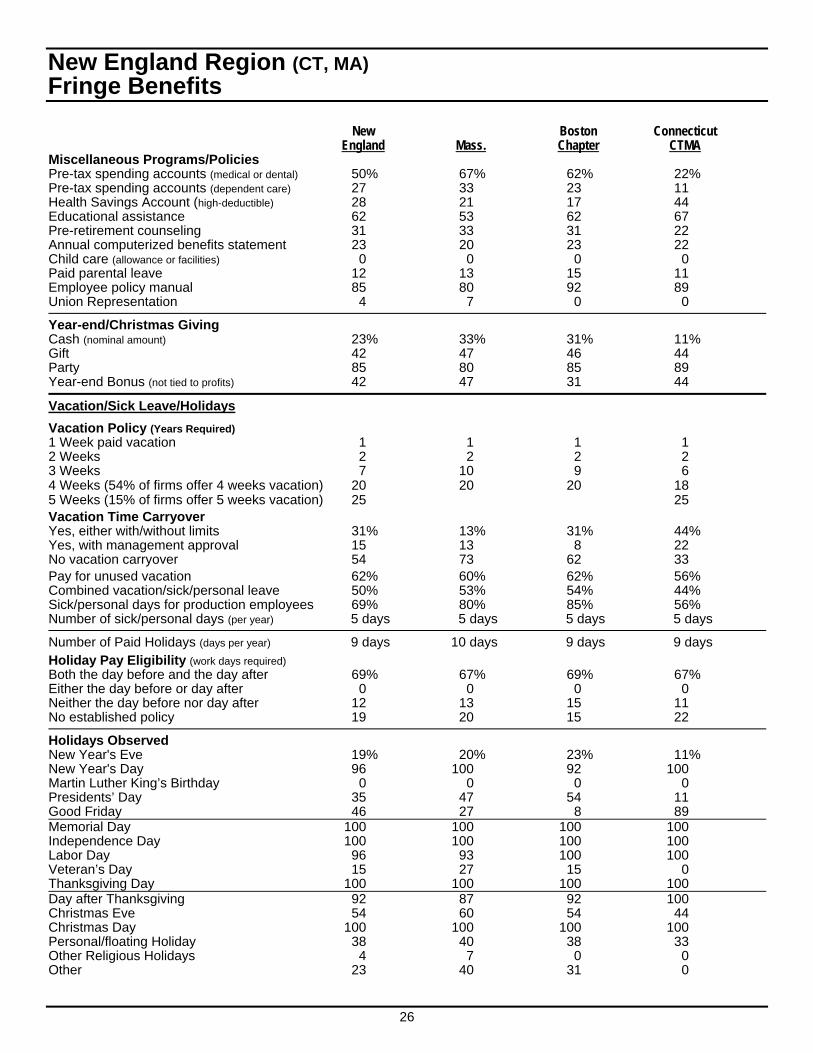
New England Region (CT, MA) Fringe Benefits New Boston Connecticut England Mass. Chapter CTMA Miscellaneous Programs/Policies Pre-tax spending accounts (medical or dental) 50% 67% 62% 22% Pre-tax spending accounts (dependent care) 27 33 23 11 Health Savings Account (high-deductible) 28 21 17 44 Educational assistance 62 53 62 67 Pre-retirement counseling 31 33 31 22 Annual computerized benefits statement 23 20 23 22 Child care (allowance or facilities) 0 0 0 0 Paid parental leave 12 13 15 11 Employee policy manual 85 80 92 89 Union Representation 4 7 0 0
Year-end/Christmas Giving Cash (nominal amount) 23% 33% 31% 11% Gift 42 47 46 44 Party 85 80 85 89 Year-end Bonus (not tied to profits) 42 47 31 44
Vacation/Sick Leave/Holidays
Vacation Policy (Years Required) 1 Week paid vacation 1 1 1 1 2 Weeks 2 2 2 2 3 Weeks 7 10 9 6 4 Weeks (54% of firms offer 4 weeks vacation) 20 20 20 18 5 Weeks (15% of firms offer 5 weeks vacation) 25 25 Vacation Time Carryover Yes, either with/without limits 31% 13% 31% 44% Yes, with management approval 15 13 8 22 No vacation carryover 54 73 62 33 Pay for unused vacation 62% 60% 62% 56% Combined vacation/sick/personal leave 50% 53% 54% 44% Sick/personal days for production employees 69% 80% 85% 56% Number of sick/personal days (per year) 5 days 5 days 5 days 5 days
Number of Paid Holidays (days per year) 9 days 10 days 9 days 9 days Holiday Pay Eligibility (work days required) Both the day before and the day after 69% 67% 69% 67% Either the day before or day after 0 0 0 0 Neither the day before nor day after 12 13 15 11 No established policy 19 20 15 22
Holidays Observed New Year's Eve 19% 20% 23% 11% New Year's Day 96 100 92 100 Martin Luther King’s Birthday 0 0 0 0 Presidents’ Day 35 47 54 11 Good Friday 46 27 8 89 Memorial Day 100 100 100 100 Independence Day 100 100 100 100 Labor Day 96 93 100 100 Veteran’s Day 15 27 15 0 Thanksgiving Day 100 100 100 100 Day after Thanksgiving 92 87 92 100 Christmas Eve 54 60 54 44 Christmas Day 100 100 100 100 Personal/floating Holiday 38 40 38 33 Other Religious Holidays 4 7 0 0 Other 23 40 31 0
27
Mid-Atlantic Region (NY, PA) & Southeast Region
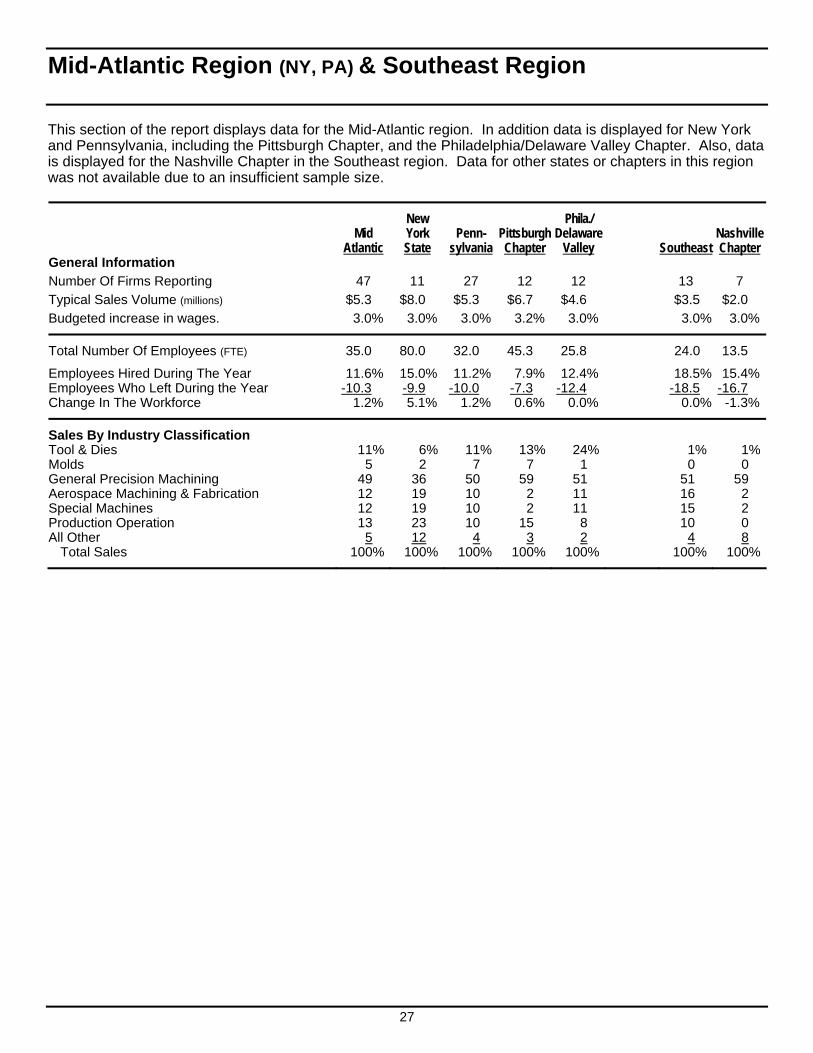
This section of the report displays data for the Mid-Atlantic region. In addition data is displayed for New York and Pennsylvania, including the Pittsburgh Chapter, and the Philadelphia/Delaware Valley Chapter. Also, data is displayed for the Nashville Chapter in the Southeast region. Data for other states or chapters in this region was not available due to an insufficient sample size.
New Phila./ Mid York Penn- Pittsburgh Delaware Nashville Atlantic State sylvania Chapter Valley Southeast Chapter General Information
Number Of Firms Reporting 47 11 27 12 12 13 7
Typical Sales Volume (millions) $5.3 $8.0 $5.3 $6.7 $4.6 $3.5 $2.0
Budgeted increase in wages. 3.0% 3.0% 3.0% 3.2% 3.0% 3.0% 3.0%
Total Number Of Employees (FTE) 35.0 80.0 32.0 45.3 25.8 24.0 13.5
Employees Hired During The Year 11.6% 15.0% 11.2% 7.9% 12.4% 18.5% 15.4%Employees Who Left During the Year -10.3 -9.9 -10.0 -7.3 -12.4 -18.5 -16.7 Change In The Workforce 1.2% 5.1% 1.2% 0.6% 0.0% 0.0% -1.3%
Sales By Industry Classification Tool & Dies 11% 6% 11% 13% 24% 1% 1%Molds 5 2 7 7 1 0 0 General Precision Machining 49 36 50 59 51 51 59 Aerospace Machining & Fabrication 12 19 10 2 11 16 2 Special Machines 12 19 10 2 11 15 2 Production Operation 13 23 10 15 8 10 0 All Other 5 12 4 3 2 4 8
Total Sales 100% 100% 100% 100% 100% 100% 100%
28
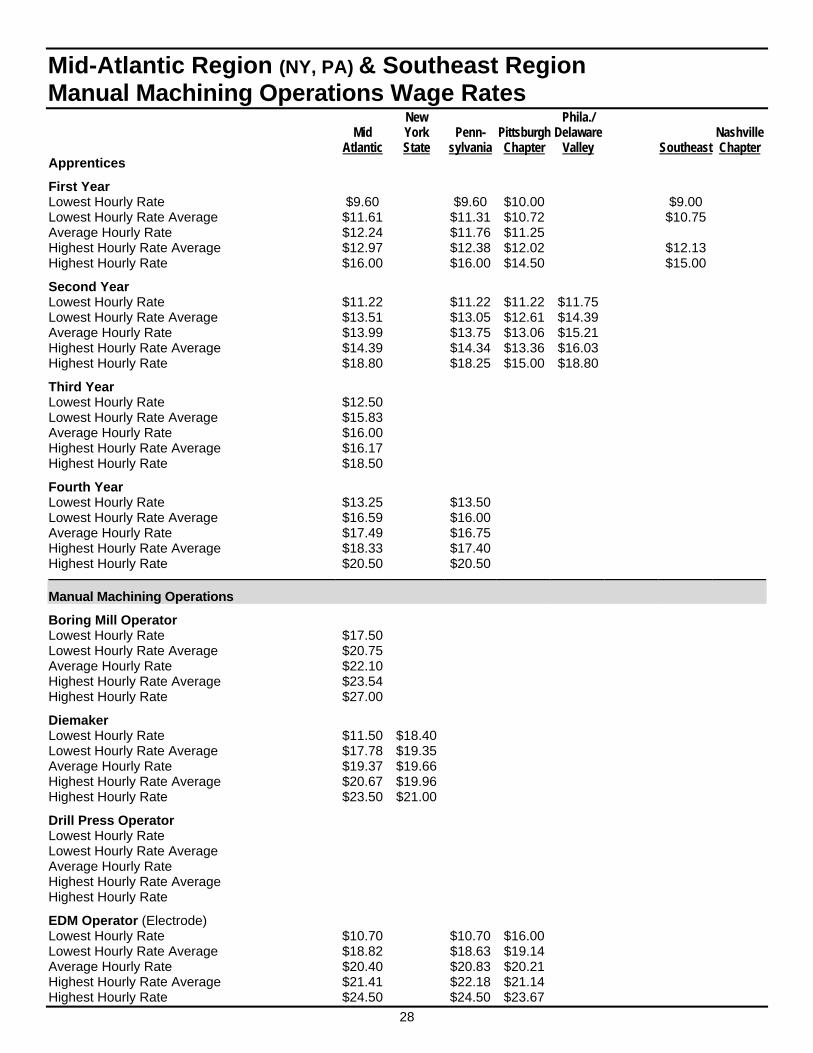
Mid-Atlantic Region (NY, PA) & Southeast Region Manual Machining Operations Wage Rates New Phila./ Mid York Penn- Pittsburgh Delaware Nashville Atlantic State sylvania Chapter Valley Southeast Chapter Apprentices
First Year Lowest Hourly Rate $9.60 $9.60 $10.00 $9.00 Lowest Hourly Rate Average $11.61 $11.31 $10.72 $10.75 Average Hourly Rate $12.24 $11.76 $11.25 Highest Hourly Rate Average $12.97 $12.38 $12.02 $12.13 Highest Hourly Rate $16.00 $16.00 $14.50 $15.00
Second Year Lowest Hourly Rate $11.22 $11.22 $11.22 $11.75 Lowest Hourly Rate Average $13.51 $13.05 $12.61 $14.39 Average Hourly Rate $13.99 $13.75 $13.06 $15.21 Highest Hourly Rate Average $14.39 $14.34 $13.36 $16.03 Highest Hourly Rate $18.80 $18.25 $15.00 $18.80
Third Year Lowest Hourly Rate $12.50 Lowest Hourly Rate Average $15.83 Average Hourly Rate $16.00 Highest Hourly Rate Average $16.17 Highest Hourly Rate $18.50
Fourth Year Lowest Hourly Rate $13.25 $13.50 Lowest Hourly Rate Average $16.59 $16.00 Average Hourly Rate $17.49 $16.75 Highest Hourly Rate Average $18.33 $17.40 Highest Hourly Rate $20.50 $20.50
Manual Machining Operations
Boring Mill Operator Lowest Hourly Rate $17.50 Lowest Hourly Rate Average $20.75 Average Hourly Rate $22.10 Highest Hourly Rate Average $23.54 Highest Hourly Rate $27.00
Diemaker Lowest Hourly Rate $11.50 $18.40 Lowest Hourly Rate Average $17.78 $19.35 Average Hourly Rate $19.37 $19.66 Highest Hourly Rate Average $20.67 $19.96 Highest Hourly Rate $23.50 $21.00
Drill Press Operator Lowest Hourly Rate Lowest Hourly Rate Average Average Hourly Rate Highest Hourly Rate Average Highest Hourly Rate
EDM Operator (Electrode) Lowest Hourly Rate $10.70 $10.70 $16.00 Lowest Hourly Rate Average $18.82 $18.63 $19.14 Average Hourly Rate $20.40 $20.83 $20.21 Highest Hourly Rate Average $21.41 $22.18 $21.14 Highest Hourly Rate $24.50 $24.50 $23.67
29
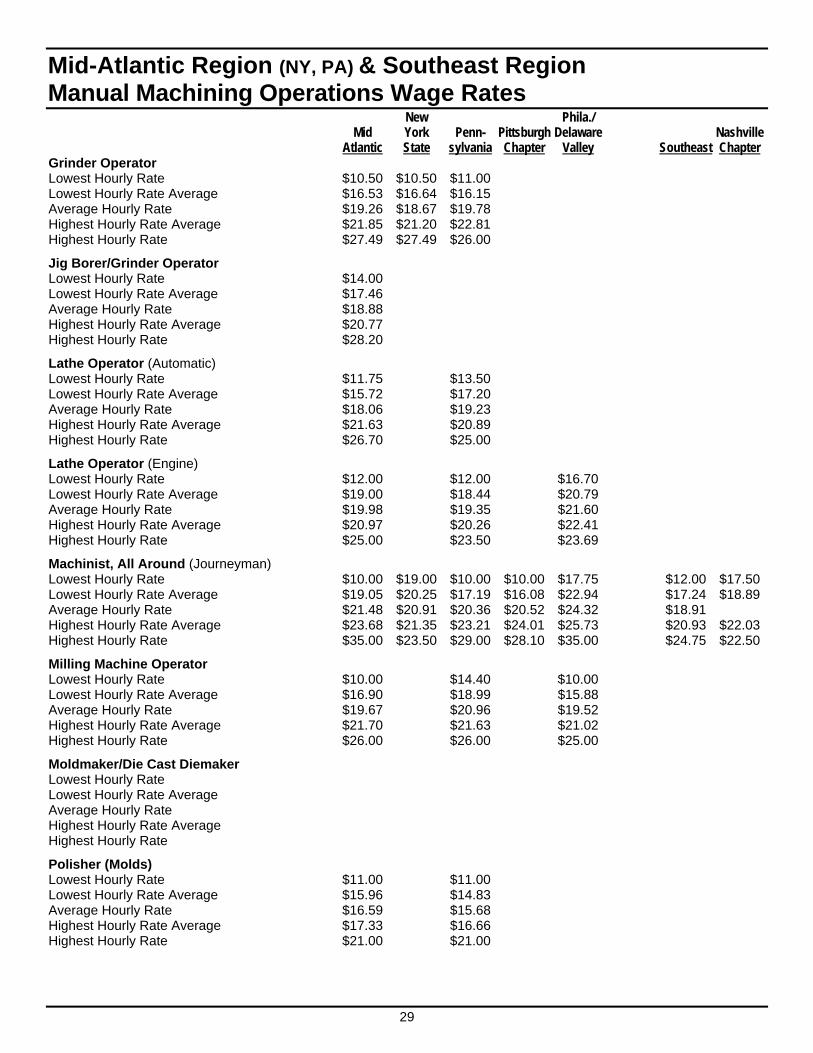
Mid-Atlantic Region (NY, PA) & Southeast Region Manual Machining Operations Wage Rates New Phila./ Mid York Penn- Pittsburgh Delaware Nashville Atlantic State sylvania Chapter Valley Southeast Chapter Grinder Operator Lowest Hourly Rate $10.50 $10.50 $11.00 Lowest Hourly Rate Average $16.53 $16.64 $16.15 Average Hourly Rate $19.26 $18.67 $19.78 Highest Hourly Rate Average $21.85 $21.20 $22.81 Highest Hourly Rate $27.49 $27.49 $26.00
Jig Borer/Grinder Operator Lowest Hourly Rate $14.00 Lowest Hourly Rate Average $17.46 Average Hourly Rate $18.88 Highest Hourly Rate Average $20.77 Highest Hourly Rate $28.20
Lathe Operator (Automatic) Lowest Hourly Rate $11.75 $13.50 Lowest Hourly Rate Average $15.72 $17.20 Average Hourly Rate $18.06 $19.23 Highest Hourly Rate Average $21.63 $20.89 Highest Hourly Rate $26.70 $25.00
Lathe Operator (Engine) Lowest Hourly Rate $12.00 $12.00 $16.70 Lowest Hourly Rate Average $19.00 $18.44 $20.79 Average Hourly Rate $19.98 $19.35 $21.60 Highest Hourly Rate Average $20.97 $20.26 $22.41 Highest Hourly Rate $25.00 $23.50 $23.69
Machinist, All Around (Journeyman) Lowest Hourly Rate $10.00 $19.00 $10.00 $10.00 $17.75 $12.00 $17.50Lowest Hourly Rate Average $19.05 $20.25 $17.19 $16.08 $22.94 $17.24 $18.89Average Hourly Rate $21.48 $20.91 $20.36 $20.52 $24.32 $18.91 Highest Hourly Rate Average $23.68 $21.35 $23.21 $24.01 $25.73 $20.93 $22.03Highest Hourly Rate $35.00 $23.50 $29.00 $28.10 $35.00 $24.75 $22.50
Milling Machine Operator Lowest Hourly Rate $10.00 $14.40 $10.00 Lowest Hourly Rate Average $16.90 $18.99 $15.88 Average Hourly Rate $19.67 $20.96 $19.52 Highest Hourly Rate Average $21.70 $21.63 $21.02 Highest Hourly Rate $26.00 $26.00 $25.00
Moldmaker/Die Cast Diemaker Lowest Hourly Rate Lowest Hourly Rate Average Average Hourly Rate Highest Hourly Rate Average Highest Hourly Rate
Polisher (Molds) Lowest Hourly Rate $11.00 $11.00 Lowest Hourly Rate Average $15.96 $14.83 Average Hourly Rate $16.59 $15.68 Highest Hourly Rate Average $17.33 $16.66 Highest Hourly Rate $21.00 $21.00
30
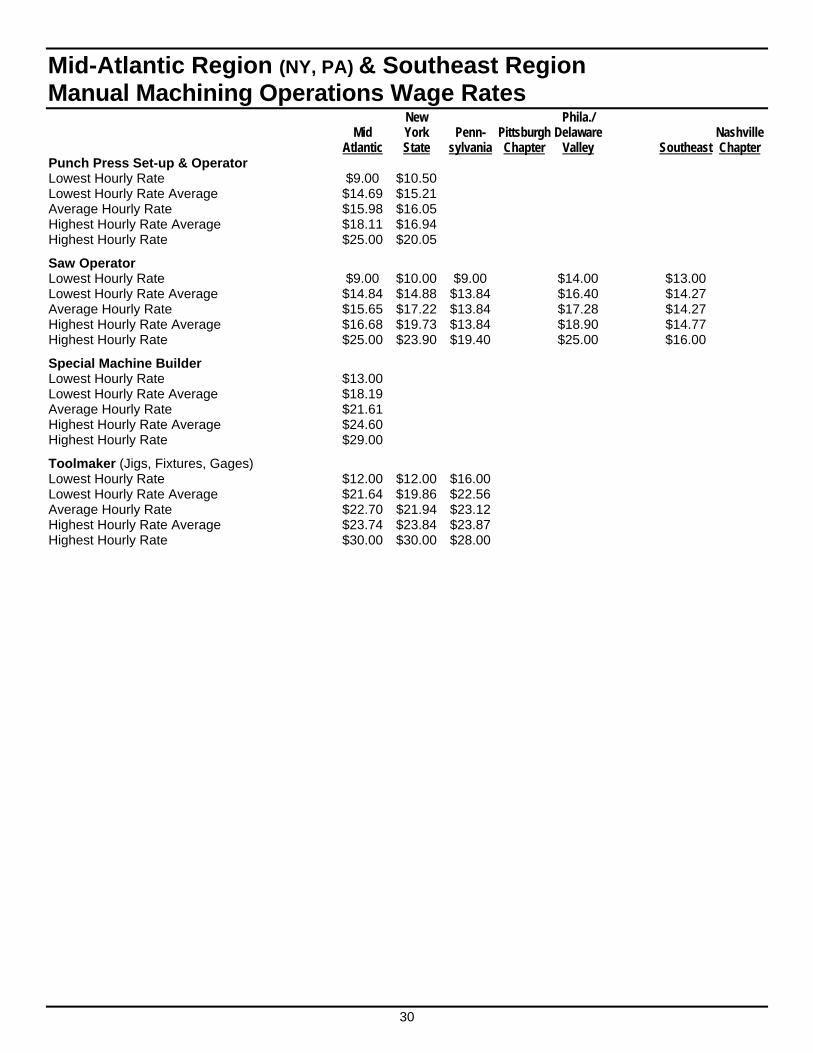
Mid-Atlantic Region (NY, PA) & Southeast Region Manual Machining Operations Wage Rates New Phila./ Mid York Penn- Pittsburgh Delaware Nashville Atlantic State sylvania Chapter Valley Southeast Chapter Punch Press Set-up & Operator Lowest Hourly Rate $9.00 $10.50 Lowest Hourly Rate Average $14.69 $15.21 Average Hourly Rate $15.98 $16.05 Highest Hourly Rate Average $18.11 $16.94 Highest Hourly Rate $25.00 $20.05
Saw Operator Lowest Hourly Rate $9.00 $10.00 $9.00 $14.00 $13.00 Lowest Hourly Rate Average $14.84 $14.88 $13.84 $16.40 $14.27 Average Hourly Rate $15.65 $17.22 $13.84 $17.28 $14.27 Highest Hourly Rate Average $16.68 $19.73 $13.84 $18.90 $14.77 Highest Hourly Rate $25.00 $23.90 $19.40 $25.00 $16.00
Special Machine Builder Lowest Hourly Rate $13.00 Lowest Hourly Rate Average $18.19 Average Hourly Rate $21.61 Highest Hourly Rate Average $24.60 Highest Hourly Rate $29.00
Toolmaker (Jigs, Fixtures, Gages) Lowest Hourly Rate $12.00 $12.00 $16.00 Lowest Hourly Rate Average $21.64 $19.86 $22.56 Average Hourly Rate $22.70 $21.94 $23.12 Highest Hourly Rate Average $23.74 $23.84 $23.87 Highest Hourly Rate $30.00 $30.00 $28.00
31
Mid-Atlantic Region (NY, PA) & Southeast Region CNC Operations Wage Rates New Phila./ Mid York Penn- Pittsburgh Delaware Nashville CNC Operations Atlantic State sylvania Chapter Valley Southeast Chapter
Drilling Machine Operator Lowest Hourly Rate Lowest Hourly Rate Average Average Hourly Rate Highest Hourly Rate Average Highest Hourly Rate
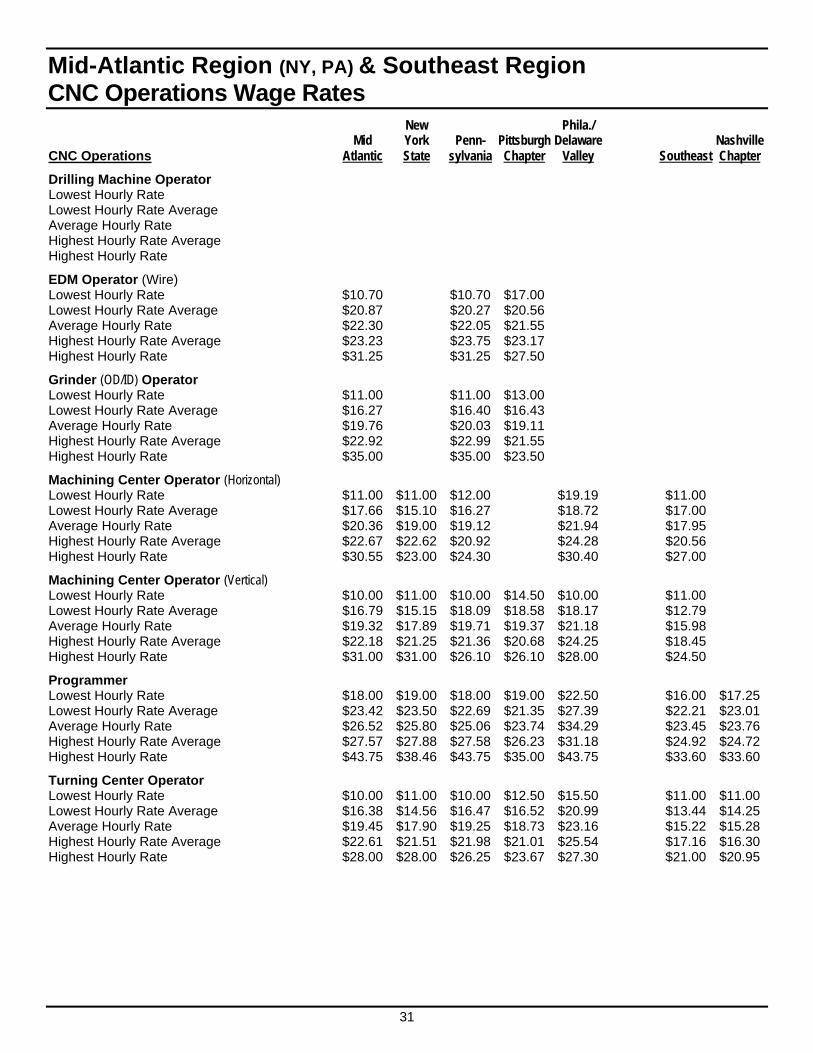
EDM Operator (Wire) Lowest Hourly Rate $10.70 $10.70 $17.00 Lowest Hourly Rate Average $20.87 $20.27 $20.56 Average Hourly Rate $22.30 $22.05 $21.55 Highest Hourly Rate Average $23.23 $23.75 $23.17 Highest Hourly Rate $31.25 $31.25 $27.50
Grinder (OD/ID) Operator Lowest Hourly Rate $11.00 $11.00 $13.00 Lowest Hourly Rate Average $16.27 $16.40 $16.43 Average Hourly Rate $19.76 $20.03 $19.11 Highest Hourly Rate Average $22.92 $22.99 $21.55 Highest Hourly Rate $35.00 $35.00 $23.50
Machining Center Operator (Horizontal) Lowest Hourly Rate $11.00 $11.00 $12.00 $19.19 $11.00 Lowest Hourly Rate Average $17.66 $15.10 $16.27 $18.72 $17.00 Average Hourly Rate $20.36 $19.00 $19.12 $21.94 $17.95 Highest Hourly Rate Average $22.67 $22.62 $20.92 $24.28 $20.56 Highest Hourly Rate $30.55 $23.00 $24.30 $30.40 $27.00
Machining Center Operator (Vertical) Lowest Hourly Rate $10.00 $11.00 $10.00 $14.50 $10.00 $11.00 Lowest Hourly Rate Average $16.79 $15.15 $18.09 $18.58 $18.17 $12.79 Average Hourly Rate $19.32 $17.89 $19.71 $19.37 $21.18 $15.98 Highest Hourly Rate Average $22.18 $21.25 $21.36 $20.68 $24.25 $18.45 Highest Hourly Rate $31.00 $31.00 $26.10 $26.10 $28.00 $24.50
Programmer Lowest Hourly Rate $18.00 $19.00 $18.00 $19.00 $22.50 $16.00 $17.25Lowest Hourly Rate Average $23.42 $23.50 $22.69 $21.35 $27.39 $22.21 $23.01Average Hourly Rate $26.52 $25.80 $25.06 $23.74 $34.29 $23.45 $23.76Highest Hourly Rate Average $27.57 $27.88 $27.58 $26.23 $31.18 $24.92 $24.72Highest Hourly Rate $43.75 $38.46 $43.75 $35.00 $43.75 $33.60 $33.60
Turning Center Operator Lowest Hourly Rate $10.00 $11.00 $10.00 $12.50 $15.50 $11.00 $11.00Lowest Hourly Rate Average $16.38 $14.56 $16.47 $16.52 $20.99 $13.44 $14.25Average Hourly Rate $19.45 $17.90 $19.25 $18.73 $23.16 $15.22 $15.28Highest Hourly Rate Average $22.61 $21.51 $21.98 $21.01 $25.54 $17.16 $16.30Highest Hourly Rate $28.00 $28.00 $26.25 $23.67 $27.30 $21.00 $20.95
32
Mid-Atlantic Region (NY, PA) & Southeast Region Manufacturing Support Wage Rates New Phila./ Mid York Penn- Pittsburgh Delaware Nashville Manufacturing Support Functions Atlantic State sylvania Chapter Valley Southeast Chapter
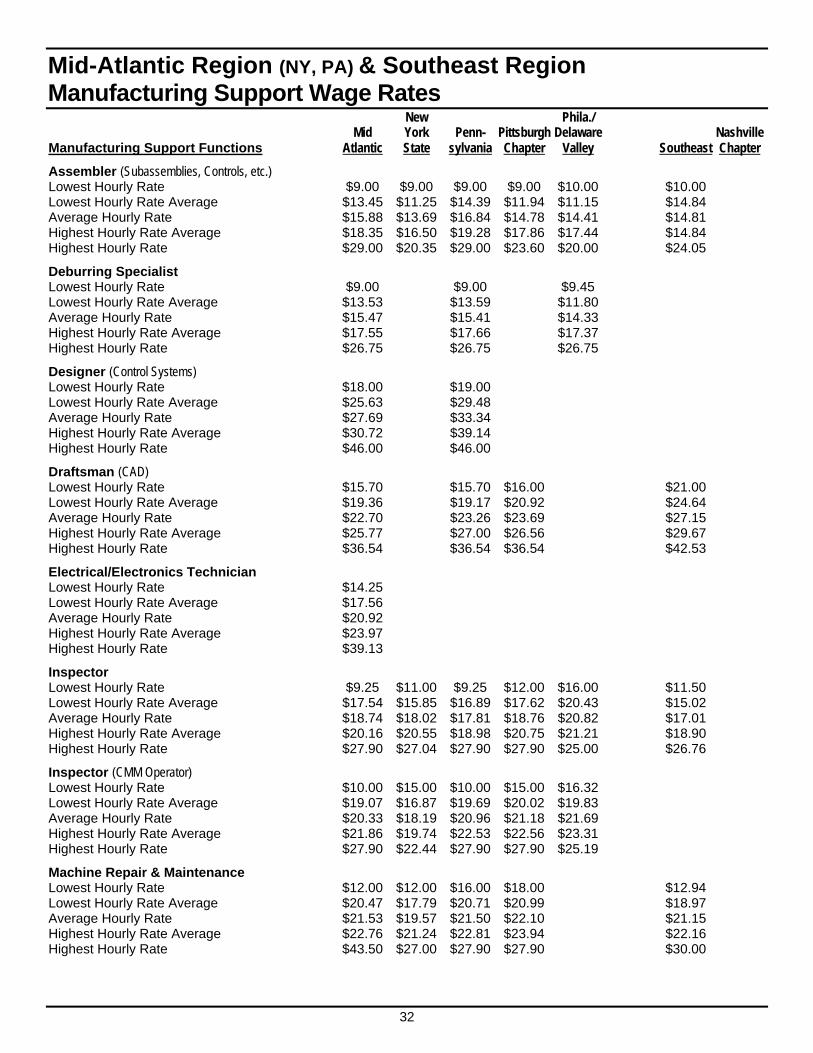
Assembler (Subassemblies, Controls, etc.) Lowest Hourly Rate $9.00 $9.00 $9.00 $9.00 $10.00 $10.00 Lowest Hourly Rate Average $13.45 $11.25 $14.39 $11.94 $11.15 $14.84 Average Hourly Rate $15.88 $13.69 $16.84 $14.78 $14.41 $14.81 Highest Hourly Rate Average $18.35 $16.50 $19.28 $17.86 $17.44 $14.84 Highest Hourly Rate $29.00 $20.35 $29.00 $23.60 $20.00 $24.05
Deburring Specialist Lowest Hourly Rate $9.00 $9.00 $9.45 Lowest Hourly Rate Average $13.53 $13.59 $11.80 Average Hourly Rate $15.47 $15.41 $14.33 Highest Hourly Rate Average $17.55 $17.66 $17.37 Highest Hourly Rate $26.75 $26.75 $26.75
Designer (Control Systems) Lowest Hourly Rate $18.00 $19.00 Lowest Hourly Rate Average $25.63 $29.48 Average Hourly Rate $27.69 $33.34 Highest Hourly Rate Average $30.72 $39.14 Highest Hourly Rate $46.00 $46.00
Draftsman (CAD) Lowest Hourly Rate $15.70 $15.70 $16.00 $21.00 Lowest Hourly Rate Average $19.36 $19.17 $20.92 $24.64 Average Hourly Rate $22.70 $23.26 $23.69 $27.15 Highest Hourly Rate Average $25.77 $27.00 $26.56 $29.67 Highest Hourly Rate $36.54 $36.54 $36.54 $42.53
Electrical/Electronics Technician Lowest Hourly Rate $14.25 Lowest Hourly Rate Average $17.56 Average Hourly Rate $20.92 Highest Hourly Rate Average $23.97 Highest Hourly Rate $39.13
Inspector Lowest Hourly Rate $9.25 $11.00 $9.25 $12.00 $16.00 $11.50 Lowest Hourly Rate Average $17.54 $15.85 $16.89 $17.62 $20.43 $15.02 Average Hourly Rate $18.74 $18.02 $17.81 $18.76 $20.82 $17.01 Highest Hourly Rate Average $20.16 $20.55 $18.98 $20.75 $21.21 $18.90 Highest Hourly Rate $27.90 $27.04 $27.90 $27.90 $25.00 $26.76
Inspector (CMM Operator) Lowest Hourly Rate $10.00 $15.00 $10.00 $15.00 $16.32 Lowest Hourly Rate Average $19.07 $16.87 $19.69 $20.02 $19.83 Average Hourly Rate $20.33 $18.19 $20.96 $21.18 $21.69 Highest Hourly Rate Average $21.86 $19.74 $22.53 $22.56 $23.31 Highest Hourly Rate $27.90 $22.44 $27.90 $27.90 $25.19
Machine Repair & Maintenance Lowest Hourly Rate $12.00 $12.00 $16.00 $18.00 $12.94 Lowest Hourly Rate Average $20.47 $17.79 $20.71 $20.99 $18.97 Average Hourly Rate $21.53 $19.57 $21.50 $22.10 $21.15 Highest Hourly Rate Average $22.76 $21.24 $22.81 $23.94 $22.16 Highest Hourly Rate $43.50 $27.00 $27.90 $27.90 $30.00
33
Mid-Atlantic Region (NY, PA) & Southeast Region Manufacturing Support Wage Rates New Phila./ Mid York Penn- Pittsburgh Delaware Nashville Manufacturing Support Functions Atlantic State sylvania Chapter Valley Southeast Chapter
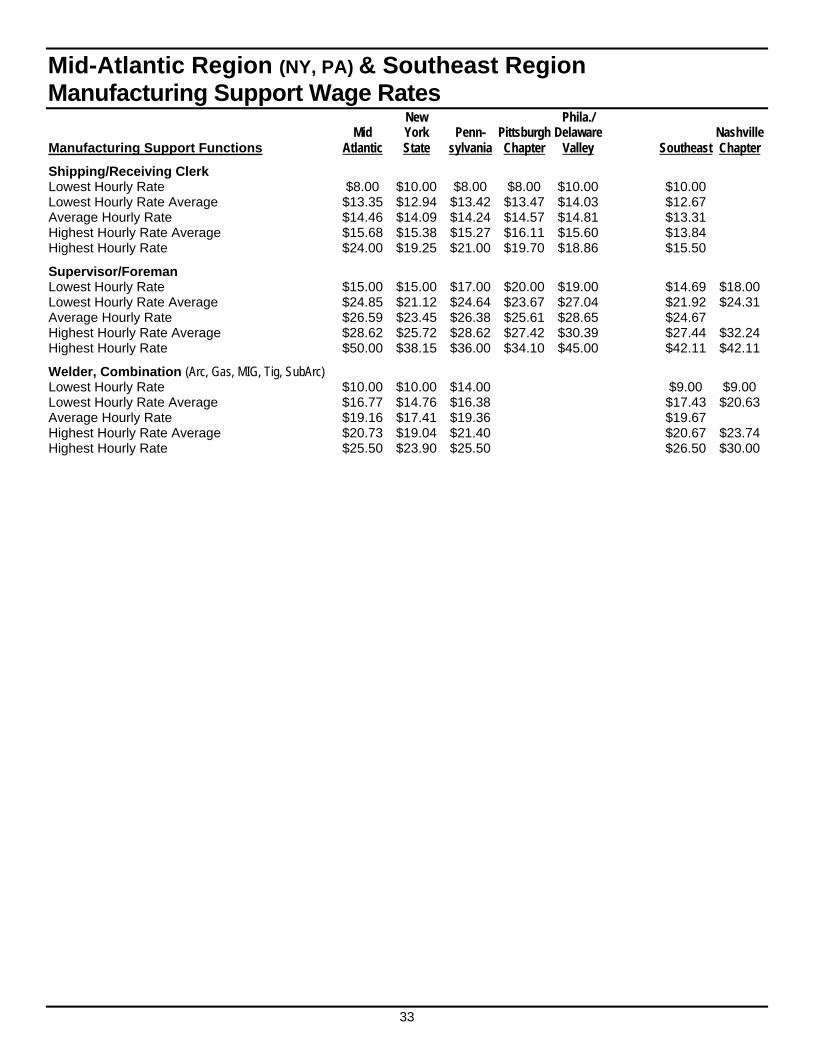
Shipping/Receiving Clerk Lowest Hourly Rate $8.00 $10.00 $8.00 $8.00 $10.00 $10.00 Lowest Hourly Rate Average $13.35 $12.94 $13.42 $13.47 $14.03 $12.67 Average Hourly Rate $14.46 $14.09 $14.24 $14.57 $14.81 $13.31 Highest Hourly Rate Average $15.68 $15.38 $15.27 $16.11 $15.60 $13.84 Highest Hourly Rate $24.00 $19.25 $21.00 $19.70 $18.86 $15.50
Supervisor/Foreman Lowest Hourly Rate $15.00 $15.00 $17.00 $20.00 $19.00 $14.69 $18.00Lowest Hourly Rate Average $24.85 $21.12 $24.64 $23.67 $27.04 $21.92 $24.31Average Hourly Rate $26.59 $23.45 $26.38 $25.61 $28.65 $24.67 Highest Hourly Rate Average $28.62 $25.72 $28.62 $27.42 $30.39 $27.44 $32.24Highest Hourly Rate $50.00 $38.15 $36.00 $34.10 $45.00 $42.11 $42.11
Welder, Combination (Arc, Gas, MIG, Tig, SubArc) Lowest Hourly Rate $10.00 $10.00 $14.00 $9.00 $9.00 Lowest Hourly Rate Average $16.77 $14.76 $16.38 $17.43 $20.63Average Hourly Rate $19.16 $17.41 $19.36 $19.67 Highest Hourly Rate Average $20.73 $19.04 $21.40 $20.67 $23.74Highest Hourly Rate $25.50 $23.90 $25.50 $26.50 $30.00
34
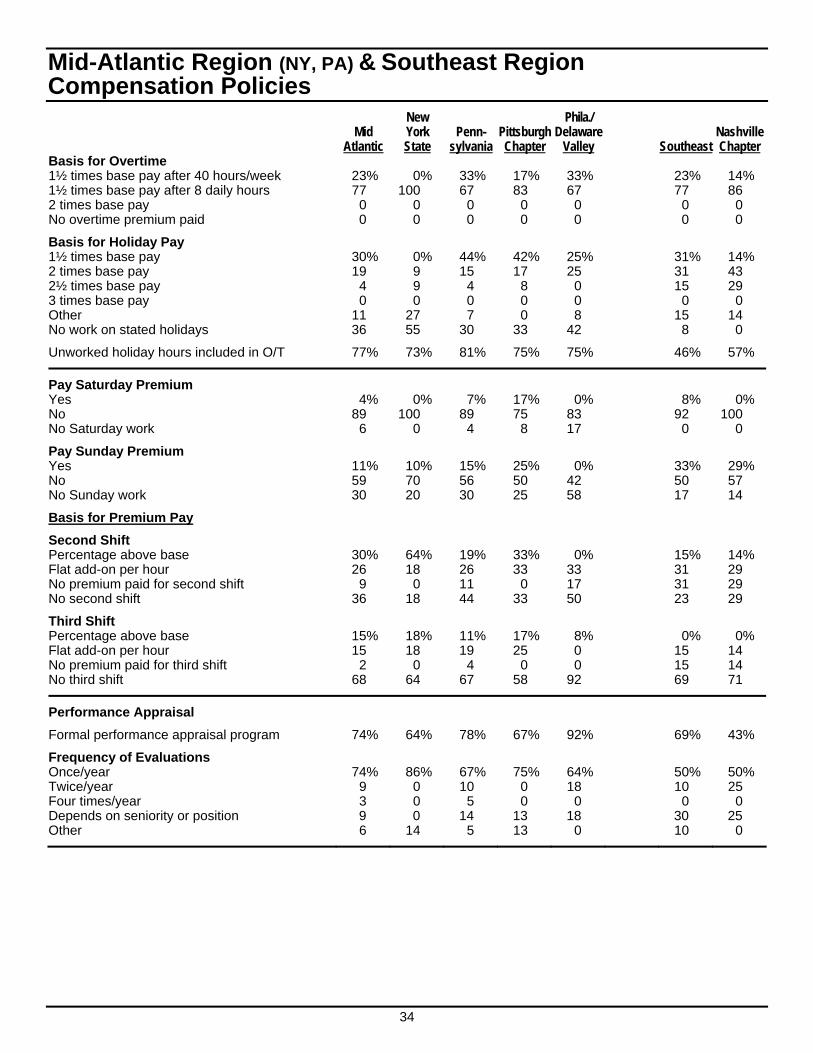
Mid-Atlantic Region (NY, PA) & Southeast Region Compensation Policies New Phila./ Mid York Penn- Pittsburgh Delaware Nashville Atlantic State sylvania Chapter Valley Southeast Chapter Basis for Overtime 1½ times base pay after 40 hours/week 23% 0% 33% 17% 33% 23% 14% 1½ times base pay after 8 daily hours 77 100 67 83 67 77 86 2 times base pay 0 0 0 0 0 0 0 No overtime premium paid 0 0 0 0 0 0 0
Basis for Holiday Pay 1½ times base pay 30% 0% 44% 42% 25% 31% 14% 2 times base pay 19 9 15 17 25 31 43 2½ times base pay 4 9 4 8 0 15 29 3 times base pay 0 0 0 0 0 0 0 Other 11 27 7 0 8 15 14 No work on stated holidays 36 55 30 33 42 8 0
Unworked holiday hours included in O/T 77% 73% 81% 75% 75% 46% 57%
Pay Saturday Premium Yes 4% 0% 7% 17% 0% 8% 0% No 89 100 89 75 83 92 100 No Saturday work 6 0 4 8 17 0 0
Pay Sunday Premium Yes 11% 10% 15% 25% 0% 33% 29% No 59 70 56 50 42 50 57 No Sunday work 30 20 30 25 58 17 14
Basis for Premium Pay
Second Shift Percentage above base 30% 64% 19% 33% 0% 15% 14% Flat add-on per hour 26 18 26 33 33 31 29 No premium paid for second shift 9 0 11 0 17 31 29 No second shift 36 18 44 33 50 23 29
Third Shift Percentage above base 15% 18% 11% 17% 8% 0% 0% Flat add-on per hour 15 18 19 25 0 15 14 No premium paid for third shift 2 0 4 0 0 15 14 No third shift 68 64 67 58 92 69 71
Performance Appraisal
Formal performance appraisal program 74% 64% 78% 67% 92% 69% 43%
Frequency of Evaluations Once/year 74% 86% 67% 75% 64% 50% 50% Twice/year 9 0 10 0 18 10 25 Four times/year 3 0 5 0 0 0 0 Depends on seniority or position 9 0 14 13 18 30 25 Other 6 14 5 13 0 10 0
35
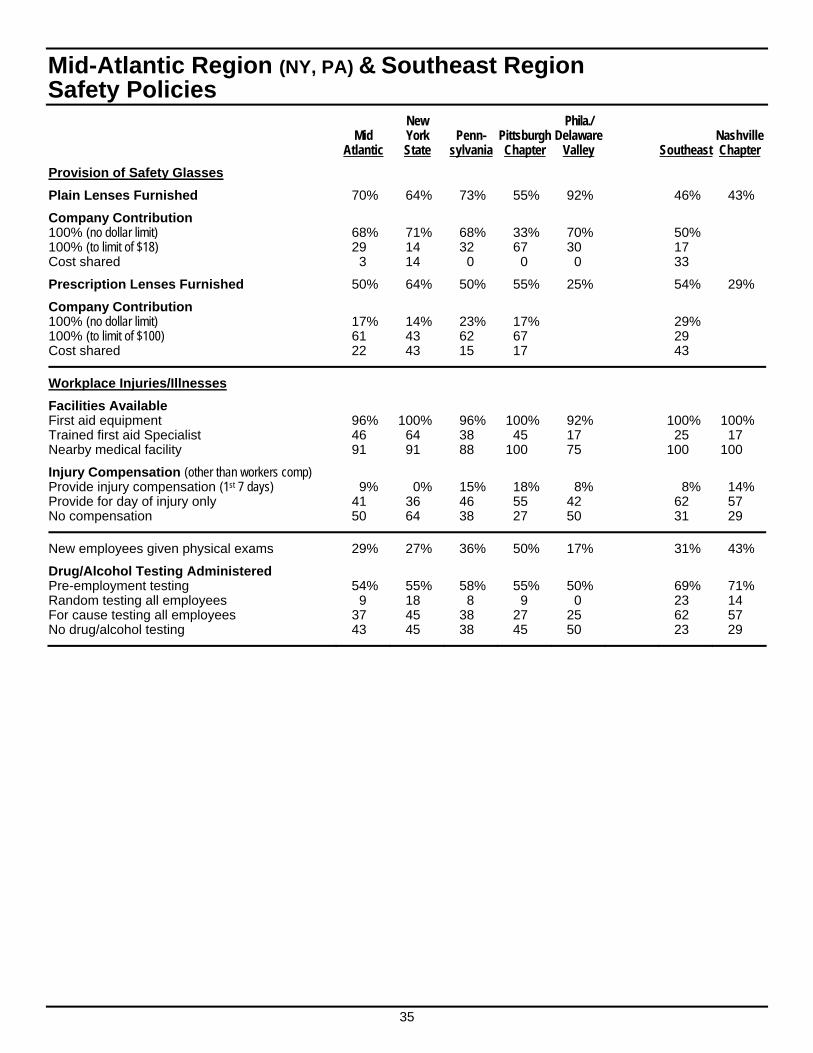
Mid-Atlantic Region (NY, PA) & Southeast Region Safety Policies New Phila./ Mid York Penn- Pittsburgh Delaware Nashville Atlantic State sylvania Chapter Valley Southeast Chapter
Provision of Safety Glasses
Plain Lenses Furnished 70% 64% 73% 55% 92% 46% 43%
Company Contribution 100% (no dollar limit) 68% 71% 68% 33% 70% 50% 100% (to limit of $18) 29 14 32 67 30 17 Cost shared 3 14 0 0 0 33
Prescription Lenses Furnished 50% 64% 50% 55% 25% 54% 29%
Company Contribution 100% (no dollar limit) 17% 14% 23% 17% 29% 100% (to limit of $100) 61 43 62 67 29 Cost shared 22 43 15 17 43
Workplace Injuries/Illnesses
Facilities Available First aid equipment 96% 100% 96% 100% 92% 100% 100% Trained first aid Specialist 46 64 38 45 17 25 17 Nearby medical facility 91 91 88 100 75 100 100
Injury Compensation (other than workers comp) Provide injury compensation (1st 7 days) 9% 0% 15% 18% 8% 8% 14% Provide for day of injury only 41 36 46 55 42 62 57 No compensation 50 64 38 27 50 31 29
New employees given physical exams 29% 27% 36% 50% 17% 31% 43%
Drug/Alcohol Testing Administered Pre-employment testing 54% 55% 58% 55% 50% 69% 71% Random testing all employees 9 18 8 9 0 23 14 For cause testing all employees 37 45 38 27 25 62 57 No drug/alcohol testing 43 45 38 45 50 23 29
36
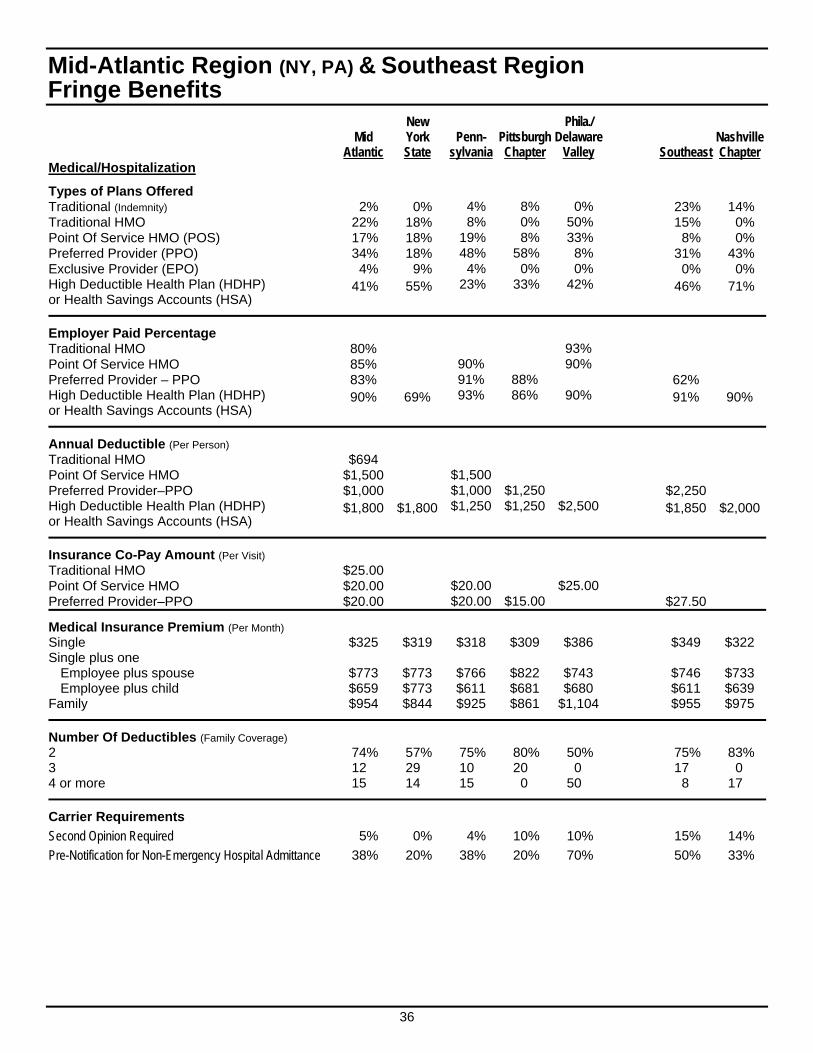
Mid-Atlantic Region (NY, PA) & Southeast Region Fringe Benefits
New Phila./ Mid York Penn- Pittsburgh Delaware Nashville Atlantic State sylvania Chapter Valley Southeast Chapter
Medical/Hospitalization
Types of Plans Offered Traditional (Indemnity) 2% 0% 4% 8% 0% 23% 14% Traditional HMO 22% 18% 8% 0% 50% 15% 0% Point Of Service HMO (POS) 17% 18% 19% 8% 33% 8% 0% Preferred Provider (PPO) 34% 18% 48% 58% 8% 31% 43% Exclusive Provider (EPO) 4% 9% 4% 0% 0% 0% 0% High Deductible Health Plan (HDHP) or Health Savings Accounts (HSA)
41% 55% 23% 33% 42% 46% 71%
Employer Paid Percentage Traditional HMO 80% 93% Point Of Service HMO 85% 90% 90% Preferred Provider – PPO 83% 91% 88% 62% High Deductible Health Plan (HDHP) or Health Savings Accounts (HSA)
90% 69% 93% 86% 90% 91% 90%
Annual Deductible (Per Person) Traditional HMO $694 Point Of Service HMO $1,500 $1,500 Preferred Provider–PPO $1,000 $1,000 $1,250 $2,250 High Deductible Health Plan (HDHP) or Health Savings Accounts (HSA)
$1,800 $1,800 $1,250 $1,250 $2,500 $1,850 $2,000
Insurance Co-Pay Amount (Per Visit) Traditional HMO $25.00 Point Of Service HMO $20.00 $20.00 $25.00 Preferred Provider–PPO $20.00 $20.00 $15.00 $27.50
Medical Insurance Premium (Per Month) Single $325 $319 $318 $309 $386 $349 $322 Single plus one
Employee plus spouse $773 $773 $766 $822 $743 $746 $733 Employee plus child $659 $773 $611 $681 $680 $611 $639
Family $954 $844 $925 $861 $1,104 $955 $975
Number Of Deductibles (Family Coverage) 2 74% 57% 75% 80% 50% 75% 83% 3 12 29 10 20 0 17 0 4 or more 15 14 15 0 50 8 17
Carrier Requirements
Second Opinion Required 5% 0% 4% 10% 10% 15% 14%
Pre-Notification for Non-Emergency Hospital Admittance 38% 20% 38% 20% 70% 50% 33%
37
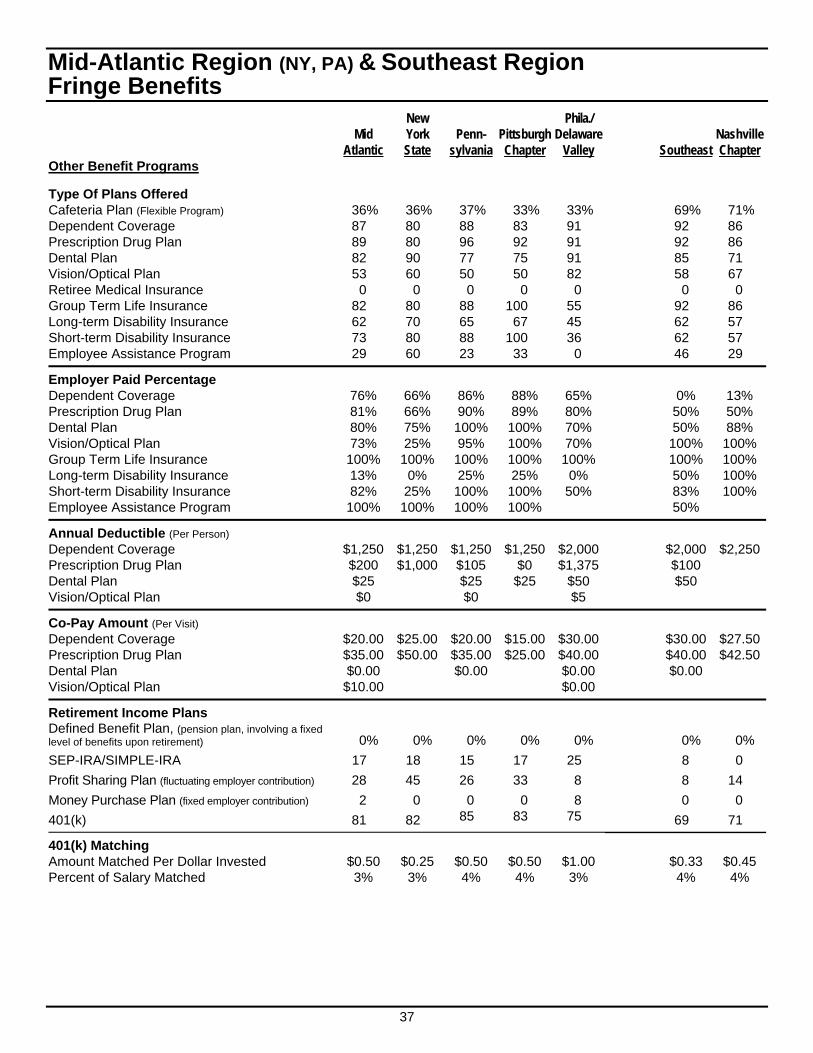
Mid-Atlantic Region (NY, PA) & Southeast Region Fringe Benefits New Phila./ Mid York Penn- Pittsburgh Delaware Nashville Atlantic State sylvania Chapter Valley Southeast Chapter Other Benefit Programs
Type Of Plans Offered Cafeteria Plan (Flexible Program) 36% 36% 37% 33% 33% 69% 71% Dependent Coverage 87 80 88 83 91 92 86 Prescription Drug Plan 89 80 96 92 91 92 86 Dental Plan 82 90 77 75 91 85 71 Vision/Optical Plan 53 60 50 50 82 58 67 Retiree Medical Insurance 0 0 0 0 0 0 0 Group Term Life Insurance 82 80 88 100 55 92 86 Long-term Disability Insurance 62 70 65 67 45 62 57 Short-term Disability Insurance 73 80 88 100 36 62 57 Employee Assistance Program 29 60 23 33 0 46 29
Employer Paid Percentage Dependent Coverage 76% 66% 86% 88% 65% 0% 13% Prescription Drug Plan 81% 66% 90% 89% 80% 50% 50% Dental Plan 80% 75% 100% 100% 70% 50% 88% Vision/Optical Plan 73% 25% 95% 100% 70% 100% 100% Group Term Life Insurance 100% 100% 100% 100% 100% 100% 100% Long-term Disability Insurance 13% 0% 25% 25% 0% 50% 100% Short-term Disability Insurance 82% 25% 100% 100% 50% 83% 100% Employee Assistance Program 100% 100% 100% 100% 50%
Annual Deductible (Per Person) Dependent Coverage $1,250 $1,250 $1,250 $1,250 $2,000 $2,000 $2,250Prescription Drug Plan $200 $1,000 $105 $0 $1,375 $100 Dental Plan $25 $25 $25 $50 $50 Vision/Optical Plan $0 $0 $5
Co-Pay Amount (Per Visit) Dependent Coverage $20.00 $25.00 $20.00 $15.00 $30.00 $30.00 $27.50Prescription Drug Plan $35.00 $50.00 $35.00 $25.00 $40.00 $40.00 $42.50Dental Plan $0.00 $0.00 $0.00 $0.00 Vision/Optical Plan $10.00 $0.00
Retirement Income Plans Defined Benefit Plan, (pension plan, involving a fixed level of benefits upon retirement) 0% 0% 0% 0% 0% 0% 0%
SEP-IRA/SIMPLE-IRA 17 18 15 17 25 8 0
Profit Sharing Plan (fluctuating employer contribution) 28 45 26 33 8 8 14
Money Purchase Plan (fixed employer contribution) 2 0 0 0 8 0 0
401(k) 81 82 85 83 75 69 71
401(k) Matching Amount Matched Per Dollar Invested $0.50 $0.25 $0.50 $0.50 $1.00 $0.33 $0.45 Percent of Salary Matched 3% 3% 4% 4% 3% 4% 4%
38
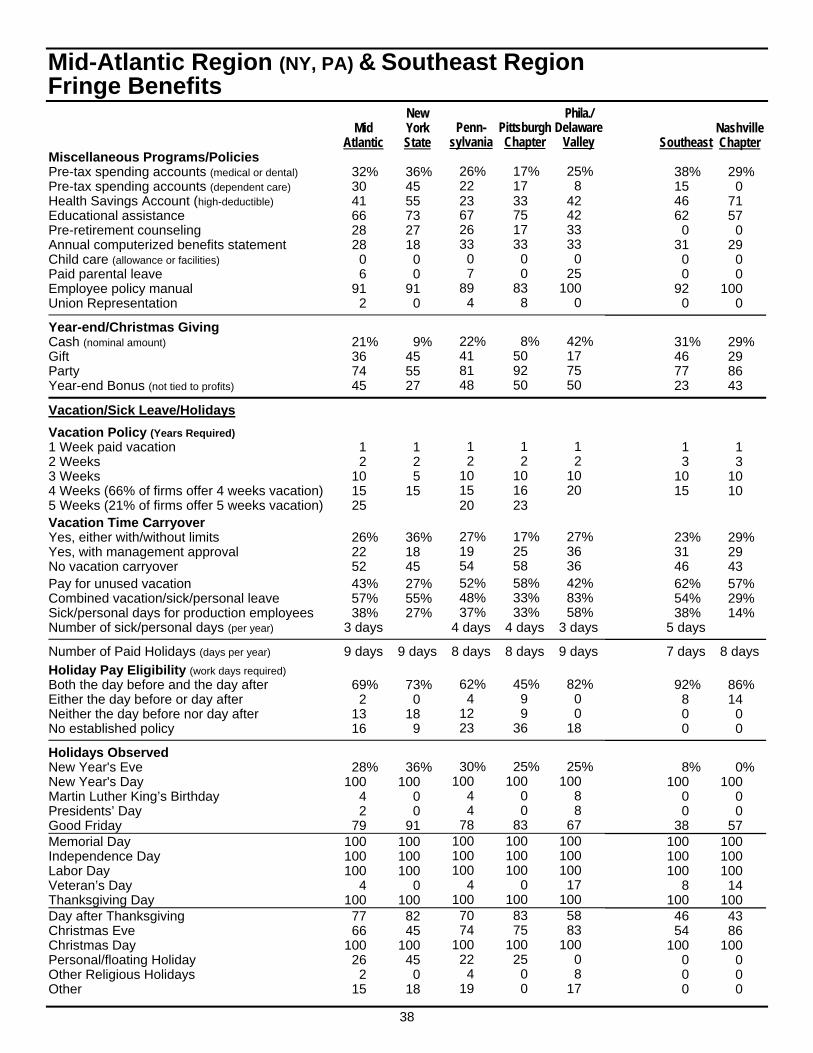
Mid-Atlantic Region (NY, PA) & Southeast Region Fringe Benefits New Phila./ Mid York Penn- Pittsburgh Delaware Nashville Atlantic State sylvania Chapter Valley Southeast Chapter Miscellaneous Programs/Policies Pre-tax spending accounts (medical or dental) 32% 36% 26% 17% 25% 38% 29% Pre-tax spending accounts (dependent care) 30 45 22 17 8 15 0 Health Savings Account (high-deductible) 41 55 23 33 42 46 71 Educational assistance 66 73 67 75 42 62 57 Pre-retirement counseling 28 27 26 17 33 0 0 Annual computerized benefits statement 28 18 33 33 33 31 29 Child care (allowance or facilities) 0 0 0 0 0 0 0 Paid parental leave 6 0 7 0 25 0 0 Employee policy manual 91 91 89 83 100 92 100 Union Representation 2 0 4 8 0 0 0
Year-end/Christmas Giving Cash (nominal amount) 21% 9% 22% 8% 42% 31% 29% Gift 36 45 41 50 17 46 29 Party 74 55 81 92 75 77 86 Year-end Bonus (not tied to profits) 45 27 48 50 50 23 43
Vacation/Sick Leave/Holidays
Vacation Policy (Years Required) 1 Week paid vacation 1 1 1 1 1 1 1 2 Weeks 2 2 2 2 2 3 3 3 Weeks 10 5 10 10 10 10 10 4 Weeks (66% of firms offer 4 weeks vacation) 15 15 15 16 20 15 10 5 Weeks (21% of firms offer 5 weeks vacation) 25 20 23 Vacation Time Carryover Yes, either with/without limits 26% 36% 27% 17% 27% 23% 29% Yes, with management approval 22 18 19 25 36 31 29 No vacation carryover 52 45 54 58 36 46 43 Pay for unused vacation 43% 27% 52% 58% 42% 62% 57% Combined vacation/sick/personal leave 57% 55% 48% 33% 83% 54% 29% Sick/personal days for production employees 38% 27% 37% 33% 58% 38% 14% Number of sick/personal days (per year) 3 days 4 days 4 days 3 days 5 days
Number of Paid Holidays (days per year) 9 days 9 days 8 days 8 days 9 days 7 days 8 days
Holiday Pay Eligibility (work days required) Both the day before and the day after 69% 73% 62% 45% 82% 92% 86% Either the day before or day after 2 0 4 9 0 8 14 Neither the day before nor day after 13 18 12 9 0 0 0 No established policy 16 9 23 36 18 0 0
Holidays Observed New Year's Eve 28% 36% 30% 25% 25% 8% 0% New Year's Day 100 100 100 100 100 100 100 Martin Luther King’s Birthday 4 0 4 0 8 0 0 Presidents’ Day 2 0 4 0 8 0 0 Good Friday 79 91 78 83 67 38 57 Memorial Day 100 100 100 100 100 100 100 Independence Day 100 100 100 100 100 100 100 Labor Day 100 100 100 100 100 100 100 Veteran’s Day 4 0 4 0 17 8 14 Thanksgiving Day 100 100 100 100 100 100 100 Day after Thanksgiving 77 82 70 83 58 46 43 Christmas Eve 66 45 74 75 83 54 86 Christmas Day 100 100 100 100 100 100 100 Personal/floating Holiday 26 45 22 25 0 0 0 Other Religious Holidays 2 0 4 0 8 0 0 Other 15 18 19 0 17 0 0
39
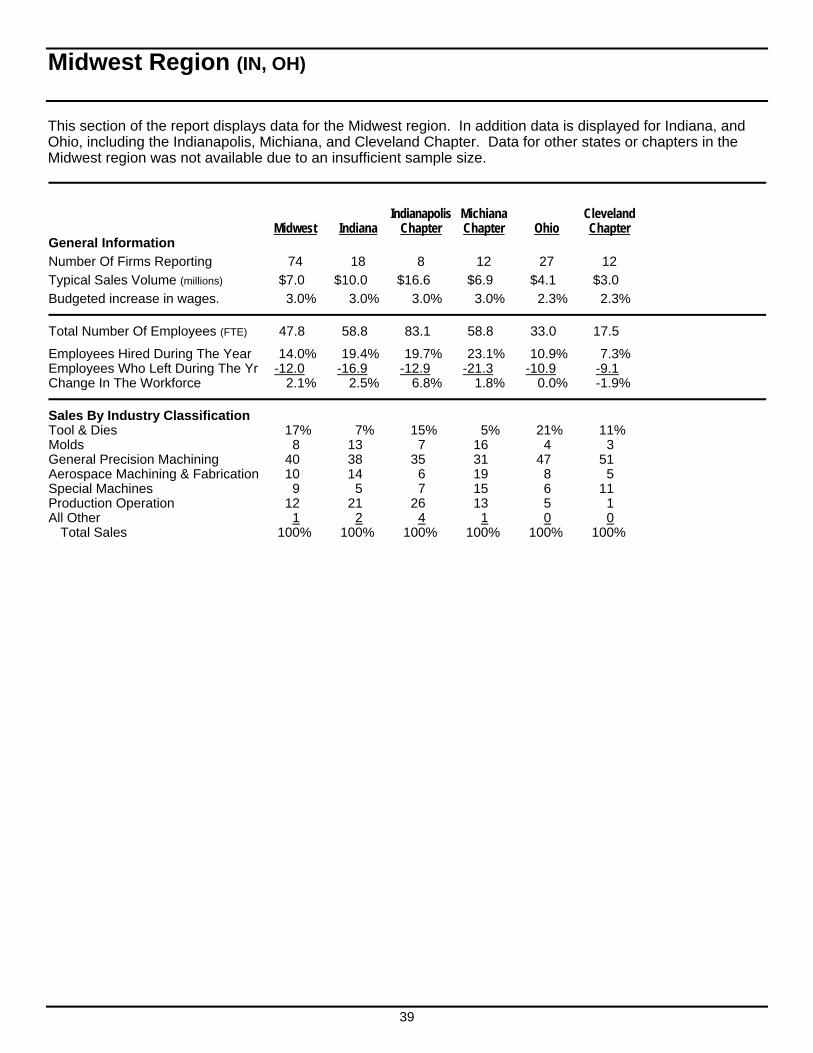
Midwest Region (IN, OH)
This section of the report displays data for the Midwest region. In addition data is displayed for Indiana, and Ohio, including the Indianapolis, Michiana, and Cleveland Chapter. Data for other states or chapters in the Midwest region was not available due to an insufficient sample size.
Indianapolis Michiana Cleveland Midwest Indiana Chapter Chapter Ohio Chapter General Information
Number Of Firms Reporting 74 18 8 12 27 12
Typical Sales Volume (millions) $7.0 $10.0 $16.6 $6.9 $4.1 $3.0
Budgeted increase in wages. 3.0% 3.0% 3.0% 3.0% 2.3% 2.3%
Total Number Of Employees (FTE) 47.8 58.8 83.1 58.8 33.0 17.5
Employees Hired During The Year 14.0% 19.4% 19.7% 23.1% 10.9% 7.3% Employees Who Left During The Yr -12.0 -16.9 -12.9 -21.3 -10.9 -9.1 Change In The Workforce 2.1% 2.5% 6.8% 1.8% 0.0% -1.9%
Sales By Industry Classification Tool & Dies 17% 7% 15% 5% 21% 11% Molds 8 13 7 16 4 3 General Precision Machining 40 38 35 31 47 51 Aerospace Machining & Fabrication 10 14 6 19 8 5 Special Machines 9 5 7 15 6 11 Production Operation 12 21 26 13 5 1 All Other 1 2 4 1 0 0
Total Sales 100% 100% 100% 100% 100% 100%
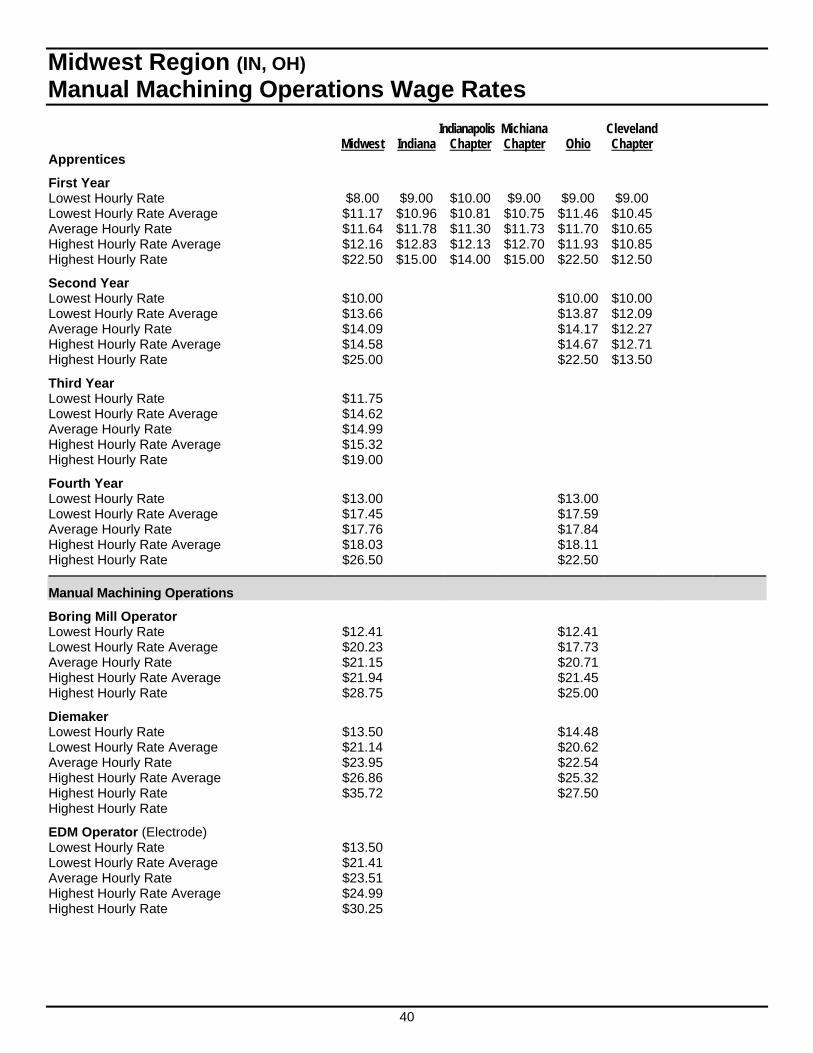
40
Midwest Region (IN, OH) Manual Machining Operations Wage Rates Indianapolis Michiana Cleveland Midwest Indiana Chapter Chapter Ohio Chapter Apprentices
First Year Lowest Hourly Rate $8.00 $9.00 $10.00 $9.00 $9.00 $9.00 Lowest Hourly Rate Average $11.17 $10.96 $10.81 $10.75 $11.46 $10.45 Average Hourly Rate $11.64 $11.78 $11.30 $11.73 $11.70 $10.65 Highest Hourly Rate Average $12.16 $12.83 $12.13 $12.70 $11.93 $10.85 Highest Hourly Rate $22.50 $15.00 $14.00 $15.00 $22.50 $12.50
Second Year Lowest Hourly Rate $10.00 $10.00 $10.00 Lowest Hourly Rate Average $13.66 $13.87 $12.09 Average Hourly Rate $14.09 $14.17 $12.27 Highest Hourly Rate Average $14.58 $14.67 $12.71 Highest Hourly Rate $25.00 $22.50 $13.50
Third Year Lowest Hourly Rate $11.75 Lowest Hourly Rate Average $14.62 Average Hourly Rate $14.99 Highest Hourly Rate Average $15.32 Highest Hourly Rate $19.00
Fourth Year Lowest Hourly Rate $13.00 $13.00 Lowest Hourly Rate Average $17.45 $17.59 Average Hourly Rate $17.76 $17.84 Highest Hourly Rate Average $18.03 $18.11 Highest Hourly Rate $26.50 $22.50
Manual Machining Operations
Boring Mill Operator Lowest Hourly Rate $12.41 $12.41 Lowest Hourly Rate Average $20.23 $17.73 Average Hourly Rate $21.15 $20.71 Highest Hourly Rate Average $21.94 $21.45 Highest Hourly Rate $28.75 $25.00
Diemaker Lowest Hourly Rate $13.50 $14.48 Lowest Hourly Rate Average $21.14 $20.62 Average Hourly Rate $23.95 $22.54 Highest Hourly Rate Average $26.86 $25.32 Highest Hourly Rate $35.72 $27.50 Highest Hourly Rate
EDM Operator (Electrode) Lowest Hourly Rate $13.50 Lowest Hourly Rate Average $21.41 Average Hourly Rate $23.51 Highest Hourly Rate Average $24.99 Highest Hourly Rate $30.25
41
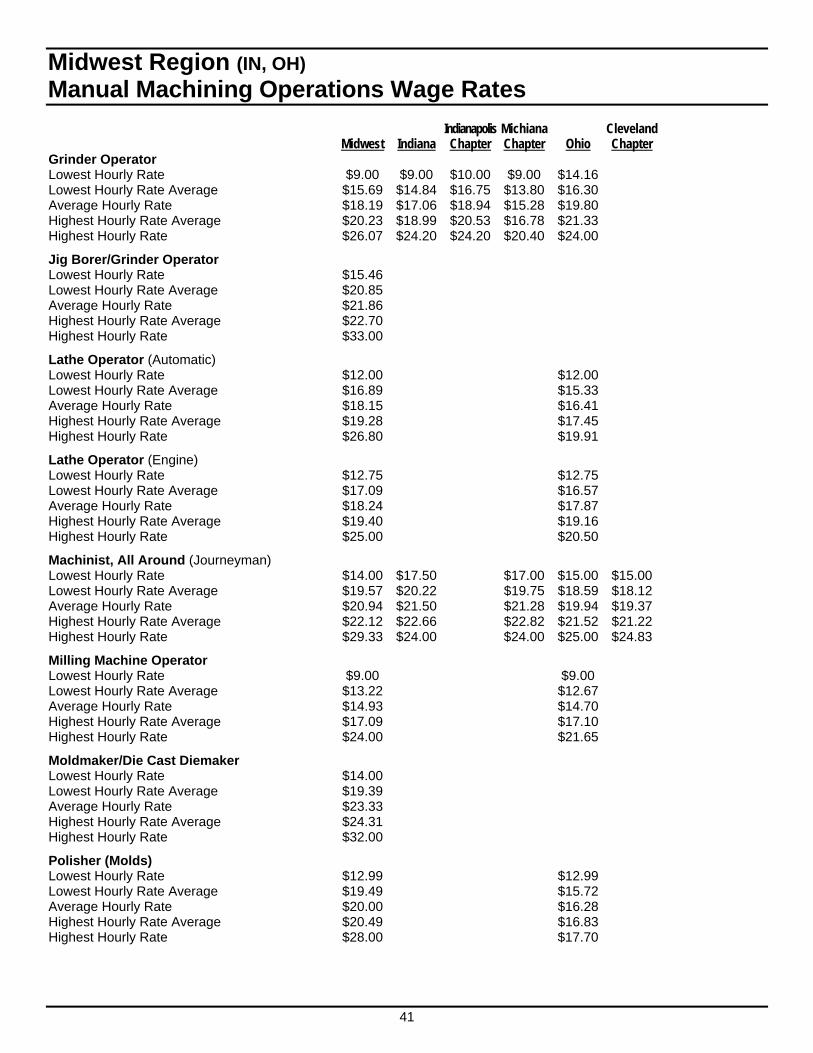
Midwest Region (IN, OH) Manual Machining Operations Wage Rates Indianapolis Michiana Cleveland Midwest Indiana Chapter Chapter Ohio Chapter Grinder Operator Lowest Hourly Rate $9.00 $9.00 $10.00 $9.00 $14.16 Lowest Hourly Rate Average $15.69 $14.84 $16.75 $13.80 $16.30 Average Hourly Rate $18.19 $17.06 $18.94 $15.28 $19.80 Highest Hourly Rate Average $20.23 $18.99 $20.53 $16.78 $21.33 Highest Hourly Rate $26.07 $24.20 $24.20 $20.40 $24.00
Jig Borer/Grinder Operator Lowest Hourly Rate $15.46 Lowest Hourly Rate Average $20.85 Average Hourly Rate $21.86 Highest Hourly Rate Average $22.70 Highest Hourly Rate $33.00
Lathe Operator (Automatic) Lowest Hourly Rate $12.00 $12.00 Lowest Hourly Rate Average $16.89 $15.33 Average Hourly Rate $18.15 $16.41 Highest Hourly Rate Average $19.28 $17.45 Highest Hourly Rate $26.80 $19.91
Lathe Operator (Engine) Lowest Hourly Rate $12.75 $12.75 Lowest Hourly Rate Average $17.09 $16.57 Average Hourly Rate $18.24 $17.87 Highest Hourly Rate Average $19.40 $19.16 Highest Hourly Rate $25.00 $20.50
Machinist, All Around (Journeyman) Lowest Hourly Rate $14.00 $17.50 $17.00 $15.00 $15.00 Lowest Hourly Rate Average $19.57 $20.22 $19.75 $18.59 $18.12 Average Hourly Rate $20.94 $21.50 $21.28 $19.94 $19.37 Highest Hourly Rate Average $22.12 $22.66 $22.82 $21.52 $21.22 Highest Hourly Rate $29.33 $24.00 $24.00 $25.00 $24.83
Milling Machine Operator Lowest Hourly Rate $9.00 $9.00 Lowest Hourly Rate Average $13.22 $12.67 Average Hourly Rate $14.93 $14.70 Highest Hourly Rate Average $17.09 $17.10 Highest Hourly Rate $24.00 $21.65
Moldmaker/Die Cast Diemaker Lowest Hourly Rate $14.00 Lowest Hourly Rate Average $19.39 Average Hourly Rate $23.33 Highest Hourly Rate Average $24.31 Highest Hourly Rate $32.00
Polisher (Molds) Lowest Hourly Rate $12.99 $12.99 Lowest Hourly Rate Average $19.49 $15.72 Average Hourly Rate $20.00 $16.28 Highest Hourly Rate Average $20.49 $16.83 Highest Hourly Rate $28.00 $17.70
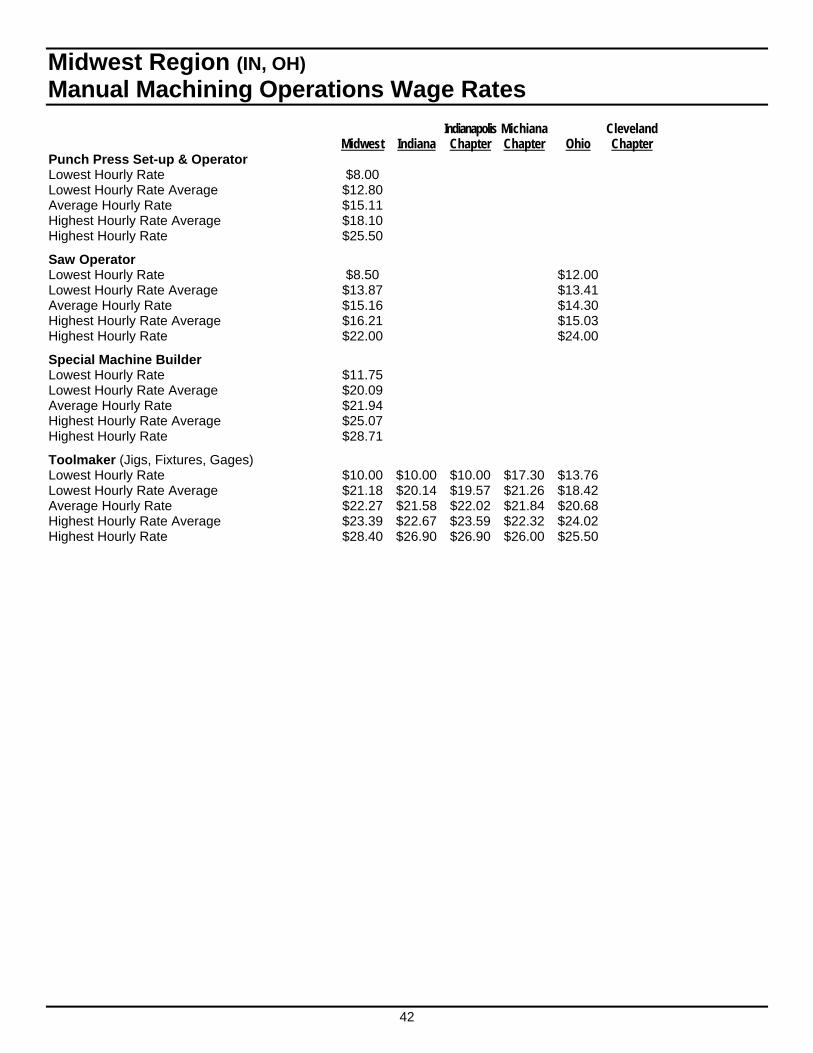
42
Midwest Region (IN, OH) Manual Machining Operations Wage Rates Indianapolis Michiana Cleveland Midwest Indiana Chapter Chapter Ohio Chapter Punch Press Set-up & Operator Lowest Hourly Rate $8.00 Lowest Hourly Rate Average $12.80 Average Hourly Rate $15.11 Highest Hourly Rate Average $18.10 Highest Hourly Rate $25.50
Saw Operator Lowest Hourly Rate $8.50 $12.00 Lowest Hourly Rate Average $13.87 $13.41 Average Hourly Rate $15.16 $14.30 Highest Hourly Rate Average $16.21 $15.03 Highest Hourly Rate $22.00 $24.00
Special Machine Builder Lowest Hourly Rate $11.75 Lowest Hourly Rate Average $20.09 Average Hourly Rate $21.94 Highest Hourly Rate Average $25.07 Highest Hourly Rate $28.71
Toolmaker (Jigs, Fixtures, Gages) Lowest Hourly Rate $10.00 $10.00 $10.00 $17.30 $13.76 Lowest Hourly Rate Average $21.18 $20.14 $19.57 $21.26 $18.42 Average Hourly Rate $22.27 $21.58 $22.02 $21.84 $20.68 Highest Hourly Rate Average $23.39 $22.67 $23.59 $22.32 $24.02 Highest Hourly Rate $28.40 $26.90 $26.90 $26.00 $25.50
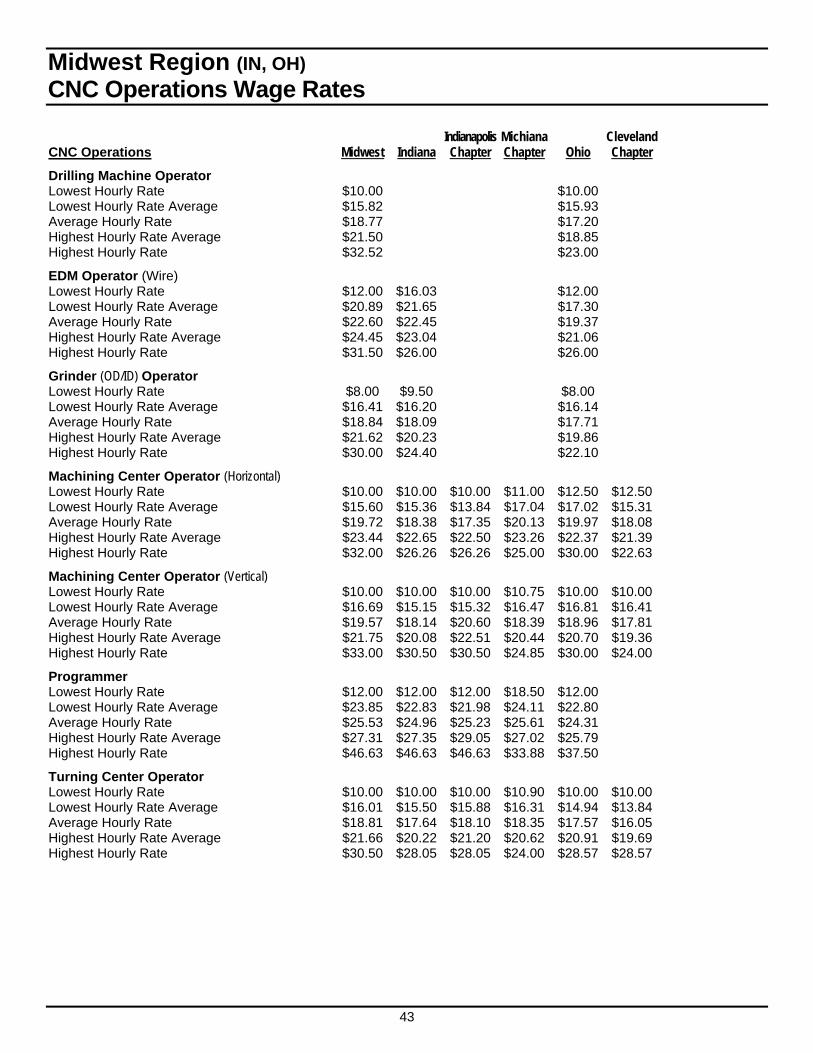
43
Midwest Region (IN, OH) CNC Operations Wage Rates Indianapolis Michiana Cleveland CNC Operations Midwest Indiana Chapter Chapter Ohio Chapter
Drilling Machine Operator Lowest Hourly Rate $10.00 $10.00 Lowest Hourly Rate Average $15.82 $15.93 Average Hourly Rate $18.77 $17.20 Highest Hourly Rate Average $21.50 $18.85 Highest Hourly Rate $32.52 $23.00
EDM Operator (Wire) Lowest Hourly Rate $12.00 $16.03 $12.00 Lowest Hourly Rate Average $20.89 $21.65 $17.30 Average Hourly Rate $22.60 $22.45 $19.37 Highest Hourly Rate Average $24.45 $23.04 $21.06 Highest Hourly Rate $31.50 $26.00 $26.00
Grinder (OD/ID) Operator Lowest Hourly Rate $8.00 $9.50 $8.00 Lowest Hourly Rate Average $16.41 $16.20 $16.14 Average Hourly Rate $18.84 $18.09 $17.71 Highest Hourly Rate Average $21.62 $20.23 $19.86 Highest Hourly Rate $30.00 $24.40 $22.10
Machining Center Operator (Horizontal) Lowest Hourly Rate $10.00 $10.00 $10.00 $11.00 $12.50 $12.50 Lowest Hourly Rate Average $15.60 $15.36 $13.84 $17.04 $17.02 $15.31 Average Hourly Rate $19.72 $18.38 $17.35 $20.13 $19.97 $18.08 Highest Hourly Rate Average $23.44 $22.65 $22.50 $23.26 $22.37 $21.39 Highest Hourly Rate $32.00 $26.26 $26.26 $25.00 $30.00 $22.63
Machining Center Operator (Vertical) Lowest Hourly Rate $10.00 $10.00 $10.00 $10.75 $10.00 $10.00 Lowest Hourly Rate Average $16.69 $15.15 $15.32 $16.47 $16.81 $16.41 Average Hourly Rate $19.57 $18.14 $20.60 $18.39 $18.96 $17.81 Highest Hourly Rate Average $21.75 $20.08 $22.51 $20.44 $20.70 $19.36 Highest Hourly Rate $33.00 $30.50 $30.50 $24.85 $30.00 $24.00
Programmer Lowest Hourly Rate $12.00 $12.00 $12.00 $18.50 $12.00 Lowest Hourly Rate Average $23.85 $22.83 $21.98 $24.11 $22.80 Average Hourly Rate $25.53 $24.96 $25.23 $25.61 $24.31 Highest Hourly Rate Average $27.31 $27.35 $29.05 $27.02 $25.79 Highest Hourly Rate $46.63 $46.63 $46.63 $33.88 $37.50
Turning Center Operator Lowest Hourly Rate $10.00 $10.00 $10.00 $10.90 $10.00 $10.00 Lowest Hourly Rate Average $16.01 $15.50 $15.88 $16.31 $14.94 $13.84 Average Hourly Rate $18.81 $17.64 $18.10 $18.35 $17.57 $16.05 Highest Hourly Rate Average $21.66 $20.22 $21.20 $20.62 $20.91 $19.69 Highest Hourly Rate $30.50 $28.05 $28.05 $24.00 $28.57 $28.57
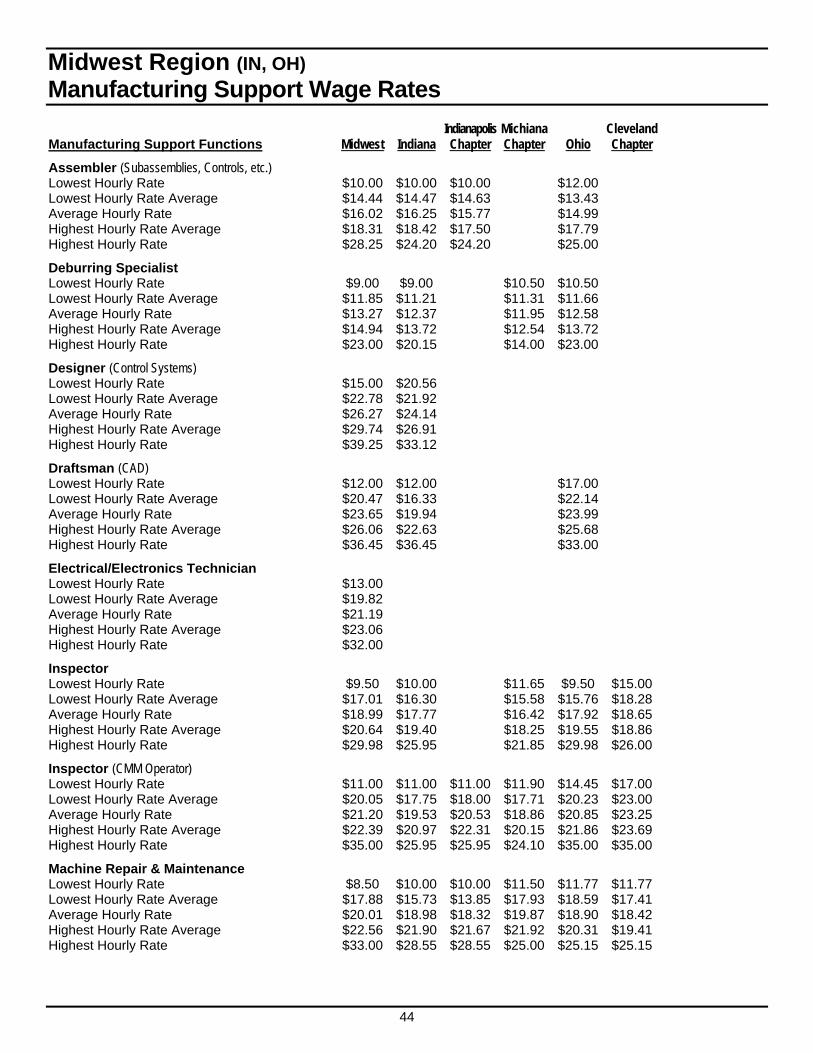
44
Midwest Region (IN, OH) Manufacturing Support Wage Rates Indianapolis Michiana Cleveland Manufacturing Support Functions Midwest Indiana Chapter Chapter Ohio Chapter
Assembler (Subassemblies, Controls, etc.) Lowest Hourly Rate $10.00 $10.00 $10.00 $12.00 Lowest Hourly Rate Average $14.44 $14.47 $14.63 $13.43 Average Hourly Rate $16.02 $16.25 $15.77 $14.99 Highest Hourly Rate Average $18.31 $18.42 $17.50 $17.79 Highest Hourly Rate $28.25 $24.20 $24.20 $25.00
Deburring Specialist Lowest Hourly Rate $9.00 $9.00 $10.50 $10.50 Lowest Hourly Rate Average $11.85 $11.21 $11.31 $11.66 Average Hourly Rate $13.27 $12.37 $11.95 $12.58 Highest Hourly Rate Average $14.94 $13.72 $12.54 $13.72 Highest Hourly Rate $23.00 $20.15 $14.00 $23.00
Designer (Control Systems) Lowest Hourly Rate $15.00 $20.56 Lowest Hourly Rate Average $22.78 $21.92 Average Hourly Rate $26.27 $24.14 Highest Hourly Rate Average $29.74 $26.91 Highest Hourly Rate $39.25 $33.12
Draftsman (CAD) Lowest Hourly Rate $12.00 $12.00 $17.00 Lowest Hourly Rate Average $20.47 $16.33 $22.14 Average Hourly Rate $23.65 $19.94 $23.99 Highest Hourly Rate Average $26.06 $22.63 $25.68 Highest Hourly Rate $36.45 $36.45 $33.00
Electrical/Electronics Technician Lowest Hourly Rate $13.00 Lowest Hourly Rate Average $19.82 Average Hourly Rate $21.19 Highest Hourly Rate Average $23.06 Highest Hourly Rate $32.00
Inspector Lowest Hourly Rate $9.50 $10.00 $11.65 $9.50 $15.00 Lowest Hourly Rate Average $17.01 $16.30 $15.58 $15.76 $18.28 Average Hourly Rate $18.99 $17.77 $16.42 $17.92 $18.65 Highest Hourly Rate Average $20.64 $19.40 $18.25 $19.55 $18.86 Highest Hourly Rate $29.98 $25.95 $21.85 $29.98 $26.00
Inspector (CMM Operator) Lowest Hourly Rate $11.00 $11.00 $11.00 $11.90 $14.45 $17.00 Lowest Hourly Rate Average $20.05 $17.75 $18.00 $17.71 $20.23 $23.00 Average Hourly Rate $21.20 $19.53 $20.53 $18.86 $20.85 $23.25 Highest Hourly Rate Average $22.39 $20.97 $22.31 $20.15 $21.86 $23.69 Highest Hourly Rate $35.00 $25.95 $25.95 $24.10 $35.00 $35.00
Machine Repair & Maintenance Lowest Hourly Rate $8.50 $10.00 $10.00 $11.50 $11.77 $11.77 Lowest Hourly Rate Average $17.88 $15.73 $13.85 $17.93 $18.59 $17.41 Average Hourly Rate $20.01 $18.98 $18.32 $19.87 $18.90 $18.42 Highest Hourly Rate Average $22.56 $21.90 $21.67 $21.92 $20.31 $19.41 Highest Hourly Rate $33.00 $28.55 $28.55 $25.00 $25.15 $25.15
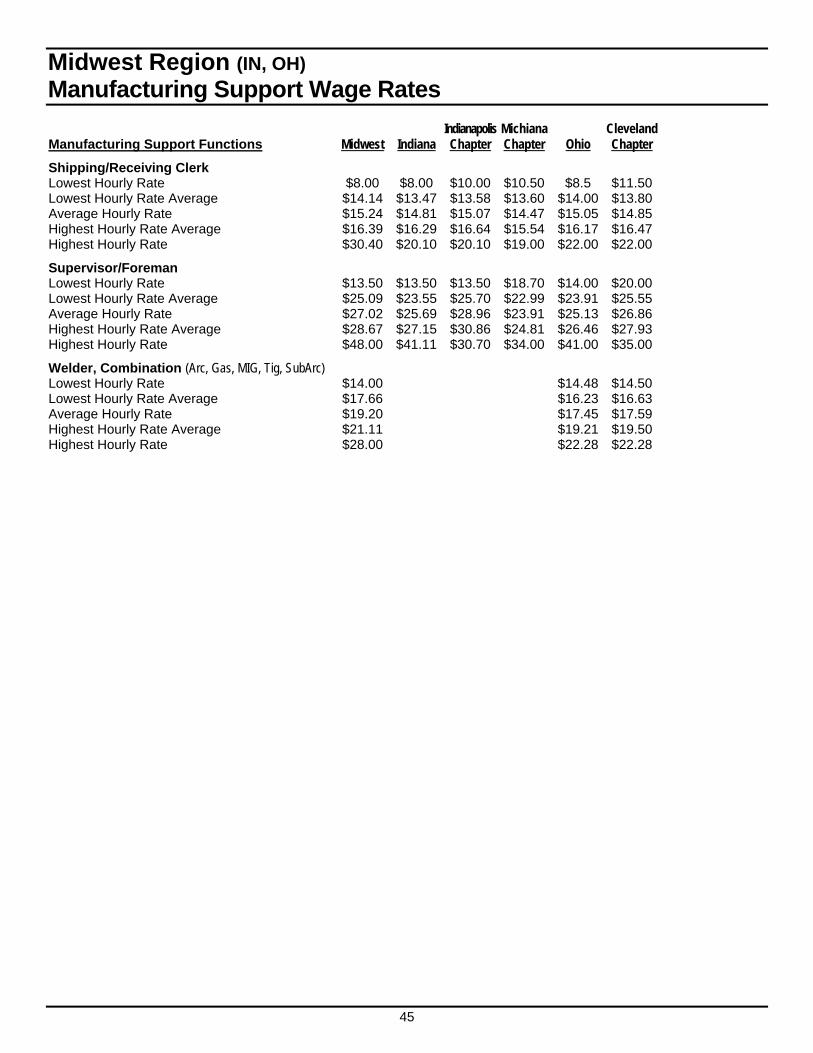
45
Midwest Region (IN, OH) Manufacturing Support Wage Rates Indianapolis Michiana Cleveland Manufacturing Support Functions Midwest Indiana Chapter Chapter Ohio Chapter
Shipping/Receiving Clerk Lowest Hourly Rate $8.00 $8.00 $10.00 $10.50 $8.5 $11.50 Lowest Hourly Rate Average $14.14 $13.47 $13.58 $13.60 $14.00 $13.80 Average Hourly Rate $15.24 $14.81 $15.07 $14.47 $15.05 $14.85 Highest Hourly Rate Average $16.39 $16.29 $16.64 $15.54 $16.17 $16.47 Highest Hourly Rate $30.40 $20.10 $20.10 $19.00 $22.00 $22.00
Supervisor/Foreman Lowest Hourly Rate $13.50 $13.50 $13.50 $18.70 $14.00 $20.00 Lowest Hourly Rate Average $25.09 $23.55 $25.70 $22.99 $23.91 $25.55 Average Hourly Rate $27.02 $25.69 $28.96 $23.91 $25.13 $26.86 Highest Hourly Rate Average $28.67 $27.15 $30.86 $24.81 $26.46 $27.93 Highest Hourly Rate $48.00 $41.11 $30.70 $34.00 $41.00 $35.00
Welder, Combination (Arc, Gas, MIG, Tig, SubArc) Lowest Hourly Rate $14.00 $14.48 $14.50 Lowest Hourly Rate Average $17.66 $16.23 $16.63 Average Hourly Rate $19.20 $17.45 $17.59 Highest Hourly Rate Average $21.11 $19.21 $19.50 Highest Hourly Rate $28.00 $22.28 $22.28
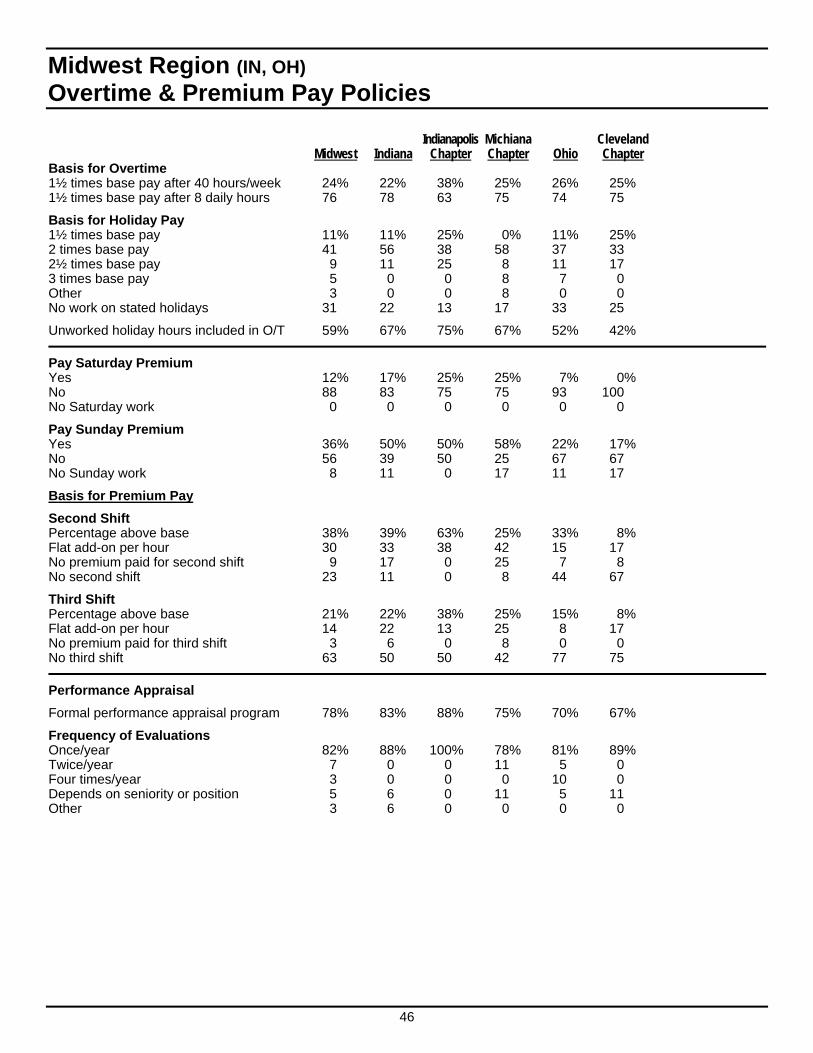
46
Midwest Region (IN, OH) Overtime & Premium Pay Policies Indianapolis Michiana Cleveland Midwest Indiana Chapter Chapter Ohio Chapter Basis for Overtime 1½ times base pay after 40 hours/week 24% 22% 38% 25% 26% 25% 1½ times base pay after 8 daily hours 76 78 63 75 74 75
Basis for Holiday Pay 1½ times base pay 11% 11% 25% 0% 11% 25% 2 times base pay 41 56 38 58 37 33 2½ times base pay 9 11 25 8 11 17 3 times base pay 5 0 0 8 7 0 Other 3 0 0 8 0 0 No work on stated holidays 31 22 13 17 33 25
Unworked holiday hours included in O/T 59% 67% 75% 67% 52% 42%
Pay Saturday Premium Yes 12% 17% 25% 25% 7% 0% No 88 83 75 75 93 100 No Saturday work 0 0 0 0 0 0
Pay Sunday Premium Yes 36% 50% 50% 58% 22% 17% No 56 39 50 25 67 67 No Sunday work 8 11 0 17 11 17
Basis for Premium Pay
Second Shift Percentage above base 38% 39% 63% 25% 33% 8% Flat add-on per hour 30 33 38 42 15 17 No premium paid for second shift 9 17 0 25 7 8 No second shift 23 11 0 8 44 67
Third Shift Percentage above base 21% 22% 38% 25% 15% 8% Flat add-on per hour 14 22 13 25 8 17 No premium paid for third shift 3 6 0 8 0 0 No third shift 63 50 50 42 77 75
Performance Appraisal
Formal performance appraisal program 78% 83% 88% 75% 70% 67%
Frequency of Evaluations Once/year 82% 88% 100% 78% 81% 89% Twice/year 7 0 0 11 5 0 Four times/year 3 0 0 0 10 0 Depends on seniority or position 5 6 0 11 5 11 Other 3 6 0 0 0 0
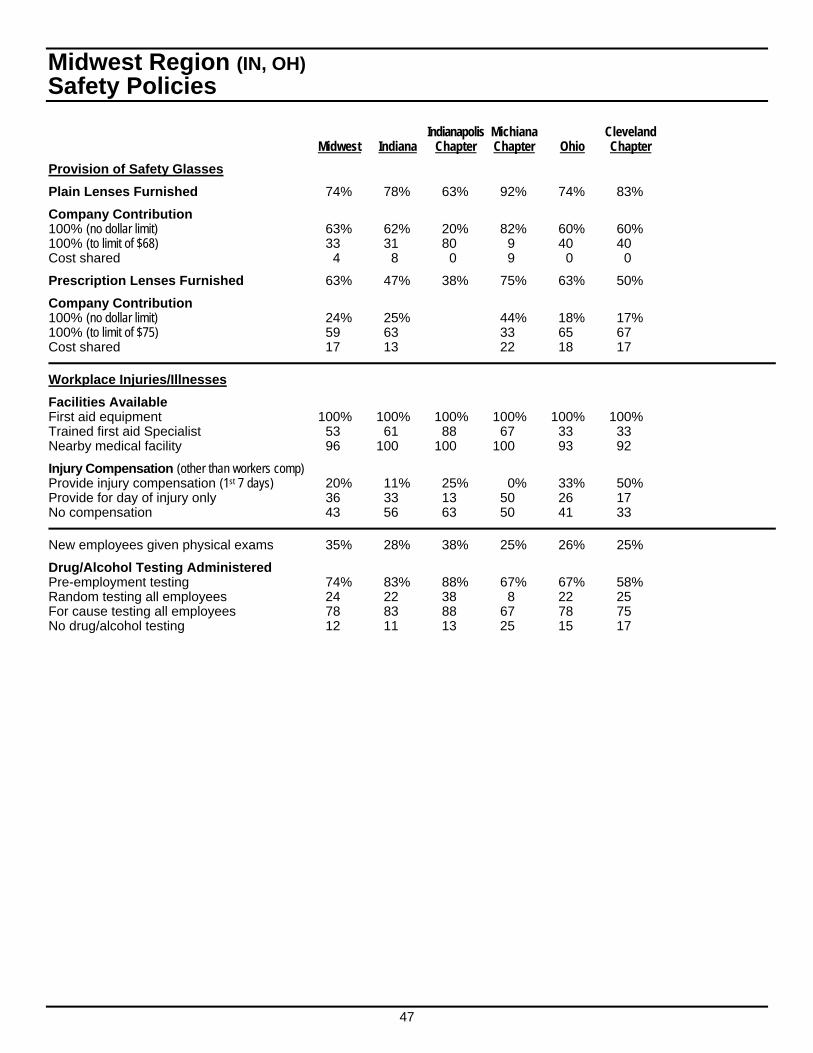
47
Midwest Region (IN, OH) Safety Policies Indianapolis Michiana Cleveland Midwest Indiana Chapter Chapter Ohio Chapter
Provision of Safety Glasses
Plain Lenses Furnished 74% 78% 63% 92% 74% 83%
Company Contribution 100% (no dollar limit) 63% 62% 20% 82% 60% 60% 100% (to limit of $68) 33 31 80 9 40 40 Cost shared 4 8 0 9 0 0
Prescription Lenses Furnished 63% 47% 38% 75% 63% 50%
Company Contribution 100% (no dollar limit) 24% 25% 44% 18% 17% 100% (to limit of $75) 59 63 33 65 67 Cost shared 17 13 22 18 17
Workplace Injuries/Illnesses
Facilities Available First aid equipment 100% 100% 100% 100% 100% 100% Trained first aid Specialist 53 61 88 67 33 33 Nearby medical facility 96 100 100 100 93 92
Injury Compensation (other than workers comp) Provide injury compensation (1st 7 days) 20% 11% 25% 0% 33% 50% Provide for day of injury only 36 33 13 50 26 17 No compensation 43 56 63 50 41 33
New employees given physical exams 35% 28% 38% 25% 26% 25%
Drug/Alcohol Testing Administered Pre-employment testing 74% 83% 88% 67% 67% 58% Random testing all employees 24 22 38 8 22 25 For cause testing all employees 78 83 88 67 78 75 No drug/alcohol testing 12 11 13 25 15 17
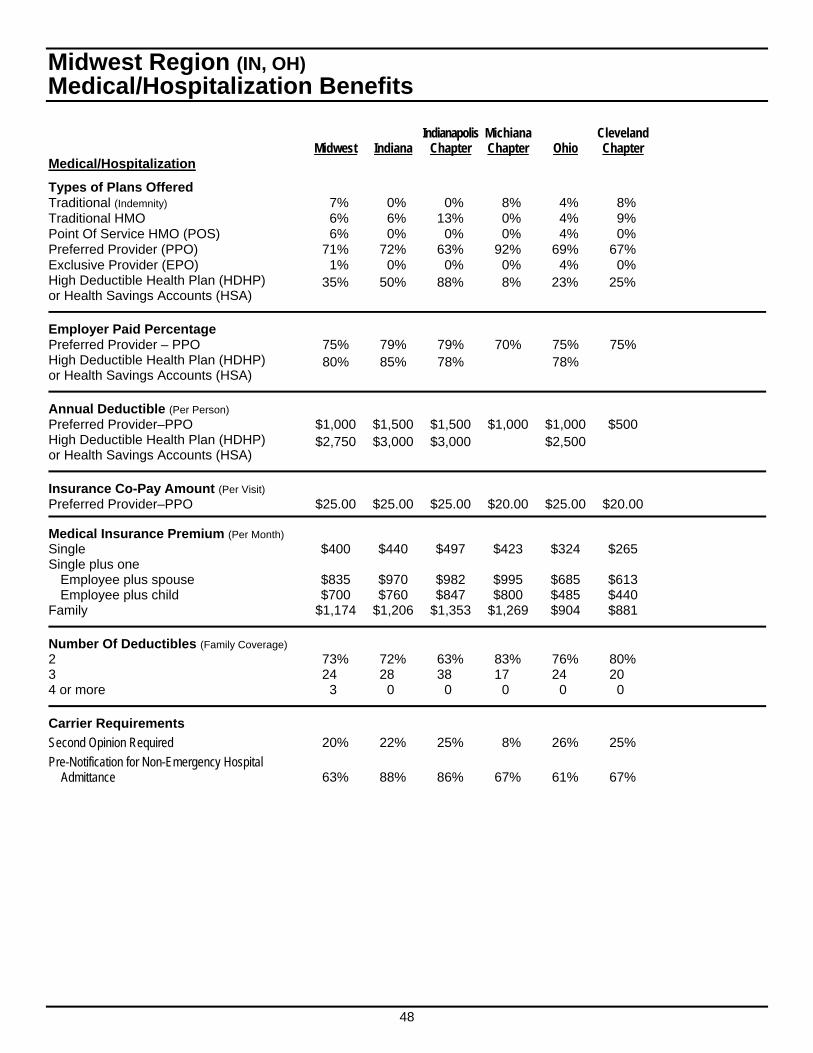
48
Midwest Region (IN, OH) Medical/Hospitalization Benefits Indianapolis Michiana Cleveland Midwest Indiana Chapter Chapter Ohio Chapter Medical/Hospitalization
Types of Plans Offered Traditional (Indemnity) 7% 0% 0% 8% 4% 8% Traditional HMO 6% 6% 13% 0% 4% 9% Point Of Service HMO (POS) 6% 0% 0% 0% 4% 0% Preferred Provider (PPO) 71% 72% 63% 92% 69% 67% Exclusive Provider (EPO) 1% 0% 0% 0% 4% 0% High Deductible Health Plan (HDHP) or Health Savings Accounts (HSA)
35% 50% 88% 8% 23% 25%
Employer Paid Percentage Preferred Provider – PPO 75% 79% 79% 70% 75% 75% High Deductible Health Plan (HDHP) or Health Savings Accounts (HSA)
80% 85% 78% 78%
Annual Deductible (Per Person) Preferred Provider–PPO $1,000 $1,500 $1,500 $1,000 $1,000 $500 High Deductible Health Plan (HDHP) or Health Savings Accounts (HSA)
$2,750 $3,000 $3,000 $2,500
Insurance Co-Pay Amount (Per Visit) Preferred Provider–PPO $25.00 $25.00 $25.00 $20.00 $25.00 $20.00
Medical Insurance Premium (Per Month) Single $400 $440 $497 $423 $324 $265 Single plus one
Employee plus spouse $835 $970 $982 $995 $685 $613 Employee plus child $700 $760 $847 $800 $485 $440
Family $1,174 $1,206 $1,353 $1,269 $904 $881
Number Of Deductibles (Family Coverage) 2 73% 72% 63% 83% 76% 80% 3 24 28 38 17 24 20 4 or more 3 0 0 0 0 0
Carrier Requirements
Second Opinion Required 20% 22% 25% 8% 26% 25%
Pre-Notification for Non-Emergency Hospital Admittance 63% 88% 86% 67% 61% 67%
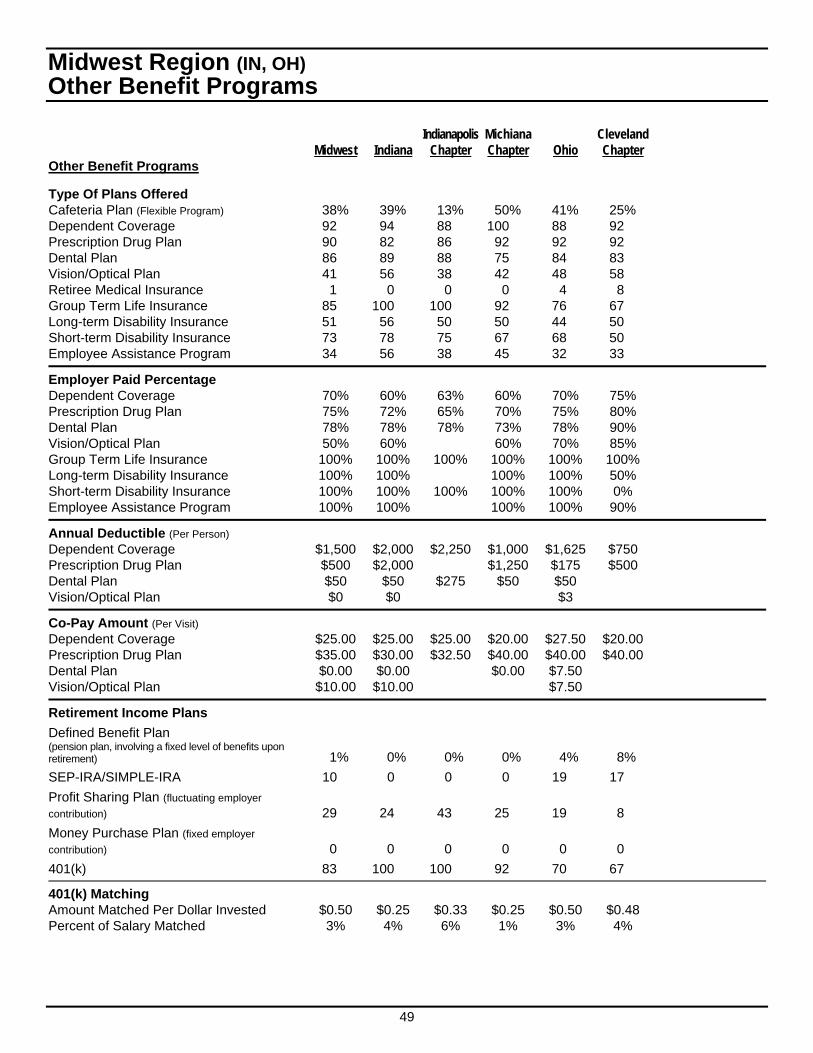
49
Midwest Region (IN, OH) Other Benefit Programs Indianapolis Michiana Cleveland Midwest Indiana Chapter Chapter Ohio Chapter Other Benefit Programs
Type Of Plans Offered Cafeteria Plan (Flexible Program) 38% 39% 13% 50% 41% 25% Dependent Coverage 92 94 88 100 88 92 Prescription Drug Plan 90 82 86 92 92 92 Dental Plan 86 89 88 75 84 83 Vision/Optical Plan 41 56 38 42 48 58 Retiree Medical Insurance 1 0 0 0 4 8 Group Term Life Insurance 85 100 100 92 76 67 Long-term Disability Insurance 51 56 50 50 44 50 Short-term Disability Insurance 73 78 75 67 68 50 Employee Assistance Program 34 56 38 45 32 33
Employer Paid Percentage Dependent Coverage 70% 60% 63% 60% 70% 75% Prescription Drug Plan 75% 72% 65% 70% 75% 80% Dental Plan 78% 78% 78% 73% 78% 90% Vision/Optical Plan 50% 60% 60% 70% 85% Group Term Life Insurance 100% 100% 100% 100% 100% 100% Long-term Disability Insurance 100% 100% 100% 100% 50% Short-term Disability Insurance 100% 100% 100% 100% 100% 0% Employee Assistance Program 100% 100% 100% 100% 90%
Annual Deductible (Per Person) Dependent Coverage $1,500 $2,000 $2,250 $1,000 $1,625 $750 Prescription Drug Plan $500 $2,000 $1,250 $175 $500 Dental Plan $50 $50 $275 $50 $50 Vision/Optical Plan $0 $0 $3
Co-Pay Amount (Per Visit) Dependent Coverage $25.00 $25.00 $25.00 $20.00 $27.50 $20.00 Prescription Drug Plan $35.00 $30.00 $32.50 $40.00 $40.00 $40.00 Dental Plan $0.00 $0.00 $0.00 $7.50 Vision/Optical Plan $10.00 $10.00 $7.50
Retirement Income Plans
Defined Benefit Plan (pension plan, involving a fixed level of benefits upon retirement) 1% 0% 0% 0% 4% 8%
SEP-IRA/SIMPLE-IRA 10 0 0 0 19 17
Profit Sharing Plan (fluctuating employer
contribution) 29 24 43 25 19 8
Money Purchase Plan (fixed employer
contribution) 0 0 0 0 0 0
401(k) 83 100 100 92 70 67
401(k) Matching Amount Matched Per Dollar Invested $0.50 $0.25 $0.33 $0.25 $0.50 $0.48 Percent of Salary Matched 3% 4% 6% 1% 3% 4%
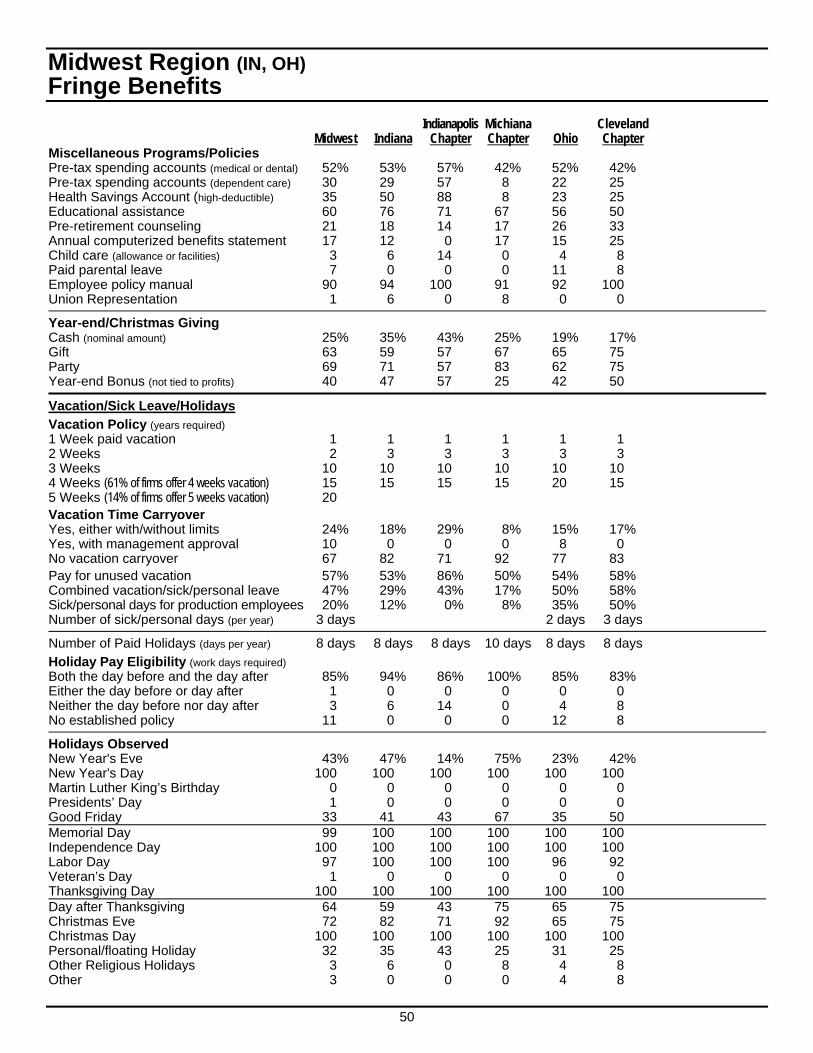
50
Midwest Region (IN, OH) Fringe Benefits Indianapolis Michiana Cleveland Midwest Indiana Chapter Chapter Ohio Chapter Miscellaneous Programs/Policies Pre-tax spending accounts (medical or dental) 52% 53% 57% 42% 52% 42% Pre-tax spending accounts (dependent care) 30 29 57 8 22 25 Health Savings Account (high-deductible) 35 50 88 8 23 25 Educational assistance 60 76 71 67 56 50 Pre-retirement counseling 21 18 14 17 26 33 Annual computerized benefits statement 17 12 0 17 15 25 Child care (allowance or facilities) 3 6 14 0 4 8 Paid parental leave 7 0 0 0 11 8 Employee policy manual 90 94 100 91 92 100 Union Representation 1 6 0 8 0 0
Year-end/Christmas Giving Cash (nominal amount) 25% 35% 43% 25% 19% 17% Gift 63 59 57 67 65 75 Party 69 71 57 83 62 75 Year-end Bonus (not tied to profits) 40 47 57 25 42 50
Vacation/Sick Leave/Holidays
Vacation Policy (years required) 1 Week paid vacation 1 1 1 1 1 1 2 Weeks 2 3 3 3 3 3 3 Weeks 10 10 10 10 10 10 4 Weeks (61% of firms offer 4 weeks vacation) 15 15 15 15 20 15 5 Weeks (14% of firms offer 5 weeks vacation) 20 Vacation Time Carryover Yes, either with/without limits 24% 18% 29% 8% 15% 17% Yes, with management approval 10 0 0 0 8 0 No vacation carryover 67 82 71 92 77 83 Pay for unused vacation 57% 53% 86% 50% 54% 58% Combined vacation/sick/personal leave 47% 29% 43% 17% 50% 58% Sick/personal days for production employees 20% 12% 0% 8% 35% 50% Number of sick/personal days (per year) 3 days 2 days 3 days
Number of Paid Holidays (days per year) 8 days 8 days 8 days 10 days 8 days 8 days
Holiday Pay Eligibility (work days required) Both the day before and the day after 85% 94% 86% 100% 85% 83% Either the day before or day after 1 0 0 0 0 0 Neither the day before nor day after 3 6 14 0 4 8 No established policy 11 0 0 0 12 8
Holidays Observed New Year's Eve 43% 47% 14% 75% 23% 42% New Year's Day 100 100 100 100 100 100 Martin Luther King’s Birthday 0 0 0 0 0 0 Presidents’ Day 1 0 0 0 0 0 Good Friday 33 41 43 67 35 50 Memorial Day 99 100 100 100 100 100 Independence Day 100 100 100 100 100 100 Labor Day 97 100 100 100 96 92 Veteran’s Day 1 0 0 0 0 0 Thanksgiving Day 100 100 100 100 100 100 Day after Thanksgiving 64 59 43 75 65 75 Christmas Eve 72 82 71 92 65 75 Christmas Day 100 100 100 100 100 100 Personal/floating Holiday 32 35 43 25 31 25 Other Religious Holidays 3 6 0 8 4 8 Other 3 0 0 0 4 8
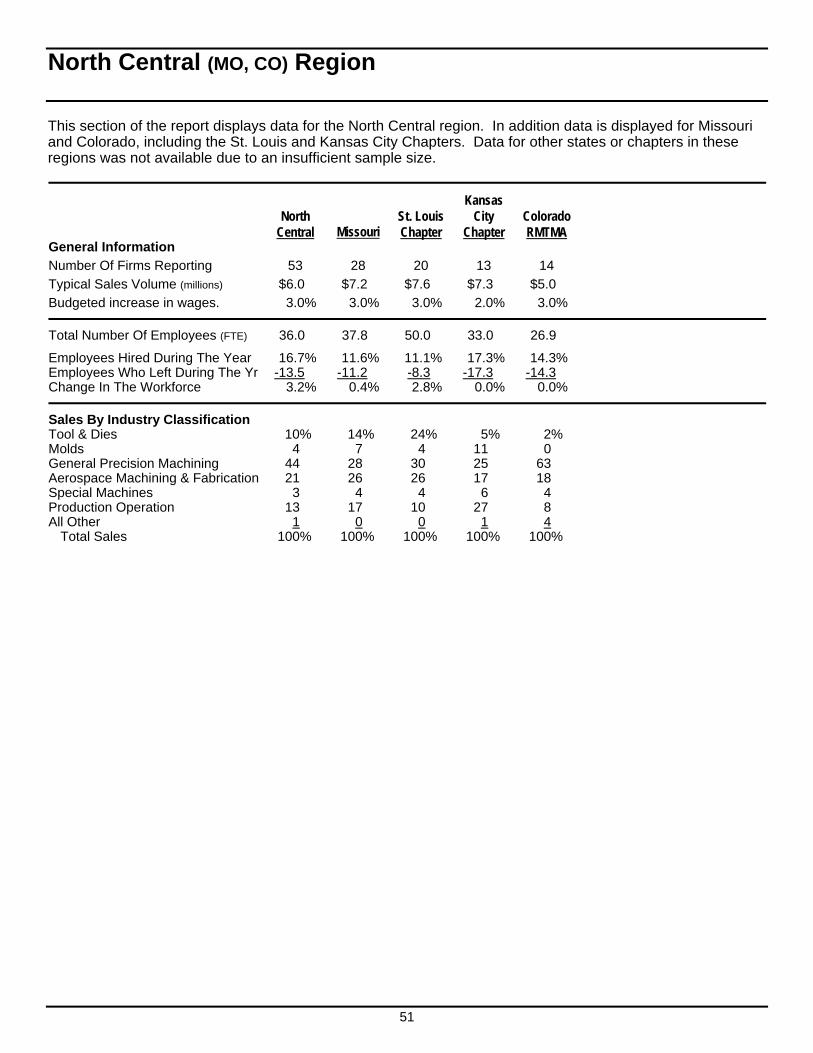
51
North Central (MO, CO) Region
This section of the report displays data for the North Central region. In addition data is displayed for Missouri and Colorado, including the St. Louis and Kansas City Chapters. Data for other states or chapters in these regions was not available due to an insufficient sample size.
Kansas North St. Louis City Colorado Central Missouri Chapter Chapter RMTMA General Information
Number Of Firms Reporting 53 28 20 13 14
Typical Sales Volume (millions) $6.0 $7.2 $7.6 $7.3 $5.0
Budgeted increase in wages. 3.0% 3.0% 3.0% 2.0% 3.0%
Total Number Of Employees (FTE) 36.0 37.8 50.0 33.0 26.9
Employees Hired During The Year 16.7% 11.6% 11.1% 17.3% 14.3% Employees Who Left During The Yr -13.5 -11.2 -8.3 -17.3 -14.3 Change In The Workforce 3.2% 0.4% 2.8% 0.0% 0.0%
Sales By Industry Classification Tool & Dies 10% 14% 24% 5% 2% Molds 4 7 4 11 0 General Precision Machining 44 28 30 25 63 Aerospace Machining & Fabrication 21 26 26 17 18 Special Machines 3 4 4 6 4 Production Operation 13 17 10 27 8 All Other 1 0 0 1 4
Total Sales 100% 100% 100% 100% 100%
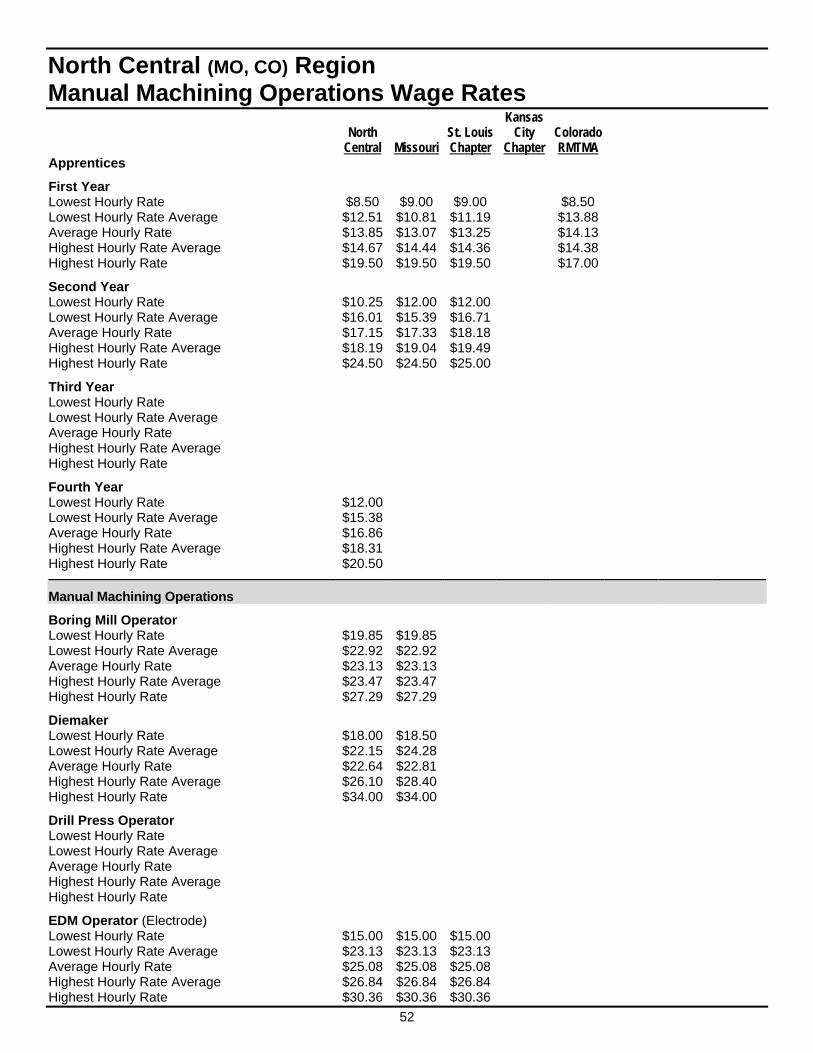
52
North Central (MO, CO) Region
Manual Machining Operations Wage Rates Kansas North St. Louis City Colorado Central Missouri Chapter Chapter RMTMA Apprentices
First Year Lowest Hourly Rate $8.50 $9.00 $9.00 $8.50 Lowest Hourly Rate Average $12.51 $10.81 $11.19 $13.88 Average Hourly Rate $13.85 $13.07 $13.25 $14.13 Highest Hourly Rate Average $14.67 $14.44 $14.36 $14.38 Highest Hourly Rate $19.50 $19.50 $19.50 $17.00
Second Year Lowest Hourly Rate $10.25 $12.00 $12.00 Lowest Hourly Rate Average $16.01 $15.39 $16.71 Average Hourly Rate $17.15 $17.33 $18.18 Highest Hourly Rate Average $18.19 $19.04 $19.49 Highest Hourly Rate $24.50 $24.50 $25.00
Third Year Lowest Hourly Rate Lowest Hourly Rate Average Average Hourly Rate Highest Hourly Rate Average Highest Hourly Rate
Fourth Year Lowest Hourly Rate $12.00 Lowest Hourly Rate Average $15.38 Average Hourly Rate $16.86 Highest Hourly Rate Average $18.31 Highest Hourly Rate $20.50
Manual Machining Operations
Boring Mill Operator Lowest Hourly Rate $19.85 $19.85 Lowest Hourly Rate Average $22.92 $22.92 Average Hourly Rate $23.13 $23.13 Highest Hourly Rate Average $23.47 $23.47 Highest Hourly Rate $27.29 $27.29
Diemaker Lowest Hourly Rate $18.00 $18.50 Lowest Hourly Rate Average $22.15 $24.28 Average Hourly Rate $22.64 $22.81 Highest Hourly Rate Average $26.10 $28.40 Highest Hourly Rate $34.00 $34.00
Drill Press Operator Lowest Hourly Rate Lowest Hourly Rate Average Average Hourly Rate Highest Hourly Rate Average Highest Hourly Rate
EDM Operator (Electrode) Lowest Hourly Rate $15.00 $15.00 $15.00 Lowest Hourly Rate Average $23.13 $23.13 $23.13 Average Hourly Rate $25.08 $25.08 $25.08 Highest Hourly Rate Average $26.84 $26.84 $26.84 Highest Hourly Rate $30.36 $30.36 $30.36
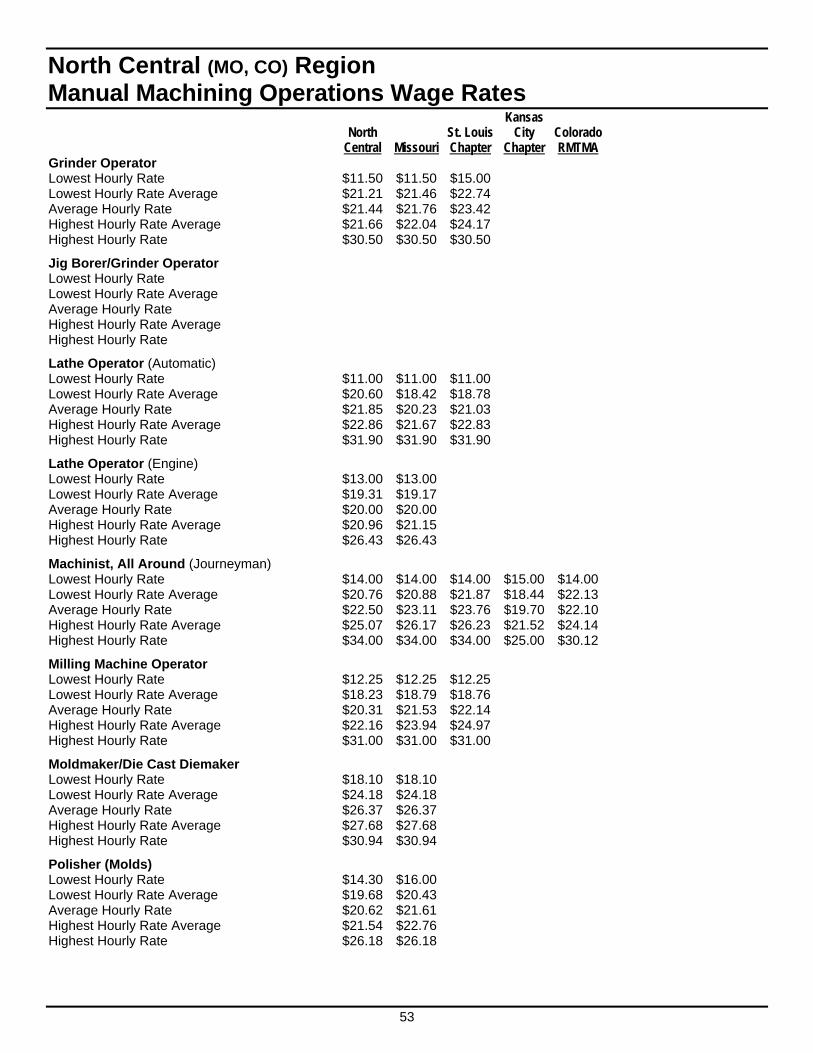
53
North Central (MO, CO) Region
Manual Machining Operations Wage Rates Kansas North St. Louis City Colorado Central Missouri Chapter Chapter RMTMA Grinder Operator Lowest Hourly Rate $11.50 $11.50 $15.00 Lowest Hourly Rate Average $21.21 $21.46 $22.74 Average Hourly Rate $21.44 $21.76 $23.42 Highest Hourly Rate Average $21.66 $22.04 $24.17 Highest Hourly Rate $30.50 $30.50 $30.50
Jig Borer/Grinder Operator Lowest Hourly Rate Lowest Hourly Rate Average Average Hourly Rate Highest Hourly Rate Average Highest Hourly Rate
Lathe Operator (Automatic) Lowest Hourly Rate $11.00 $11.00 $11.00 Lowest Hourly Rate Average $20.60 $18.42 $18.78 Average Hourly Rate $21.85 $20.23 $21.03 Highest Hourly Rate Average $22.86 $21.67 $22.83 Highest Hourly Rate $31.90 $31.90 $31.90
Lathe Operator (Engine) Lowest Hourly Rate $13.00 $13.00 Lowest Hourly Rate Average $19.31 $19.17 Average Hourly Rate $20.00 $20.00 Highest Hourly Rate Average $20.96 $21.15 Highest Hourly Rate $26.43 $26.43
Machinist, All Around (Journeyman) Lowest Hourly Rate $14.00 $14.00 $14.00 $15.00 $14.00 Lowest Hourly Rate Average $20.76 $20.88 $21.87 $18.44 $22.13 Average Hourly Rate $22.50 $23.11 $23.76 $19.70 $22.10 Highest Hourly Rate Average $25.07 $26.17 $26.23 $21.52 $24.14 Highest Hourly Rate $34.00 $34.00 $34.00 $25.00 $30.12
Milling Machine Operator Lowest Hourly Rate $12.25 $12.25 $12.25 Lowest Hourly Rate Average $18.23 $18.79 $18.76 Average Hourly Rate $20.31 $21.53 $22.14 Highest Hourly Rate Average $22.16 $23.94 $24.97 Highest Hourly Rate $31.00 $31.00 $31.00
Moldmaker/Die Cast Diemaker Lowest Hourly Rate $18.10 $18.10 Lowest Hourly Rate Average $24.18 $24.18 Average Hourly Rate $26.37 $26.37 Highest Hourly Rate Average $27.68 $27.68 Highest Hourly Rate $30.94 $30.94
Polisher (Molds) Lowest Hourly Rate $14.30 $16.00 Lowest Hourly Rate Average $19.68 $20.43 Average Hourly Rate $20.62 $21.61 Highest Hourly Rate Average $21.54 $22.76 Highest Hourly Rate $26.18 $26.18
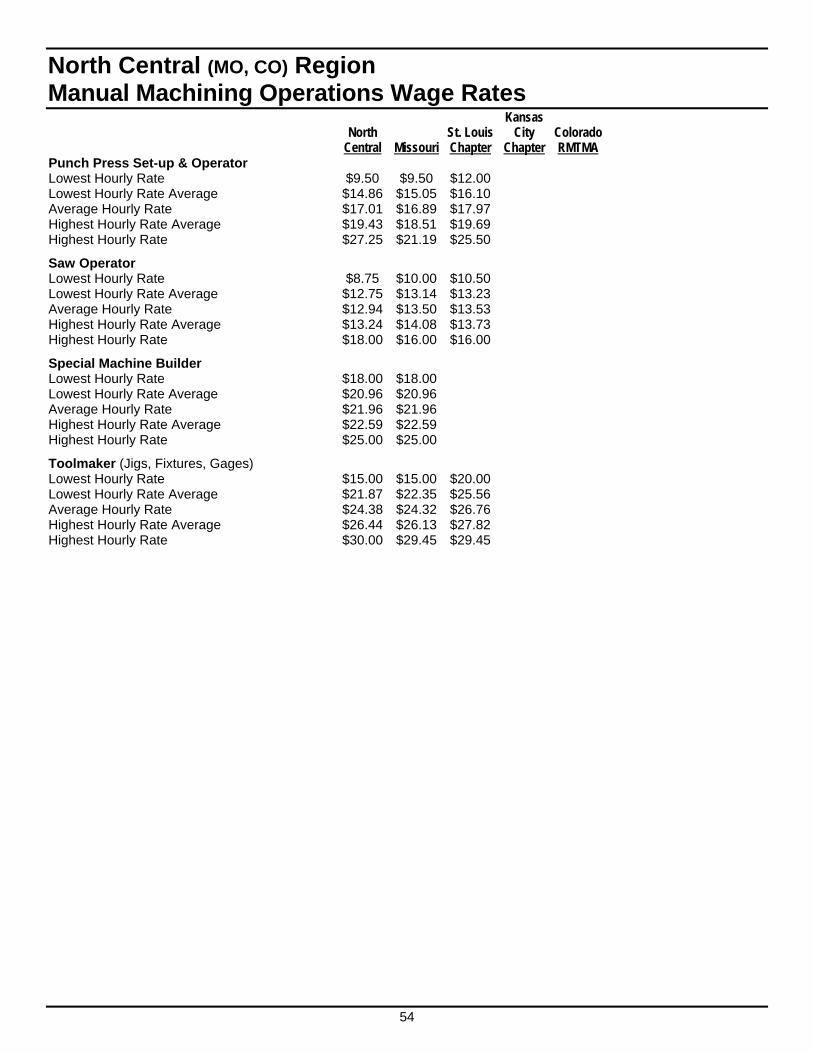
54
North Central (MO, CO) Region
Manual Machining Operations Wage Rates Kansas North St. Louis City Colorado Central Missouri Chapter Chapter RMTMA Punch Press Set-up & Operator Lowest Hourly Rate $9.50 $9.50 $12.00 Lowest Hourly Rate Average $14.86 $15.05 $16.10 Average Hourly Rate $17.01 $16.89 $17.97 Highest Hourly Rate Average $19.43 $18.51 $19.69 Highest Hourly Rate $27.25 $21.19 $25.50
Saw Operator Lowest Hourly Rate $8.75 $10.00 $10.50 Lowest Hourly Rate Average $12.75 $13.14 $13.23 Average Hourly Rate $12.94 $13.50 $13.53 Highest Hourly Rate Average $13.24 $14.08 $13.73 Highest Hourly Rate $18.00 $16.00 $16.00
Special Machine Builder Lowest Hourly Rate $18.00 $18.00 Lowest Hourly Rate Average $20.96 $20.96 Average Hourly Rate $21.96 $21.96 Highest Hourly Rate Average $22.59 $22.59 Highest Hourly Rate $25.00 $25.00
Toolmaker (Jigs, Fixtures, Gages) Lowest Hourly Rate $15.00 $15.00 $20.00 Lowest Hourly Rate Average $21.87 $22.35 $25.56 Average Hourly Rate $24.38 $24.32 $26.76 Highest Hourly Rate Average $26.44 $26.13 $27.82 Highest Hourly Rate $30.00 $29.45 $29.45
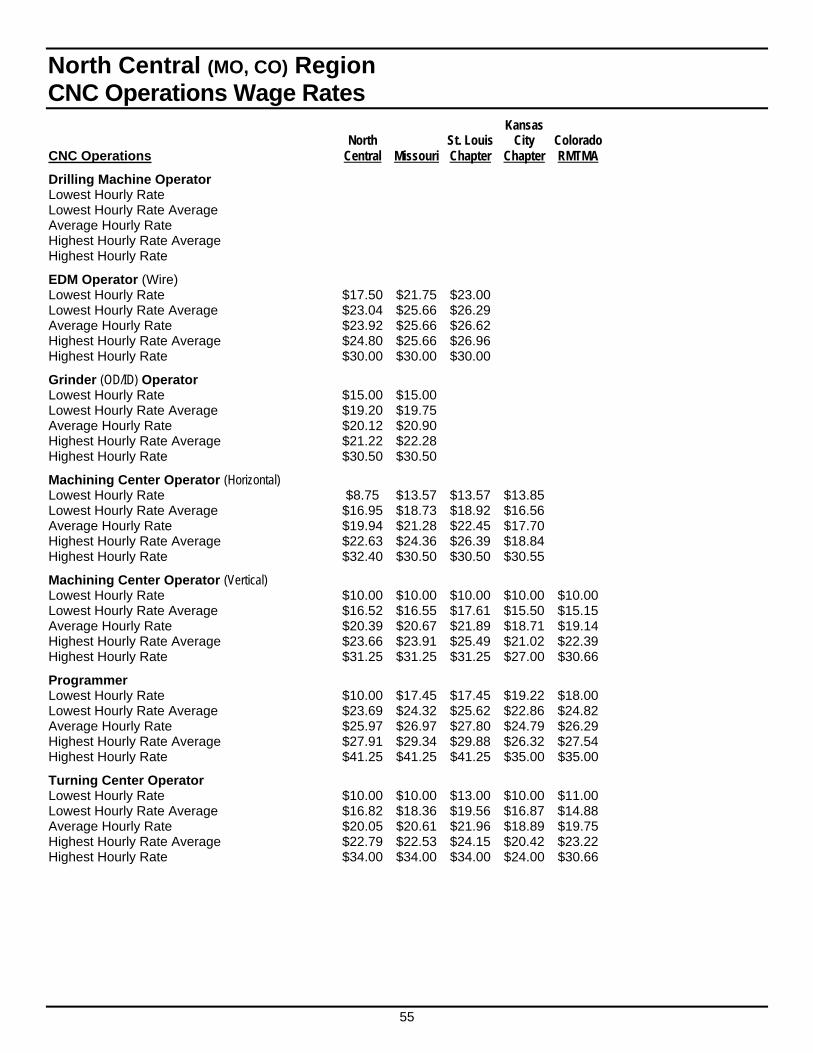
55
North Central (MO, CO) Region
CNC Operations Wage Rates Kansas North St. Louis City Colorado CNC Operations Central Missouri Chapter Chapter RMTMA
Drilling Machine Operator Lowest Hourly Rate Lowest Hourly Rate Average Average Hourly Rate Highest Hourly Rate Average Highest Hourly Rate
EDM Operator (Wire) Lowest Hourly Rate $17.50 $21.75 $23.00 Lowest Hourly Rate Average $23.04 $25.66 $26.29 Average Hourly Rate $23.92 $25.66 $26.62 Highest Hourly Rate Average $24.80 $25.66 $26.96 Highest Hourly Rate $30.00 $30.00 $30.00
Grinder (OD/ID) Operator Lowest Hourly Rate $15.00 $15.00 Lowest Hourly Rate Average $19.20 $19.75 Average Hourly Rate $20.12 $20.90 Highest Hourly Rate Average $21.22 $22.28 Highest Hourly Rate $30.50 $30.50
Machining Center Operator (Horizontal) Lowest Hourly Rate $8.75 $13.57 $13.57 $13.85 Lowest Hourly Rate Average $16.95 $18.73 $18.92 $16.56 Average Hourly Rate $19.94 $21.28 $22.45 $17.70 Highest Hourly Rate Average $22.63 $24.36 $26.39 $18.84 Highest Hourly Rate $32.40 $30.50 $30.50 $30.55
Machining Center Operator (Vertical) Lowest Hourly Rate $10.00 $10.00 $10.00 $10.00 $10.00 Lowest Hourly Rate Average $16.52 $16.55 $17.61 $15.50 $15.15 Average Hourly Rate $20.39 $20.67 $21.89 $18.71 $19.14 Highest Hourly Rate Average $23.66 $23.91 $25.49 $21.02 $22.39 Highest Hourly Rate $31.25 $31.25 $31.25 $27.00 $30.66
Programmer Lowest Hourly Rate $10.00 $17.45 $17.45 $19.22 $18.00 Lowest Hourly Rate Average $23.69 $24.32 $25.62 $22.86 $24.82 Average Hourly Rate $25.97 $26.97 $27.80 $24.79 $26.29 Highest Hourly Rate Average $27.91 $29.34 $29.88 $26.32 $27.54 Highest Hourly Rate $41.25 $41.25 $41.25 $35.00 $35.00
Turning Center Operator Lowest Hourly Rate $10.00 $10.00 $13.00 $10.00 $11.00 Lowest Hourly Rate Average $16.82 $18.36 $19.56 $16.87 $14.88 Average Hourly Rate $20.05 $20.61 $21.96 $18.89 $19.75 Highest Hourly Rate Average $22.79 $22.53 $24.15 $20.42 $23.22 Highest Hourly Rate $34.00 $34.00 $34.00 $24.00 $30.66

56
North Central (MO, CO) Region
Manufacturing Support Wage Rates Kansas North St. Louis City Colorado Manufacturing Support Functions Central Missouri Chapter Chapter RMTMA
Assembler (Subassemblies, Controls, etc.) Lowest Hourly Rate $9.00 $11.00 $10.00 $9.00 $10.00 Lowest Hourly Rate Average $13.77 $14.68 $15.94 $13.42 $14.76 Average Hourly Rate $15.52 $16.55 $18.12 $15.17 $16.51 Highest Hourly Rate Average $17.36 $18.51 $20.41 $16.94 $18.76 Highest Hourly Rate $28.00 $27.75 $27.75 $24.50 $28.00
Deburring Specialist Lowest Hourly Rate $9.00 $9.00 $10.00 $9.00 $10.00 Lowest Hourly Rate Average $12.74 $12.48 $13.05 $12.22 $13.15 Average Hourly Rate $14.01 $13.98 $14.08 $14.01 $14.19 Highest Hourly Rate Average $15.48 $15.31 $15.26 $15.29 $16.20 Highest Hourly Rate $24.24 $22.25 $21.00 $22.25 $24.24
Designer (Control Systems) Lowest Hourly Rate $9.50 $12.50 $25.50 $12.50 Lowest Hourly Rate Average $21.73 $23.30 $28.55 $21.65 Average Hourly Rate $22.72 $24.69 $31.56 $22.66 Highest Hourly Rate Average $23.67 $26.02 $34.06 $23.67 Highest Hourly Rate $31.49 $31.49 $39.25 $26.08
Draftsman (CAD) Lowest Hourly Rate $10.00 $10.00 $14.00 $10.00 Lowest Hourly Rate Average $20.20 $20.86 $22.40 $16.36 Average Hourly Rate $22.29 $22.73 $24.35 $17.11 Highest Hourly Rate Average $23.77 $24.16 $25.77 $17.86 Highest Hourly Rate $33.75 $33.75 $33.75 $24.00
Electrical/Electronics Technician Lowest Hourly Rate Lowest Hourly Rate Average Average Hourly Rate Highest Hourly Rate Average Highest Hourly Rate
Inspector Lowest Hourly Rate $10.56 $10.56 $10.56 $17.50 $12.50 Lowest Hourly Rate Average $18.14 $19.77 $17.78 $22.50 $17.20 Average Hourly Rate $19.62 $21.34 $20.51 $21.90 $18.12 Highest Hourly Rate Average $21.16 $23.24 $23.73 $21.29 $18.85 Highest Hourly Rate $39.60 $39.60 $39.60 $32.25 $24.50
Inspector (CMM Operator) Lowest Hourly Rate $14.00 $15.00 $18.87 $15.00 $14.70 Lowest Hourly Rate Average $19.98 $20.50 $23.27 $17.93 $21.25 Average Hourly Rate $21.75 $22.24 $24.87 $19.21 $22.93 Highest Hourly Rate Average $23.25 $24.01 $26.37 $20.75 $23.62 Highest Hourly Rate $30.55 $30.55 $30.55 $22.50 $29.08
Machine Repair & Maintenance Lowest Hourly Rate $10.00 $10.00 $11.00 $12.83 $12.00 Lowest Hourly Rate Average $18.46 $20.20 $21.49 $16.97 $18.33 Average Hourly Rate $20.18 $22.01 $23.24 $18.48 $19.11 Highest Hourly Rate Average $21.69 $23.56 $24.88 $19.58 $19.97 Highest Hourly Rate $37.00 $37.00 $37.00 $25.50 $29.00
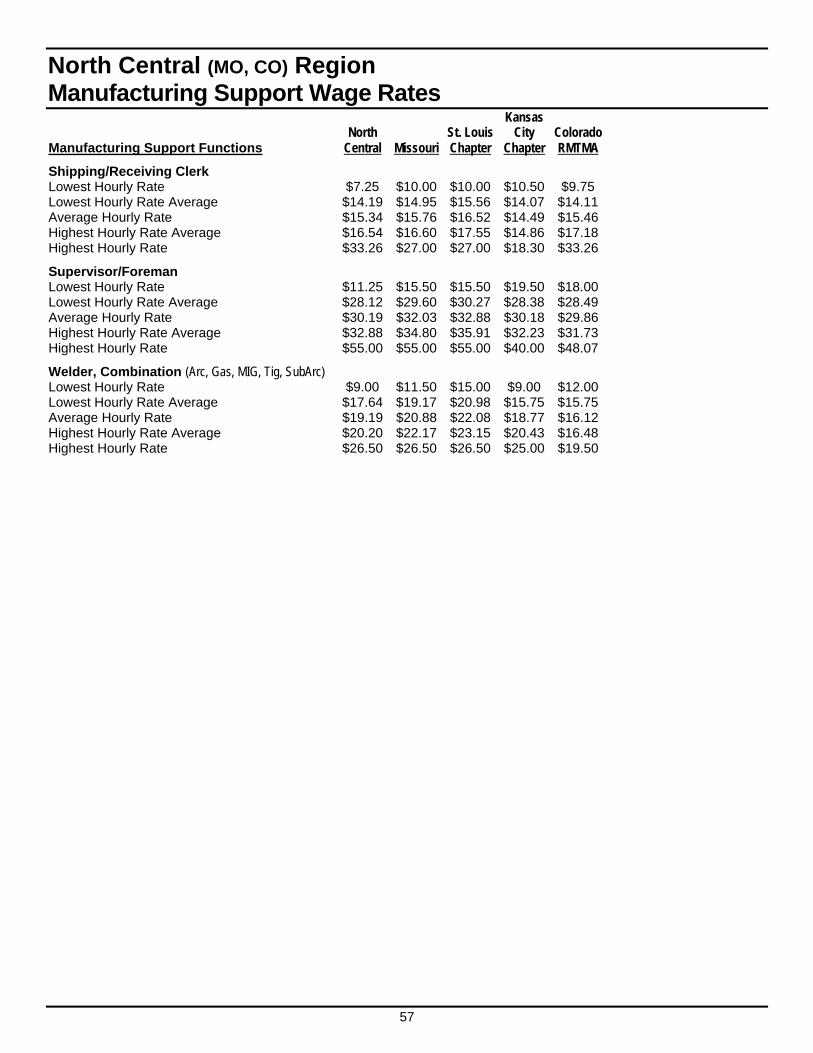
57
North Central (MO, CO) Region
Manufacturing Support Wage Rates Kansas North St. Louis City Colorado Manufacturing Support Functions Central Missouri Chapter Chapter RMTMA
Shipping/Receiving Clerk Lowest Hourly Rate $7.25 $10.00 $10.00 $10.50 $9.75 Lowest Hourly Rate Average $14.19 $14.95 $15.56 $14.07 $14.11 Average Hourly Rate $15.34 $15.76 $16.52 $14.49 $15.46 Highest Hourly Rate Average $16.54 $16.60 $17.55 $14.86 $17.18 Highest Hourly Rate $33.26 $27.00 $27.00 $18.30 $33.26
Supervisor/Foreman Lowest Hourly Rate $11.25 $15.50 $15.50 $19.50 $18.00 Lowest Hourly Rate Average $28.12 $29.60 $30.27 $28.38 $28.49 Average Hourly Rate $30.19 $32.03 $32.88 $30.18 $29.86 Highest Hourly Rate Average $32.88 $34.80 $35.91 $32.23 $31.73 Highest Hourly Rate $55.00 $55.00 $55.00 $40.00 $48.07
Welder, Combination (Arc, Gas, MIG, Tig, SubArc) Lowest Hourly Rate $9.00 $11.50 $15.00 $9.00 $12.00 Lowest Hourly Rate Average $17.64 $19.17 $20.98 $15.75 $15.75 Average Hourly Rate $19.19 $20.88 $22.08 $18.77 $16.12 Highest Hourly Rate Average $20.20 $22.17 $23.15 $20.43 $16.48 Highest Hourly Rate $26.50 $26.50 $26.50 $25.00 $19.50
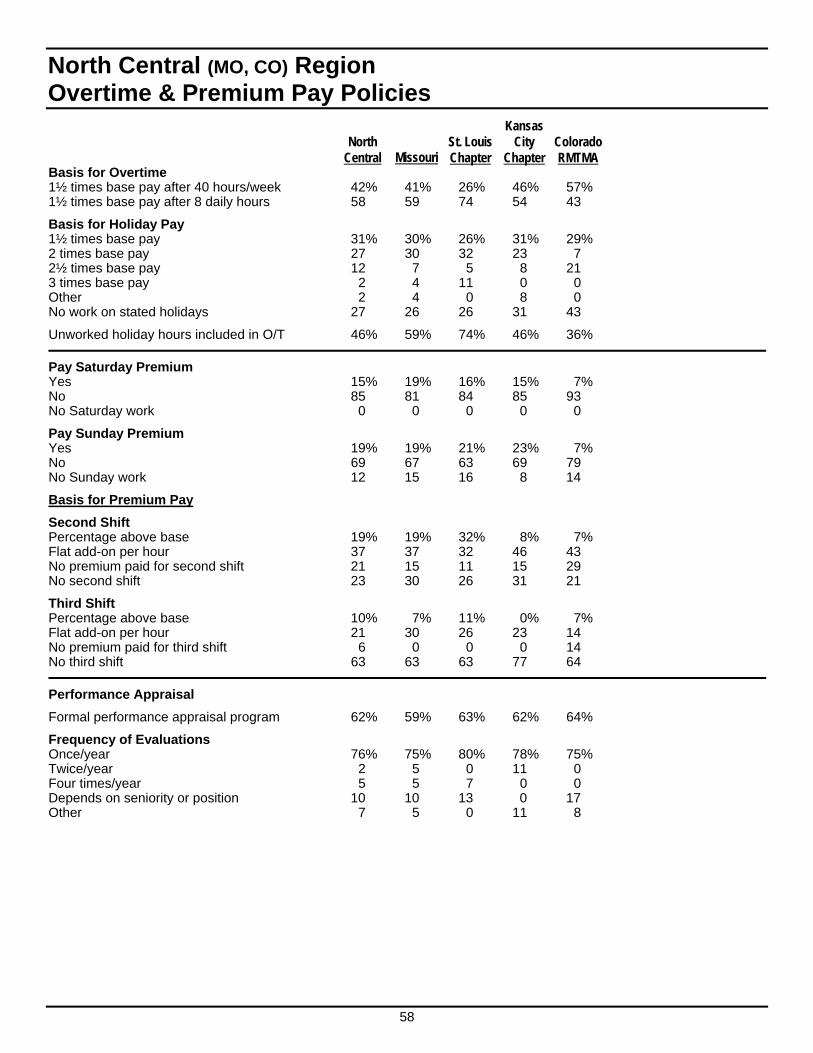
58
North Central (MO, CO) Region
Overtime & Premium Pay Policies Kansas North St. Louis City Colorado Central Missouri Chapter Chapter RMTMA Basis for Overtime 1½ times base pay after 40 hours/week 42% 41% 26% 46% 57% 1½ times base pay after 8 daily hours 58 59 74 54 43
Basis for Holiday Pay 1½ times base pay 31% 30% 26% 31% 29% 2 times base pay 27 30 32 23 7 2½ times base pay 12 7 5 8 21 3 times base pay 2 4 11 0 0 Other 2 4 0 8 0 No work on stated holidays 27 26 26 31 43
Unworked holiday hours included in O/T 46% 59% 74% 46% 36%
Pay Saturday Premium Yes 15% 19% 16% 15% 7% No 85 81 84 85 93 No Saturday work 0 0 0 0 0
Pay Sunday Premium Yes 19% 19% 21% 23% 7% No 69 67 63 69 79 No Sunday work 12 15 16 8 14
Basis for Premium Pay
Second Shift Percentage above base 19% 19% 32% 8% 7% Flat add-on per hour 37 37 32 46 43 No premium paid for second shift 21 15 11 15 29 No second shift 23 30 26 31 21
Third Shift Percentage above base 10% 7% 11% 0% 7% Flat add-on per hour 21 30 26 23 14 No premium paid for third shift 6 0 0 0 14 No third shift 63 63 63 77 64
Performance Appraisal
Formal performance appraisal program 62% 59% 63% 62% 64%
Frequency of Evaluations Once/year 76% 75% 80% 78% 75% Twice/year 2 5 0 11 0 Four times/year 5 5 7 0 0 Depends on seniority or position 10 10 13 0 17 Other 7 5 0 11 8
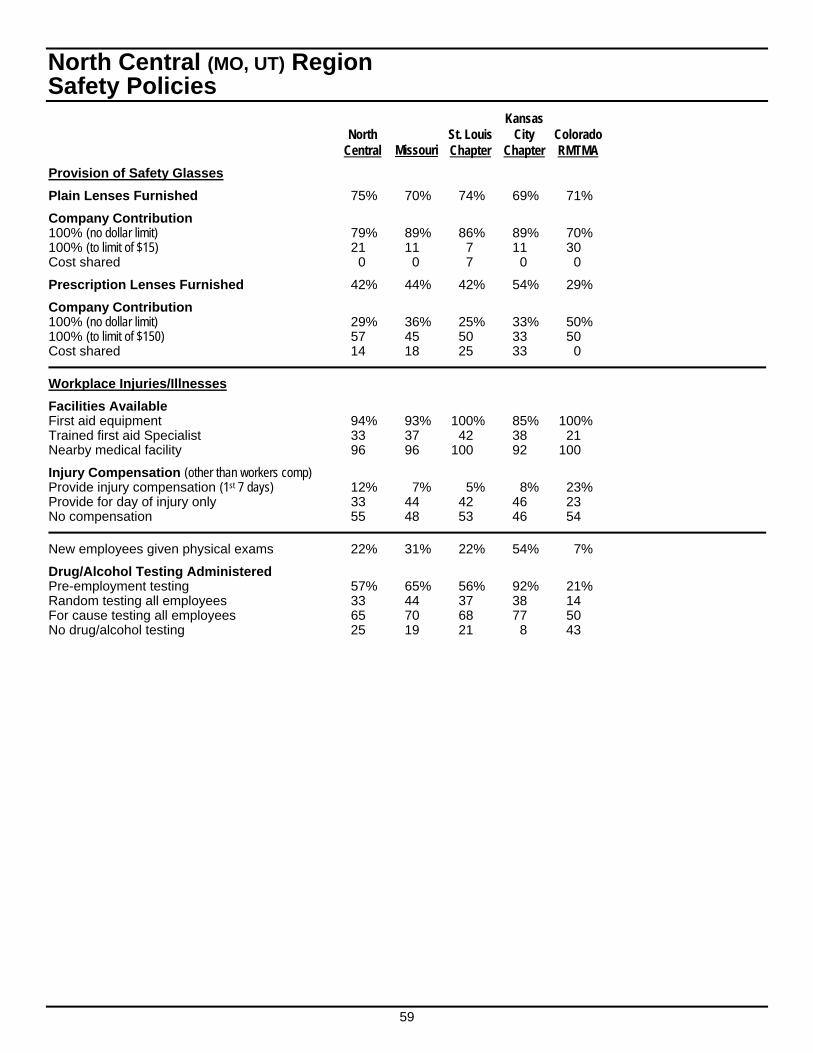
59
North Central (MO, UT) Region Safety Policies Kansas North St. Louis City Colorado Central Missouri Chapter Chapter RMTMA
Provision of Safety Glasses
Plain Lenses Furnished 75% 70% 74% 69% 71%
Company Contribution 100% (no dollar limit) 79% 89% 86% 89% 70% 100% (to limit of $15) 21 11 7 11 30 Cost shared 0 0 7 0 0
Prescription Lenses Furnished 42% 44% 42% 54% 29%
Company Contribution 100% (no dollar limit) 29% 36% 25% 33% 50% 100% (to limit of $150) 57 45 50 33 50 Cost shared 14 18 25 33 0
Workplace Injuries/Illnesses
Facilities Available First aid equipment 94% 93% 100% 85% 100% Trained first aid Specialist 33 37 42 38 21 Nearby medical facility 96 96 100 92 100
Injury Compensation (other than workers comp) Provide injury compensation (1st 7 days) 12% 7% 5% 8% 23% Provide for day of injury only 33 44 42 46 23 No compensation 55 48 53 46 54
New employees given physical exams 22% 31% 22% 54% 7%
Drug/Alcohol Testing Administered Pre-employment testing 57% 65% 56% 92% 21% Random testing all employees 33 44 37 38 14 For cause testing all employees 65 70 68 77 50 No drug/alcohol testing 25 19 21 8 43
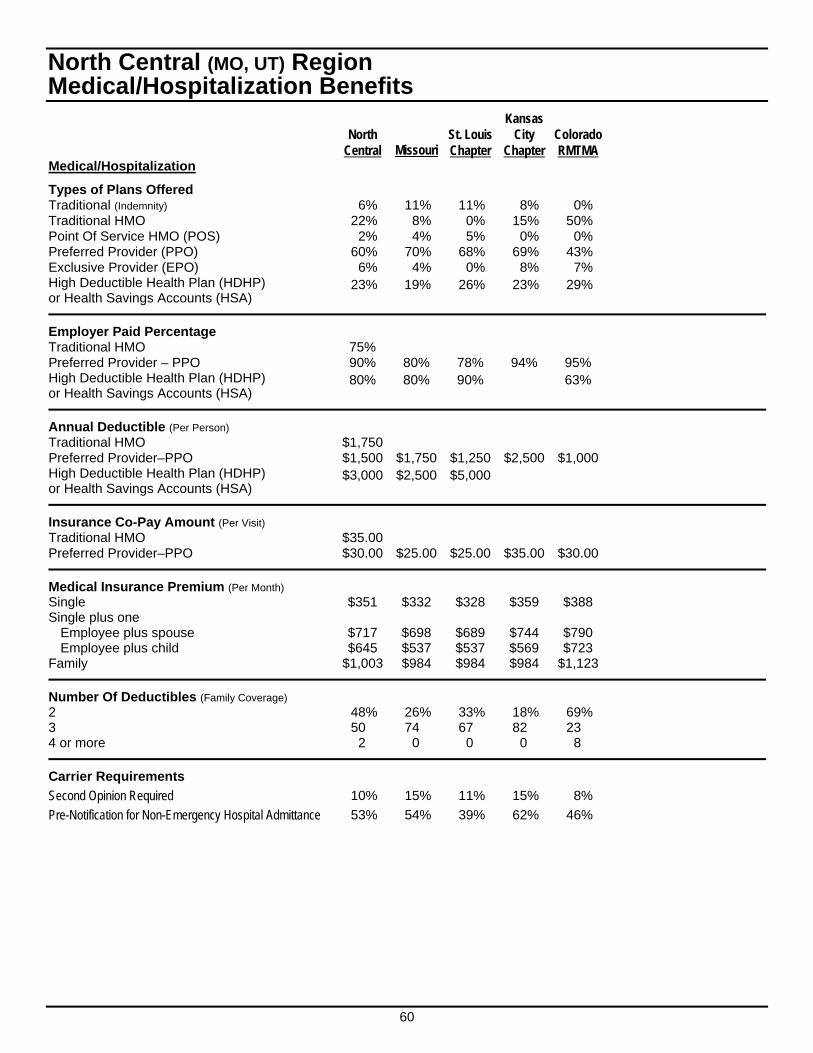
60
North Central (MO, UT) Region Medical/Hospitalization Benefits Kansas North St. Louis City Colorado Central Missouri Chapter Chapter RMTMA Medical/Hospitalization
Types of Plans Offered Traditional (Indemnity) 6% 11% 11% 8% 0% Traditional HMO 22% 8% 0% 15% 50% Point Of Service HMO (POS) 2% 4% 5% 0% 0% Preferred Provider (PPO) 60% 70% 68% 69% 43% Exclusive Provider (EPO) 6% 4% 0% 8% 7% High Deductible Health Plan (HDHP) or Health Savings Accounts (HSA)
23% 19% 26% 23% 29%
Employer Paid Percentage Traditional HMO 75% Preferred Provider – PPO 90% 80% 78% 94% 95% High Deductible Health Plan (HDHP) or Health Savings Accounts (HSA)
80% 80% 90% 63%
Annual Deductible (Per Person) Traditional HMO $1,750 Preferred Provider–PPO $1,500 $1,750 $1,250 $2,500 $1,000 High Deductible Health Plan (HDHP) or Health Savings Accounts (HSA)
$3,000 $2,500 $5,000
Insurance Co-Pay Amount (Per Visit) Traditional HMO $35.00 Preferred Provider–PPO $30.00 $25.00 $25.00 $35.00 $30.00
Medical Insurance Premium (Per Month) Single $351 $332 $328 $359 $388 Single plus one
Employee plus spouse $717 $698 $689 $744 $790 Employee plus child $645 $537 $537 $569 $723
Family $1,003 $984 $984 $984 $1,123
Number Of Deductibles (Family Coverage) 2 48% 26% 33% 18% 69% 3 50 74 67 82 23 4 or more 2 0 0 0 8
Carrier Requirements
Second Opinion Required 10% 15% 11% 15% 8%
Pre-Notification for Non-Emergency Hospital Admittance 53% 54% 39% 62% 46%
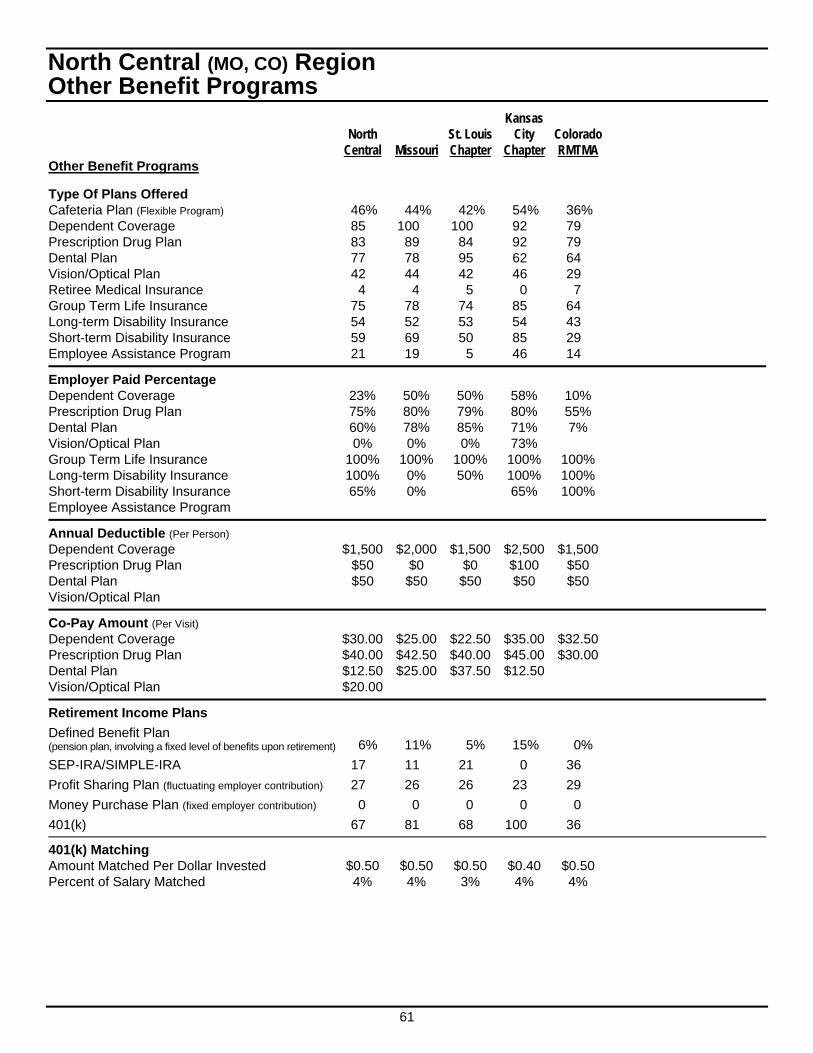
61
North Central (MO, CO) Region Other Benefit Programs Kansas North St. Louis City Colorado Central Missouri Chapter Chapter RMTMA Other Benefit Programs
Type Of Plans Offered Cafeteria Plan (Flexible Program) 46% 44% 42% 54% 36% Dependent Coverage 85 100 100 92 79 Prescription Drug Plan 83 89 84 92 79 Dental Plan 77 78 95 62 64 Vision/Optical Plan 42 44 42 46 29 Retiree Medical Insurance 4 4 5 0 7 Group Term Life Insurance 75 78 74 85 64 Long-term Disability Insurance 54 52 53 54 43 Short-term Disability Insurance 59 69 50 85 29 Employee Assistance Program 21 19 5 46 14
Employer Paid Percentage Dependent Coverage 23% 50% 50% 58% 10% Prescription Drug Plan 75% 80% 79% 80% 55% Dental Plan 60% 78% 85% 71% 7% Vision/Optical Plan 0% 0% 0% 73% Group Term Life Insurance 100% 100% 100% 100% 100% Long-term Disability Insurance 100% 0% 50% 100% 100% Short-term Disability Insurance 65% 0% 65% 100% Employee Assistance Program
Annual Deductible (Per Person) Dependent Coverage $1,500 $2,000 $1,500 $2,500 $1,500 Prescription Drug Plan $50 $0 $0 $100 $50 Dental Plan $50 $50 $50 $50 $50 Vision/Optical Plan
Co-Pay Amount (Per Visit) Dependent Coverage $30.00 $25.00 $22.50 $35.00 $32.50 Prescription Drug Plan $40.00 $42.50 $40.00 $45.00 $30.00 Dental Plan $12.50 $25.00 $37.50 $12.50 Vision/Optical Plan $20.00
Retirement Income Plans
Defined Benefit Plan (pension plan, involving a fixed level of benefits upon retirement) 6% 11% 5% 15% 0%
SEP-IRA/SIMPLE-IRA 17 11 21 0 36
Profit Sharing Plan (fluctuating employer contribution) 27 26 26 23 29
Money Purchase Plan (fixed employer contribution) 0 0 0 0 0
401(k) 67 81 68 100 36
401(k) Matching Amount Matched Per Dollar Invested $0.50 $0.50 $0.50 $0.40 $0.50 Percent of Salary Matched 4% 4% 3% 4% 4%
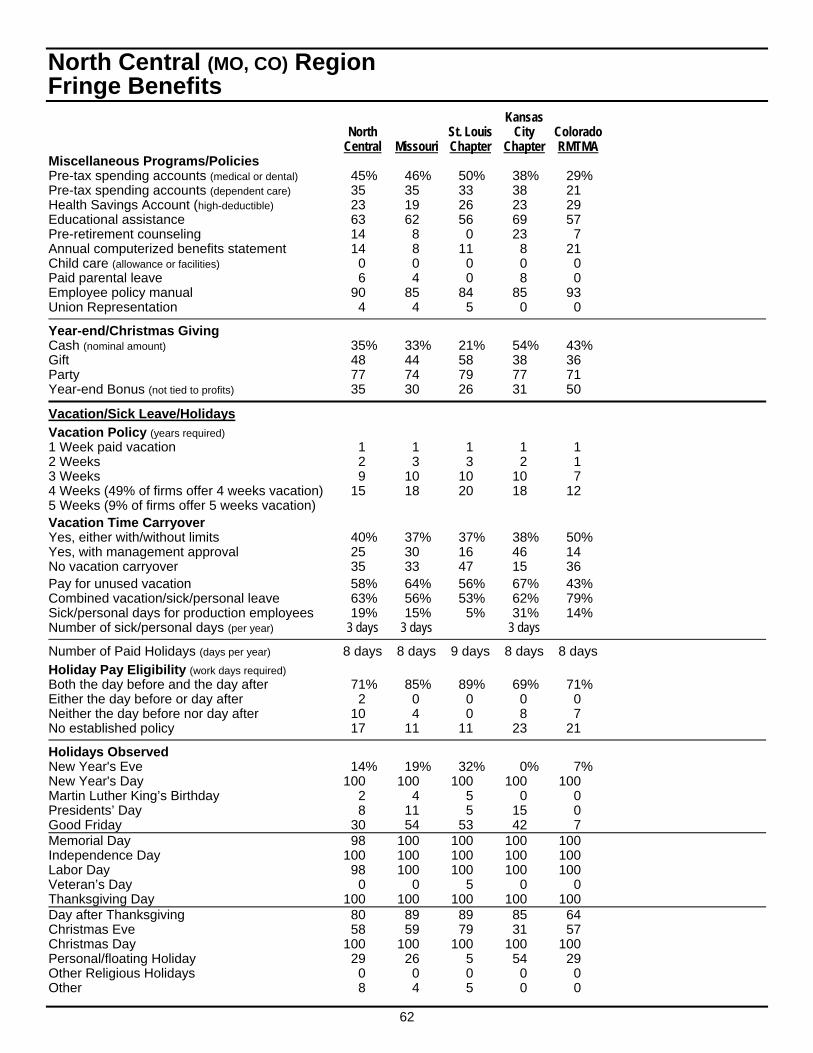
62
North Central (MO, CO) Region Fringe Benefits Kansas North St. Louis City Colorado Central Missouri Chapter Chapter RMTMA Miscellaneous Programs/Policies Pre-tax spending accounts (medical or dental) 45% 46% 50% 38% 29% Pre-tax spending accounts (dependent care) 35 35 33 38 21 Health Savings Account (high-deductible) 23 19 26 23 29 Educational assistance 63 62 56 69 57 Pre-retirement counseling 14 8 0 23 7 Annual computerized benefits statement 14 8 11 8 21 Child care (allowance or facilities) 0 0 0 0 0 Paid parental leave 6 4 0 8 0 Employee policy manual 90 85 84 85 93 Union Representation 4 4 5 0 0
Year-end/Christmas Giving Cash (nominal amount) 35% 33% 21% 54% 43% Gift 48 44 58 38 36 Party 77 74 79 77 71 Year-end Bonus (not tied to profits) 35 30 26 31 50
Vacation/Sick Leave/Holidays
Vacation Policy (years required) 1 Week paid vacation 1 1 1 1 1 2 Weeks 2 3 3 2 1 3 Weeks 9 10 10 10 7 4 Weeks (49% of firms offer 4 weeks vacation) 15 18 20 18 12 5 Weeks (9% of firms offer 5 weeks vacation) Vacation Time Carryover Yes, either with/without limits 40% 37% 37% 38% 50% Yes, with management approval 25 30 16 46 14 No vacation carryover 35 33 47 15 36 Pay for unused vacation 58% 64% 56% 67% 43% Combined vacation/sick/personal leave 63% 56% 53% 62% 79% Sick/personal days for production employees 19% 15% 5% 31% 14% Number of sick/personal days (per year) 3 days 3 days 3 days
Number of Paid Holidays (days per year) 8 days 8 days 9 days 8 days 8 days
Holiday Pay Eligibility (work days required) Both the day before and the day after 71% 85% 89% 69% 71% Either the day before or day after 2 0 0 0 0 Neither the day before nor day after 10 4 0 8 7 No established policy 17 11 11 23 21
Holidays Observed New Year's Eve 14% 19% 32% 0% 7% New Year's Day 100 100 100 100 100 Martin Luther King’s Birthday 2 4 5 0 0 Presidents’ Day 8 11 5 15 0 Good Friday 30 54 53 42 7 Memorial Day 98 100 100 100 100 Independence Day 100 100 100 100 100 Labor Day 98 100 100 100 100 Veteran’s Day 0 0 5 0 0 Thanksgiving Day 100 100 100 100 100 Day after Thanksgiving 80 89 89 85 64 Christmas Eve 58 59 79 31 57 Christmas Day 100 100 100 100 100 Personal/floating Holiday 29 26 5 54 29 Other Religious Holidays 0 0 0 0 0 Other 8 4 5 0 0
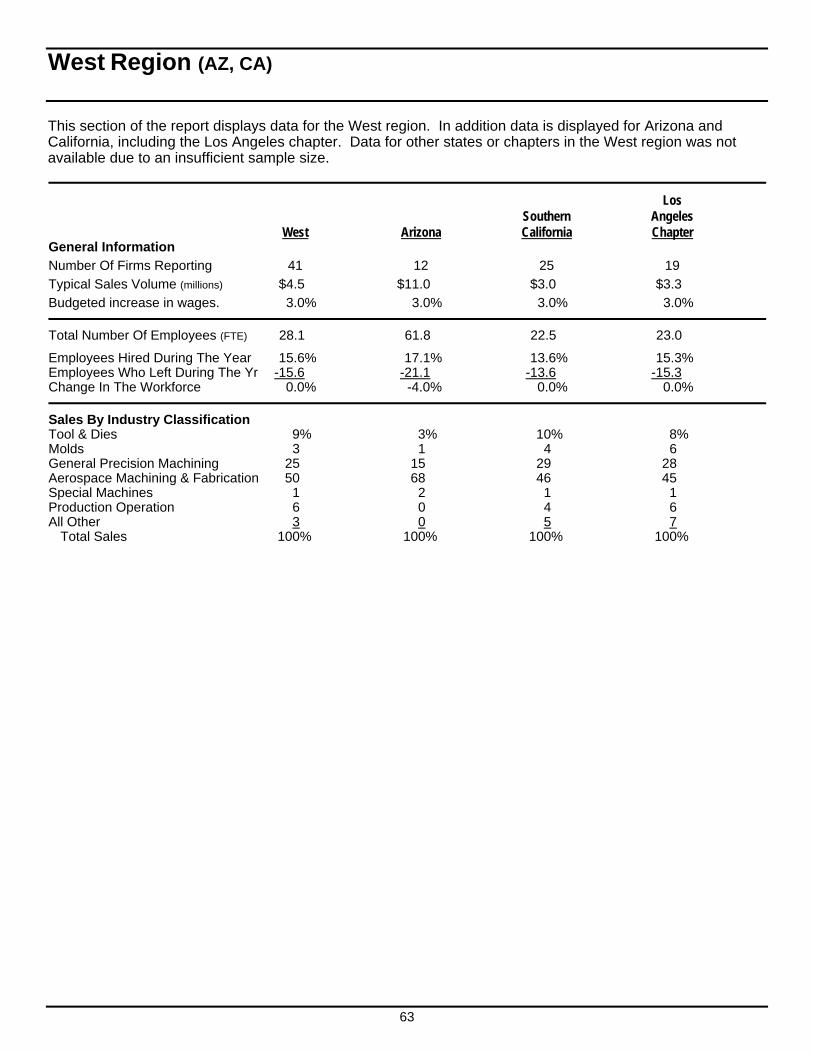
63
West Region (AZ, CA)
This section of the report displays data for the West region. In addition data is displayed for Arizona and California, including the Los Angeles chapter. Data for other states or chapters in the West region was not available due to an insufficient sample size.
Los Southern Angeles West Arizona California Chapter General Information
Number Of Firms Reporting 41 12 25 19
Typical Sales Volume (millions) $4.5 $11.0 $3.0 $3.3
Budgeted increase in wages. 3.0% 3.0% 3.0% 3.0%
Total Number Of Employees (FTE) 28.1 61.8 22.5 23.0
Employees Hired During The Year 15.6% 17.1% 13.6% 15.3% Employees Who Left During The Yr -15.6 -21.1 -13.6 -15.3 Change In The Workforce 0.0% -4.0% 0.0% 0.0%
Sales By Industry Classification Tool & Dies 9% 3% 10% 8% Molds 3 1 4 6 General Precision Machining 25 15 29 28 Aerospace Machining & Fabrication 50 68 46 45 Special Machines 1 2 1 1 Production Operation 6 0 4 6 All Other 3 0 5 7
Total Sales 100% 100% 100% 100%
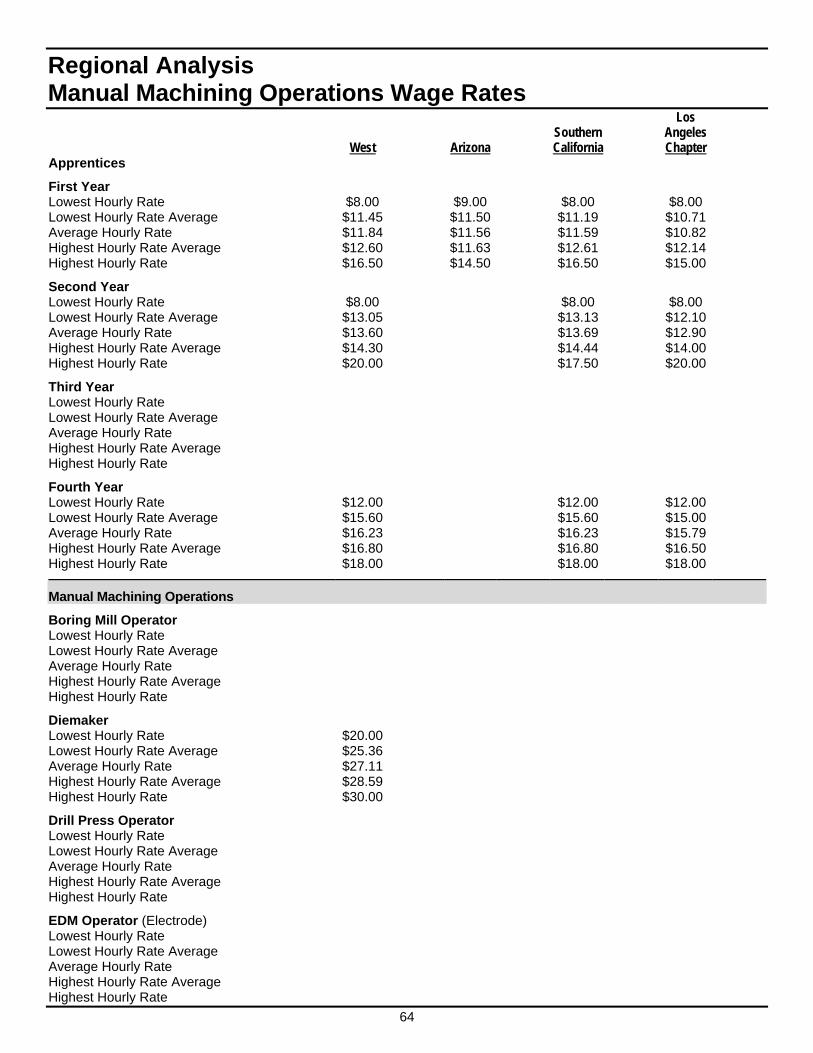
64
Regional Analysis Manual Machining Operations Wage Rates Los Southern Angeles West Arizona California Chapter Apprentices
First Year Lowest Hourly Rate $8.00 $9.00 $8.00 $8.00 Lowest Hourly Rate Average $11.45 $11.50 $11.19 $10.71 Average Hourly Rate $11.84 $11.56 $11.59 $10.82 Highest Hourly Rate Average $12.60 $11.63 $12.61 $12.14 Highest Hourly Rate $16.50 $14.50 $16.50 $15.00
Second Year Lowest Hourly Rate $8.00 $8.00 $8.00 Lowest Hourly Rate Average $13.05 $13.13 $12.10 Average Hourly Rate $13.60 $13.69 $12.90 Highest Hourly Rate Average $14.30 $14.44 $14.00 Highest Hourly Rate $20.00 $17.50 $20.00
Third Year Lowest Hourly Rate Lowest Hourly Rate Average Average Hourly Rate Highest Hourly Rate Average Highest Hourly Rate
Fourth Year Lowest Hourly Rate $12.00 $12.00 $12.00 Lowest Hourly Rate Average $15.60 $15.60 $15.00 Average Hourly Rate $16.23 $16.23 $15.79 Highest Hourly Rate Average $16.80 $16.80 $16.50 Highest Hourly Rate $18.00 $18.00 $18.00
Manual Machining Operations
Boring Mill Operator Lowest Hourly Rate Lowest Hourly Rate Average Average Hourly Rate Highest Hourly Rate Average Highest Hourly Rate
Diemaker Lowest Hourly Rate $20.00 Lowest Hourly Rate Average $25.36 Average Hourly Rate $27.11 Highest Hourly Rate Average $28.59 Highest Hourly Rate $30.00
Drill Press Operator Lowest Hourly Rate Lowest Hourly Rate Average Average Hourly Rate Highest Hourly Rate Average Highest Hourly Rate
EDM Operator (Electrode) Lowest Hourly Rate Lowest Hourly Rate Average Average Hourly Rate Highest Hourly Rate Average Highest Hourly Rate
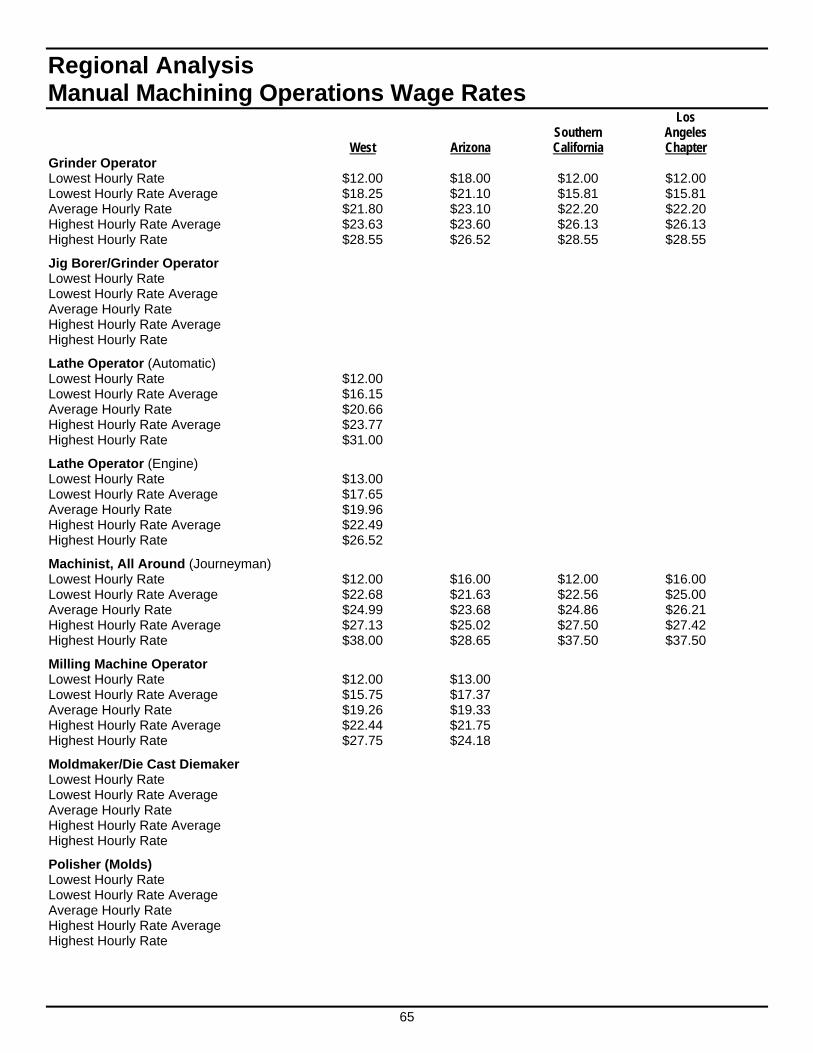
65
Regional Analysis Manual Machining Operations Wage Rates Los Southern Angeles West Arizona California Chapter Grinder Operator Lowest Hourly Rate $12.00 $18.00 $12.00 $12.00 Lowest Hourly Rate Average $18.25 $21.10 $15.81 $15.81 Average Hourly Rate $21.80 $23.10 $22.20 $22.20 Highest Hourly Rate Average $23.63 $23.60 $26.13 $26.13 Highest Hourly Rate $28.55 $26.52 $28.55 $28.55
Jig Borer/Grinder Operator Lowest Hourly Rate Lowest Hourly Rate Average Average Hourly Rate Highest Hourly Rate Average Highest Hourly Rate
Lathe Operator (Automatic) Lowest Hourly Rate $12.00 Lowest Hourly Rate Average $16.15 Average Hourly Rate $20.66 Highest Hourly Rate Average $23.77 Highest Hourly Rate $31.00
Lathe Operator (Engine) Lowest Hourly Rate $13.00 Lowest Hourly Rate Average $17.65 Average Hourly Rate $19.96 Highest Hourly Rate Average $22.49 Highest Hourly Rate $26.52
Machinist, All Around (Journeyman) Lowest Hourly Rate $12.00 $16.00 $12.00 $16.00 Lowest Hourly Rate Average $22.68 $21.63 $22.56 $25.00 Average Hourly Rate $24.99 $23.68 $24.86 $26.21 Highest Hourly Rate Average $27.13 $25.02 $27.50 $27.42 Highest Hourly Rate $38.00 $28.65 $37.50 $37.50
Milling Machine Operator Lowest Hourly Rate $12.00 $13.00 Lowest Hourly Rate Average $15.75 $17.37 Average Hourly Rate $19.26 $19.33 Highest Hourly Rate Average $22.44 $21.75 Highest Hourly Rate $27.75 $24.18
Moldmaker/Die Cast Diemaker Lowest Hourly Rate Lowest Hourly Rate Average Average Hourly Rate Highest Hourly Rate Average Highest Hourly Rate
Polisher (Molds) Lowest Hourly Rate Lowest Hourly Rate Average Average Hourly Rate Highest Hourly Rate Average Highest Hourly Rate
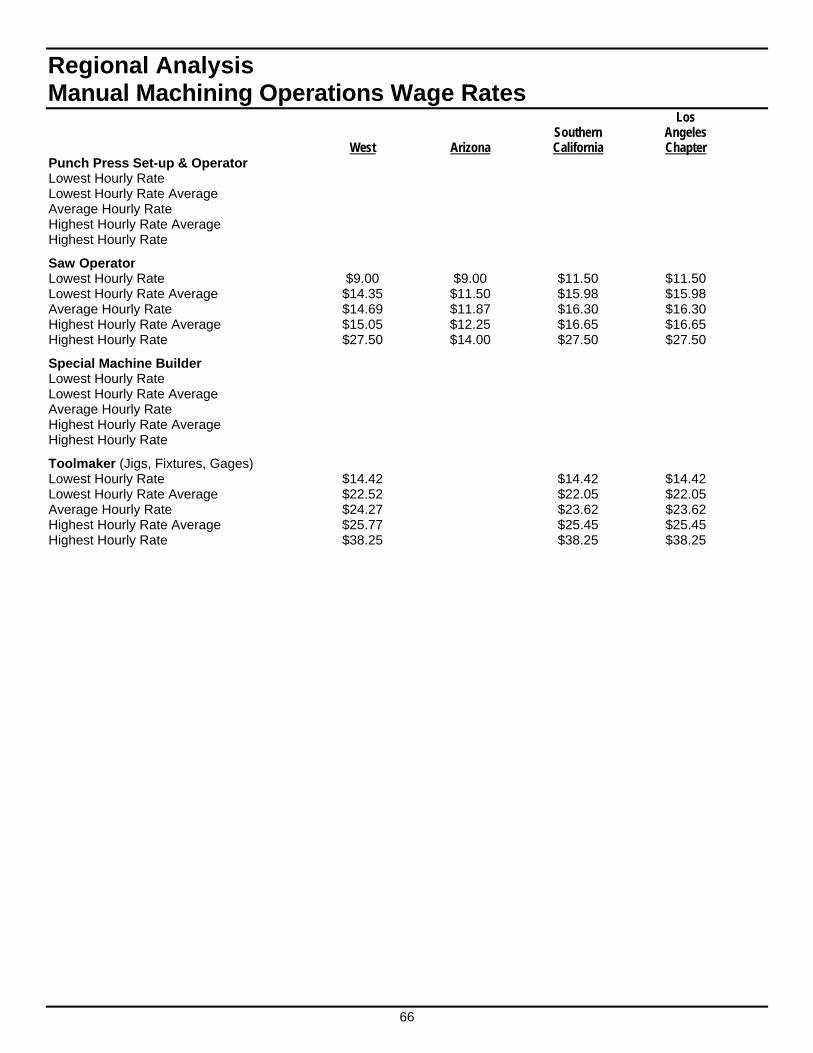
66
Regional Analysis Manual Machining Operations Wage Rates Los Southern Angeles West Arizona California Chapter Punch Press Set-up & Operator Lowest Hourly Rate Lowest Hourly Rate Average Average Hourly Rate Highest Hourly Rate Average Highest Hourly Rate
Saw Operator Lowest Hourly Rate $9.00 $9.00 $11.50 $11.50 Lowest Hourly Rate Average $14.35 $11.50 $15.98 $15.98 Average Hourly Rate $14.69 $11.87 $16.30 $16.30 Highest Hourly Rate Average $15.05 $12.25 $16.65 $16.65 Highest Hourly Rate $27.50 $14.00 $27.50 $27.50
Special Machine Builder Lowest Hourly Rate Lowest Hourly Rate Average Average Hourly Rate Highest Hourly Rate Average Highest Hourly Rate
Toolmaker (Jigs, Fixtures, Gages) Lowest Hourly Rate $14.42 $14.42 $14.42 Lowest Hourly Rate Average $22.52 $22.05 $22.05 Average Hourly Rate $24.27 $23.62 $23.62 Highest Hourly Rate Average $25.77 $25.45 $25.45 Highest Hourly Rate $38.25 $38.25 $38.25
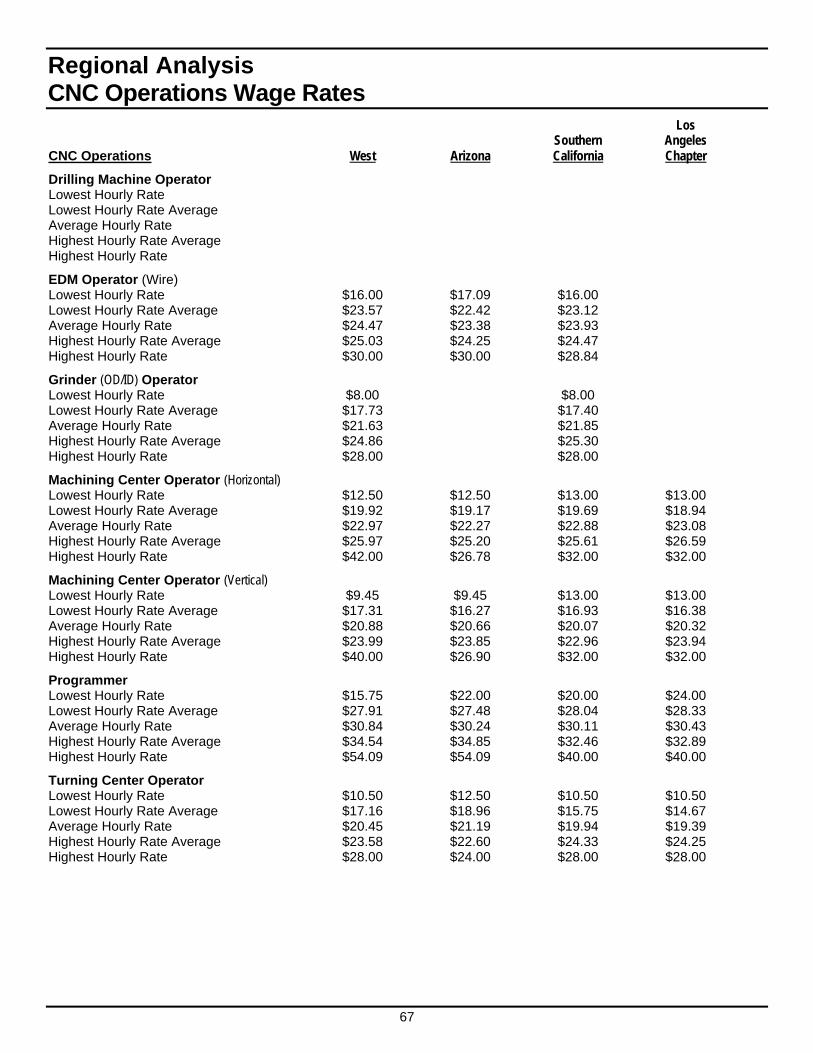
67
Regional Analysis CNC Operations Wage Rates Los Southern Angeles CNC Operations West Arizona California Chapter
Drilling Machine Operator Lowest Hourly Rate Lowest Hourly Rate Average Average Hourly Rate Highest Hourly Rate Average Highest Hourly Rate
EDM Operator (Wire) Lowest Hourly Rate $16.00 $17.09 $16.00 Lowest Hourly Rate Average $23.57 $22.42 $23.12 Average Hourly Rate $24.47 $23.38 $23.93 Highest Hourly Rate Average $25.03 $24.25 $24.47 Highest Hourly Rate $30.00 $30.00 $28.84
Grinder (OD/ID) Operator Lowest Hourly Rate $8.00 $8.00 Lowest Hourly Rate Average $17.73 $17.40 Average Hourly Rate $21.63 $21.85 Highest Hourly Rate Average $24.86 $25.30 Highest Hourly Rate $28.00 $28.00
Machining Center Operator (Horizontal) Lowest Hourly Rate $12.50 $12.50 $13.00 $13.00 Lowest Hourly Rate Average $19.92 $19.17 $19.69 $18.94 Average Hourly Rate $22.97 $22.27 $22.88 $23.08 Highest Hourly Rate Average $25.97 $25.20 $25.61 $26.59 Highest Hourly Rate $42.00 $26.78 $32.00 $32.00
Machining Center Operator (Vertical) Lowest Hourly Rate $9.45 $9.45 $13.00 $13.00 Lowest Hourly Rate Average $17.31 $16.27 $16.93 $16.38 Average Hourly Rate $20.88 $20.66 $20.07 $20.32 Highest Hourly Rate Average $23.99 $23.85 $22.96 $23.94 Highest Hourly Rate $40.00 $26.90 $32.00 $32.00
Programmer Lowest Hourly Rate $15.75 $22.00 $20.00 $24.00 Lowest Hourly Rate Average $27.91 $27.48 $28.04 $28.33 Average Hourly Rate $30.84 $30.24 $30.11 $30.43 Highest Hourly Rate Average $34.54 $34.85 $32.46 $32.89 Highest Hourly Rate $54.09 $54.09 $40.00 $40.00
Turning Center Operator Lowest Hourly Rate $10.50 $12.50 $10.50 $10.50 Lowest Hourly Rate Average $17.16 $18.96 $15.75 $14.67 Average Hourly Rate $20.45 $21.19 $19.94 $19.39 Highest Hourly Rate Average $23.58 $22.60 $24.33 $24.25 Highest Hourly Rate $28.00 $24.00 $28.00 $28.00
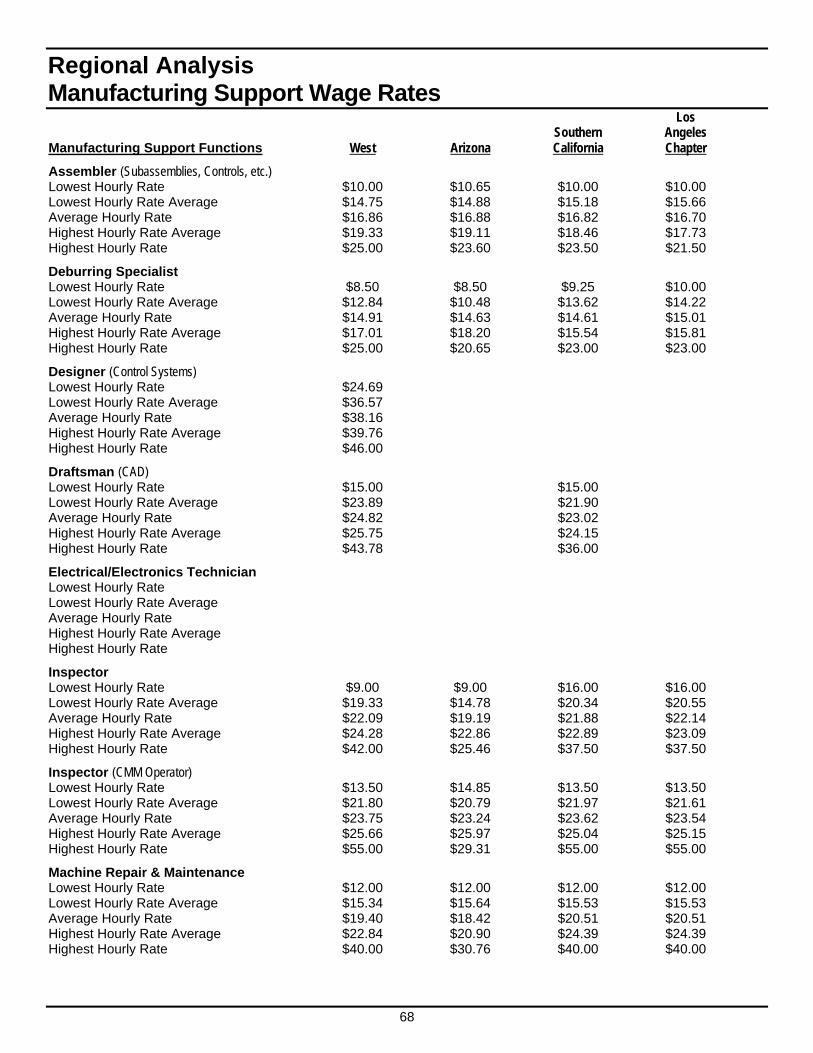
68
Regional Analysis Manufacturing Support Wage Rates Los Southern Angeles Manufacturing Support Functions West Arizona California Chapter
Assembler (Subassemblies, Controls, etc.) Lowest Hourly Rate $10.00 $10.65 $10.00 $10.00 Lowest Hourly Rate Average $14.75 $14.88 $15.18 $15.66 Average Hourly Rate $16.86 $16.88 $16.82 $16.70 Highest Hourly Rate Average $19.33 $19.11 $18.46 $17.73 Highest Hourly Rate $25.00 $23.60 $23.50 $21.50
Deburring Specialist Lowest Hourly Rate $8.50 $8.50 $9.25 $10.00 Lowest Hourly Rate Average $12.84 $10.48 $13.62 $14.22 Average Hourly Rate $14.91 $14.63 $14.61 $15.01 Highest Hourly Rate Average $17.01 $18.20 $15.54 $15.81 Highest Hourly Rate $25.00 $20.65 $23.00 $23.00
Designer (Control Systems) Lowest Hourly Rate $24.69 Lowest Hourly Rate Average $36.57 Average Hourly Rate $38.16 Highest Hourly Rate Average $39.76 Highest Hourly Rate $46.00
Draftsman (CAD) Lowest Hourly Rate $15.00 $15.00 Lowest Hourly Rate Average $23.89 $21.90 Average Hourly Rate $24.82 $23.02 Highest Hourly Rate Average $25.75 $24.15 Highest Hourly Rate $43.78 $36.00
Electrical/Electronics Technician Lowest Hourly Rate Lowest Hourly Rate Average Average Hourly Rate Highest Hourly Rate Average Highest Hourly Rate
Inspector Lowest Hourly Rate $9.00 $9.00 $16.00 $16.00 Lowest Hourly Rate Average $19.33 $14.78 $20.34 $20.55 Average Hourly Rate $22.09 $19.19 $21.88 $22.14 Highest Hourly Rate Average $24.28 $22.86 $22.89 $23.09 Highest Hourly Rate $42.00 $25.46 $37.50 $37.50
Inspector (CMM Operator) Lowest Hourly Rate $13.50 $14.85 $13.50 $13.50 Lowest Hourly Rate Average $21.80 $20.79 $21.97 $21.61 Average Hourly Rate $23.75 $23.24 $23.62 $23.54 Highest Hourly Rate Average $25.66 $25.97 $25.04 $25.15 Highest Hourly Rate $55.00 $29.31 $55.00 $55.00
Machine Repair & Maintenance Lowest Hourly Rate $12.00 $12.00 $12.00 $12.00 Lowest Hourly Rate Average $15.34 $15.64 $15.53 $15.53 Average Hourly Rate $19.40 $18.42 $20.51 $20.51 Highest Hourly Rate Average $22.84 $20.90 $24.39 $24.39 Highest Hourly Rate $40.00 $30.76 $40.00 $40.00
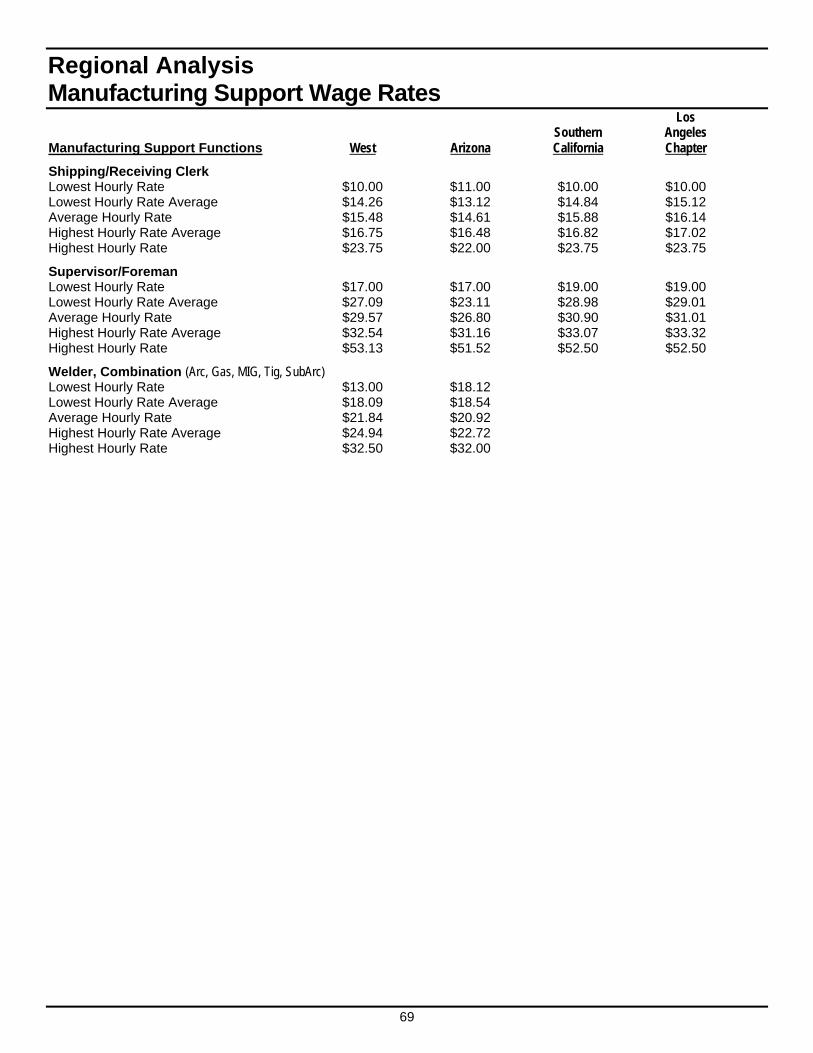
69
Regional Analysis Manufacturing Support Wage Rates Los Southern Angeles Manufacturing Support Functions West Arizona California Chapter
Shipping/Receiving Clerk Lowest Hourly Rate $10.00 $11.00 $10.00 $10.00 Lowest Hourly Rate Average $14.26 $13.12 $14.84 $15.12 Average Hourly Rate $15.48 $14.61 $15.88 $16.14 Highest Hourly Rate Average $16.75 $16.48 $16.82 $17.02 Highest Hourly Rate $23.75 $22.00 $23.75 $23.75
Supervisor/Foreman Lowest Hourly Rate $17.00 $17.00 $19.00 $19.00 Lowest Hourly Rate Average $27.09 $23.11 $28.98 $29.01 Average Hourly Rate $29.57 $26.80 $30.90 $31.01 Highest Hourly Rate Average $32.54 $31.16 $33.07 $33.32 Highest Hourly Rate $53.13 $51.52 $52.50 $52.50
Welder, Combination (Arc, Gas, MIG, Tig, SubArc) Lowest Hourly Rate $13.00 $18.12 Lowest Hourly Rate Average $18.09 $18.54 Average Hourly Rate $21.84 $20.92 Highest Hourly Rate Average $24.94 $22.72 Highest Hourly Rate $32.50 $32.00
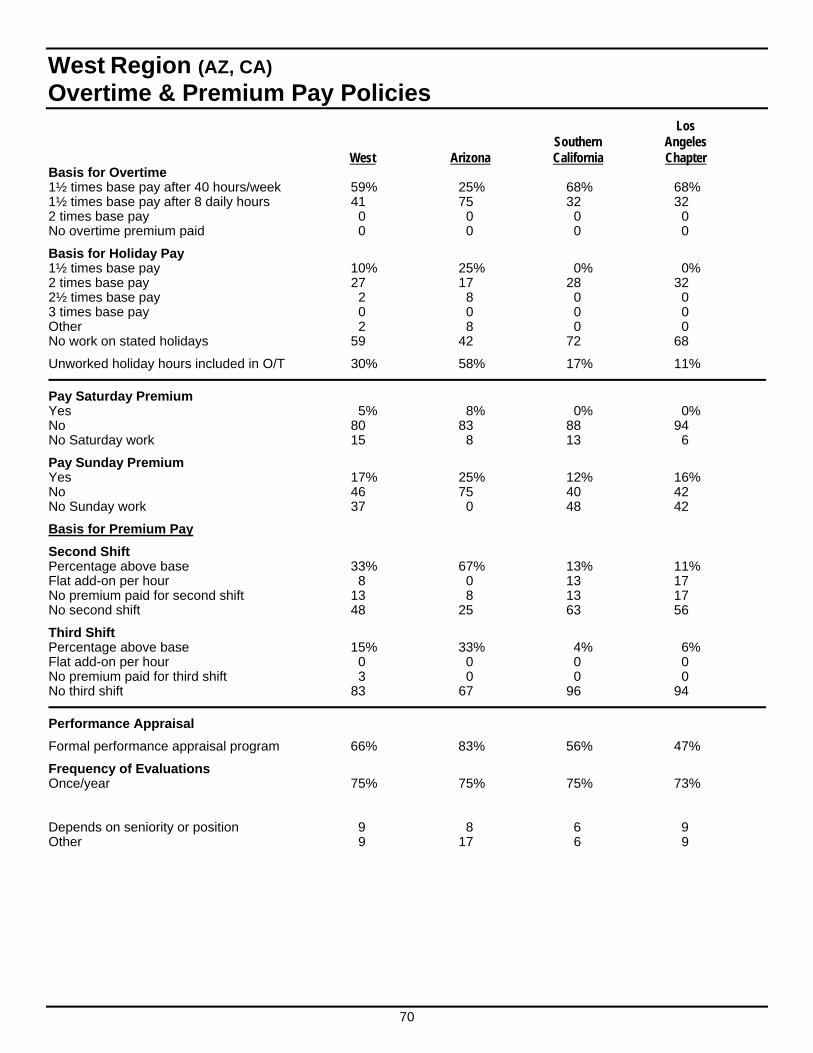
70
West Region (AZ, CA)
Overtime & Premium Pay Policies Los Southern Angeles West Arizona California Chapter Basis for Overtime 1½ times base pay after 40 hours/week 59% 25% 68% 68% 1½ times base pay after 8 daily hours 41 75 32 32 2 times base pay 0 0 0 0 No overtime premium paid 0 0 0 0
Basis for Holiday Pay 1½ times base pay 10% 25% 0% 0% 2 times base pay 27 17 28 32 2½ times base pay 2 8 0 0 3 times base pay 0 0 0 0 Other 2 8 0 0 No work on stated holidays 59 42 72 68
Unworked holiday hours included in O/T 30% 58% 17% 11%
Pay Saturday Premium Yes 5% 8% 0% 0% No 80 83 88 94 No Saturday work 15 8 13 6
Pay Sunday Premium Yes 17% 25% 12% 16% No 46 75 40 42 No Sunday work 37 0 48 42
Basis for Premium Pay
Second Shift Percentage above base 33% 67% 13% 11% Flat add-on per hour 8 0 13 17 No premium paid for second shift 13 8 13 17 No second shift 48 25 63 56
Third Shift Percentage above base 15% 33% 4% 6% Flat add-on per hour 0 0 0 0 No premium paid for third shift 3 0 0 0 No third shift 83 67 96 94
Performance Appraisal
Formal performance appraisal program 66% 83% 56% 47%
Frequency of Evaluations Once/year 75% 75% 75% 73% Depends on seniority or position 9 8 6 9 Other 9 17 6 9
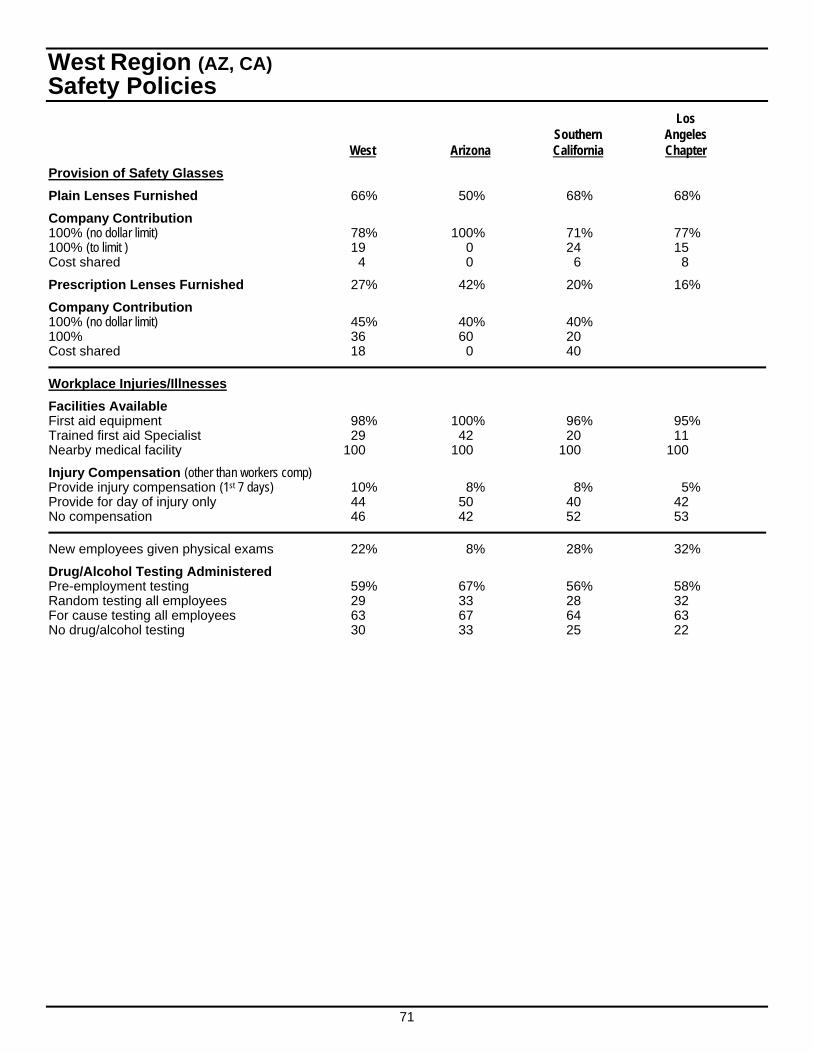
71
West Region (AZ, CA) Safety Policies Los Southern Angeles West Arizona California Chapter
Provision of Safety Glasses
Plain Lenses Furnished 66% 50% 68% 68%
Company Contribution 100% (no dollar limit) 78% 100% 71% 77% 100% (to limit ) 19 0 24 15 Cost shared 4 0 6 8
Prescription Lenses Furnished 27% 42% 20% 16%
Company Contribution 100% (no dollar limit) 45% 40% 40% 100% 36 60 20 Cost shared 18 0 40
Workplace Injuries/Illnesses
Facilities Available First aid equipment 98% 100% 96% 95% Trained first aid Specialist 29 42 20 11 Nearby medical facility 100 100 100 100
Injury Compensation (other than workers comp) Provide injury compensation (1st 7 days) 10% 8% 8% 5% Provide for day of injury only 44 50 40 42 No compensation 46 42 52 53
New employees given physical exams 22% 8% 28% 32%
Drug/Alcohol Testing Administered Pre-employment testing 59% 67% 56% 58% Random testing all employees 29 33 28 32 For cause testing all employees 63 67 64 63 No drug/alcohol testing 30 33 25 22
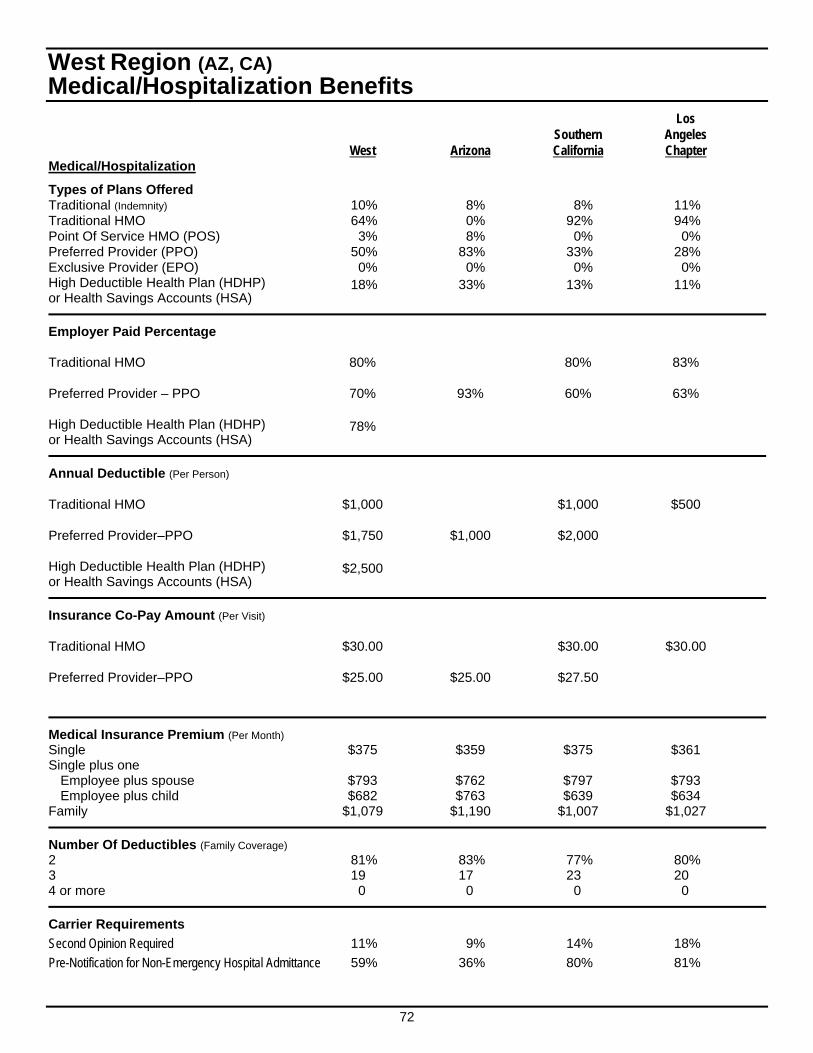
72
West Region (AZ, CA) Medical/Hospitalization Benefits Los Southern Angeles West Arizona California Chapter Medical/Hospitalization
Types of Plans Offered Traditional (Indemnity) 10% 8% 8% 11% Traditional HMO 64% 0% 92% 94% Point Of Service HMO (POS) 3% 8% 0% 0% Preferred Provider (PPO) 50% 83% 33% 28% Exclusive Provider (EPO) 0% 0% 0% 0% High Deductible Health Plan (HDHP) or Health Savings Accounts (HSA)
18% 33% 13% 11%
Employer Paid Percentage Traditional HMO 80% 80% 83% Preferred Provider – PPO 70% 93% 60% 63% High Deductible Health Plan (HDHP) or Health Savings Accounts (HSA)
78%
Annual Deductible (Per Person) Traditional HMO $1,000 $1,000 $500 Preferred Provider–PPO $1,750 $1,000 $2,000 High Deductible Health Plan (HDHP) or Health Savings Accounts (HSA)
$2,500
Insurance Co-Pay Amount (Per Visit) Traditional HMO $30.00 $30.00 $30.00 Preferred Provider–PPO $25.00 $25.00 $27.50
Medical Insurance Premium (Per Month) Single $375 $359 $375 $361 Single plus one
Employee plus spouse $793 $762 $797 $793 Employee plus child $682 $763 $639 $634
Family $1,079 $1,190 $1,007 $1,027
Number Of Deductibles (Family Coverage) 2 81% 83% 77% 80% 3 19 17 23 20 4 or more 0 0 0 0
Carrier Requirements
Second Opinion Required 11% 9% 14% 18%
Pre-Notification for Non-Emergency Hospital Admittance 59% 36% 80% 81%
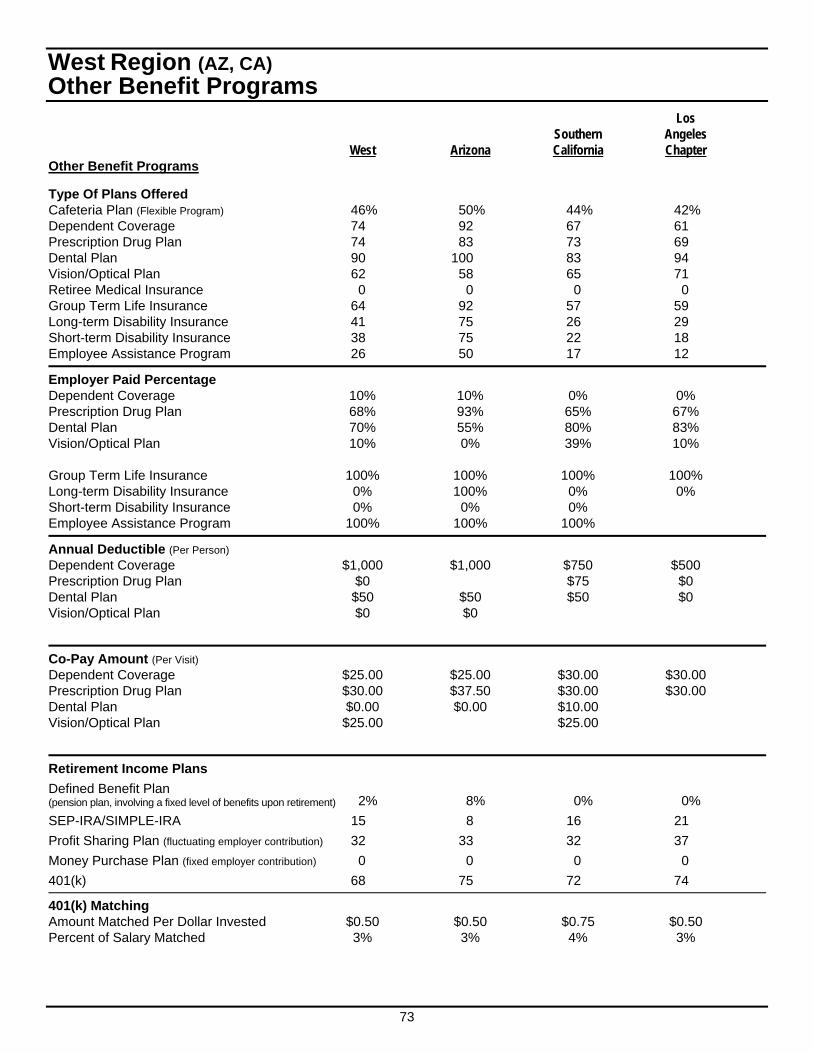
73
West Region (AZ, CA) Other Benefit Programs Los Southern Angeles West Arizona California Chapter Other Benefit Programs
Type Of Plans Offered Cafeteria Plan (Flexible Program) 46% 50% 44% 42% Dependent Coverage 74 92 67 61 Prescription Drug Plan 74 83 73 69 Dental Plan 90 100 83 94 Vision/Optical Plan 62 58 65 71 Retiree Medical Insurance 0 0 0 0 Group Term Life Insurance 64 92 57 59 Long-term Disability Insurance 41 75 26 29 Short-term Disability Insurance 38 75 22 18 Employee Assistance Program 26 50 17 12
Employer Paid Percentage Dependent Coverage 10% 10% 0% 0% Prescription Drug Plan 68% 93% 65% 67% Dental Plan 70% 55% 80% 83% Vision/Optical Plan 10% 0% 39% 10% Group Term Life Insurance 100% 100% 100% 100% Long-term Disability Insurance 0% 100% 0% 0% Short-term Disability Insurance 0% 0% 0% Employee Assistance Program 100% 100% 100%
Annual Deductible (Per Person) Dependent Coverage $1,000 $1,000 $750 $500 Prescription Drug Plan $0 $75 $0 Dental Plan $50 $50 $50 $0 Vision/Optical Plan $0 $0
Co-Pay Amount (Per Visit) Dependent Coverage $25.00 $25.00 $30.00 $30.00 Prescription Drug Plan $30.00 $37.50 $30.00 $30.00 Dental Plan $0.00 $0.00 $10.00 Vision/Optical Plan $25.00 $25.00
Retirement Income Plans
Defined Benefit Plan (pension plan, involving a fixed level of benefits upon retirement) 2% 8% 0% 0%
SEP-IRA/SIMPLE-IRA 15 8 16 21
Profit Sharing Plan (fluctuating employer contribution) 32 33 32 37
Money Purchase Plan (fixed employer contribution) 0 0 0 0
401(k) 68 75 72 74
401(k) Matching Amount Matched Per Dollar Invested $0.50 $0.50 $0.75 $0.50 Percent of Salary Matched 3% 3% 4% 3%
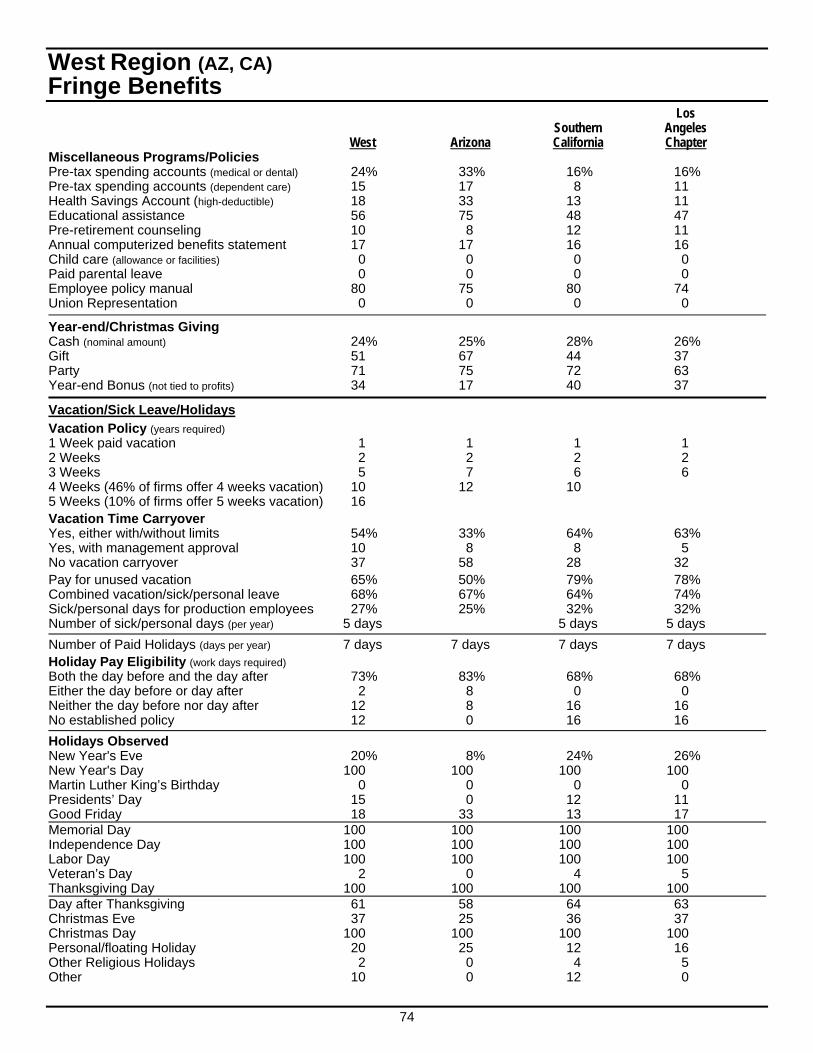
74
West Region (AZ, CA) Fringe Benefits Los Southern Angeles West Arizona California Chapter Miscellaneous Programs/Policies Pre-tax spending accounts (medical or dental) 24% 33% 16% 16% Pre-tax spending accounts (dependent care) 15 17 8 11 Health Savings Account (high-deductible) 18 33 13 11 Educational assistance 56 75 48 47 Pre-retirement counseling 10 8 12 11 Annual computerized benefits statement 17 17 16 16 Child care (allowance or facilities) 0 0 0 0 Paid parental leave 0 0 0 0 Employee policy manual 80 75 80 74 Union Representation 0 0 0 0
Year-end/Christmas Giving Cash (nominal amount) 24% 25% 28% 26% Gift 51 67 44 37 Party 71 75 72 63 Year-end Bonus (not tied to profits) 34 17 40 37
Vacation/Sick Leave/Holidays
Vacation Policy (years required) 1 Week paid vacation 1 1 1 1 2 Weeks 2 2 2 2 3 Weeks 5 7 6 6 4 Weeks (46% of firms offer 4 weeks vacation) 10 12 10 5 Weeks (10% of firms offer 5 weeks vacation) 16 Vacation Time Carryover Yes, either with/without limits 54% 33% 64% 63% Yes, with management approval 10 8 8 5 No vacation carryover 37 58 28 32 Pay for unused vacation 65% 50% 79% 78% Combined vacation/sick/personal leave 68% 67% 64% 74% Sick/personal days for production employees 27% 25% 32% 32% Number of sick/personal days (per year) 5 days 5 days 5 days
Number of Paid Holidays (days per year) 7 days 7 days 7 days 7 days Holiday Pay Eligibility (work days required) Both the day before and the day after 73% 83% 68% 68% Either the day before or day after 2 8 0 0 Neither the day before nor day after 12 8 16 16 No established policy 12 0 16 16
Holidays Observed New Year's Eve 20% 8% 24% 26% New Year's Day 100 100 100 100 Martin Luther King’s Birthday 0 0 0 0 Presidents’ Day 15 0 12 11 Good Friday 18 33 13 17 Memorial Day 100 100 100 100 Independence Day 100 100 100 100 Labor Day 100 100 100 100 Veteran’s Day 2 0 4 5 Thanksgiving Day 100 100 100 100 Day after Thanksgiving 61 58 64 63 Christmas Eve 37 25 36 37 Christmas Day 100 100 100 100 Personal/floating Holiday 20 25 12 16 Other Religious Holidays 2 0 4 5 Other 10 0 12 0
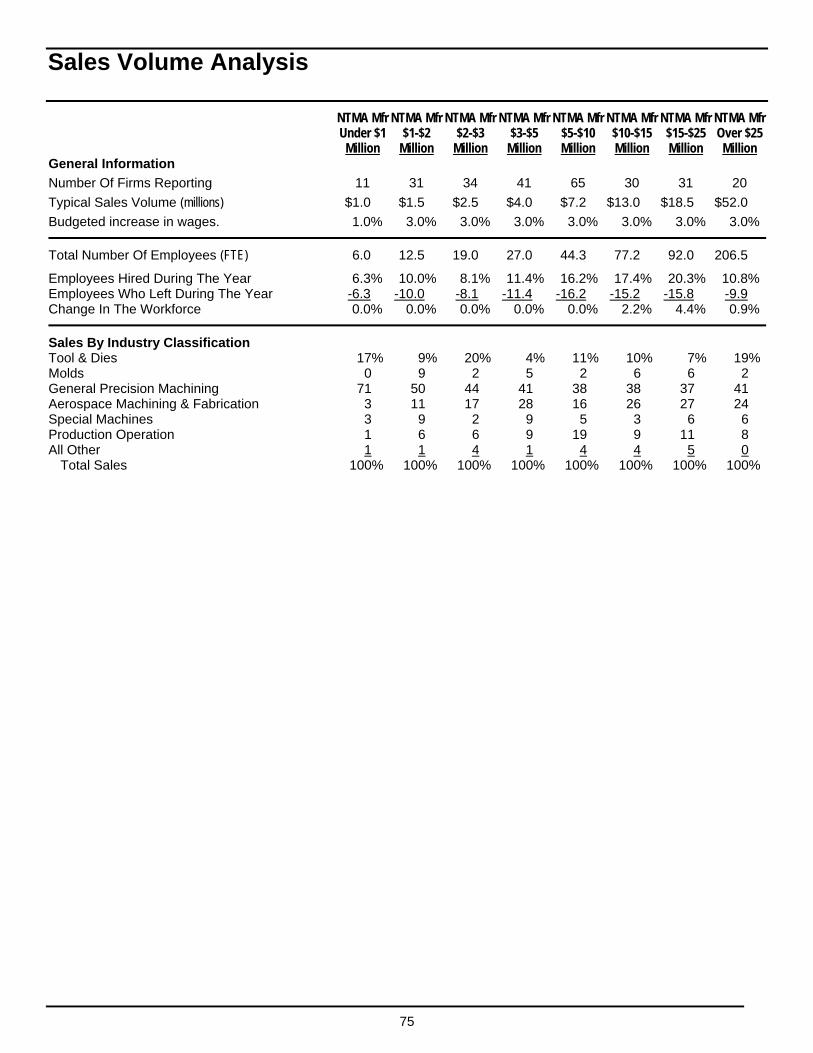
75
Sales Volume Analysis
NTMA Mfr NTMA Mfr NTMA Mfr NTMA Mfr NTMA Mfr NTMA Mfr NTMA Mfr NTMA Mfr Under $1 $1-$2 $2-$3 $3-$5 $5-$10 $10-$15 $15-$25 Over $25 Million Million Million Million Million Million Million Million General Information
Number Of Firms Reporting 11 31 34 41 65 30 31 20
Typical Sales Volume (millions) $1.0 $1.5 $2.5 $4.0 $7.2 $13.0 $18.5 $52.0
Budgeted increase in wages. 1.0% 3.0% 3.0% 3.0% 3.0% 3.0% 3.0% 3.0%
Total Number Of Employees (FTE) 6.0 12.5 19.0 27.0 44.3 77.2 92.0 206.5
Employees Hired During The Year 6.3% 10.0% 8.1% 11.4% 16.2% 17.4% 20.3% 10.8%Employees Who Left During The Year -6.3 -10.0 -8.1 -11.4 -16.2 -15.2 -15.8 -9.9 Change In The Workforce 0.0% 0.0% 0.0% 0.0% 0.0% 2.2% 4.4% 0.9%
Sales By Industry Classification Tool & Dies 17% 9% 20% 4% 11% 10% 7% 19%Molds 0 9 2 5 2 6 6 2 General Precision Machining 71 50 44 41 38 38 37 41 Aerospace Machining & Fabrication 3 11 17 28 16 26 27 24 Special Machines 3 9 2 9 5 3 6 6 Production Operation 1 6 6 9 19 9 11 8 All Other 1 1 4 1 4 4 5 0
Total Sales 100% 100% 100% 100% 100% 100% 100% 100%
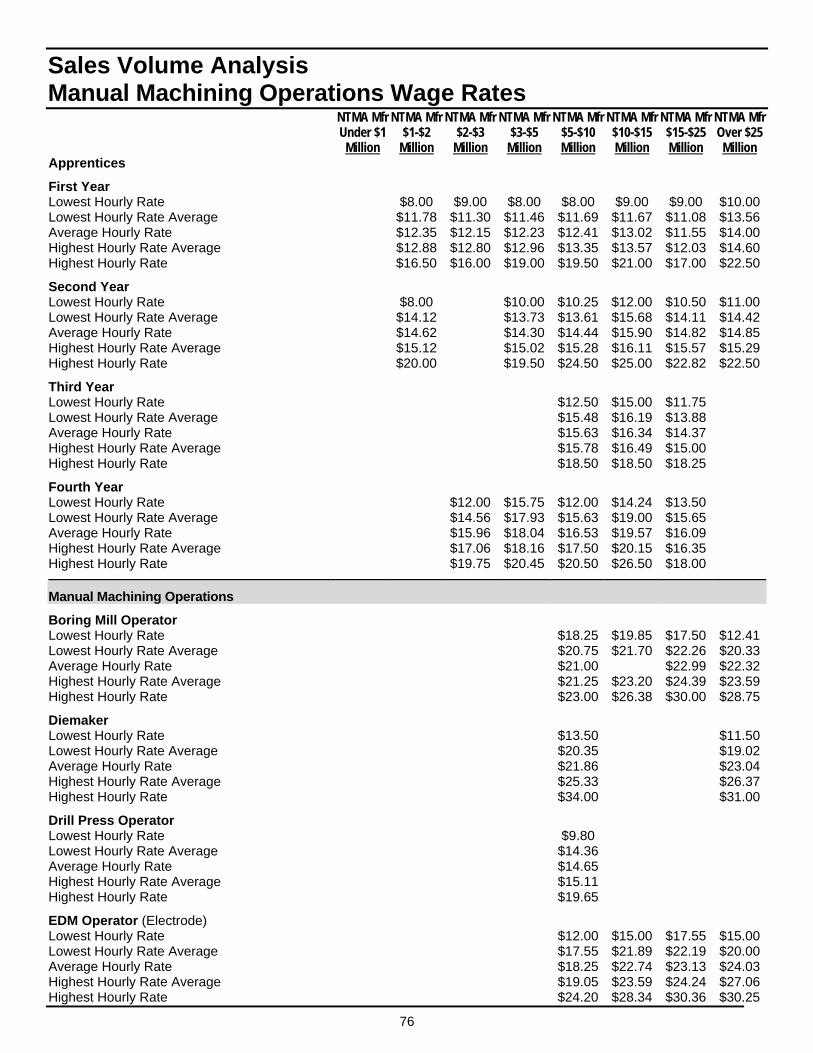
76
Sales Volume Analysis Manual Machining Operations Wage Rates NTMA Mfr NTMA Mfr NTMA Mfr NTMA Mfr NTMA Mfr NTMA Mfr NTMA Mfr NTMA Mfr Under $1 $1-$2 $2-$3 $3-$5 $5-$10 $10-$15 $15-$25 Over $25 Million Million Million Million Million Million Million Million Apprentices
First Year Lowest Hourly Rate $8.00 $9.00 $8.00 $8.00 $9.00 $9.00 $10.00Lowest Hourly Rate Average $11.78 $11.30 $11.46 $11.69 $11.67 $11.08 $13.56Average Hourly Rate $12.35 $12.15 $12.23 $12.41 $13.02 $11.55 $14.00Highest Hourly Rate Average $12.88 $12.80 $12.96 $13.35 $13.57 $12.03 $14.60Highest Hourly Rate $16.50 $16.00 $19.00 $19.50 $21.00 $17.00 $22.50
Second Year Lowest Hourly Rate $8.00 $10.00 $10.25 $12.00 $10.50 $11.00Lowest Hourly Rate Average $14.12 $13.73 $13.61 $15.68 $14.11 $14.42Average Hourly Rate $14.62 $14.30 $14.44 $15.90 $14.82 $14.85Highest Hourly Rate Average $15.12 $15.02 $15.28 $16.11 $15.57 $15.29Highest Hourly Rate $20.00 $19.50 $24.50 $25.00 $22.82 $22.50
Third Year Lowest Hourly Rate $12.50 $15.00 $11.75 Lowest Hourly Rate Average $15.48 $16.19 $13.88 Average Hourly Rate $15.63 $16.34 $14.37 Highest Hourly Rate Average $15.78 $16.49 $15.00 Highest Hourly Rate $18.50 $18.50 $18.25
Fourth Year Lowest Hourly Rate $12.00 $15.75 $12.00 $14.24 $13.50 Lowest Hourly Rate Average $14.56 $17.93 $15.63 $19.00 $15.65 Average Hourly Rate $15.96 $18.04 $16.53 $19.57 $16.09 Highest Hourly Rate Average $17.06 $18.16 $17.50 $20.15 $16.35 Highest Hourly Rate $19.75 $20.45 $20.50 $26.50 $18.00
Manual Machining Operations
Boring Mill Operator Lowest Hourly Rate $18.25 $19.85 $17.50 $12.41Lowest Hourly Rate Average $20.75 $21.70 $22.26 $20.33Average Hourly Rate $21.00 $22.99 $22.32Highest Hourly Rate Average $21.25 $23.20 $24.39 $23.59Highest Hourly Rate $23.00 $26.38 $30.00 $28.75
Diemaker Lowest Hourly Rate $13.50 $11.50Lowest Hourly Rate Average $20.35 $19.02Average Hourly Rate $21.86 $23.04Highest Hourly Rate Average $25.33 $26.37Highest Hourly Rate $34.00 $31.00
Drill Press Operator Lowest Hourly Rate $9.80 Lowest Hourly Rate Average $14.36 Average Hourly Rate $14.65 Highest Hourly Rate Average $15.11 Highest Hourly Rate $19.65
EDM Operator (Electrode) Lowest Hourly Rate $12.00 $15.00 $17.55 $15.00Lowest Hourly Rate Average $17.55 $21.89 $22.19 $20.00Average Hourly Rate $18.25 $22.74 $23.13 $24.03Highest Hourly Rate Average $19.05 $23.59 $24.24 $27.06Highest Hourly Rate $24.20 $28.34 $30.36 $30.25
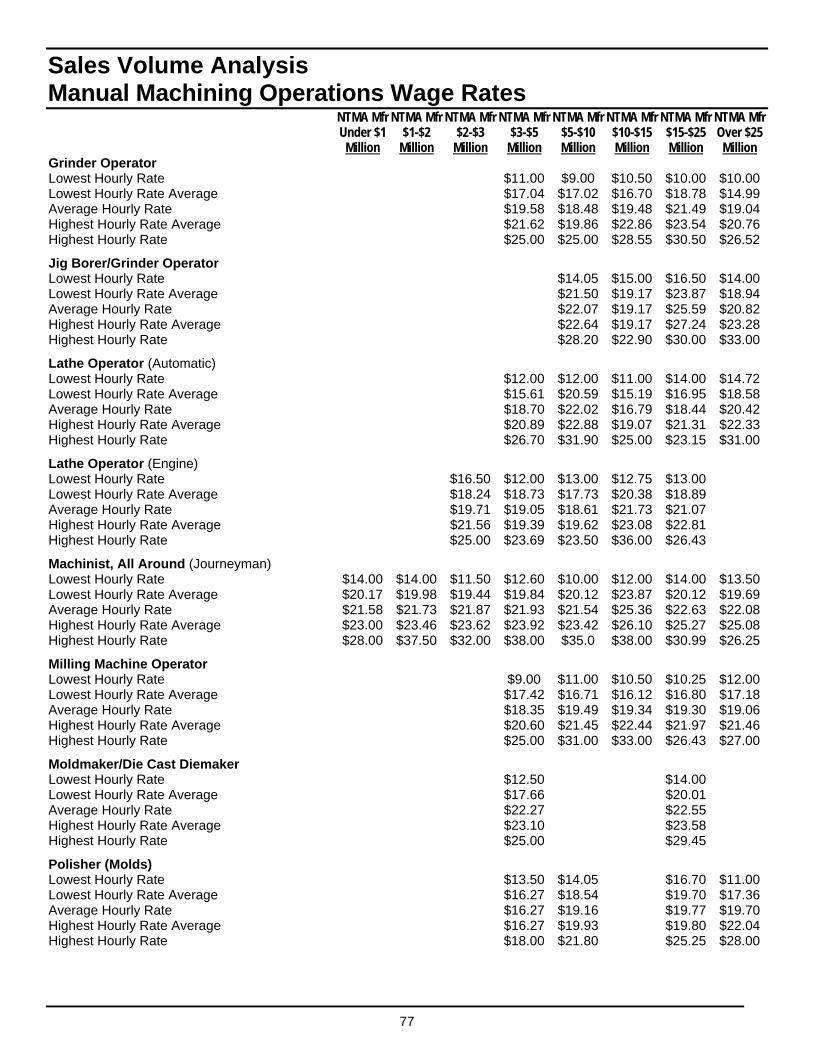
77
Sales Volume Analysis Manual Machining Operations Wage Rates NTMA Mfr NTMA Mfr NTMA Mfr NTMA Mfr NTMA Mfr NTMA Mfr NTMA Mfr NTMA Mfr Under $1 $1-$2 $2-$3 $3-$5 $5-$10 $10-$15 $15-$25 Over $25 Million Million Million Million Million Million Million Million Grinder Operator Lowest Hourly Rate $11.00 $9.00 $10.50 $10.00 $10.00Lowest Hourly Rate Average $17.04 $17.02 $16.70 $18.78 $14.99Average Hourly Rate $19.58 $18.48 $19.48 $21.49 $19.04Highest Hourly Rate Average $21.62 $19.86 $22.86 $23.54 $20.76Highest Hourly Rate $25.00 $25.00 $28.55 $30.50 $26.52
Jig Borer/Grinder Operator Lowest Hourly Rate $14.05 $15.00 $16.50 $14.00Lowest Hourly Rate Average $21.50 $19.17 $23.87 $18.94Average Hourly Rate $22.07 $19.17 $25.59 $20.82Highest Hourly Rate Average $22.64 $19.17 $27.24 $23.28Highest Hourly Rate $28.20 $22.90 $30.00 $33.00
Lathe Operator (Automatic) Lowest Hourly Rate $12.00 $12.00 $11.00 $14.00 $14.72Lowest Hourly Rate Average $15.61 $20.59 $15.19 $16.95 $18.58Average Hourly Rate $18.70 $22.02 $16.79 $18.44 $20.42Highest Hourly Rate Average $20.89 $22.88 $19.07 $21.31 $22.33Highest Hourly Rate $26.70 $31.90 $25.00 $23.15 $31.00
Lathe Operator (Engine) Lowest Hourly Rate $16.50 $12.00 $13.00 $12.75 $13.00 Lowest Hourly Rate Average $18.24 $18.73 $17.73 $20.38 $18.89 Average Hourly Rate $19.71 $19.05 $18.61 $21.73 $21.07 Highest Hourly Rate Average $21.56 $19.39 $19.62 $23.08 $22.81 Highest Hourly Rate $25.00 $23.69 $23.50 $36.00 $26.43
Machinist, All Around (Journeyman) Lowest Hourly Rate $14.00 $14.00 $11.50 $12.60 $10.00 $12.00 $14.00 $13.50Lowest Hourly Rate Average $20.17 $19.98 $19.44 $19.84 $20.12 $23.87 $20.12 $19.69Average Hourly Rate $21.58 $21.73 $21.87 $21.93 $21.54 $25.36 $22.63 $22.08Highest Hourly Rate Average $23.00 $23.46 $23.62 $23.92 $23.42 $26.10 $25.27 $25.08Highest Hourly Rate $28.00 $37.50 $32.00 $38.00 $35.0 $38.00 $30.99 $26.25
Milling Machine Operator Lowest Hourly Rate $9.00 $11.00 $10.50 $10.25 $12.00Lowest Hourly Rate Average $17.42 $16.71 $16.12 $16.80 $17.18Average Hourly Rate $18.35 $19.49 $19.34 $19.30 $19.06Highest Hourly Rate Average $20.60 $21.45 $22.44 $21.97 $21.46Highest Hourly Rate $25.00 $31.00 $33.00 $26.43 $27.00
Moldmaker/Die Cast Diemaker Lowest Hourly Rate $12.50 $14.00 Lowest Hourly Rate Average $17.66 $20.01 Average Hourly Rate $22.27 $22.55 Highest Hourly Rate Average $23.10 $23.58 Highest Hourly Rate $25.00 $29.45
Polisher (Molds) Lowest Hourly Rate $13.50 $14.05 $16.70 $11.00Lowest Hourly Rate Average $16.27 $18.54 $19.70 $17.36Average Hourly Rate $16.27 $19.16 $19.77 $19.70Highest Hourly Rate Average $16.27 $19.93 $19.80 $22.04Highest Hourly Rate $18.00 $21.80 $25.25 $28.00
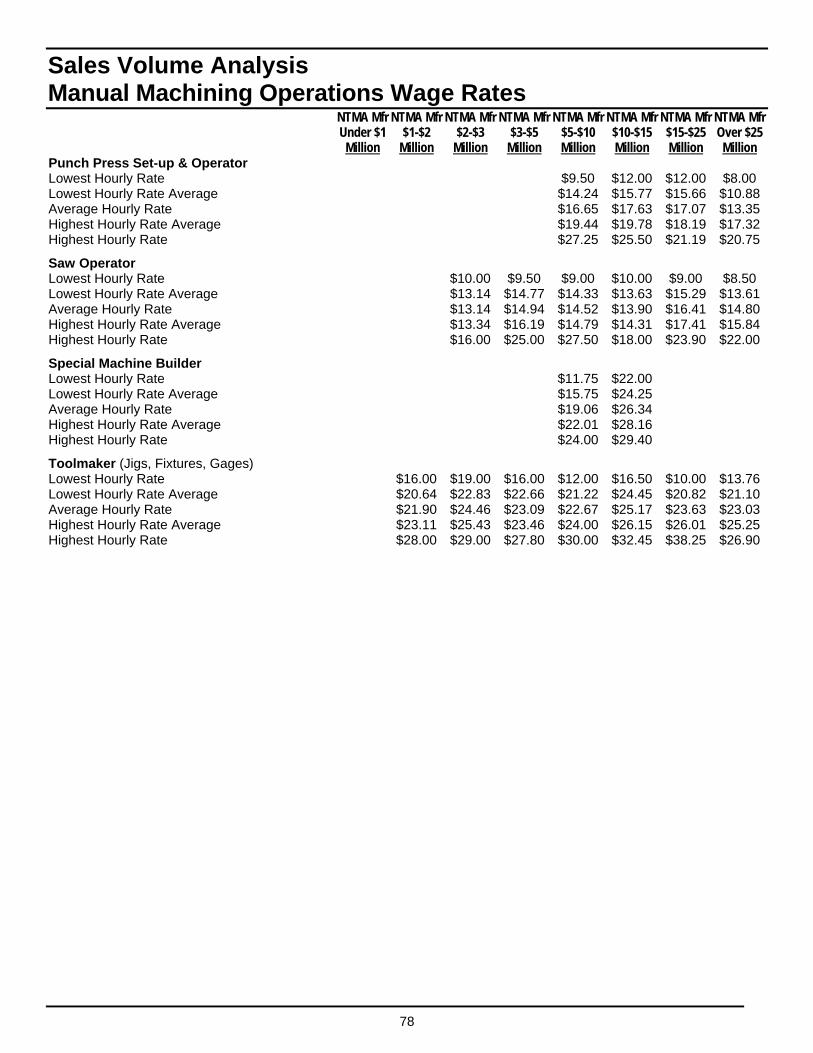
78
Sales Volume Analysis Manual Machining Operations Wage Rates NTMA Mfr NTMA Mfr NTMA Mfr NTMA Mfr NTMA Mfr NTMA Mfr NTMA Mfr NTMA Mfr Under $1 $1-$2 $2-$3 $3-$5 $5-$10 $10-$15 $15-$25 Over $25 Million Million Million Million Million Million Million Million Punch Press Set-up & Operator Lowest Hourly Rate $9.50 $12.00 $12.00 $8.00 Lowest Hourly Rate Average $14.24 $15.77 $15.66 $10.88Average Hourly Rate $16.65 $17.63 $17.07 $13.35Highest Hourly Rate Average $19.44 $19.78 $18.19 $17.32Highest Hourly Rate $27.25 $25.50 $21.19 $20.75
Saw Operator Lowest Hourly Rate $10.00 $9.50 $9.00 $10.00 $9.00 $8.50 Lowest Hourly Rate Average $13.14 $14.77 $14.33 $13.63 $15.29 $13.61Average Hourly Rate $13.14 $14.94 $14.52 $13.90 $16.41 $14.80Highest Hourly Rate Average $13.34 $16.19 $14.79 $14.31 $17.41 $15.84Highest Hourly Rate $16.00 $25.00 $27.50 $18.00 $23.90 $22.00
Special Machine Builder Lowest Hourly Rate $11.75 $22.00 Lowest Hourly Rate Average $15.75 $24.25 Average Hourly Rate $19.06 $26.34 Highest Hourly Rate Average $22.01 $28.16 Highest Hourly Rate $24.00 $29.40
Toolmaker (Jigs, Fixtures, Gages) Lowest Hourly Rate $16.00 $19.00 $16.00 $12.00 $16.50 $10.00 $13.76Lowest Hourly Rate Average $20.64 $22.83 $22.66 $21.22 $24.45 $20.82 $21.10Average Hourly Rate $21.90 $24.46 $23.09 $22.67 $25.17 $23.63 $23.03Highest Hourly Rate Average $23.11 $25.43 $23.46 $24.00 $26.15 $26.01 $25.25Highest Hourly Rate $28.00 $29.00 $27.80 $30.00 $32.45 $38.25 $26.90
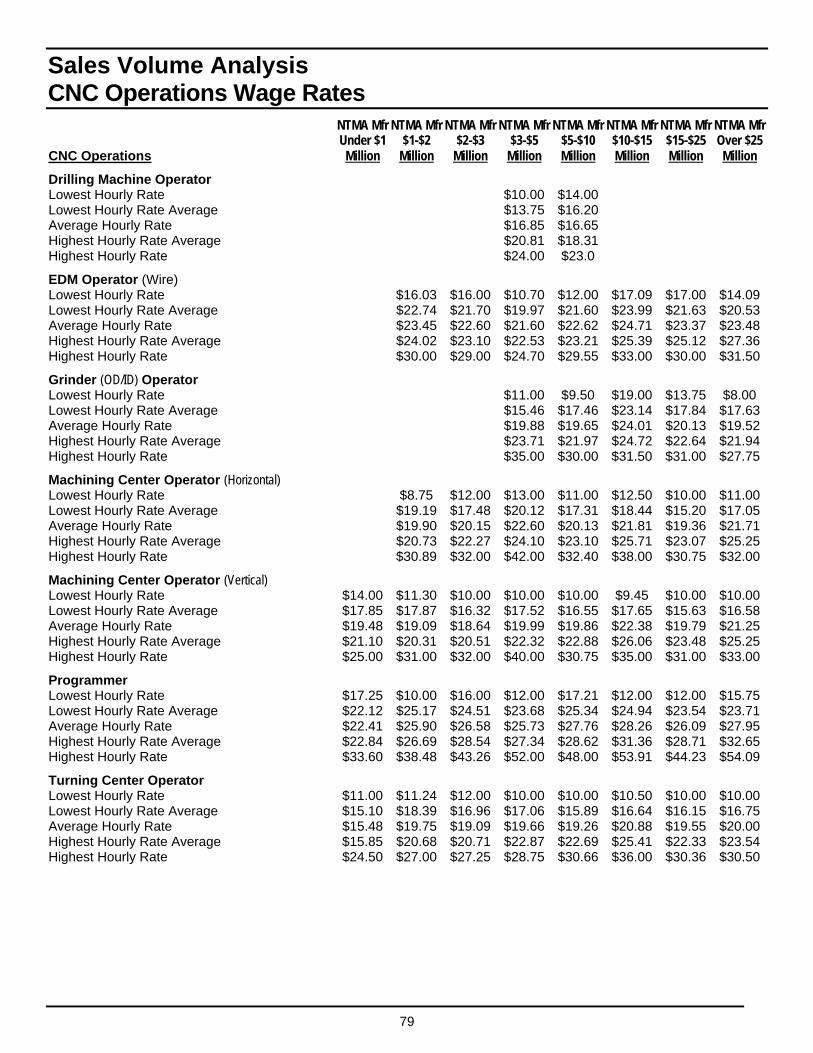
79
Sales Volume Analysis CNC Operations Wage Rates NTMA Mfr NTMA Mfr NTMA Mfr NTMA Mfr NTMA Mfr NTMA Mfr NTMA Mfr NTMA Mfr Under $1 $1-$2 $2-$3 $3-$5 $5-$10 $10-$15 $15-$25 Over $25 CNC Operations Million Million Million Million Million Million Million Million
Drilling Machine Operator Lowest Hourly Rate $10.00 $14.00 Lowest Hourly Rate Average $13.75 $16.20 Average Hourly Rate $16.85 $16.65 Highest Hourly Rate Average $20.81 $18.31 Highest Hourly Rate $24.00 $23.0
EDM Operator (Wire) Lowest Hourly Rate $16.03 $16.00 $10.70 $12.00 $17.09 $17.00 $14.09Lowest Hourly Rate Average $22.74 $21.70 $19.97 $21.60 $23.99 $21.63 $20.53Average Hourly Rate $23.45 $22.60 $21.60 $22.62 $24.71 $23.37 $23.48Highest Hourly Rate Average $24.02 $23.10 $22.53 $23.21 $25.39 $25.12 $27.36Highest Hourly Rate $30.00 $29.00 $24.70 $29.55 $33.00 $30.00 $31.50
Grinder (OD/ID) Operator Lowest Hourly Rate $11.00 $9.50 $19.00 $13.75 $8.00 Lowest Hourly Rate Average $15.46 $17.46 $23.14 $17.84 $17.63Average Hourly Rate $19.88 $19.65 $24.01 $20.13 $19.52Highest Hourly Rate Average $23.71 $21.97 $24.72 $22.64 $21.94Highest Hourly Rate $35.00 $30.00 $31.50 $31.00 $27.75
Machining Center Operator (Horizontal) Lowest Hourly Rate $8.75 $12.00 $13.00 $11.00 $12.50 $10.00 $11.00Lowest Hourly Rate Average $19.19 $17.48 $20.12 $17.31 $18.44 $15.20 $17.05Average Hourly Rate $19.90 $20.15 $22.60 $20.13 $21.81 $19.36 $21.71Highest Hourly Rate Average $20.73 $22.27 $24.10 $23.10 $25.71 $23.07 $25.25Highest Hourly Rate $30.89 $32.00 $42.00 $32.40 $38.00 $30.75 $32.00
Machining Center Operator (Vertical) Lowest Hourly Rate $14.00 $11.30 $10.00 $10.00 $10.00 $9.45 $10.00 $10.00Lowest Hourly Rate Average $17.85 $17.87 $16.32 $17.52 $16.55 $17.65 $15.63 $16.58Average Hourly Rate $19.48 $19.09 $18.64 $19.99 $19.86 $22.38 $19.79 $21.25Highest Hourly Rate Average $21.10 $20.31 $20.51 $22.32 $22.88 $26.06 $23.48 $25.25Highest Hourly Rate $25.00 $31.00 $32.00 $40.00 $30.75 $35.00 $31.00 $33.00
Programmer Lowest Hourly Rate $17.25 $10.00 $16.00 $12.00 $17.21 $12.00 $12.00 $15.75Lowest Hourly Rate Average $22.12 $25.17 $24.51 $23.68 $25.34 $24.94 $23.54 $23.71Average Hourly Rate $22.41 $25.90 $26.58 $25.73 $27.76 $28.26 $26.09 $27.95Highest Hourly Rate Average $22.84 $26.69 $28.54 $27.34 $28.62 $31.36 $28.71 $32.65Highest Hourly Rate $33.60 $38.48 $43.26 $52.00 $48.00 $53.91 $44.23 $54.09
Turning Center Operator Lowest Hourly Rate $11.00 $11.24 $12.00 $10.00 $10.00 $10.50 $10.00 $10.00Lowest Hourly Rate Average $15.10 $18.39 $16.96 $17.06 $15.89 $16.64 $16.15 $16.75Average Hourly Rate $15.48 $19.75 $19.09 $19.66 $19.26 $20.88 $19.55 $20.00Highest Hourly Rate Average $15.85 $20.68 $20.71 $22.87 $22.69 $25.41 $22.33 $23.54Highest Hourly Rate $24.50 $27.00 $27.25 $28.75 $30.66 $36.00 $30.36 $30.50
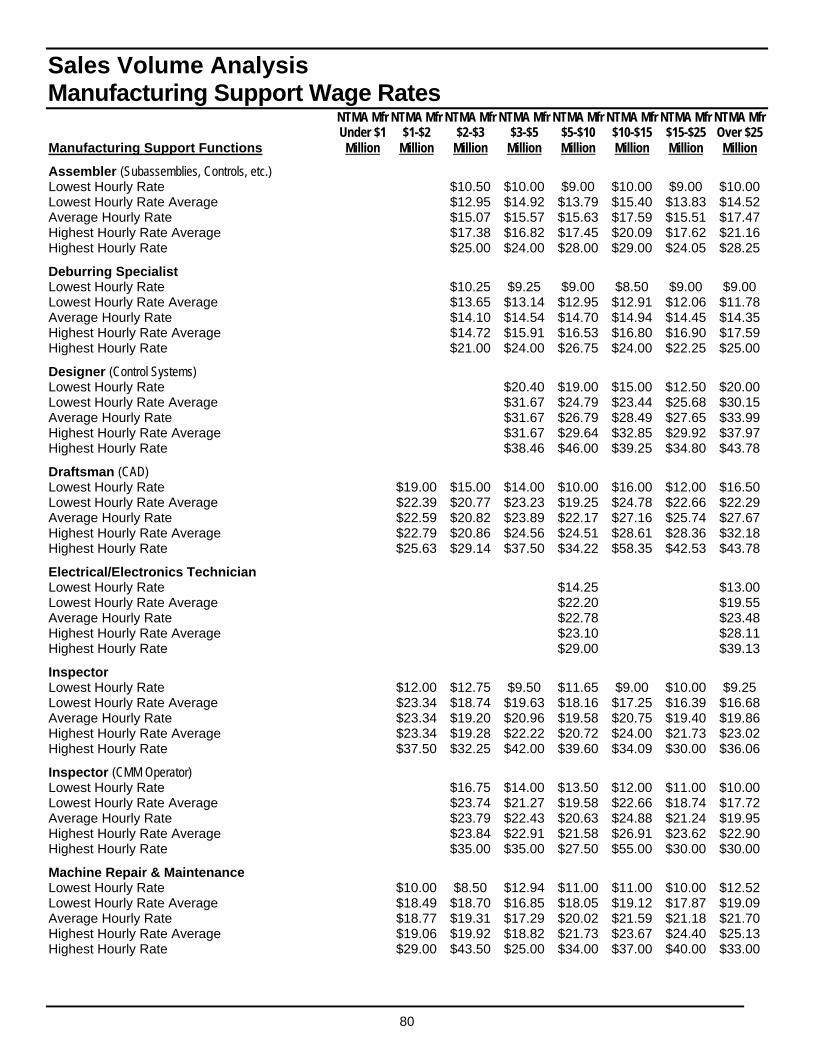
80
Sales Volume Analysis Manufacturing Support Wage Rates NTMA Mfr NTMA Mfr NTMA Mfr NTMA Mfr NTMA Mfr NTMA Mfr NTMA Mfr NTMA Mfr Under $1 $1-$2 $2-$3 $3-$5 $5-$10 $10-$15 $15-$25 Over $25 Manufacturing Support Functions Million Million Million Million Million Million Million Million
Assembler (Subassemblies, Controls, etc.) Lowest Hourly Rate $10.50 $10.00 $9.00 $10.00 $9.00 $10.00Lowest Hourly Rate Average $12.95 $14.92 $13.79 $15.40 $13.83 $14.52Average Hourly Rate $15.07 $15.57 $15.63 $17.59 $15.51 $17.47Highest Hourly Rate Average $17.38 $16.82 $17.45 $20.09 $17.62 $21.16Highest Hourly Rate $25.00 $24.00 $28.00 $29.00 $24.05 $28.25
Deburring Specialist Lowest Hourly Rate $10.25 $9.25 $9.00 $8.50 $9.00 $9.00 Lowest Hourly Rate Average $13.65 $13.14 $12.95 $12.91 $12.06 $11.78Average Hourly Rate $14.10 $14.54 $14.70 $14.94 $14.45 $14.35Highest Hourly Rate Average $14.72 $15.91 $16.53 $16.80 $16.90 $17.59Highest Hourly Rate $21.00 $24.00 $26.75 $24.00 $22.25 $25.00
Designer (Control Systems) Lowest Hourly Rate $20.40 $19.00 $15.00 $12.50 $20.00Lowest Hourly Rate Average $31.67 $24.79 $23.44 $25.68 $30.15Average Hourly Rate $31.67 $26.79 $28.49 $27.65 $33.99Highest Hourly Rate Average $31.67 $29.64 $32.85 $29.92 $37.97Highest Hourly Rate $38.46 $46.00 $39.25 $34.80 $43.78
Draftsman (CAD) Lowest Hourly Rate $19.00 $15.00 $14.00 $10.00 $16.00 $12.00 $16.50Lowest Hourly Rate Average $22.39 $20.77 $23.23 $19.25 $24.78 $22.66 $22.29Average Hourly Rate $22.59 $20.82 $23.89 $22.17 $27.16 $25.74 $27.67Highest Hourly Rate Average $22.79 $20.86 $24.56 $24.51 $28.61 $28.36 $32.18Highest Hourly Rate $25.63 $29.14 $37.50 $34.22 $58.35 $42.53 $43.78
Electrical/Electronics Technician Lowest Hourly Rate $14.25 $13.00Lowest Hourly Rate Average $22.20 $19.55Average Hourly Rate $22.78 $23.48Highest Hourly Rate Average $23.10 $28.11Highest Hourly Rate $29.00 $39.13
Inspector Lowest Hourly Rate $12.00 $12.75 $9.50 $11.65 $9.00 $10.00 $9.25 Lowest Hourly Rate Average $23.34 $18.74 $19.63 $18.16 $17.25 $16.39 $16.68Average Hourly Rate $23.34 $19.20 $20.96 $19.58 $20.75 $19.40 $19.86Highest Hourly Rate Average $23.34 $19.28 $22.22 $20.72 $24.00 $21.73 $23.02Highest Hourly Rate $37.50 $32.25 $42.00 $39.60 $34.09 $30.00 $36.06
Inspector (CMM Operator) Lowest Hourly Rate $16.75 $14.00 $13.50 $12.00 $11.00 $10.00Lowest Hourly Rate Average $23.74 $21.27 $19.58 $22.66 $18.74 $17.72Average Hourly Rate $23.79 $22.43 $20.63 $24.88 $21.24 $19.95Highest Hourly Rate Average $23.84 $22.91 $21.58 $26.91 $23.62 $22.90Highest Hourly Rate $35.00 $35.00 $27.50 $55.00 $30.00 $30.00
Machine Repair & Maintenance Lowest Hourly Rate $10.00 $8.50 $12.94 $11.00 $11.00 $10.00 $12.52Lowest Hourly Rate Average $18.49 $18.70 $16.85 $18.05 $19.12 $17.87 $19.09Average Hourly Rate $18.77 $19.31 $17.29 $20.02 $21.59 $21.18 $21.70Highest Hourly Rate Average $19.06 $19.92 $18.82 $21.73 $23.67 $24.40 $25.13Highest Hourly Rate $29.00 $43.50 $25.00 $34.00 $37.00 $40.00 $33.00
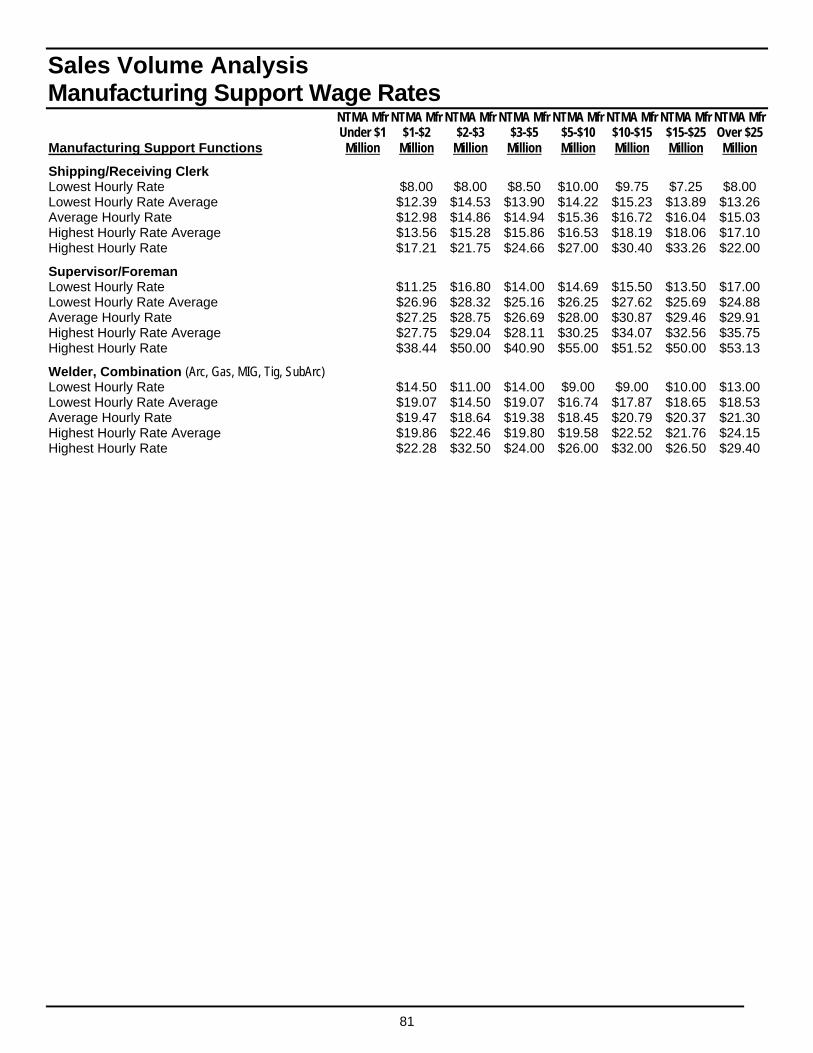
81
Sales Volume Analysis Manufacturing Support Wage Rates NTMA Mfr NTMA Mfr NTMA Mfr NTMA Mfr NTMA Mfr NTMA Mfr NTMA Mfr NTMA Mfr Under $1 $1-$2 $2-$3 $3-$5 $5-$10 $10-$15 $15-$25 Over $25 Manufacturing Support Functions Million Million Million Million Million Million Million Million
Shipping/Receiving Clerk Lowest Hourly Rate $8.00 $8.00 $8.50 $10.00 $9.75 $7.25 $8.00 Lowest Hourly Rate Average $12.39 $14.53 $13.90 $14.22 $15.23 $13.89 $13.26Average Hourly Rate $12.98 $14.86 $14.94 $15.36 $16.72 $16.04 $15.03Highest Hourly Rate Average $13.56 $15.28 $15.86 $16.53 $18.19 $18.06 $17.10Highest Hourly Rate $17.21 $21.75 $24.66 $27.00 $30.40 $33.26 $22.00
Supervisor/Foreman Lowest Hourly Rate $11.25 $16.80 $14.00 $14.69 $15.50 $13.50 $17.00Lowest Hourly Rate Average $26.96 $28.32 $25.16 $26.25 $27.62 $25.69 $24.88Average Hourly Rate $27.25 $28.75 $26.69 $28.00 $30.87 $29.46 $29.91Highest Hourly Rate Average $27.75 $29.04 $28.11 $30.25 $34.07 $32.56 $35.75Highest Hourly Rate $38.44 $50.00 $40.90 $55.00 $51.52 $50.00 $53.13
Welder, Combination (Arc, Gas, MIG, Tig, SubArc) Lowest Hourly Rate $14.50 $11.00 $14.00 $9.00 $9.00 $10.00 $13.00Lowest Hourly Rate Average $19.07 $14.50 $19.07 $16.74 $17.87 $18.65 $18.53Average Hourly Rate $19.47 $18.64 $19.38 $18.45 $20.79 $20.37 $21.30Highest Hourly Rate Average $19.86 $22.46 $19.80 $19.58 $22.52 $21.76 $24.15Highest Hourly Rate $22.28 $32.50 $24.00 $26.00 $32.00 $26.50 $29.40
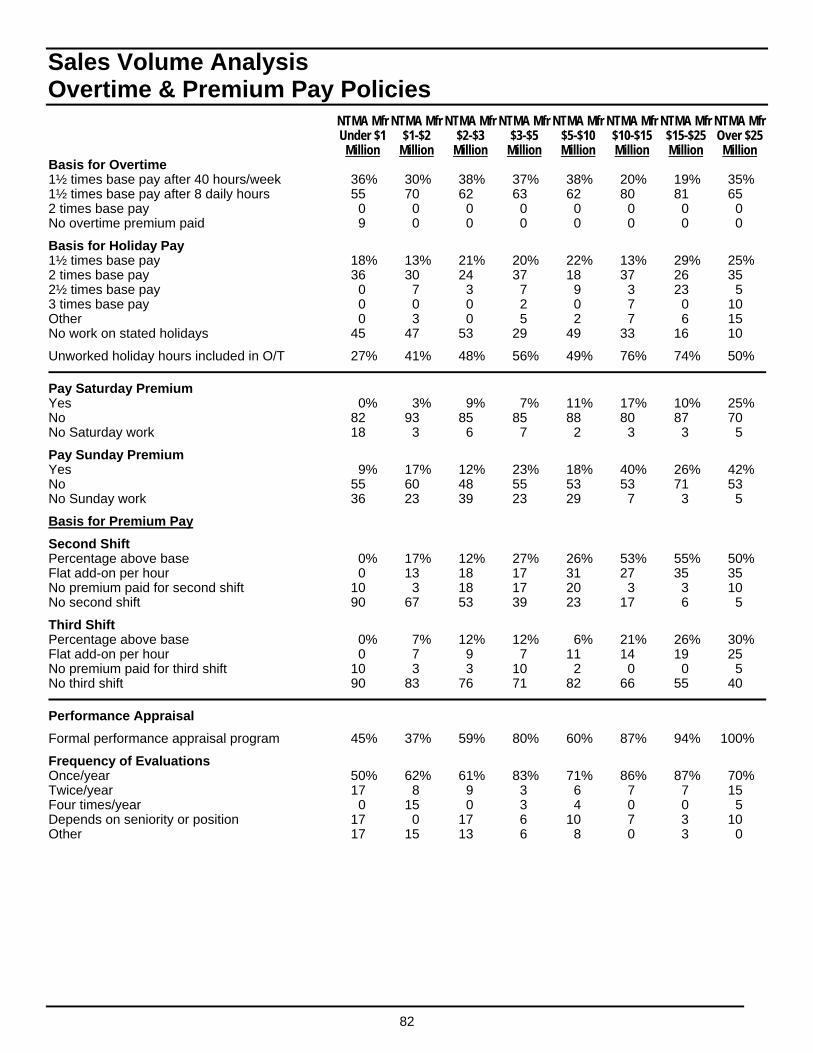
82
Sales Volume Analysis Overtime & Premium Pay Policies NTMA Mfr NTMA Mfr NTMA Mfr NTMA Mfr NTMA Mfr NTMA Mfr NTMA Mfr NTMA Mfr Under $1 $1-$2 $2-$3 $3-$5 $5-$10 $10-$15 $15-$25 Over $25 Million Million Million Million Million Million Million Million Basis for Overtime 1½ times base pay after 40 hours/week 36% 30% 38% 37% 38% 20% 19% 35% 1½ times base pay after 8 daily hours 55 70 62 63 62 80 81 65 2 times base pay 0 0 0 0 0 0 0 0 No overtime premium paid 9 0 0 0 0 0 0 0
Basis for Holiday Pay 1½ times base pay 18% 13% 21% 20% 22% 13% 29% 25% 2 times base pay 36 30 24 37 18 37 26 35 2½ times base pay 0 7 3 7 9 3 23 5 3 times base pay 0 0 0 2 0 7 0 10 Other 0 3 0 5 2 7 6 15 No work on stated holidays 45 47 53 29 49 33 16 10
Unworked holiday hours included in O/T 27% 41% 48% 56% 49% 76% 74% 50%
Pay Saturday Premium Yes 0% 3% 9% 7% 11% 17% 10% 25% No 82 93 85 85 88 80 87 70 No Saturday work 18 3 6 7 2 3 3 5
Pay Sunday Premium Yes 9% 17% 12% 23% 18% 40% 26% 42% No 55 60 48 55 53 53 71 53 No Sunday work 36 23 39 23 29 7 3 5
Basis for Premium Pay
Second Shift Percentage above base 0% 17% 12% 27% 26% 53% 55% 50% Flat add-on per hour 0 13 18 17 31 27 35 35 No premium paid for second shift 10 3 18 17 20 3 3 10 No second shift 90 67 53 39 23 17 6 5
Third Shift Percentage above base 0% 7% 12% 12% 6% 21% 26% 30% Flat add-on per hour 0 7 9 7 11 14 19 25 No premium paid for third shift 10 3 3 10 2 0 0 5 No third shift 90 83 76 71 82 66 55 40
Performance Appraisal
Formal performance appraisal program 45% 37% 59% 80% 60% 87% 94% 100%
Frequency of Evaluations Once/year 50% 62% 61% 83% 71% 86% 87% 70% Twice/year 17 8 9 3 6 7 7 15 Four times/year 0 15 0 3 4 0 0 5 Depends on seniority or position 17 0 17 6 10 7 3 10 Other 17 15 13 6 8 0 3 0
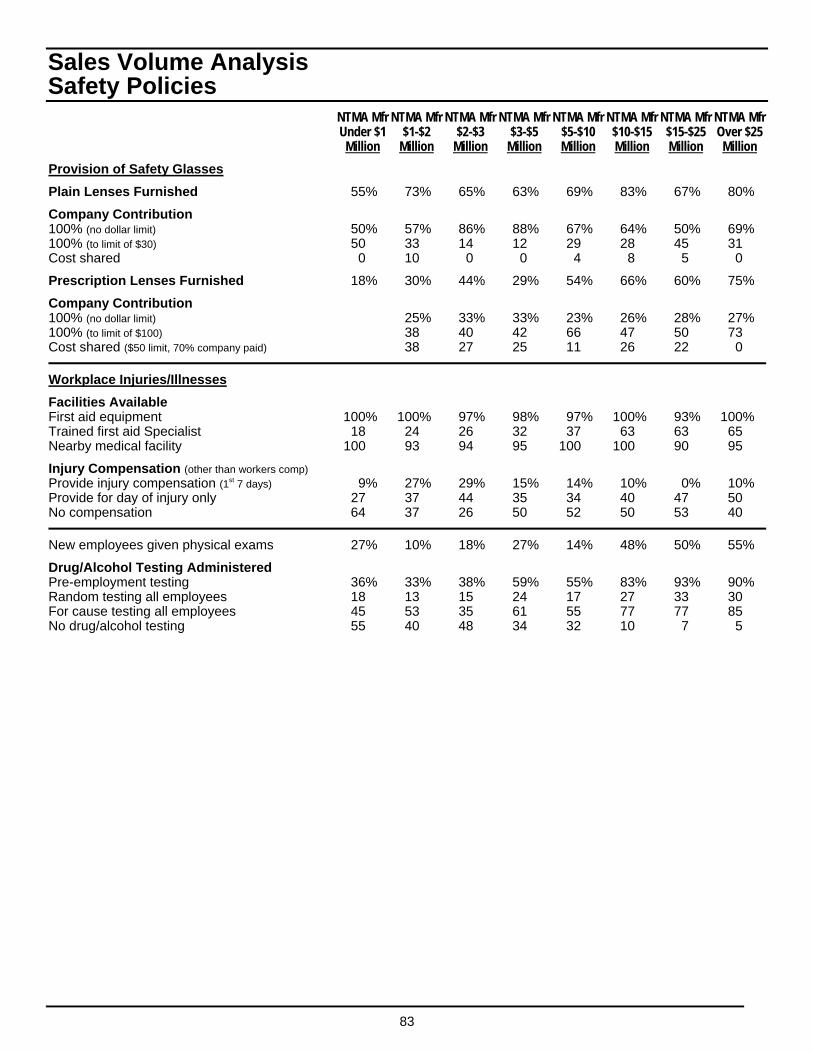
83
Sales Volume Analysis Safety Policies NTMA Mfr NTMA Mfr NTMA Mfr NTMA Mfr NTMA Mfr NTMA Mfr NTMA Mfr NTMA Mfr Under $1 $1-$2 $2-$3 $3-$5 $5-$10 $10-$15 $15-$25 Over $25 Million Million Million Million Million Million Million Million
Provision of Safety Glasses
Plain Lenses Furnished 55% 73% 65% 63% 69% 83% 67% 80%
Company Contribution 100% (no dollar limit) 50% 57% 86% 88% 67% 64% 50% 69% 100% (to limit of $30) 50 33 14 12 29 28 45 31 Cost shared 0 10 0 0 4 8 5 0
Prescription Lenses Furnished 18% 30% 44% 29% 54% 66% 60% 75%
Company Contribution 100% (no dollar limit) 25% 33% 33% 23% 26% 28% 27% 100% (to limit of $100) 38 40 42 66 47 50 73 Cost shared ($50 limit, 70% company paid) 38 27 25 11 26 22 0
Workplace Injuries/Illnesses
Facilities Available First aid equipment 100% 100% 97% 98% 97% 100% 93% 100% Trained first aid Specialist 18 24 26 32 37 63 63 65 Nearby medical facility 100 93 94 95 100 100 90 95
Injury Compensation (other than workers comp) Provide injury compensation (1st 7 days) 9% 27% 29% 15% 14% 10% 0% 10% Provide for day of injury only 27 37 44 35 34 40 47 50 No compensation 64 37 26 50 52 50 53 40
New employees given physical exams 27% 10% 18% 27% 14% 48% 50% 55%
Drug/Alcohol Testing Administered Pre-employment testing 36% 33% 38% 59% 55% 83% 93% 90% Random testing all employees 18 13 15 24 17 27 33 30 For cause testing all employees 45 53 35 61 55 77 77 85 No drug/alcohol testing 55 40 48 34 32 10 7 5
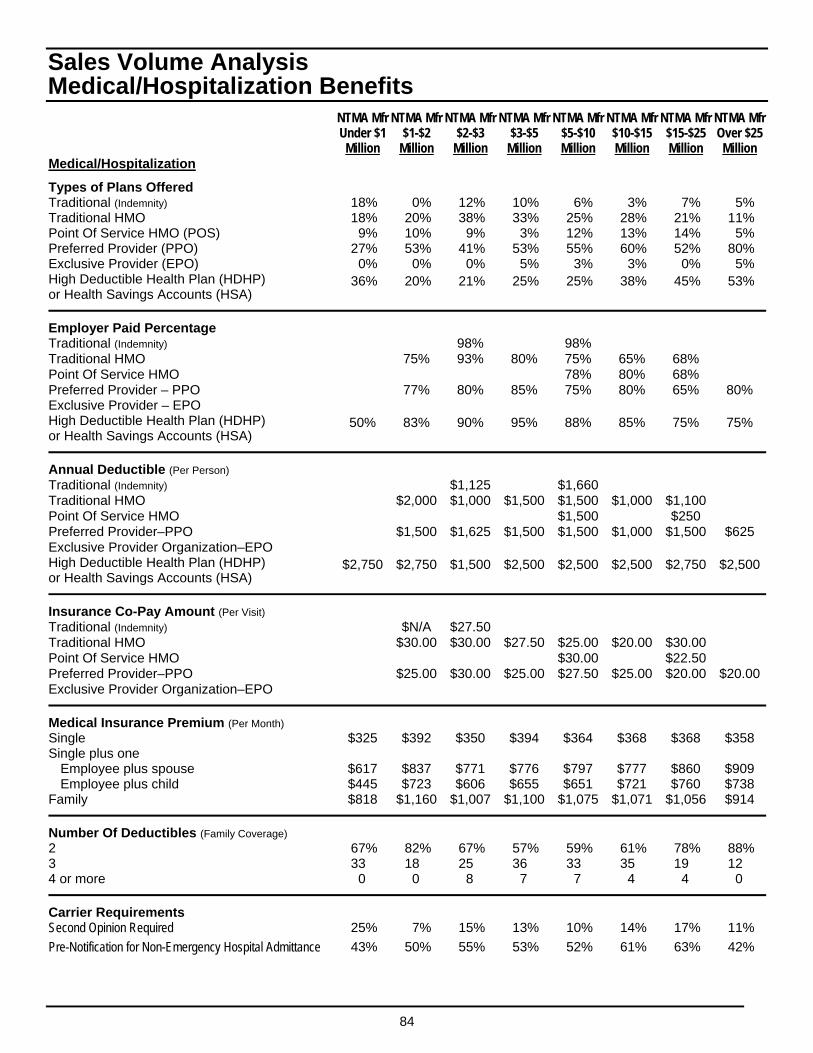
84
Sales Volume Analysis Medical/Hospitalization Benefits NTMA Mfr NTMA Mfr NTMA Mfr NTMA Mfr NTMA Mfr NTMA Mfr NTMA Mfr NTMA Mfr Under $1 $1-$2 $2-$3 $3-$5 $5-$10 $10-$15 $15-$25 Over $25 Million Million Million Million Million Million Million Million Medical/Hospitalization
Types of Plans Offered Traditional (Indemnity) 18% 0% 12% 10% 6% 3% 7% 5% Traditional HMO 18% 20% 38% 33% 25% 28% 21% 11% Point Of Service HMO (POS) 9% 10% 9% 3% 12% 13% 14% 5% Preferred Provider (PPO) 27% 53% 41% 53% 55% 60% 52% 80% Exclusive Provider (EPO) 0% 0% 0% 5% 3% 3% 0% 5% High Deductible Health Plan (HDHP) or Health Savings Accounts (HSA)
36% 20% 21% 25% 25% 38% 45% 53%
Employer Paid Percentage Traditional (Indemnity) 98% 98% Traditional HMO 75% 93% 80% 75% 65% 68% Point Of Service HMO 78% 80% 68% Preferred Provider – PPO 77% 80% 85% 75% 80% 65% 80% Exclusive Provider – EPO High Deductible Health Plan (HDHP) or Health Savings Accounts (HSA)
50% 83% 90% 95% 88% 85% 75% 75%
Annual Deductible (Per Person) Traditional (Indemnity) $1,125 $1,660 Traditional HMO $2,000 $1,000 $1,500 $1,500 $1,000 $1,100 Point Of Service HMO $1,500 $250 Preferred Provider–PPO $1,500 $1,625 $1,500 $1,500 $1,000 $1,500 $625 Exclusive Provider Organization–EPO High Deductible Health Plan (HDHP) or Health Savings Accounts (HSA)
$2,750 $2,750 $1,500 $2,500 $2,500 $2,500 $2,750 $2,500
Insurance Co-Pay Amount (Per Visit) Traditional (Indemnity) $N/A $27.50 Traditional HMO $30.00 $30.00 $27.50 $25.00 $20.00 $30.00 Point Of Service HMO $30.00 $22.50 Preferred Provider–PPO $25.00 $30.00 $25.00 $27.50 $25.00 $20.00 $20.00Exclusive Provider Organization–EPO
Medical Insurance Premium (Per Month) Single $325 $392 $350 $394 $364 $368 $368 $358 Single plus one
Employee plus spouse $617 $837 $771 $776 $797 $777 $860 $909 Employee plus child $445 $723 $606 $655 $651 $721 $760 $738
Family $818 $1,160 $1,007 $1,100 $1,075 $1,071 $1,056 $914
Number Of Deductibles (Family Coverage) 2 67% 82% 67% 57% 59% 61% 78% 88% 3 33 18 25 36 33 35 19 12 4 or more 0 0 8 7 7 4 4 0
Carrier Requirements Second Opinion Required 25% 7% 15% 13% 10% 14% 17% 11%
Pre-Notification for Non-Emergency Hospital Admittance 43% 50% 55% 53% 52% 61% 63% 42%
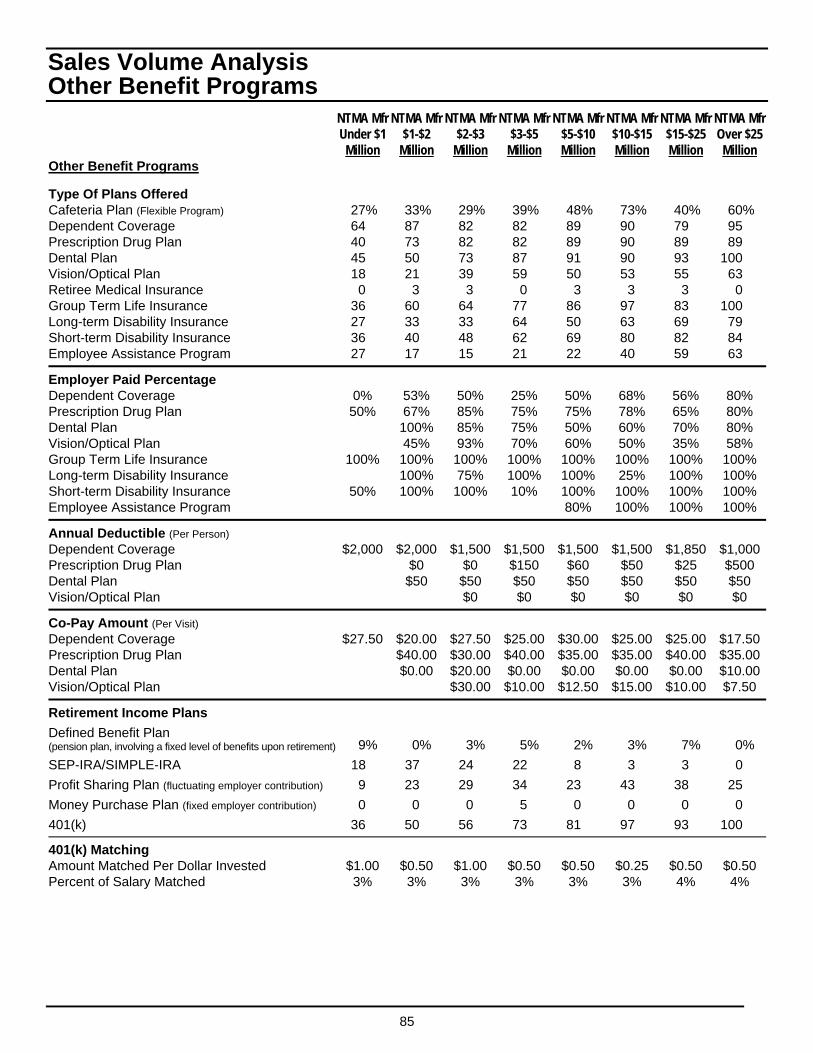
85
Sales Volume Analysis Other Benefit Programs NTMA Mfr NTMA Mfr NTMA Mfr NTMA Mfr NTMA Mfr NTMA Mfr NTMA Mfr NTMA Mfr Under $1 $1-$2 $2-$3 $3-$5 $5-$10 $10-$15 $15-$25 Over $25 Million Million Million Million Million Million Million Million Other Benefit Programs
Type Of Plans Offered Cafeteria Plan (Flexible Program) 27% 33% 29% 39% 48% 73% 40% 60% Dependent Coverage 64 87 82 82 89 90 79 95 Prescription Drug Plan 40 73 82 82 89 90 89 89 Dental Plan 45 50 73 87 91 90 93 100 Vision/Optical Plan 18 21 39 59 50 53 55 63 Retiree Medical Insurance 0 3 3 0 3 3 3 0 Group Term Life Insurance 36 60 64 77 86 97 83 100 Long-term Disability Insurance 27 33 33 64 50 63 69 79 Short-term Disability Insurance 36 40 48 62 69 80 82 84 Employee Assistance Program 27 17 15 21 22 40 59 63
Employer Paid Percentage Dependent Coverage 0% 53% 50% 25% 50% 68% 56% 80% Prescription Drug Plan 50% 67% 85% 75% 75% 78% 65% 80% Dental Plan 100% 85% 75% 50% 60% 70% 80% Vision/Optical Plan 45% 93% 70% 60% 50% 35% 58% Group Term Life Insurance 100% 100% 100% 100% 100% 100% 100% 100% Long-term Disability Insurance 100% 75% 100% 100% 25% 100% 100% Short-term Disability Insurance 50% 100% 100% 10% 100% 100% 100% 100% Employee Assistance Program 80% 100% 100% 100%
Annual Deductible (Per Person) Dependent Coverage $2,000 $2,000 $1,500 $1,500 $1,500 $1,500 $1,850 $1,000Prescription Drug Plan $0 $0 $150 $60 $50 $25 $500 Dental Plan $50 $50 $50 $50 $50 $50 $50 Vision/Optical Plan $0 $0 $0 $0 $0 $0
Co-Pay Amount (Per Visit) Dependent Coverage $27.50 $20.00 $27.50 $25.00 $30.00 $25.00 $25.00 $17.50Prescription Drug Plan $40.00 $30.00 $40.00 $35.00 $35.00 $40.00 $35.00Dental Plan $0.00 $20.00 $0.00 $0.00 $0.00 $0.00 $10.00Vision/Optical Plan $30.00 $10.00 $12.50 $15.00 $10.00 $7.50
Retirement Income Plans
Defined Benefit Plan (pension plan, involving a fixed level of benefits upon retirement) 9% 0% 3% 5% 2% 3% 7% 0%
SEP-IRA/SIMPLE-IRA 18 37 24 22 8 3 3 0
Profit Sharing Plan (fluctuating employer contribution) 9 23 29 34 23 43 38 25
Money Purchase Plan (fixed employer contribution) 0 0 0 5 0 0 0 0
401(k) 36 50 56 73 81 97 93 100
401(k) Matching Amount Matched Per Dollar Invested $1.00 $0.50 $1.00 $0.50 $0.50 $0.25 $0.50 $0.50 Percent of Salary Matched 3% 3% 3% 3% 3% 3% 4% 4%
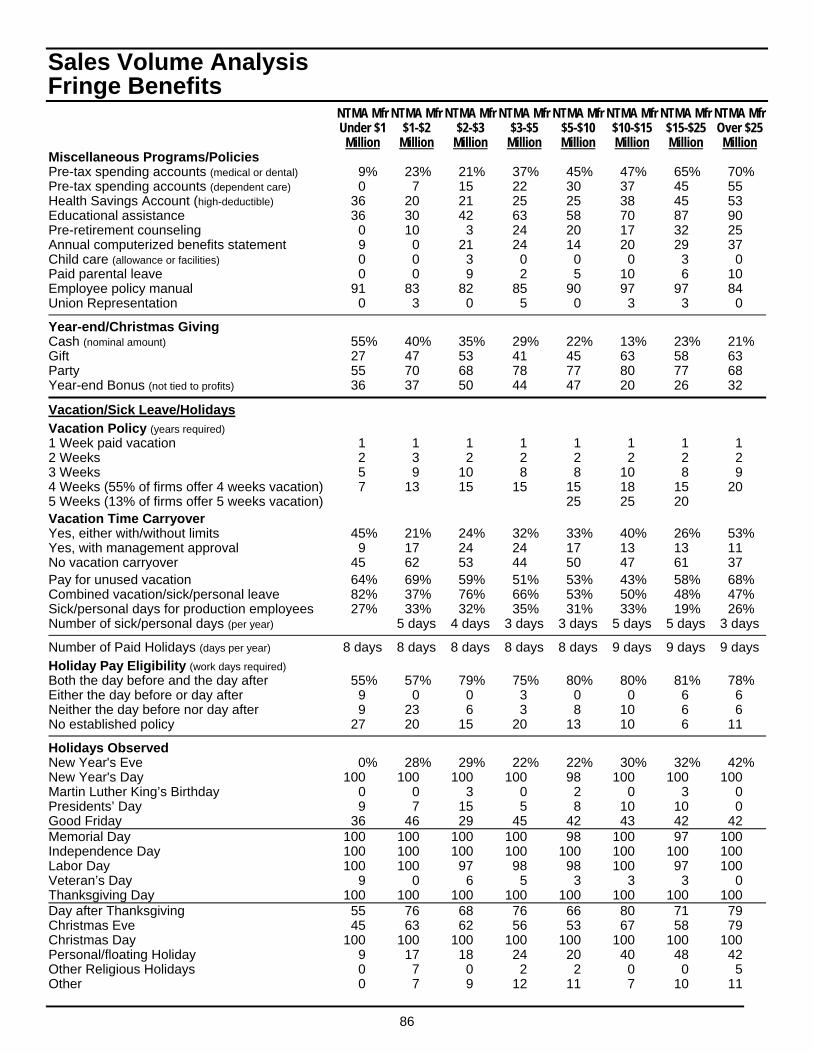
86
Sales Volume Analysis Fringe Benefits NTMA Mfr NTMA Mfr NTMA Mfr NTMA Mfr NTMA Mfr NTMA Mfr NTMA Mfr NTMA Mfr Under $1 $1-$2 $2-$3 $3-$5 $5-$10 $10-$15 $15-$25 Over $25 Million Million Million Million Million Million Million Million Miscellaneous Programs/Policies Pre-tax spending accounts (medical or dental) 9% 23% 21% 37% 45% 47% 65% 70% Pre-tax spending accounts (dependent care) 0 7 15 22 30 37 45 55 Health Savings Account (high-deductible) 36 20 21 25 25 38 45 53 Educational assistance 36 30 42 63 58 70 87 90 Pre-retirement counseling 0 10 3 24 20 17 32 25 Annual computerized benefits statement 9 0 21 24 14 20 29 37 Child care (allowance or facilities) 0 0 3 0 0 0 3 0 Paid parental leave 0 0 9 2 5 10 6 10 Employee policy manual 91 83 82 85 90 97 97 84 Union Representation 0 3 0 5 0 3 3 0
Year-end/Christmas Giving Cash (nominal amount) 55% 40% 35% 29% 22% 13% 23% 21% Gift 27 47 53 41 45 63 58 63 Party 55 70 68 78 77 80 77 68 Year-end Bonus (not tied to profits) 36 37 50 44 47 20 26 32
Vacation/Sick Leave/Holidays
Vacation Policy (years required) 1 Week paid vacation 1 1 1 1 1 1 1 1 2 Weeks 2 3 2 2 2 2 2 2 3 Weeks 5 9 10 8 8 10 8 9 4 Weeks (55% of firms offer 4 weeks vacation) 7 13 15 15 15 18 15 20 5 Weeks (13% of firms offer 5 weeks vacation) 25 25 20 Vacation Time Carryover Yes, either with/without limits 45% 21% 24% 32% 33% 40% 26% 53% Yes, with management approval 9 17 24 24 17 13 13 11 No vacation carryover 45 62 53 44 50 47 61 37 Pay for unused vacation 64% 69% 59% 51% 53% 43% 58% 68% Combined vacation/sick/personal leave 82% 37% 76% 66% 53% 50% 48% 47% Sick/personal days for production employees 27% 33% 32% 35% 31% 33% 19% 26% Number of sick/personal days (per year) 5 days 4 days 3 days 3 days 5 days 5 days 3 days
Number of Paid Holidays (days per year) 8 days 8 days 8 days 8 days 8 days 9 days 9 days 9 days
Holiday Pay Eligibility (work days required) Both the day before and the day after 55% 57% 79% 75% 80% 80% 81% 78% Either the day before or day after 9 0 0 3 0 0 6 6 Neither the day before nor day after 9 23 6 3 8 10 6 6 No established policy 27 20 15 20 13 10 6 11
Holidays Observed New Year's Eve 0% 28% 29% 22% 22% 30% 32% 42% New Year's Day 100 100 100 100 98 100 100 100 Martin Luther King’s Birthday 0 0 3 0 2 0 3 0 Presidents’ Day 9 7 15 5 8 10 10 0 Good Friday 36 46 29 45 42 43 42 42 Memorial Day 100 100 100 100 98 100 97 100 Independence Day 100 100 100 100 100 100 100 100 Labor Day 100 100 97 98 98 100 97 100 Veteran’s Day 9 0 6 5 3 3 3 0 Thanksgiving Day 100 100 100 100 100 100 100 100 Day after Thanksgiving 55 76 68 76 66 80 71 79 Christmas Eve 45 63 62 56 53 67 58 79 Christmas Day 100 100 100 100 100 100 100 100 Personal/floating Holiday 9 17 18 24 20 40 48 42 Other Religious Holidays 0 7 0 2 2 0 0 5 Other 0 7 9 12 11 7 10 11
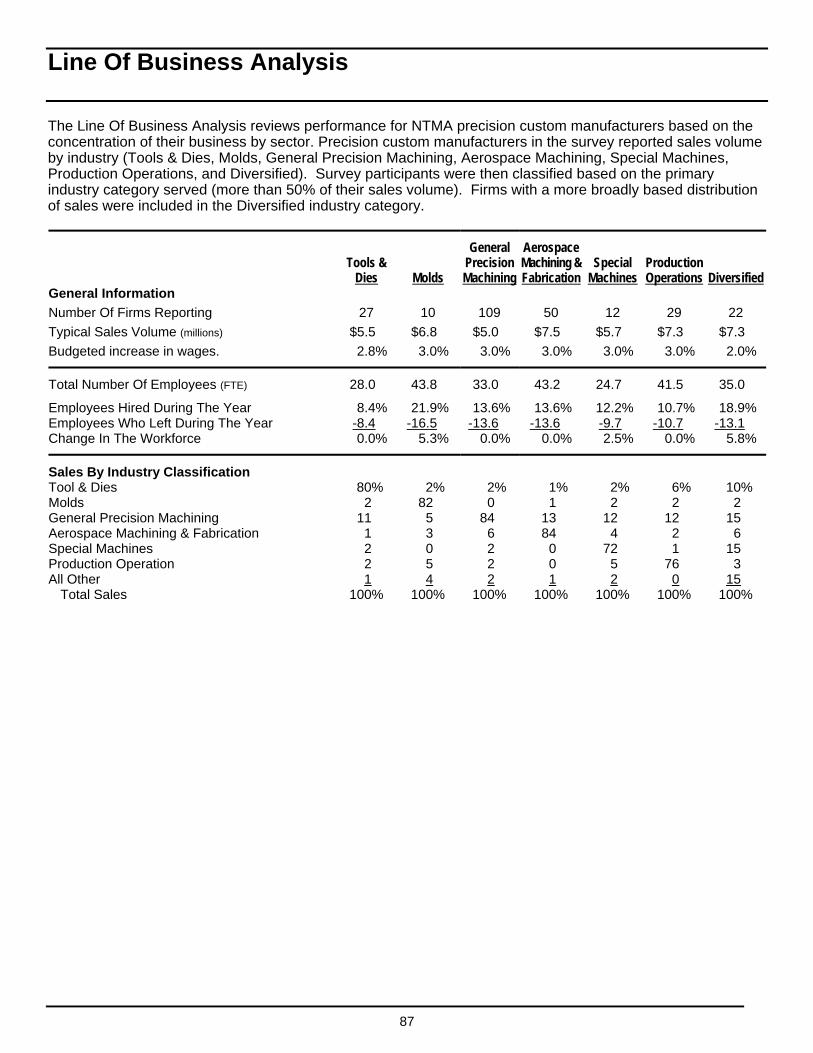
87
Line Of Business Analysis
The Line Of Business Analysis reviews performance for NTMA precision custom manufacturers based on the concentration of their business by sector. Precision custom manufacturers in the survey reported sales volume by industry (Tools & Dies, Molds, General Precision Machining, Aerospace Machining, Special Machines, Production Operations, and Diversified). Survey participants were then classified based on the primary industry category served (more than 50% of their sales volume). Firms with a more broadly based distribution of sales were included in the Diversified industry category.
General Aerospace Tools & Precision Machining & Special Production Dies Molds Machining Fabrication Machines Operations Diversified General Information
Number Of Firms Reporting 27 10 109 50 12 29 22
Typical Sales Volume (millions) $5.5 $6.8 $5.0 $7.5 $5.7 $7.3 $7.3
Budgeted increase in wages. 2.8% 3.0% 3.0% 3.0% 3.0% 3.0% 2.0%
Total Number Of Employees (FTE) 28.0 43.8 33.0 43.2 24.7 41.5 35.0
Employees Hired During The Year 8.4% 21.9% 13.6% 13.6% 12.2% 10.7% 18.9% Employees Who Left During The Year -8.4 -16.5 -13.6 -13.6 -9.7 -10.7 -13.1 Change In The Workforce 0.0% 5.3% 0.0% 0.0% 2.5% 0.0% 5.8%
Sales By Industry Classification Tool & Dies 80% 2% 2% 1% 2% 6% 10% Molds 2 82 0 1 2 2 2 General Precision Machining 11 5 84 13 12 12 15 Aerospace Machining & Fabrication 1 3 6 84 4 2 6 Special Machines 2 0 2 0 72 1 15 Production Operation 2 5 2 0 5 76 3 All Other 1 4 2 1 2 0 15
Total Sales 100% 100% 100% 100% 100% 100% 100%
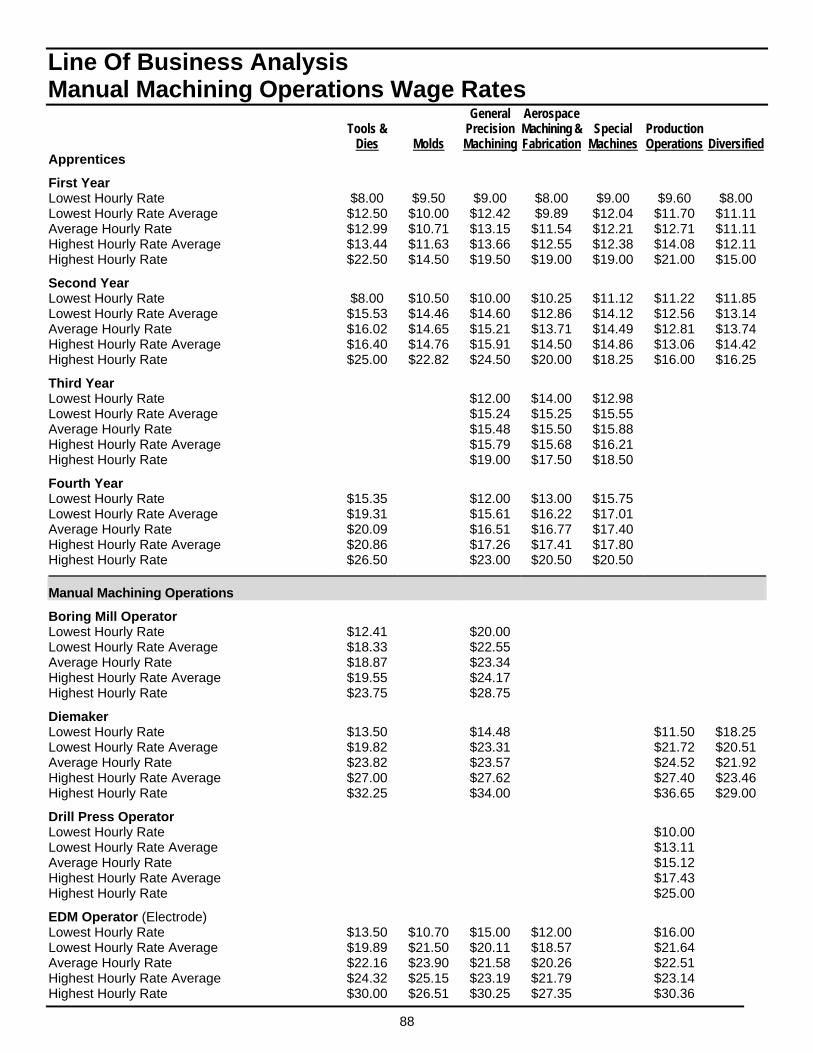
88
Line Of Business Analysis Manual Machining Operations Wage Rates General Aerospace Tools & Precision Machining & Special Production Dies Molds Machining Fabrication Machines Operations Diversified Apprentices
First Year Lowest Hourly Rate $8.00 $9.50 $9.00 $8.00 $9.00 $9.60 $8.00 Lowest Hourly Rate Average $12.50 $10.00 $12.42 $9.89 $12.04 $11.70 $11.11 Average Hourly Rate $12.99 $10.71 $13.15 $11.54 $12.21 $12.71 $11.11 Highest Hourly Rate Average $13.44 $11.63 $13.66 $12.55 $12.38 $14.08 $12.11 Highest Hourly Rate $22.50 $14.50 $19.50 $19.00 $19.00 $21.00 $15.00
Second Year Lowest Hourly Rate $8.00 $10.50 $10.00 $10.25 $11.12 $11.22 $11.85 Lowest Hourly Rate Average $15.53 $14.46 $14.60 $12.86 $14.12 $12.56 $13.14 Average Hourly Rate $16.02 $14.65 $15.21 $13.71 $14.49 $12.81 $13.74 Highest Hourly Rate Average $16.40 $14.76 $15.91 $14.50 $14.86 $13.06 $14.42 Highest Hourly Rate $25.00 $22.82 $24.50 $20.00 $18.25 $16.00 $16.25
Third Year Lowest Hourly Rate $12.00 $14.00 $12.98 Lowest Hourly Rate Average $15.24 $15.25 $15.55 Average Hourly Rate $15.48 $15.50 $15.88 Highest Hourly Rate Average $15.79 $15.68 $16.21 Highest Hourly Rate $19.00 $17.50 $18.50
Fourth Year Lowest Hourly Rate $15.35 $12.00 $13.00 $15.75 Lowest Hourly Rate Average $19.31 $15.61 $16.22 $17.01 Average Hourly Rate $20.09 $16.51 $16.77 $17.40 Highest Hourly Rate Average $20.86 $17.26 $17.41 $17.80 Highest Hourly Rate $26.50 $23.00 $20.50 $20.50
Manual Machining Operations
Boring Mill Operator Lowest Hourly Rate $12.41 $20.00 Lowest Hourly Rate Average $18.33 $22.55 Average Hourly Rate $18.87 $23.34 Highest Hourly Rate Average $19.55 $24.17 Highest Hourly Rate $23.75 $28.75
Diemaker Lowest Hourly Rate $13.50 $14.48 $11.50 $18.25 Lowest Hourly Rate Average $19.82 $23.31 $21.72 $20.51 Average Hourly Rate $23.82 $23.57 $24.52 $21.92 Highest Hourly Rate Average $27.00 $27.62 $27.40 $23.46 Highest Hourly Rate $32.25 $34.00 $36.65 $29.00
Drill Press Operator Lowest Hourly Rate $10.00 Lowest Hourly Rate Average $13.11 Average Hourly Rate $15.12 Highest Hourly Rate Average $17.43 Highest Hourly Rate $25.00
EDM Operator (Electrode) Lowest Hourly Rate $13.50 $10.70 $15.00 $12.00 $16.00 Lowest Hourly Rate Average $19.89 $21.50 $20.11 $18.57 $21.64 Average Hourly Rate $22.16 $23.90 $21.58 $20.26 $22.51 Highest Hourly Rate Average $24.32 $25.15 $23.19 $21.79 $23.14 Highest Hourly Rate $30.00 $26.51 $30.25 $27.35 $30.36
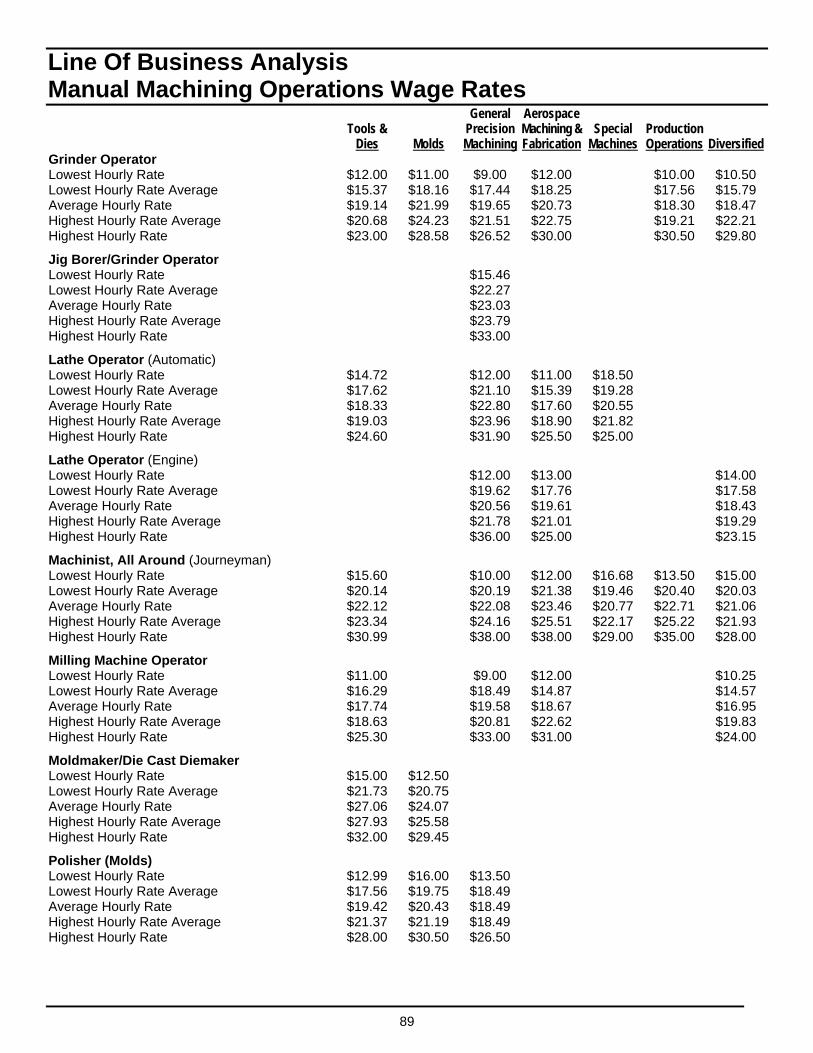
89
Line Of Business Analysis Manual Machining Operations Wage Rates General Aerospace Tools & Precision Machining & Special Production Dies Molds Machining Fabrication Machines Operations Diversified Grinder Operator Lowest Hourly Rate $12.00 $11.00 $9.00 $12.00 $10.00 $10.50 Lowest Hourly Rate Average $15.37 $18.16 $17.44 $18.25 $17.56 $15.79 Average Hourly Rate $19.14 $21.99 $19.65 $20.73 $18.30 $18.47 Highest Hourly Rate Average $20.68 $24.23 $21.51 $22.75 $19.21 $22.21 Highest Hourly Rate $23.00 $28.58 $26.52 $30.00 $30.50 $29.80
Jig Borer/Grinder Operator Lowest Hourly Rate $15.46 Lowest Hourly Rate Average $22.27 Average Hourly Rate $23.03 Highest Hourly Rate Average $23.79 Highest Hourly Rate $33.00
Lathe Operator (Automatic) Lowest Hourly Rate $14.72 $12.00 $11.00 $18.50 Lowest Hourly Rate Average $17.62 $21.10 $15.39 $19.28 Average Hourly Rate $18.33 $22.80 $17.60 $20.55 Highest Hourly Rate Average $19.03 $23.96 $18.90 $21.82 Highest Hourly Rate $24.60 $31.90 $25.50 $25.00
Lathe Operator (Engine) Lowest Hourly Rate $12.00 $13.00 $14.00 Lowest Hourly Rate Average $19.62 $17.76 $17.58 Average Hourly Rate $20.56 $19.61 $18.43 Highest Hourly Rate Average $21.78 $21.01 $19.29 Highest Hourly Rate $36.00 $25.00 $23.15
Machinist, All Around (Journeyman) Lowest Hourly Rate $15.60 $10.00 $12.00 $16.68 $13.50 $15.00 Lowest Hourly Rate Average $20.14 $20.19 $21.38 $19.46 $20.40 $20.03 Average Hourly Rate $22.12 $22.08 $23.46 $20.77 $22.71 $21.06 Highest Hourly Rate Average $23.34 $24.16 $25.51 $22.17 $25.22 $21.93 Highest Hourly Rate $30.99 $38.00 $38.00 $29.00 $35.00 $28.00
Milling Machine Operator Lowest Hourly Rate $11.00 $9.00 $12.00 $10.25 Lowest Hourly Rate Average $16.29 $18.49 $14.87 $14.57 Average Hourly Rate $17.74 $19.58 $18.67 $16.95 Highest Hourly Rate Average $18.63 $20.81 $22.62 $19.83 Highest Hourly Rate $25.30 $33.00 $31.00 $24.00
Moldmaker/Die Cast Diemaker Lowest Hourly Rate $15.00 $12.50 Lowest Hourly Rate Average $21.73 $20.75 Average Hourly Rate $27.06 $24.07 Highest Hourly Rate Average $27.93 $25.58 Highest Hourly Rate $32.00 $29.45
Polisher (Molds) Lowest Hourly Rate $12.99 $16.00 $13.50 Lowest Hourly Rate Average $17.56 $19.75 $18.49 Average Hourly Rate $19.42 $20.43 $18.49 Highest Hourly Rate Average $21.37 $21.19 $18.49 Highest Hourly Rate $28.00 $30.50 $26.50
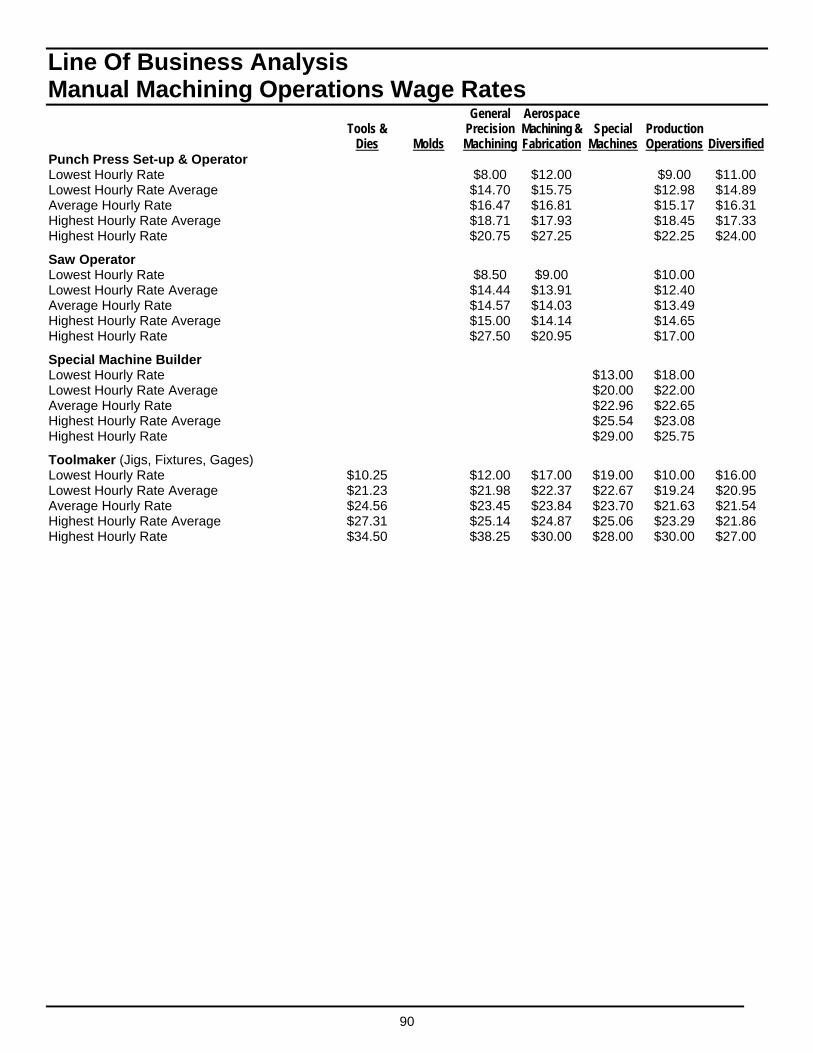
90
Line Of Business Analysis Manual Machining Operations Wage Rates General Aerospace Tools & Precision Machining & Special Production Dies Molds Machining Fabrication Machines Operations Diversified Punch Press Set-up & Operator Lowest Hourly Rate $8.00 $12.00 $9.00 $11.00 Lowest Hourly Rate Average $14.70 $15.75 $12.98 $14.89 Average Hourly Rate $16.47 $16.81 $15.17 $16.31 Highest Hourly Rate Average $18.71 $17.93 $18.45 $17.33 Highest Hourly Rate $20.75 $27.25 $22.25 $24.00
Saw Operator Lowest Hourly Rate $8.50 $9.00 $10.00 Lowest Hourly Rate Average $14.44 $13.91 $12.40 Average Hourly Rate $14.57 $14.03 $13.49 Highest Hourly Rate Average $15.00 $14.14 $14.65 Highest Hourly Rate $27.50 $20.95 $17.00
Special Machine Builder Lowest Hourly Rate $13.00 $18.00 Lowest Hourly Rate Average $20.00 $22.00 Average Hourly Rate $22.96 $22.65 Highest Hourly Rate Average $25.54 $23.08 Highest Hourly Rate $29.00 $25.75
Toolmaker (Jigs, Fixtures, Gages) Lowest Hourly Rate $10.25 $12.00 $17.00 $19.00 $10.00 $16.00 Lowest Hourly Rate Average $21.23 $21.98 $22.37 $22.67 $19.24 $20.95 Average Hourly Rate $24.56 $23.45 $23.84 $23.70 $21.63 $21.54 Highest Hourly Rate Average $27.31 $25.14 $24.87 $25.06 $23.29 $21.86 Highest Hourly Rate $34.50 $38.25 $30.00 $28.00 $30.00 $27.00
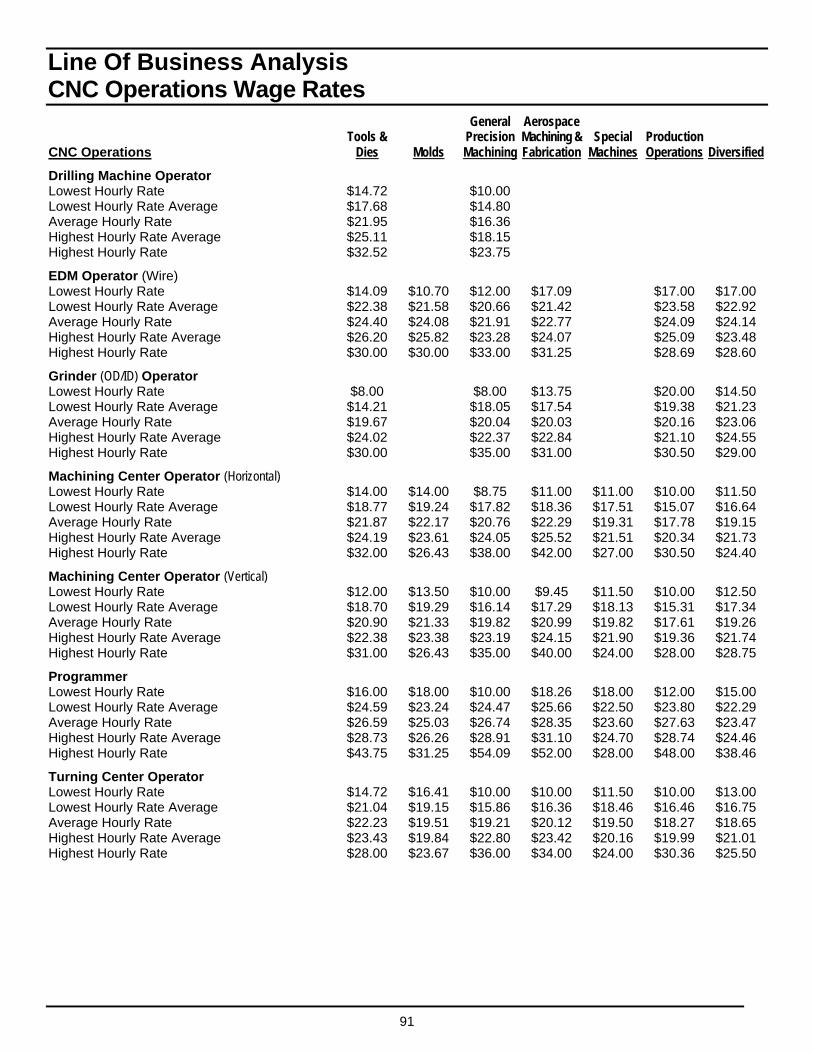
91
Line Of Business Analysis CNC Operations Wage Rates General Aerospace Tools & Precision Machining & Special Production CNC Operations Dies Molds Machining Fabrication Machines Operations Diversified
Drilling Machine Operator Lowest Hourly Rate $14.72 $10.00 Lowest Hourly Rate Average $17.68 $14.80 Average Hourly Rate $21.95 $16.36 Highest Hourly Rate Average $25.11 $18.15 Highest Hourly Rate $32.52 $23.75
EDM Operator (Wire) Lowest Hourly Rate $14.09 $10.70 $12.00 $17.09 $17.00 $17.00 Lowest Hourly Rate Average $22.38 $21.58 $20.66 $21.42 $23.58 $22.92 Average Hourly Rate $24.40 $24.08 $21.91 $22.77 $24.09 $24.14 Highest Hourly Rate Average $26.20 $25.82 $23.28 $24.07 $25.09 $23.48 Highest Hourly Rate $30.00 $30.00 $33.00 $31.25 $28.69 $28.60
Grinder (OD/ID) Operator Lowest Hourly Rate $8.00 $8.00 $13.75 $20.00 $14.50 Lowest Hourly Rate Average $14.21 $18.05 $17.54 $19.38 $21.23 Average Hourly Rate $19.67 $20.04 $20.03 $20.16 $23.06 Highest Hourly Rate Average $24.02 $22.37 $22.84 $21.10 $24.55 Highest Hourly Rate $30.00 $35.00 $31.00 $30.50 $29.00
Machining Center Operator (Horizontal) Lowest Hourly Rate $14.00 $14.00 $8.75 $11.00 $11.00 $10.00 $11.50 Lowest Hourly Rate Average $18.77 $19.24 $17.82 $18.36 $17.51 $15.07 $16.64 Average Hourly Rate $21.87 $22.17 $20.76 $22.29 $19.31 $17.78 $19.15 Highest Hourly Rate Average $24.19 $23.61 $24.05 $25.52 $21.51 $20.34 $21.73 Highest Hourly Rate $32.00 $26.43 $38.00 $42.00 $27.00 $30.50 $24.40
Machining Center Operator (Vertical) Lowest Hourly Rate $12.00 $13.50 $10.00 $9.45 $11.50 $10.00 $12.50 Lowest Hourly Rate Average $18.70 $19.29 $16.14 $17.29 $18.13 $15.31 $17.34 Average Hourly Rate $20.90 $21.33 $19.82 $20.99 $19.82 $17.61 $19.26 Highest Hourly Rate Average $22.38 $23.38 $23.19 $24.15 $21.90 $19.36 $21.74 Highest Hourly Rate $31.00 $26.43 $35.00 $40.00 $24.00 $28.00 $28.75
Programmer Lowest Hourly Rate $16.00 $18.00 $10.00 $18.26 $18.00 $12.00 $15.00 Lowest Hourly Rate Average $24.59 $23.24 $24.47 $25.66 $22.50 $23.80 $22.29 Average Hourly Rate $26.59 $25.03 $26.74 $28.35 $23.60 $27.63 $23.47 Highest Hourly Rate Average $28.73 $26.26 $28.91 $31.10 $24.70 $28.74 $24.46 Highest Hourly Rate $43.75 $31.25 $54.09 $52.00 $28.00 $48.00 $38.46
Turning Center Operator Lowest Hourly Rate $14.72 $16.41 $10.00 $10.00 $11.50 $10.00 $13.00 Lowest Hourly Rate Average $21.04 $19.15 $15.86 $16.36 $18.46 $16.46 $16.75 Average Hourly Rate $22.23 $19.51 $19.21 $20.12 $19.50 $18.27 $18.65 Highest Hourly Rate Average $23.43 $19.84 $22.80 $23.42 $20.16 $19.99 $21.01 Highest Hourly Rate $28.00 $23.67 $36.00 $34.00 $24.00 $30.36 $25.50
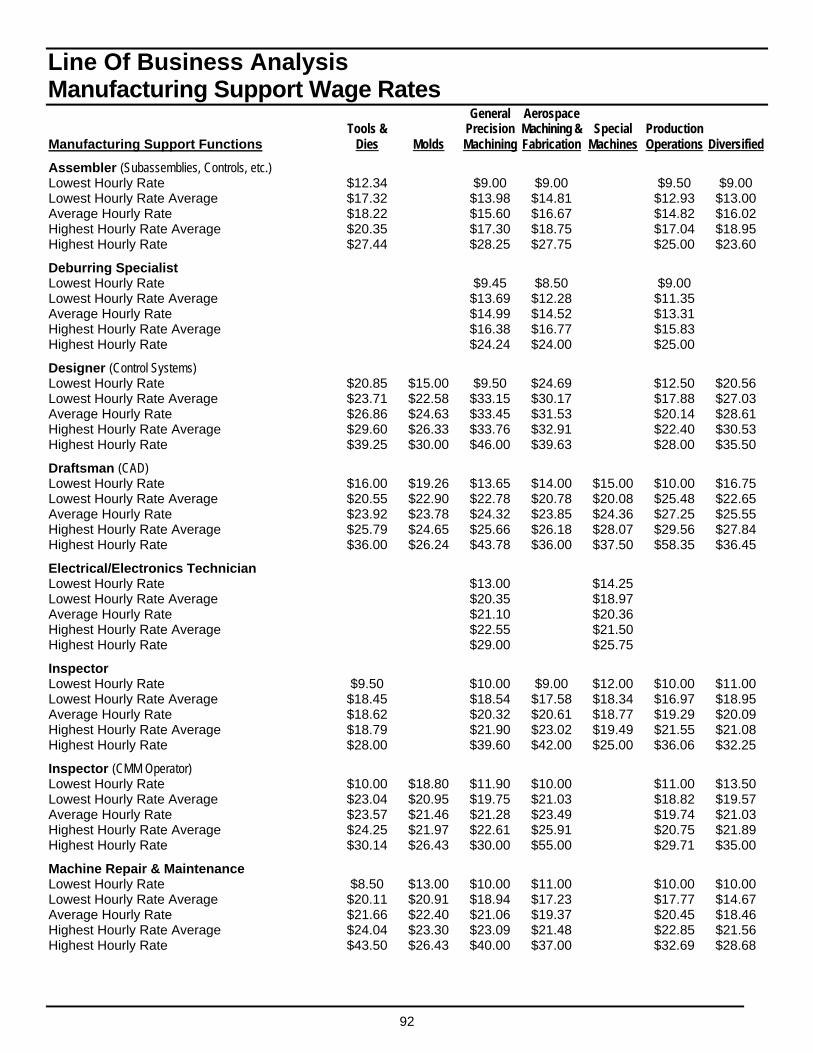
92
Line Of Business Analysis Manufacturing Support Wage Rates General Aerospace Tools & Precision Machining & Special Production Manufacturing Support Functions Dies Molds Machining Fabrication Machines Operations Diversified
Assembler (Subassemblies, Controls, etc.) Lowest Hourly Rate $12.34 $9.00 $9.00 $9.50 $9.00 Lowest Hourly Rate Average $17.32 $13.98 $14.81 $12.93 $13.00 Average Hourly Rate $18.22 $15.60 $16.67 $14.82 $16.02 Highest Hourly Rate Average $20.35 $17.30 $18.75 $17.04 $18.95 Highest Hourly Rate $27.44 $28.25 $27.75 $25.00 $23.60
Deburring Specialist Lowest Hourly Rate $9.45 $8.50 $9.00 Lowest Hourly Rate Average $13.69 $12.28 $11.35 Average Hourly Rate $14.99 $14.52 $13.31 Highest Hourly Rate Average $16.38 $16.77 $15.83 Highest Hourly Rate $24.24 $24.00 $25.00
Designer (Control Systems) Lowest Hourly Rate $20.85 $15.00 $9.50 $24.69 $12.50 $20.56 Lowest Hourly Rate Average $23.71 $22.58 $33.15 $30.17 $17.88 $27.03 Average Hourly Rate $26.86 $24.63 $33.45 $31.53 $20.14 $28.61 Highest Hourly Rate Average $29.60 $26.33 $33.76 $32.91 $22.40 $30.53 Highest Hourly Rate $39.25 $30.00 $46.00 $39.63 $28.00 $35.50
Draftsman (CAD) Lowest Hourly Rate $16.00 $19.26 $13.65 $14.00 $15.00 $10.00 $16.75 Lowest Hourly Rate Average $20.55 $22.90 $22.78 $20.78 $20.08 $25.48 $22.65 Average Hourly Rate $23.92 $23.78 $24.32 $23.85 $24.36 $27.25 $25.55 Highest Hourly Rate Average $25.79 $24.65 $25.66 $26.18 $28.07 $29.56 $27.84 Highest Hourly Rate $36.00 $26.24 $43.78 $36.00 $37.50 $58.35 $36.45
Electrical/Electronics Technician Lowest Hourly Rate $13.00 $14.25 Lowest Hourly Rate Average $20.35 $18.97 Average Hourly Rate $21.10 $20.36 Highest Hourly Rate Average $22.55 $21.50 Highest Hourly Rate $29.00 $25.75
Inspector Lowest Hourly Rate $9.50 $10.00 $9.00 $12.00 $10.00 $11.00 Lowest Hourly Rate Average $18.45 $18.54 $17.58 $18.34 $16.97 $18.95 Average Hourly Rate $18.62 $20.32 $20.61 $18.77 $19.29 $20.09 Highest Hourly Rate Average $18.79 $21.90 $23.02 $19.49 $21.55 $21.08 Highest Hourly Rate $28.00 $39.60 $42.00 $25.00 $36.06 $32.25
Inspector (CMM Operator) Lowest Hourly Rate $10.00 $18.80 $11.90 $10.00 $11.00 $13.50 Lowest Hourly Rate Average $23.04 $20.95 $19.75 $21.03 $18.82 $19.57 Average Hourly Rate $23.57 $21.46 $21.28 $23.49 $19.74 $21.03 Highest Hourly Rate Average $24.25 $21.97 $22.61 $25.91 $20.75 $21.89 Highest Hourly Rate $30.14 $26.43 $30.00 $55.00 $29.71 $35.00
Machine Repair & Maintenance Lowest Hourly Rate $8.50 $13.00 $10.00 $11.00 $10.00 $10.00 Lowest Hourly Rate Average $20.11 $20.91 $18.94 $17.23 $17.77 $14.67 Average Hourly Rate $21.66 $22.40 $21.06 $19.37 $20.45 $18.46 Highest Hourly Rate Average $24.04 $23.30 $23.09 $21.48 $22.85 $21.56 Highest Hourly Rate $43.50 $26.43 $40.00 $37.00 $32.69 $28.68
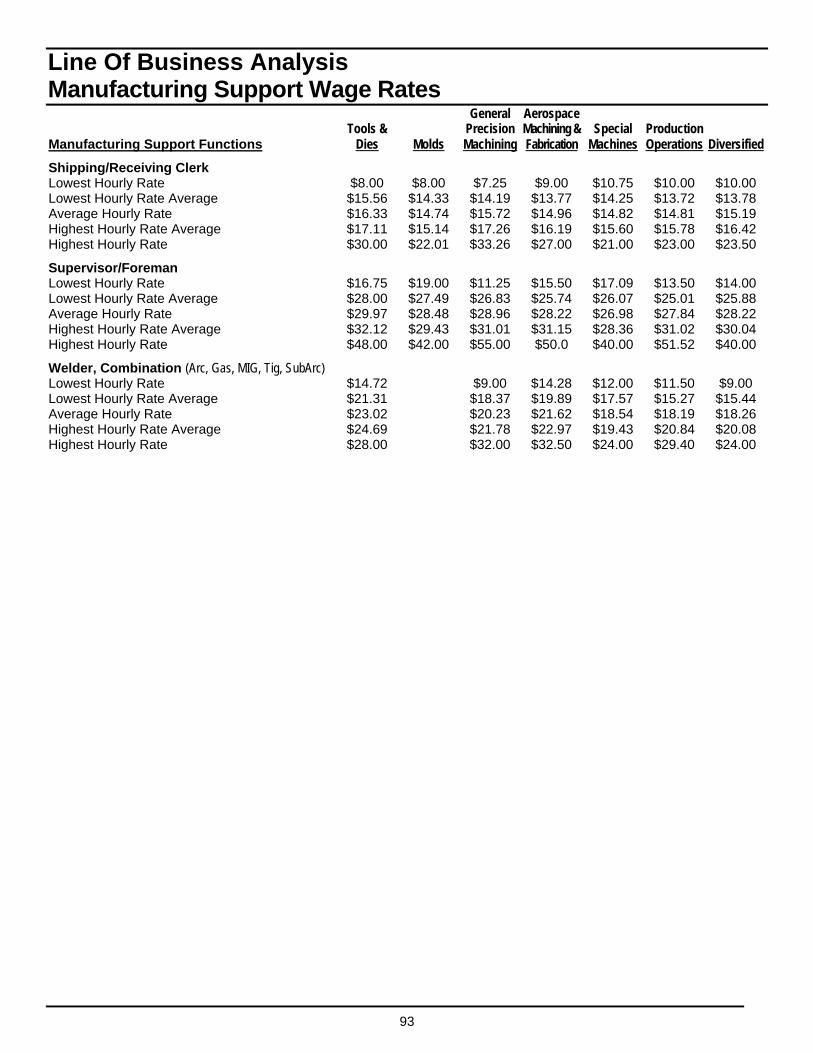
93
Line Of Business Analysis Manufacturing Support Wage Rates General Aerospace Tools & Precision Machining & Special Production Manufacturing Support Functions Dies Molds Machining Fabrication Machines Operations Diversified
Shipping/Receiving Clerk Lowest Hourly Rate $8.00 $8.00 $7.25 $9.00 $10.75 $10.00 $10.00 Lowest Hourly Rate Average $15.56 $14.33 $14.19 $13.77 $14.25 $13.72 $13.78 Average Hourly Rate $16.33 $14.74 $15.72 $14.96 $14.82 $14.81 $15.19 Highest Hourly Rate Average $17.11 $15.14 $17.26 $16.19 $15.60 $15.78 $16.42 Highest Hourly Rate $30.00 $22.01 $33.26 $27.00 $21.00 $23.00 $23.50
Supervisor/Foreman Lowest Hourly Rate $16.75 $19.00 $11.25 $15.50 $17.09 $13.50 $14.00 Lowest Hourly Rate Average $28.00 $27.49 $26.83 $25.74 $26.07 $25.01 $25.88 Average Hourly Rate $29.97 $28.48 $28.96 $28.22 $26.98 $27.84 $28.22 Highest Hourly Rate Average $32.12 $29.43 $31.01 $31.15 $28.36 $31.02 $30.04 Highest Hourly Rate $48.00 $42.00 $55.00 $50.0 $40.00 $51.52 $40.00
Welder, Combination (Arc, Gas, MIG, Tig, SubArc) Lowest Hourly Rate $14.72 $9.00 $14.28 $12.00 $11.50 $9.00 Lowest Hourly Rate Average $21.31 $18.37 $19.89 $17.57 $15.27 $15.44 Average Hourly Rate $23.02 $20.23 $21.62 $18.54 $18.19 $18.26 Highest Hourly Rate Average $24.69 $21.78 $22.97 $19.43 $20.84 $20.08 Highest Hourly Rate $28.00 $32.00 $32.50 $24.00 $29.40 $24.00
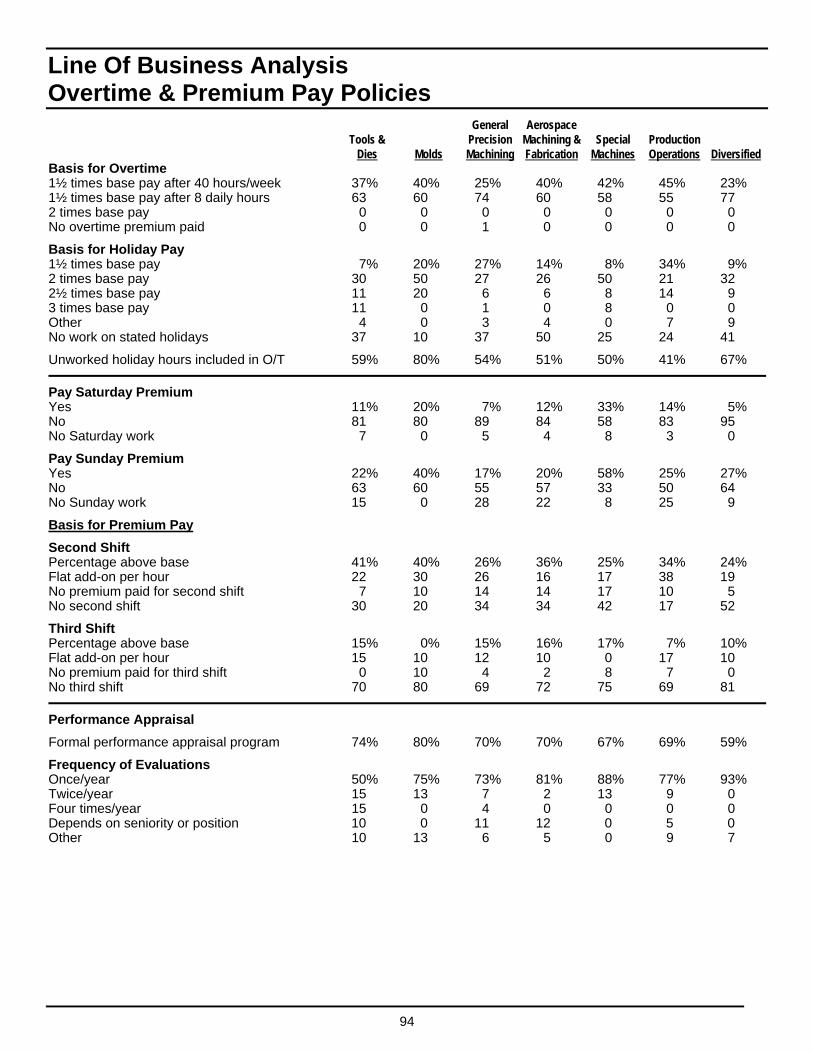
94
Line Of Business Analysis Overtime & Premium Pay Policies General Aerospace Tools & Precision Machining & Special Production Dies Molds Machining Fabrication Machines Operations Diversified Basis for Overtime 1½ times base pay after 40 hours/week 37% 40% 25% 40% 42% 45% 23% 1½ times base pay after 8 daily hours 63 60 74 60 58 55 77 2 times base pay 0 0 0 0 0 0 0 No overtime premium paid 0 0 1 0 0 0 0
Basis for Holiday Pay 1½ times base pay 7% 20% 27% 14% 8% 34% 9% 2 times base pay 30 50 27 26 50 21 32 2½ times base pay 11 20 6 6 8 14 9 3 times base pay 11 0 1 0 8 0 0 Other 4 0 3 4 0 7 9 No work on stated holidays 37 10 37 50 25 24 41
Unworked holiday hours included in O/T 59% 80% 54% 51% 50% 41% 67%
Pay Saturday Premium Yes 11% 20% 7% 12% 33% 14% 5% No 81 80 89 84 58 83 95 No Saturday work 7 0 5 4 8 3 0
Pay Sunday Premium Yes 22% 40% 17% 20% 58% 25% 27% No 63 60 55 57 33 50 64 No Sunday work 15 0 28 22 8 25 9
Basis for Premium Pay
Second Shift Percentage above base 41% 40% 26% 36% 25% 34% 24% Flat add-on per hour 22 30 26 16 17 38 19 No premium paid for second shift 7 10 14 14 17 10 5 No second shift 30 20 34 34 42 17 52
Third Shift Percentage above base 15% 0% 15% 16% 17% 7% 10% Flat add-on per hour 15 10 12 10 0 17 10 No premium paid for third shift 0 10 4 2 8 7 0 No third shift 70 80 69 72 75 69 81
Performance Appraisal
Formal performance appraisal program 74% 80% 70% 70% 67% 69% 59%
Frequency of Evaluations Once/year 50% 75% 73% 81% 88% 77% 93% Twice/year 15 13 7 2 13 9 0 Four times/year 15 0 4 0 0 0 0 Depends on seniority or position 10 0 11 12 0 5 0 Other 10 13 6 5 0 9 7

95
Line Of Business Analysis Safety Policies General Aerospace Tools & Precision Machining & Special Production Dies Molds Machining Fabrication Machines Operations Diversified
Provision of Safety Glasses
Plain Lenses Furnished 70% 80% 67% 68% 75% 79% 68%
Company Contribution 100% (no dollar limit) 63% 86% 68% 74% 89% 65% 50% 100% (to limit of $30) 37 14 29 21 11 30 38 Cost shared ($50 limit, 35% company paid) 0 0 3 6 0 4 13
Prescription Lenses Furnished 56% 40% 49% 44% 75% 38% 50%
Company Contribution 100% (no dollar limit) 20% 25% 29% 29% 33% 27% 25% 100% (to limit of $100) 60 25 59 48 44 45 50 Cost shared ($50 limit, 70% company paid) 20 50 12 24 22 27 25
Workplace Injuries/Illnesses
Facilities Available First aid equipment 100% 100% 98% 98% 92% 97% 95% Trained first aid Specialist 37 30 38 38 42 55 52 Nearby medical facility 100 100 97 96 100 97 86
Injury Compensation (other than workers comp) Provide injury compensation (1st 7 days) 15% 20% 17% 10% 17% 17% 9% Provide for day of injury only 37 40 39 37 33 28 59 No compensation 48 40 44 53 50 55 32
New employees given physical exams 19% 50% 24% 22% 50% 28% 41%
Drug/Alcohol Testing Administered Pre-employment testing 52% 89% 59% 56% 58% 62% 68% Random testing all employees 19 10 19 28 25 28 23 For cause testing all employees 48 80 61 58 58 59 68 No drug/alcohol testing 37 0 30 35 33 28 18
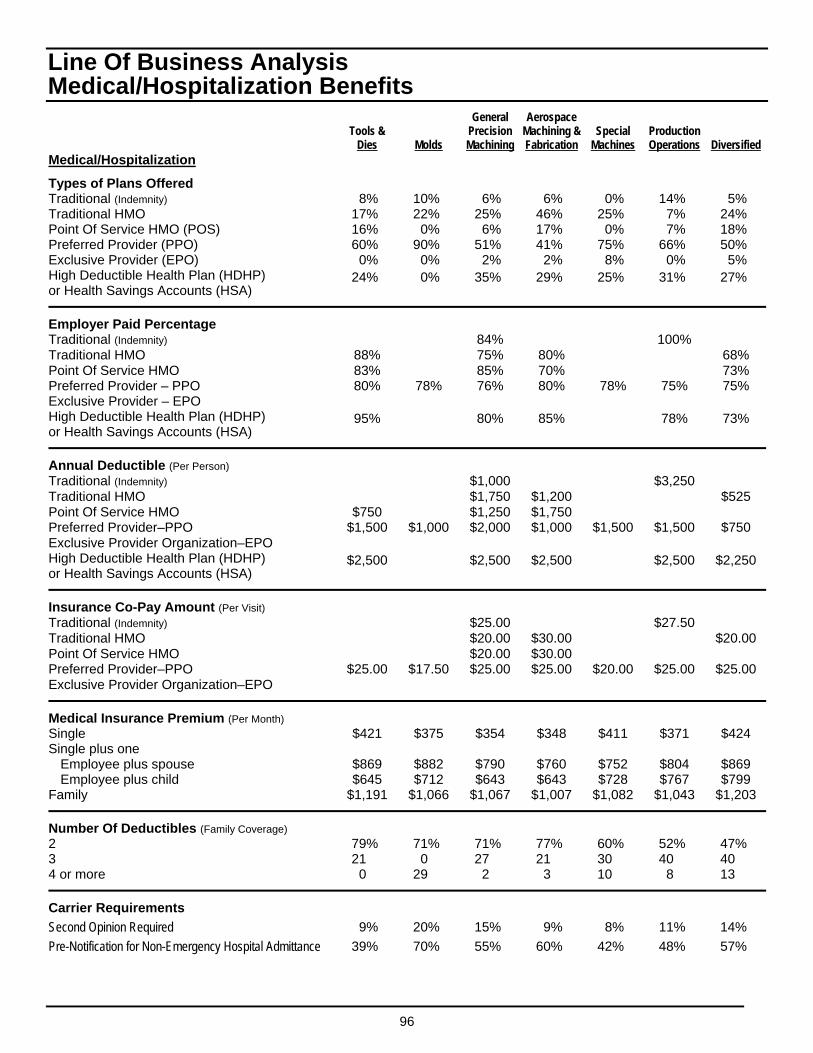
96
Line Of Business Analysis Medical/Hospitalization Benefits General Aerospace Tools & Precision Machining & Special Production Dies Molds Machining Fabrication Machines Operations Diversified Medical/Hospitalization
Types of Plans Offered Traditional (Indemnity) 8% 10% 6% 6% 0% 14% 5% Traditional HMO 17% 22% 25% 46% 25% 7% 24% Point Of Service HMO (POS) 16% 0% 6% 17% 0% 7% 18% Preferred Provider (PPO) 60% 90% 51% 41% 75% 66% 50% Exclusive Provider (EPO) 0% 0% 2% 2% 8% 0% 5% High Deductible Health Plan (HDHP) or Health Savings Accounts (HSA)
24% 0% 35% 29% 25% 31% 27%
Employer Paid Percentage Traditional (Indemnity) 84% 100% Traditional HMO 88% 75% 80% 68% Point Of Service HMO 83% 85% 70% 73% Preferred Provider – PPO 80% 78% 76% 80% 78% 75% 75% Exclusive Provider – EPO High Deductible Health Plan (HDHP) or Health Savings Accounts (HSA)
95% 80% 85% 78% 73%
Annual Deductible (Per Person) Traditional (Indemnity) $1,000 $3,250 Traditional HMO $1,750 $1,200 $525 Point Of Service HMO $750 $1,250 $1,750 Preferred Provider–PPO $1,500 $1,000 $2,000 $1,000 $1,500 $1,500 $750 Exclusive Provider Organization–EPO High Deductible Health Plan (HDHP) or Health Savings Accounts (HSA)
$2,500 $2,500 $2,500 $2,500 $2,250
Insurance Co-Pay Amount (Per Visit) Traditional (Indemnity) $25.00 $27.50 Traditional HMO $20.00 $30.00 $20.00 Point Of Service HMO $20.00 $30.00 Preferred Provider–PPO $25.00 $17.50 $25.00 $25.00 $20.00 $25.00 $25.00 Exclusive Provider Organization–EPO
Medical Insurance Premium (Per Month) Single $421 $375 $354 $348 $411 $371 $424 Single plus one
Employee plus spouse $869 $882 $790 $760 $752 $804 $869 Employee plus child $645 $712 $643 $643 $728 $767 $799
Family $1,191 $1,066 $1,067 $1,007 $1,082 $1,043 $1,203
Number Of Deductibles (Family Coverage) 2 79% 71% 71% 77% 60% 52% 47% 3 21 0 27 21 30 40 40 4 or more 0 29 2 3 10 8 13
Carrier Requirements
Second Opinion Required 9% 20% 15% 9% 8% 11% 14%
Pre-Notification for Non-Emergency Hospital Admittance 39% 70% 55% 60% 42% 48% 57%
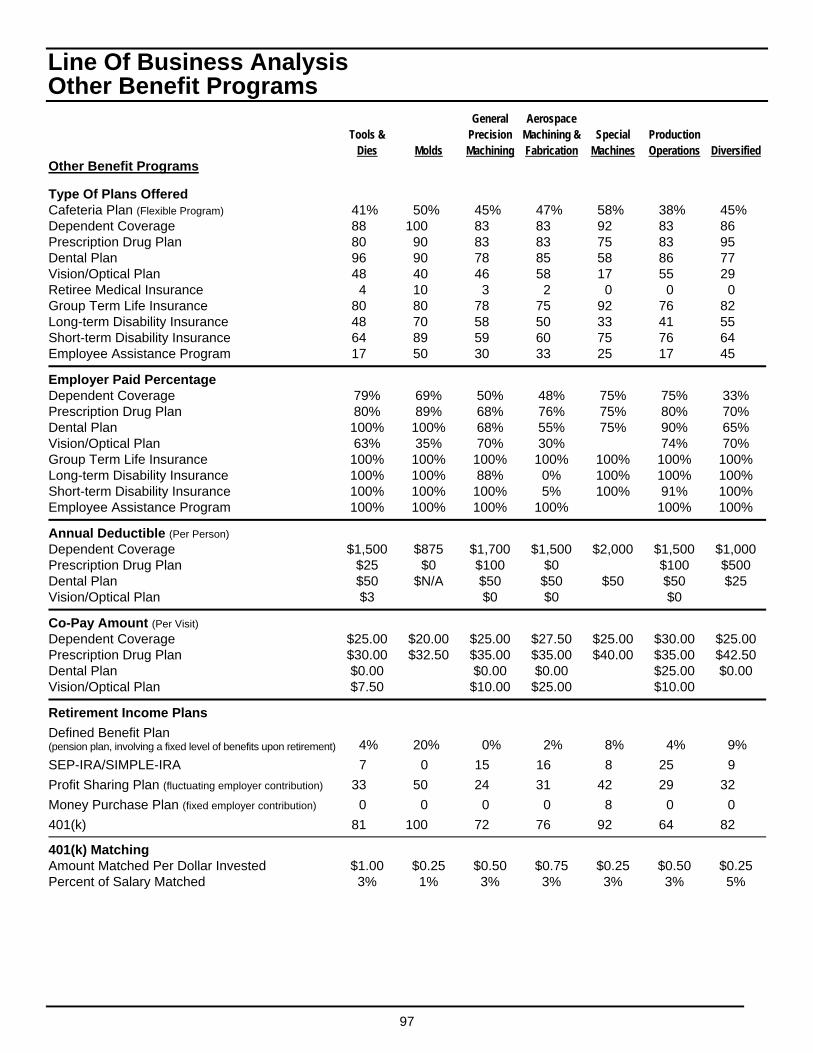
97
Line Of Business Analysis Other Benefit Programs General Aerospace Tools & Precision Machining & Special Production Dies Molds Machining Fabrication Machines Operations Diversified Other Benefit Programs
Type Of Plans Offered Cafeteria Plan (Flexible Program) 41% 50% 45% 47% 58% 38% 45% Dependent Coverage 88 100 83 83 92 83 86 Prescription Drug Plan 80 90 83 83 75 83 95 Dental Plan 96 90 78 85 58 86 77 Vision/Optical Plan 48 40 46 58 17 55 29 Retiree Medical Insurance 4 10 3 2 0 0 0 Group Term Life Insurance 80 80 78 75 92 76 82 Long-term Disability Insurance 48 70 58 50 33 41 55 Short-term Disability Insurance 64 89 59 60 75 76 64 Employee Assistance Program 17 50 30 33 25 17 45
Employer Paid Percentage Dependent Coverage 79% 69% 50% 48% 75% 75% 33% Prescription Drug Plan 80% 89% 68% 76% 75% 80% 70% Dental Plan 100% 100% 68% 55% 75% 90% 65% Vision/Optical Plan 63% 35% 70% 30% 74% 70% Group Term Life Insurance 100% 100% 100% 100% 100% 100% 100% Long-term Disability Insurance 100% 100% 88% 0% 100% 100% 100% Short-term Disability Insurance 100% 100% 100% 5% 100% 91% 100% Employee Assistance Program 100% 100% 100% 100% 100% 100%
Annual Deductible (Per Person) Dependent Coverage $1,500 $875 $1,700 $1,500 $2,000 $1,500 $1,000 Prescription Drug Plan $25 $0 $100 $0 $100 $500 Dental Plan $50 $N/A $50 $50 $50 $50 $25 Vision/Optical Plan $3 $0 $0 $0
Co-Pay Amount (Per Visit) Dependent Coverage $25.00 $20.00 $25.00 $27.50 $25.00 $30.00 $25.00 Prescription Drug Plan $30.00 $32.50 $35.00 $35.00 $40.00 $35.00 $42.50 Dental Plan $0.00 $0.00 $0.00 $25.00 $0.00 Vision/Optical Plan $7.50 $10.00 $25.00 $10.00
Retirement Income Plans
Defined Benefit Plan (pension plan, involving a fixed level of benefits upon retirement) 4% 20% 0% 2% 8% 4% 9%
SEP-IRA/SIMPLE-IRA 7 0 15 16 8 25 9
Profit Sharing Plan (fluctuating employer contribution) 33 50 24 31 42 29 32
Money Purchase Plan (fixed employer contribution) 0 0 0 0 8 0 0
401(k) 81 100 72 76 92 64 82
401(k) Matching Amount Matched Per Dollar Invested $1.00 $0.25 $0.50 $0.75 $0.25 $0.50 $0.25 Percent of Salary Matched 3% 1% 3% 3% 3% 3% 5%
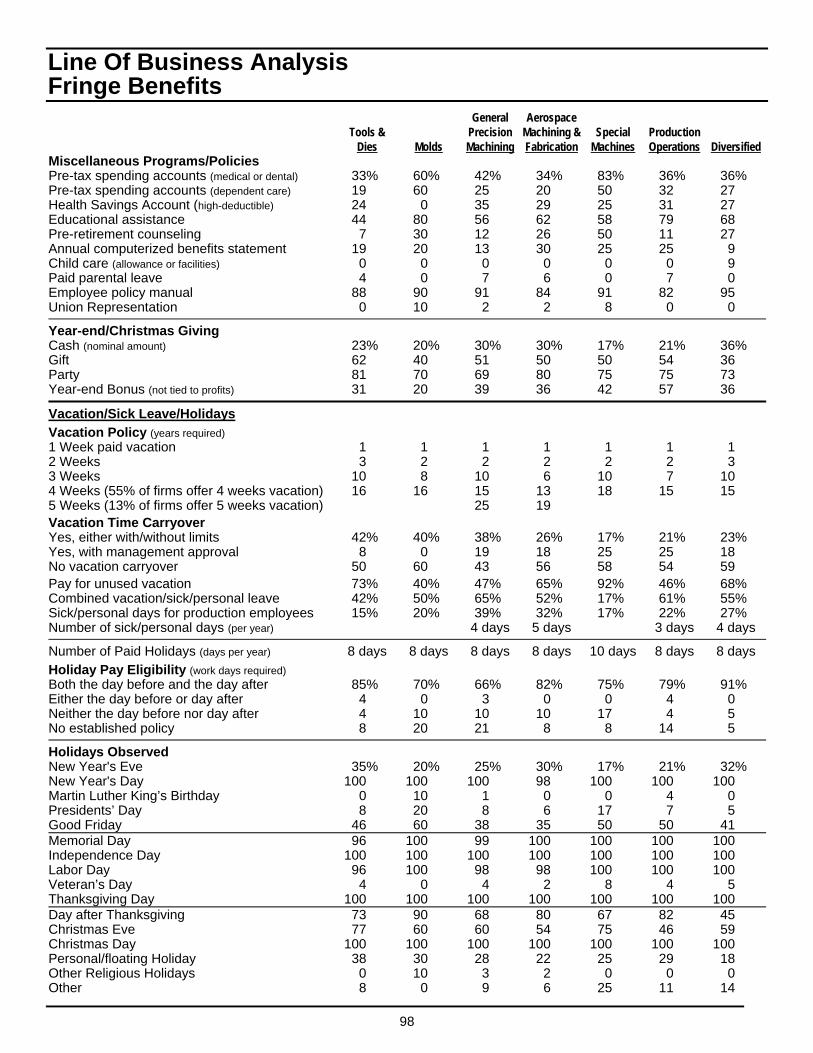
98
Line Of Business Analysis Fringe Benefits General Aerospace Tools & Precision Machining & Special Production Dies Molds Machining Fabrication Machines Operations Diversified Miscellaneous Programs/Policies Pre-tax spending accounts (medical or dental) 33% 60% 42% 34% 83% 36% 36% Pre-tax spending accounts (dependent care) 19 60 25 20 50 32 27 Health Savings Account (high-deductible) 24 0 35 29 25 31 27 Educational assistance 44 80 56 62 58 79 68 Pre-retirement counseling 7 30 12 26 50 11 27 Annual computerized benefits statement 19 20 13 30 25 25 9 Child care (allowance or facilities) 0 0 0 0 0 0 9 Paid parental leave 4 0 7 6 0 7 0 Employee policy manual 88 90 91 84 91 82 95 Union Representation 0 10 2 2 8 0 0
Year-end/Christmas Giving Cash (nominal amount) 23% 20% 30% 30% 17% 21% 36% Gift 62 40 51 50 50 54 36 Party 81 70 69 80 75 75 73 Year-end Bonus (not tied to profits) 31 20 39 36 42 57 36
Vacation/Sick Leave/Holidays
Vacation Policy (years required) 1 Week paid vacation 1 1 1 1 1 1 1 2 Weeks 3 2 2 2 2 2 3 3 Weeks 10 8 10 6 10 7 10 4 Weeks (55% of firms offer 4 weeks vacation) 16 16 15 13 18 15 15 5 Weeks (13% of firms offer 5 weeks vacation) 25 19 Vacation Time Carryover Yes, either with/without limits 42% 40% 38% 26% 17% 21% 23% Yes, with management approval 8 0 19 18 25 25 18 No vacation carryover 50 60 43 56 58 54 59 Pay for unused vacation 73% 40% 47% 65% 92% 46% 68% Combined vacation/sick/personal leave 42% 50% 65% 52% 17% 61% 55% Sick/personal days for production employees 15% 20% 39% 32% 17% 22% 27% Number of sick/personal days (per year) 4 days 5 days 3 days 4 days
Number of Paid Holidays (days per year) 8 days 8 days 8 days 8 days 10 days 8 days 8 days
Holiday Pay Eligibility (work days required) Both the day before and the day after 85% 70% 66% 82% 75% 79% 91% Either the day before or day after 4 0 3 0 0 4 0 Neither the day before nor day after 4 10 10 10 17 4 5 No established policy 8 20 21 8 8 14 5
Holidays Observed New Year's Eve 35% 20% 25% 30% 17% 21% 32% New Year's Day 100 100 100 98 100 100 100 Martin Luther King’s Birthday 0 10 1 0 0 4 0 Presidents’ Day 8 20 8 6 17 7 5 Good Friday 46 60 38 35 50 50 41 Memorial Day 96 100 99 100 100 100 100 Independence Day 100 100 100 100 100 100 100 Labor Day 96 100 98 98 100 100 100 Veteran’s Day 4 0 4 2 8 4 5 Thanksgiving Day 100 100 100 100 100 100 100 Day after Thanksgiving 73 90 68 80 67 82 45 Christmas Eve 77 60 60 54 75 46 59 Christmas Day 100 100 100 100 100 100 100 Personal/floating Holiday 38 30 28 22 25 29 18 Other Religious Holidays 0 10 3 2 0 0 0 Other 8 0 9 6 25 11 14
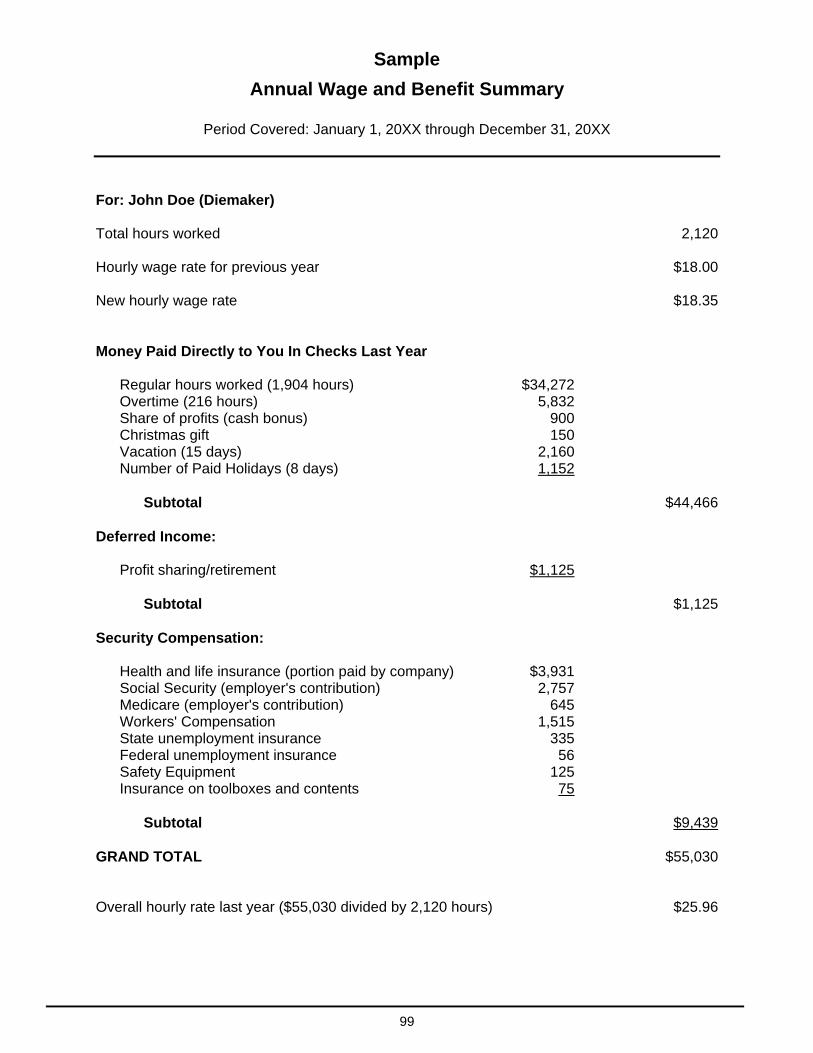
99
Sample
Annual Wage and Benefit Summary
Period Covered: January 1, 20XX through December 31, 20XX
For: John Doe (Diemaker) Total hours worked 2,120 Hourly wage rate for previous year $18.00 New hourly wage rate $18.35 Money Paid Directly to You In Checks Last Year Regular hours worked (1,904 hours) $34,272 Overtime (216 hours) 5,832 Share of profits (cash bonus) 900 Christmas gift 150 Vacation (15 days) 2,160 Number of Paid Holidays (8 days) 1,152 Subtotal $44,466 Deferred Income: Profit sharing/retirement $1,125 Subtotal $1,125 Security Compensation: Health and life insurance (portion paid by company) $3,931 Social Security (employer's contribution) 2,757 Medicare (employer's contribution) 645 Workers' Compensation 1,515 State unemployment insurance 335 Federal unemployment insurance 56 Safety Equipment 125
Insurance on toolboxes and contents 75 Subtotal $9,439 GRAND TOTAL $55,030 Overall hourly rate last year ($55,030 divided by 2,120 hours) $25.96
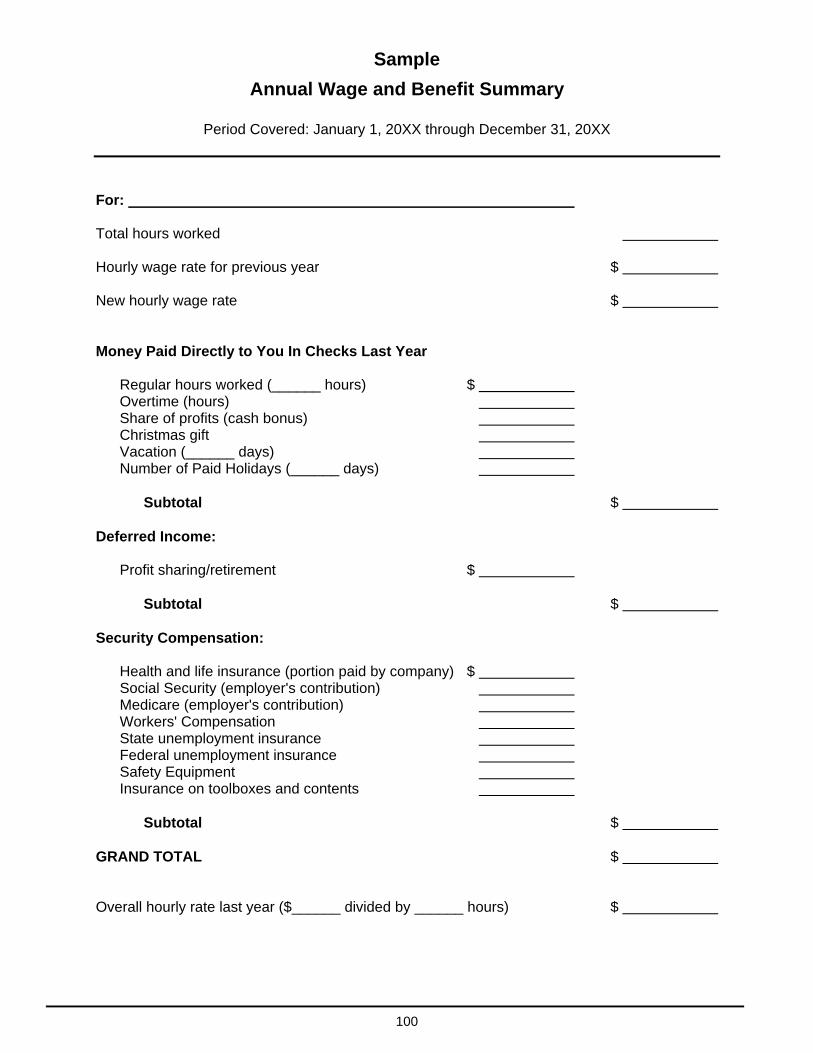
100
Sample
Annual Wage and Benefit Summary
Period Covered: January 1, 20XX through December 31, 20XX
For: Total hours worked Hourly wage rate for previous year $ New hourly wage rate $ Money Paid Directly to You In Checks Last Year Regular hours worked (______ hours) $ Overtime (hours) Share of profits (cash bonus) Christmas gift Vacation (______ days) Number of Paid Holidays (______ days) Subtotal $ Deferred Income: Profit sharing/retirement $ Subtotal $ Security Compensation: Health and life insurance (portion paid by company) $ Social Security (employer's contribution) Medicare (employer's contribution) Workers' Compensation State unemployment insurance Federal unemployment insurance Safety Equipment
Insurance on toolboxes and contents Subtotal $ GRAND TOTAL $ Overall hourly rate last year ($______ divided by ______ hours) $
NATIONAL TOOLING & MACHINING ASSOCIATION
2013 EXECUTIVE TEAM
Chairman of The Board Robert Mosey, Mosey’s Production Machinists Inc., Anaheim, CA
Vice Chairman Ted Toth, Jr., Toth Technologies, Pennsauken, NJ
Treasurer Herb Homeyer, Homeyer Tool & Die Co., Marthasville, MO
Secretary Dave Sattler, Sattler Companies Inc., Sharon Center, OH
Past Chairman of The Board Roger Atkins, MIC Group, Brenham, TX
NTMA President Dave Tilstone
National Tooling & Machining Association 6363 Oak Tree Boulevard Independence, OH 44131
800-248-6862 Website: http://www.ntma.org
NTMA