2013 preliminary final report - boq.com.au · 1 preliminary final report 2013 preliminary final...
TRANSCRIPT

1
PRELIMINARY FINAL REPORT
2013 preliminary final report
Bank of Queensland Limited ABN 32 009 656 740. AFSL No. 244616.

2
Bank of Queensland Limited and its Controlled Entities A.B.N. 32 009 656 740.
THIS PAGE HAS BEEN INTENTIONALLY LEFT BLANK.

3
PRELIMINARY FINAL REPORT
PRELIMINARY FINAL REPORT FINANCIAL INFORMATION For the year ended 31 August 2013
TABLE OF CONTENTS Page
Income Statements 4
Statements of Comprehensive Income 5
Balance Sheets 6
Statements of Cashflows 7
Statements of Changes in Equity 8
Notes supporting the financial information
1. Reporting entity 12
2. Basis of preparation 12
3. Significant accounting policies 12
4. Operating income 21
5. Expenses 22
6. Income tax expense / (benefit) 23
7. Dividends 24
8. Earnings per share 25
9. Cash and liquid assets 26
10. Due from other financial institutions 26
11. Other financial assets 26
12. Loans and advances at amortised cost 27
13. Provisions for impairment 29
14. Other assets 29
15. Property, plant and equipment 30
16. Deferred tax assets and liabilities 32
17. Intangible assets 33
18. Due to other financial institutions 35
19. Deposits 36
20. Provisions 36
21. Borrowings including subordinated notes 37
22. Capital and Reserves 38
23. Segment reporting 39
24. Risk management 41
25. Capital management 50
26. Financial instruments 52
27. Notes to the statement of cash flows 56
28. Auditor’s remuneration 56
29. Contingent liabilities 57
30. Commitments 57
31. Controlled entities 58
32. Related parties information 59
33. Average balances and margin analysis 60
34. Deed of cross guarantee 61
35. Insurance business 63
36. Events subsequent to balance date 67
37. Investments accounted for using the equity method 67
Shareholding details 68

4
Bank of Queensland Limited and its Controlled Entities A.B.N. 32 009 656 740.
INCOME STATEMENTS
For the year ended 31 August 2013
Note
Consolidated Bank
2013 $m
2012 $m
2013 $m
2012 $m
Interest income 4 2,297.4 2,596.2 2,236.6 2,549.2
Less: Interest expense 4 1,604.3 1,944.7 1,711.1 2,086.7
Net interest income 693.1 651.5 525.5 462.5
Other operating income 4 122.5 111.5 218.8 235.7
Net banking operating income 815.6 763.0 744.3 698.2
Premiums from insurance contracts 70.2 76.0 - -
Investment revenue 5.8 7.4 - -
Claims and policyholder liability expense from insurance contracts (35.7) (42.1) - -
Net insurance operating income 4 40.3 41.3 - -
Total operating income 4 855.9 804.3 744.3 698.2
Less: Expenses 5 465.5 422.6 418.9 369.7
Less: Impairment on loans and advances 13 114.6 401.0 87.2 359.9
Profit/(Loss) before income tax 275.8 (19.3) 238.2 (31.4)
Less: Income tax expense/(benefit) 6 90.0 (2.2) 68.5 (27.6)
Profit/(Loss) for the year 185.8 (17.1) 169.7 (3.8)
Profit / (Loss) attributable to:
Equity holders of the parent 185.8 (17.1) 169.7 (3.8)
Basic earnings per share - Ordinary shares (cents) 8 58.4 (10.2c)
Diluted earnings per share - Ordinary shares (cents) 8 57.2 (10.2c)
The income statements should be read in conjunction with the accompanying notes.

5
PRELIMINARY FINAL REPORT
STATEMENTS OF COMPREHENSIVE INCOME
For the year ended 31 August 2013
Consolidated Bank
2013 $m
2012 $m
2013 $m
2012 $m
Profit / (Loss) for the year 185.8 (17.1) 169.7 (3.8)
Other comprehensive income, net of income tax
Items that may be reclassified subsequently to profit or loss
Cash flow hedges:
Net gains / (losses) taken to equity 11.9 (18.8) (3.1) 8.1
Net (gains) / losses transferred to profit and loss (0.9) 0.2 (0.9) 0.2
Foreign currency translation differences on foreign operations 1.6 (0.6) - -
Net (losses) / gain on hedge of net investment in foreign operation (1.6) 0.8 - -
Change in fair value of assets available for sale (4.2) 6.2 (3.9) 8.9
Other comprehensive income / (expense) for the year, net of income tax 6.8 (12.2) (7.9) 17.2
Total comprehensive income / (expense) for the year 192.6 (29.3) 161.8 13.4
Total comprehensive income / (expense) attributable to:
Equity holders of the parent 192.6 (29.3) 161.8 13.4
The statements of comprehensive income should be read in conjunction with the accompanying notes.
6
Bank of Queensland Limited and its Controlled Entities A.B.N. 32 009 656 740.
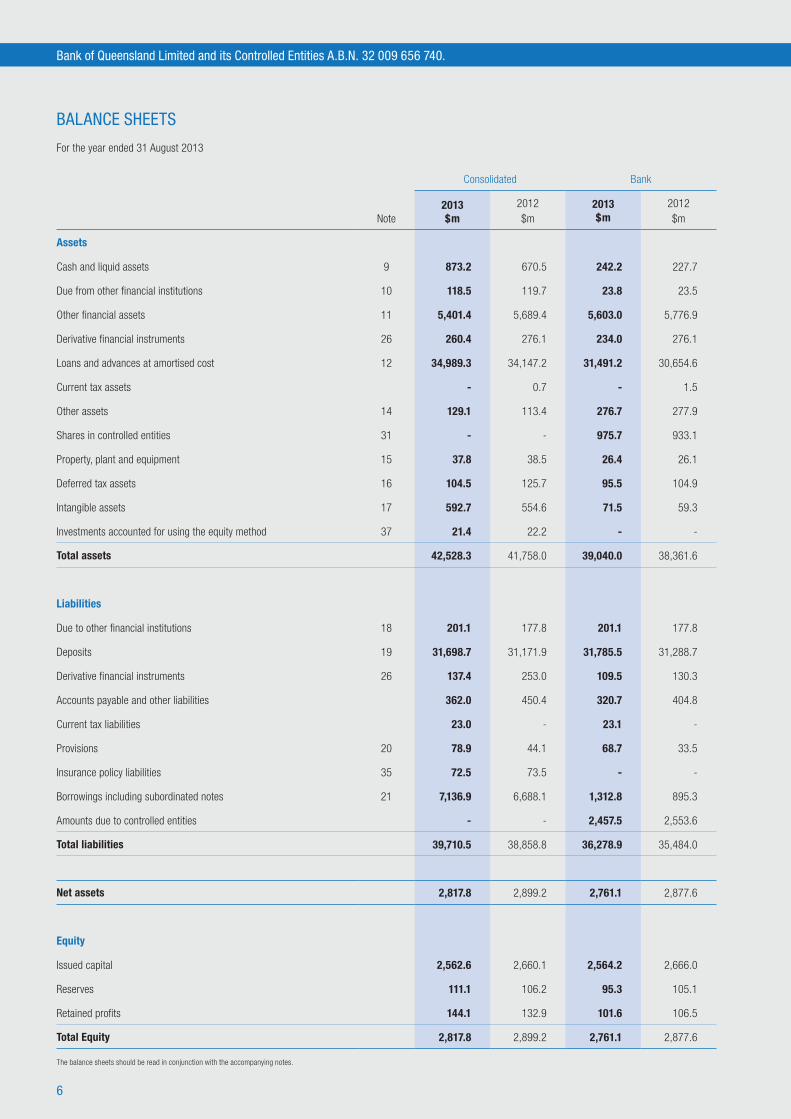
BALANCE SHEETS
For the year ended 31 August 2013
Note
Consolidated Bank
2013 $m
2012 $m
2013 $m
2012 $m
Assets
Cash and liquid assets 9 873.2 670.5 242.2 227.7
Due from other financial institutions 10 118.5 119.7 23.8 23.5
Other financial assets 11 5,401.4 5,689.4 5,603.0 5,776.9
Derivative financial instruments 26 260.4 276.1 234.0 276.1
Loans and advances at amortised cost 12 34,989.3 34,147.2 31,491.2 30,654.6
Current tax assets - 0.7 - 1.5
Other assets 14 129.1 113.4 276.7 277.9
Shares in controlled entities 31 - - 975.7 933.1
Property, plant and equipment 15 37.8 38.5 26.4 26.1
Deferred tax assets 16 104.5 125.7 95.5 104.9
Intangible assets 17 592.7 554.6 71.5 59.3
Investments accounted for using the equity method 37 21.4 22.2 - -
Total assets 42,528.3 41,758.0 39,040.0 38,361.6
Liabilities
Due to other financial institutions 18 201.1 177.8 201.1 177.8
Deposits 19 31,698.7 31,171.9 31,785.5 31,288.7
Derivative financial instruments 26 137.4 253.0 109.5 130.3
Accounts payable and other liabilities 362.0 450.4 320.7 404.8
Current tax liabilities 23.0 - 23.1 -
Provisions 20 78.9 44.1 68.7 33.5
Insurance policy liabilities 35 72.5 73.5 - -
Borrowings including subordinated notes 21 7,136.9 6,688.1 1,312.8 895.3
Amounts due to controlled entities - - 2,457.5 2,553.6
Total liabilities 39,710.5 38,858.8 36,278.9 35,484.0
Net assets 2,817.8 2,899.2 2,761.1 2,877.6
Equity
Issued capital 2,562.6 2,660.1 2,564.2 2,666.0
Reserves 111.1 106.2 95.3 105.1
Retained profits 144.1 132.9 101.6 106.5
Total Equity 2,817.8 2,899.2 2,761.1 2,877.6
The balance sheets should be read in conjunction with the accompanying notes.

7
PRELIMINARY FINAL REPORT
STATEMENTS OF CASH FLOWS
For the year ended 31 August 2013Note
Consolidated Bank
2013 $m
2012 $m
2013 $m
2012 $m
Cash flows from operating activities
Interest received 2,303.3 2,567.0 2,058.8 2,317.7
Fees and other income received 170.0 181.6 212.3 130.1
Dividends received 1.1 0.8 1.1 0.8
Interest paid (1,604.4) (2,085.5) (1,701.1) (2,231.4)
Cash paid to suppliers and employees (393.0) (382.9) (367.3) (338.4)
Operating income tax paid (48.3) (153.4) (45.8) (151.7)
428.7 127.6 158.0 (272.9)
(Increase) / decrease in operating assets:
Loans and advances at amortised cost (966.9) (1,279.2) (1,037.1) (1,115.7)
Other financial assets 280.2 (517.2) 150.6 (551.8)
Increase / (decrease) in operating liabilities:
Deposits 543.8 1,541.5 509.6 1,462.9
Securitisation liabilities 21 (65.2) 283.3 - -
Net cash from operating activities 27 220.6 156.0 (218.9) (477.5)
Cash flows from investing activities
Acquisition of Virgin Money (Australia) Pty Limited 31 (5.9) - (5.9) -
Payments for property, plant and equipment (17.0) (10.4) (8.3) (9.7)
Payments for intangible assets (31.1) (21.7) (30.7) (18.2)
Cash distribution received from equity accounted investments 2.4 6.7 - -
Capital contribution for equity accounted investments (0.5) - - -
Proceeds from sale of property, plant and equipment 5.3 3.9 0.5 0.9
Net cash from investing activities (46.8) (21.5) (44.4) (27.0)
Cash flows from financing activities
Proceeds from issue of ordinary shares - 450.3 - 450.3
Cost of capital issues - (10.4) - (10.4)
Proceeds from borrowings and foreign exchange instruments 1,631.2 984.4 1,631.0 983.5
Net proceeds from issue of Convertible Preference Shares (“CPS”) 21 111.8 - 111.8 -
Redemption of PEPS (19.9) - (19.9) -
Proceeds from other financing activities - - 766.8 612.5
Repayment of other financing activities - - (541.2) (278.3)
Repayments of borrowings 21 (1,582.3) (1,228.9) (1,582.1) (1,226.6)
Payments for treasury shares - (3.8) - (3.8)
Dividends paid (111.9) (88.8) (111.9) (88.8)
Dividends received - - 23.3 24.2
Net cash from financing activities 28.9 102.8 277.8 462.6
Net increase / (decrease) in cash and cash equivalents 202.7 237.3 14.5 (41.9)
Cash and liquid assets at beginning of year 670.5 433.2 227.7 269.6
Cash and liquid assets at end of year 9 873.2 670.5 242.2 227.7
The statements of cashflows should be read in conjunction with the accompanying notes.

8
Bank of Queensland Limited and its Controlled Entities A.B.N. 32 009 656 740.
STATEMENTS OF CHANGES IN EQUITYFor the year ended 31 August 2013
ConsolidatedOrdinary shares
Perpetual Equity
Preference shares
Employee benefits reserve
Equity reserve
for credit losses
Cashflow hedge reserve
Translation reserve
Available for sale reserve
Retained profits
Total equity
Year ended 31 August 2013 $m $m $m $m $m $m $m $m $m
Balance at beginning of the year 2,464.4 195.7 33.3 70.2 (10.6) 0.6 12.7 132.9 2,899.2
Total comprehensive income for the year
Profit - - - - - - - 185.8 185.8
Other comprehensive income, net of income tax
Cash flow hedges:
Net gains taken to equity - - - - 11.9 - - - 11.9
Net gains transferred to profit and loss
- - - - (0.9) - - - (0.9)
Net loss on hedge of net investment in foreign operation
- - - - - (1.6) - - (1.6)
Foreign currency translation differences on foreign operations
- - - - - 1.6 - - 1.6
Change in fair value of assets available for sale
- - - - - - (4.2) - (4.2)
Total other comprehensive income - - - - 11.0 - (4.2) - 6.8
Total comprehensive income for the year - - - - 11.0 - (4.2) 185.8 192.6
Transactions with owners, recorded directly in equity
Contributions by and distributions to owners
Exchange to CPS (1) (4.3) (175.8) - - - - - - (180.1)
Redemption of Perpetual Preference Shares (“PEPs”) (1)
- (19.9) - - - - - - (19.9)
Dividend reinvestment plan 62.7 - - - - - - - 62.7
Dividends to shareholders - - - - - - - (168.7) (168.7)
Dividends to PEPs - - - - - - - (5.9) (5.9)
Equity settled transactions - - (1.9) - - - - - (1.9)
Treasury Shares (2) 7.0 - - - - - - - 7.0
Acquisition of Virgin Money (Australia) Pty Limited (3)
32.8 - - - - - - - 32.8
Total contributions by and distributions to owners
98.2 (195.7) (1.9) - - - - (174.6) (274.0)
Balance at the end of the year 2,562.6 - 31.4 70.2 0.4 0.6 8.5 144.1 2,817.8
(1) On 24 December 2012, 1,801,339 PEPS shares were reinvested into CPS and the remaining 198,661 PEPS shares were redeeemed on 15 April 2013.
(2) Treasury shares represent the value of shares held by a subsidiary that the Bank is required to include in the Consolidated Entity’s financial statements. No gain or loss is recognised in profit or loss on the purchase, sale, issue or cancellation of the Bank’s own equity instruments.
(3) On 30 April 2013, the Bank acquired 100% of Virgin Money (Australia) Pty Limited for consideration of $42.6 million. $30.6 million of new shares were issued in two tranches (Tranche 1 - 1,585,353 and Tranche 2 - 1,617,762) as part of the acquisition consideration. Refer to Note 31(b) for further details.
The statement of changes in equity should be read in conjunction with the accompanying notes.

9
PRELIMINARY FINAL REPORT
STATEMENTS OF CHANGES IN EQUITY (CONTINUED)
For the year ended 31 August 2013
ConsolidatedOrdinary shares
Perpetual Equity
Preference shares
Employee benefits reserve
Equity reserve
for credit losses
Cashflow hedge reserve
Translation reserve
Available for sale reserve
Retained profits
Total equity
Year ended 31 August 2012 $m $m $m $m $m $m $m $m $m
Balance at beginning of the year 1,957.6 195.7 33.5 67.0 8.0 0.4 6.5 304.9 2,573.6
Total comprehensive income for the year
Loss - - - - - - - (17.1) (17.1)
Other comprehensive income, net of income tax
Cash flow hedges:
Net losses taken to equity - - - - (18.8) - - - (18.8)
Net losses transferred to profit and loss
- - - - 0.2 - - - 0.2
Net gain on hedge of net investment in foreign operation
- - - - - 0.8 - - 0.8
Foreign currency translation differences on foreign operations
- - - - - (0.6) - - (0.6)
Change in fair value of assets available for sale
- - - - - - 6.2 - 6.2
Transfers - - - 3.2 - - - (3.2) -
Total other comprehensive income / (expense)
- - - 3.2 (18.6) 0.2 6.2 (3.2) (12.2)
Total comprehensive income / (expense) for the year
- - - 3.2 (18.6) 0.2 6.2 (20.3) (29.3)
Transactions with owners, recorded directly in equity
Contributions by and distributions to owners
Institutional placement and entitlement offer (1)
288.5 - - - - - - - 288.5
Retail entitlement offer (1) 161.8 - - - - - - - 161.8
Costs of capital issue (7.4) - - - - - - - (7.4)
Dividend reinvestment plan 63.0 - - - - - - - 63.0
Dividends to shareholders - - - - - - - (142.1) (142.1)
Dividends to PEPs - - - - - - - (9.6) (9.6)
Equity settled transactions - - (0.2) - - - - - (0.2)
Treasury Shares (2) 0.9 - - - - - - - 0.9
Total contributions by and distributions to owners
506.8 - (0.2) - - - - (151.7) 354.9
Balance at the end of the year 2,464.4 195.7 33.3 70.2 (10.6) 0.6 2.7 132.9 2,899.2
(1) In April / May, the Bank completed a capital raising by way of Institutional Placement, Institutional Entitlement and Retail Entitlement offers of fully paid ordinary shares at an issue price of $6.05 per share.
(2) Treasury shares represent the value of shares held by a subsidiary that the Bank is required to include in the Consolidated Entity’s financial statements. No gain or loss is recognised in profit or loss on the purchase, sale, issue or cancellation of the Bank’s own equity instruments.
The statement of changes in equity should be read in conjunction with the accompanying notes.

10
Bank of Queensland Limited and its Controlled Entities A.B.N. 32 009 656 740.
STATEMENTS OF CHANGES IN EQUITY (CONTINUED)
For the year ended 31 August 2013
BankOrdinary shares
Perpetual Equity
Preference shares
Employee benefits reserve
Equity reserve
for credit losses
Cashflow hedge reserve
Available for sale reserve
Retained profits
Total equity
Year ended 31 August 2013 $m $m $m $m $m $m $m $m
Balance at beginning of the year 2,470.3 195.7 33.3 57.3 1.8 12.7 106.5 2,877.6
Total comprehensive income for the year
Profit - - - - - - 169.7 169.7
Other comprehensive income, net of income tax -
Cash flow hedges: -
Net losses taken to equity - - - - (3.1) - - (3.1)
Net gains transferred to profit and loss - - - - (0.9) - - (0.9)
Change in fair value of assets available for sale - - - - - (3.9) - (3.9)
Total other comprehensive expense - - - - (4.0) (3.9) - (7.9)
Total comprehensive income / (expense) for the year - - - - (4.0) (3.9) 169.7 161.8
Transactions with owners, recorded directly in equity
Contributions by and distributions to owners
Exchange to CPS (1) (4.3) (175.8) - - - - - (180.1)
Redemption of PEPs (1) - (19.9) - - - - - (19.9)
Dividend reinvestment plan 62.7 - - - - - - 62.7
Dividends to shareholders - - - - - - (168.7) (168.7)
Dividends to PEPs - - - - - - (5.9) (5.9)
Equity settled transactions - - (1.9) - - - - (1.9)
Treasury Shares (2) 2.7 - - - - - - 2.7
Acquisition of Virgin Money (Australia) Pty Limited (3) 32.8 - - - - - - 32.8
Total contributions by and distributions to owners 93.9 (195.7) (1.9) - - - (174.6) (278.3)
Balance at the end of the year 2,564.2 - 31.4 57.3 (2.2) 8.8 101.6 2,761.1
(1) On 24 December 2012, 1,801,339 PEPS shares were reinvested into CPS and the remaining 198,661 PEPS shares were redeeemed on 15 April 2013.
(2) Treasury shares represent the value of shares held by a subsidiary that the Bank is required to include in the Consolidated Entity’s financial statements. No gain or loss is recognised in profit or loss on the purchase, sale, issue or cancellation of the Bank’s own equity instruments.
(3) On 30 April 2013, the Bank acquired 100% of Virgin Money (Australia) Pty Limited for consideration of $42.6 million. $30.6 million of new shares were issued in two tranches (Tranche 1 - 1,585,353 and Tranche 2 - 1,617,762) as part of the acquisition consideration. Refer to Note 31(b) for further details.
The statement of changes in equity should be read in conjunction with the accompanying notes.

11
PRELIMINARY FINAL REPORT
STATEMENTS OF CHANGES IN EQUITY (CONTINUED)
For the year ended 31 August 2013
BankOrdinary shares
Perpetual Equity
Preference shares
Employee benefits reserve
Equity reserve
for credit losses
Cashflow hedge reserve
Available for sale reserve
Retained profits
Total equity
Year ended 31 August 2012 $m $m $m $m $m $m $m $m
Balance at beginning of the year 1,967.1 195.7 33.5 51.0 (6.5) 3.8 268.3 2,512.9
Total comprehensive income for the year
Loss - - - - - - (3.8) (3.8)
Other comprehensive income, net of income tax
Cash flow hedges:
Net losses taken to equity - - - - 8.1 - - 8.1
Net losses transferred to profit and loss - - - - 0.2 - - 0.2
Change in fair value of assets available for sale - - - - - 8.9 - 8.9
Transfers - - - 6.3 - - (6.3) -
Total other comprehensive income / (expense) - - - 6.3 8.3 8.9 (6.3) 17.2
Total comprehensive income / (expense) for the year - - - 6.3 8.3 8.9 (10.1) 13.4
Transactions with owners, recorded directly in equity
Contributions by and distributions to owners
Institutional placement and entitlement offer (1) 288.5 - - - - - - 288.5
Retail entitlement offer (1) 161.8 - - - - - - 161.8
Costs of capital issue (7.4) - - - - - - (7.4)
Dividend reinvestment plan 63.0 - - - - - - 63.0
Dividends to shareholders - - - - - - (142.1) (142.1)
Dividends to PEPs - - - - - - (9.6) (9.6)
Equity settled transactions - - (0.2) - - - - (0.2)
Treasury Shares (2) (2.7) - - - - - - (2.7)
Total contributions by and distributions to owners 503.2 - (0.2) - - - (151.7) 351.3
Balance at the end of the year 2,470.3 195.7 33.3 57.3 1.8 12.7 106.5 2,877.6
(1) In April / May, the Bank completed a capital raising by way of Institutional Placement, Institutional Entitlement and Retail Entitlement offers of fully paid ordinary shares at an issue price of $6.05 per share.
(2) Treasury shares represent the value of shares held by a subsidiary that the Bank is required to include in the Consolidated Entity’s financial statements. No gain or loss is recognised in profit or loss on the purchase, sale, issue or cancellation of the Bank’s own equity instruments.
The statement of changes in equity should be read in conjunction with the accompanying notes.

12
Bank of Queensland Limited and its Controlled Entities A.B.N. 32 009 656 740.
NOTES TO THE FINANCIAL STATEMENTSFor the year ended 31 August 2013
1. REPORTING ENTITY Bank of Queensland Limited (the “Bank”) is a company domiciled in
Australia. The address of the Bank’s registered office is Level 17, 259 Queen Street, Brisbane, QLD, 4000. The consolidated financial report of the Bank for the financial year ended 31 August 2013 comprises the Bank and its subsidiaries (together referred to as the “Consolidated Entity”) and the Consolidated Entity’s interest in equity accounted investments. The Bank primarily is involved in retail banking, leasing finance and insurance products.
2. BASIS OF PREPARATION
(a) Basis of measurement The financial report is prepared on the historical cost basis with the
exception of the following assets and liabilities which are stated at their fair value:
• derivative financial instruments;
• financial instruments designated at fair value;
• financial instruments classified as available-for-sale; and
• insurance policy liabilities.
(b) Functional and presentation currency The consolidated financial statements are presented in Australian
dollars, which is the Bank’s functional currency and the functional currency of the majority of the Consolidated Entity.
(c) Rounding The Consolidated Entity is of a kind referred to in ASIC Class Order
98/100 dated 10 July 1998 and in accordance with that Class Order, amounts in this financial report and Directors’ report have been rounded off to the nearest million dollars, unless otherwise stated.
(d) Use of estimates and judgements The preparation of a financial report in conformity with Australian
Accounting Standards requires management to make judgements, estimates and assumptions that affect the application of policies and reported amounts of assets, liabilities, income and expenses. These estimates and associated assumptions are based on historical experience and various other factors that are believed to be reasonable under the circumstances, the results of which form the basis of making the judgements about carrying values of assets and liabilities that are not readily apparent from other sources. Actual results may differ from these estimates. These accounting policies have been consistently applied by each entity in the Consolidated Entity.
The estimates and underlying assumptions are reviewed on an ongoing basis. Revisions to accounting estimates are recognised in the period in which the estimates are revised if the revision only affects that period, or in the period of the revision and future periods if the revision affects both current and future periods.
Information about significant areas of estimation uncertainty and critical judgements in applying accounting policies that have the most significant effect on the amounts recognised in the financial statements are described in the following notes:
• Provisions for impairment – Note 13 (refer Note 3 (j)); • Intangible assets - Note 17; • Provisions - Note 20 (refer Note 3 (m));
• Financial instruments - Note 26; • Contingent liabilities – Note 29; and • Insurance policy liabilities – Note 35.
3. SIGNIFICANT ACCOUNTING POLICIESThe following, are the amendments to standards and interpretations applicable for the first time to the current year, and the impact of these on the Bank.
• AASB 2013-2 Amendments to AASB 1038 – Regulatory Capital aligns AASB 1038 Life Insurance Contracts as a result of changes made by the Australia Prudential Regulation Authority (“APRA”) to life insurance Prudential Standards, particularly LPS 110 Capital Adequacy, applicable from 1 January 2013. The amendment aligns terminology by changing ‘solvency’ to ‘capital’. Refer to Note 35 of the Financial Statements.
• AASB 2011-9 Amendments to Australian Accounting Standards – Presentation of Other Comprehensive Income requires that items presented in other comprehensive income are grouped by whether they might be reclassified subsequently to profit or loss and those that will not. Refer to the Statement of Comprehensive Income in the Financial Statements.
All other amendments to standards applicable for the 2013 year end do not impact the Bank.
The following standards and amendments have been identified as those which may impact the Bank and the majority were available for early adoption at 31 August 2013 but have not been applied in these financial statements.
• AASB 9 Financial Instruments was issued and introduces changes in the classification and measurement of financial assets and financial liabilities. This standard becomes mandatory for the Consolidated Entity’s 31 August 2016 financial statements. The potential effects on adoption of the amendments are yet to be determined.
• AASB 10 Consolidated Financial Statements, when it becomes mandatory for the Consolidated Entity’s 31 August 2014 financial statements, will supersede AASB 127 Consolidated and Separate Financial Statements and Interpretation 112 Consolidation – Special Purposes Entities. It introduces a new single control model to assess whether to consolidate an investee. The Consolidated Entity has performed a preliminary review of the Consolidated Entity’s structures and it is not expected to have any material impacts.
• AASB 119 Employee Benefits is amended for changes in accounting and disclosures of defined benefit superannuation plans; definitions of short-term and other long-term employee benefits affecting the measurement of the obligations; and the timing for recognition of termination benefits. The amendments become mandatory for the Consolidated Entity’s 31 August 2014 financial statements with specific transitional requirements. The potential effects on adoption of the amendments are yet to be determined.

13
PRELIMINARY FINAL REPORT
3. SIGNIFICANT ACCOUNTING POLICIES (CONTINUED)
• AASB 11 Joint Arrangements, when it becomes mandatory for the Consolidated Entity’s 31 August 2014 financial statements, introduces a principles based approach to accounting for joint arrangements. If the parties have rights to and obligations for underlying assets and liabilities, the joint arrangement is considered a joint operation and the parties will account for their share of revenue, expenses, assets and liabilities. Otherwise the joint arrangement is considered a joint venture and the parties must use the equity method to account for their interest. The Consolidated Entity has performed a preliminary review of the Consolidated Entity’s structures and it is not expected to have any material impacts.
• AASB 12 Disclosure of Interests in Other entities includes all disclosure requirements relating to an entity’s interests in subsidiaries, joint arrangements, associates and structured entities. The amendments become mandatory for the Consolidated Entity’s 31 August 2014 financial statements. The Consolidated Entity has performed a preliminary review of the Consolidated Entity’s structures and it is not expected to have any material impacts.
• AASB 13 Fair Value Measurement establishes a single source of guidance for determining the fair value of assets and liabilities. AASB 13 also expands the disclosure requirements for assets and liabilities carried at fair value. The amendments become mandatory for the Consolidated Entity’s 31 August 2014 financial statements. Initial adoption is not expected to result in any material impact to the Consolidated Entity.
• AASB 2012-2 Amendments to Australian Accounting Standards – Disclosures – Offsetting Financial Assets and Financial Liabilities requires disclosure of information that will enable users to evaluate the effect or potential effect of netting arrangements on the entity’s financial position. The amendments become mandatory for the Consolidated Entity’s 31 August 2014 financial statements. This is only an impact to disclosure and it is not expected to be material.
The accounting policies set out below have been applied consistently to all periods presented in the consolidated financial report, and have been applied consistently across the Consolidated Entity.
(a) Basis of consolidation
(i) Subsidiaries
Subsidiaries are entities controlled by the Bank. Control exists when the Bank has the power, directly or indirectly, to govern the financial and operating policies of an entity so as to benefit from its activities. In assessing control, potential voting rights that presently are exercisable or convertible are taken into account. The financial statements of subsidiaries are included in the consolidated financial report from the date that control commences until the date that control ceases. In the Bank’s financial statements, investments in subsidiaries are carried at cost.
(ii) Securitisation
The Bank conducts a loan securitisation program whereby mortgage loans are packaged and sold to the REDS Securitisation and Warehouse Trusts (“RMBS Trusts”).
The Bank also securitises Hire Purchase, Chattel Mortgages and Finance Leases which are packaged and sold to REDS EHP Securitisation Trusts
(“REDS EHP Trusts”).
Consolidated Entity
The Consolidated Entity receives the residual income distributed by the
RMBS and REDS EHP Trusts after all payments due to investors and
associated costs of the program have been met and as a result the
Consolidated Entity is considered to retain the risks and rewards of the
RMBS Trusts and as a result do not meet the de-recognition criteria of
AASB 139 Financial Instruments: Recognition and Measurement.
The RMBS Trusts fund their purchase of the loans by issuing floating-
rate debt securities. The securities are issued by the RMBS Trusts.
These are represented as borrowings of the Consolidated Entity
however the Consolidated Entity does not stand behind the capital value
or the performance of the securities or the assets of the RMBS Trusts.
The Consolidated Entity does not guarantee the payment of interest
or the repayment of principal due on the securities. The loans subject
to the securitisation program have been pledged as security for the
securities issued by the RMBS Trusts. The Consolidated Entity is not
obliged to support any losses that may be suffered by investors and
does not intend to provide such support.
To the extent that the Consolidated Entity does not substantially transfer
all the risk and rewards associated with these assets, the level of the
Consolidated Entity’s continuing involvement in these assets continues
to be recognised.
Bank
Interest rate risk from the RMBS and REDS EHP Trusts is transferred
back to the Bank by way of interest rate and basis swaps. Accordingly,
under AASB 139 the original sale of the mortgages from the Bank to the
RMBS Trusts does not meet the de-recognition criteria set out in AASB
139. The Bank continues to reflect the securitised loans in their entirety
and also recognises a financial liability to the RMBS Trusts. The interest
payable on the intercompany financial asset / liability represents the
return on an imputed loan between the Bank and the Trusts and is
based on the interest income under the mortgages, the fees payable by
the Trusts and the interest income or expense not separately recognised
under the interest rate and basis swaps transactions between the Bank
and the Trusts.
All transactions between the Bank and the Trusts are eliminated on
consolidation.
(iii) Transactions eliminated on consolidation
Intra-group balances, and any unrealised gains and losses or income
and expenses arising from intra-group transactions, are eliminated in
preparing the consolidated financial statements.
Unrealised losses are eliminated in the same way as unrealised gains,
but only to the extent that there is no evidence of impairment.
(iv) Derecognition of financial assets and liabilities
Financial assets are derecognised when the contractual rights to
receive cash flows from the assets have expired, or where the Bank
has transferred its contractual rights to receive the cash flows of the
financial assets and substantially all the risks and rewards of ownership.
Financial liabilities are derecognised when they are extinguished, i.e.
when the obligation is discharged, cancelled or expired.

14
Bank of Queensland Limited and its Controlled Entities A.B.N. 32 009 656 740.
3. SIGNIFICANT ACCOUNTING POLICIES (CONTINUED)
(b) Foreign currency
Foreign currency transactions
Transactions in foreign currencies are translated at the foreign exchange rate ruling at the date of the transaction. Monetary assets and liabilities denominated in foreign currencies at the reporting date are translated into Australian dollars at the foreign exchange rate ruling at that date. Non-monetary items in a foreign currency that are measured at historical cost are translated using the exchange rate at the date of the transaction. Foreign exchange differences arising on translation are recognised in the profit and loss.
Where a foreign currency transaction is part of a hedge relationship it is accounted for as above, subject to the Hedge Accounting rules set out in Note 3 (c) Derivatives, financial instruments and hedging.
Foreign operations
The assets and liabilities of foreign operations, including goodwill and fair value adjustments arising on acquisition, are translated to Australian dollars at exchange rates at the reporting date. The income and expenses of foreign operations are translated to Australian dollars at exchange rates at the date of the transaction. Foreign currency differences are recognised in other comprehensive income, and presented in the foreign currency translation reserve in equity. When the settlement of a monetary item receivable from or payable to a foreign operation is neither planned nor likely in the foreseeable future, foreign exchange gains and losses arising from such a monetary item are considered to form part of a net investment in a foreign operation and are recognised in other comprehensive income, and are presented within equity in the foreign currency translation reserve. When a foreign operation is disposed of such that control is lost, the cumulative amount in the translation reserve related to that foreign operation is reclassified to profit or loss as part of the gain or loss on disposal. When the Bank disposes of only part of its interest in a subsidiary that includes a foreign operation while retaining control, the relevant proportion of the cumulative amount is reattributed to non-controlling interests.
(c) Derivatives, financial instruments and hedging
Derivatives
The Consolidated Entity uses derivative financial instruments to hedge its exposure to foreign exchange and interest rate risks arising from operating, financing and investing activities. In accordance with its Treasury policy, the Consolidated Entity can hold derivative financial instruments for trading purposes. Derivatives that do not qualify for hedge accounting are accounted for as trading instruments.
Derivative financial instruments are recognised initially at trade date fair value and are subsequently remeasured at fair value at the reporting date. The gain or loss on re-measurement is recognised immediately in profit or loss in the Income Statement. However, when derivatives qualify for hedge accounting, recognition of any resultant gain or loss depends on the nature of the hedge relationship as discussed below.
The fair value of interest rate swaps is the estimated amount that the Consolidated Entity would receive or pay to terminate the swap at the reporting date, taking into account current interest rates and the current creditworthiness of the swap counterparties. The fair value of forward exchange contracts is their quoted market price at the reporting date, being the present value of the quoted forward price. The fair value of futures contracts is their quoted market price.
(i) Cash flow hedges
Where a derivative financial instrument is designated as a hedge of
the variability of the cash flows of a recognised asset or liability, or a
highly probable forecasted transaction, the effective part of any gain or
loss on the derivative financial instrument is recognised directly in other
comprehensive income and accumulated in reserves in equity. The
ineffective portion of any gain or loss is recognised immediately in profit
or loss in the Income Statement. If a hedge of a forecast transaction
subsequently results in the recognition of a financial asset or a financial
liability, then the associated gains and losses that were recognised
directly in other comprehensive income are reclassified into profit or
loss in the Income Statement in the same period or periods in which the
asset acquired or liability assumed affects the Income Statement (i.e.
when interest income or expense is recognised).
When a hedging instrument expires or is sold, terminated or exercised,
or the Consolidated Entity revokes designation of the hedge relationship
but if the hedged forecast transaction is still expected to occur, the
cumulative gain or loss at that point remains in other comprehensive
income and is recognised in accordance with the above policy when
the transaction occurs. If the hedged transaction is no longer expected
to take place, then the cumulative unrealised gain or loss is recognised
immediately in profit or loss in the Income Statement.
(ii) Net investment hedge
Hedges of net investments in foreign operations are accounted for
similarly to cash flow hedges. Any foreign currency gain or loss on
the hedging instrument relating to the effective portion of the hedge
is recognised in other comprehensive income and accumulated in
reserves in equity. To the extent the hedge is ineffective, a portion is
recognised immediately in the Income Statement within other income or
other expenses.
(iii) Derivatives that do not qualify for hedge accounting
Certain derivative instruments do not qualify for hedge accounting.
Changes in the fair value of any derivative instrument that does not
qualify for hedge accounting are recognised immediately in the Income
Statement and are included in other income.
The Bank has not designated any hedges as fair value hedges.
Financial instruments
The Bank classifies its financial instruments into one of the following
two categories upon initial recognition:
(i) Financial assets at fair value through the profit and loss
Financial assets that are held as part of the Bank’s Trading Book (refer
Note 11) are designated at fair value through the profit and loss. The
Bank manages such financial assets and makes purchase and sale
decisions based on their fair value in accordance with the Bank’s
documented risk management or investment strategy. Upon initial
recognition attributable transaction costs are recognised in profit or
loss in the Income Statement when incurred. Financial instruments
at fair value through the profit and loss are measured at fair value,
and changes therein are recognised in profit or loss in the Income
Statement.

15
PRELIMINARY FINAL REPORT
Subsequent Costs
Subsequent additional costs are only capitalised when it is probable that future economic benefits in excess of the originally assessed performance of the assets will flow to the Bank in future years. Where these costs represent separate components, they are accounted for as separate assets and are separately depreciated over their useful lives. Costs that do not meet the criteria for subsequent capitalisation are expensed as incurred.
Subsequent Measurement
The Bank has elected to use the cost model to measure property, plant and equipment after recognition. The carrying value is the initial cost less accumulated depreciation and any accumulated impairment losses.
Depreciation
Depreciation is charged to the profit or loss in the Income Statement on a straight-line basis over the estimated useful lives of each part of an item of property, plant and equipment. Land is not depreciated.
The estimated useful lives in the current and comparative periods are as follows:
Years
IT equipment 3–10
Plant, furniture and equipment 3–25
Leasehold improvements 10 (or term of lease if less)
The residual value, if not insignificant, is reassessed annually.
(i) Intangible assets
Initial recognition and measurement
Intangible assets are stated at cost less any accumulated amortisation and any impairment losses. Expenditure on internally generated goodwill, research costs and brands is recognised in the Income Statement as an expense as incurred.
Subsequent expenditure
Subsequent expenditure on intangible assets is capitalised only when it increases the future economic benefits embodied in the specific asset to which it relates. All other expenditure is expensed as incurred.
Goodwill
Goodwill is the excess of the cost of acquisition over the fair value of the Bank’s share of the identifiable net assets of the acquired subsidiary. Any goodwill is tested annually for impairment, with any impairment taken directly to the profit or loss in the Income Statement. Refer to Note 3 (j).
Consideration transferred included the fair values of the assets transferred, liabilities incurred by the Consolidated Entity to the previous owners of the acquired entity, and equity interests issued by the Consolidated Entity.
Amortisation
Except for goodwill, amortisation is charged to profit or loss in the Income Statement on a straight-line basis over the estimated useful life of the intangible asset unless the life of the intangible asset is indefinite. Where applicable, intangible assets are amortised from the date they are available for use. The amortisation period and method are reviewed on an annual basis.
3. SIGNIFICANT ACCOUNTING POLICIES (CONTINUED)
(c) Derivatives, financial instruments and hedging (continued)
(ii) Available-for-sale
Assets that are intended to be held for an indefinite period of time but which may be sold in response to changes in interest rates, exchange rates and liquidity needs are classified as available for sale. These assets are initially measured at fair value plus any directly attributable transaction costs, with any changes in fair value other than impairment losses (refer Note 3 (j)), being recognised in other comprehensive income and accumulated in reserves in equity until the asset is sold. Interest income received on these assets is recorded as net interest income and any realised gains or losses recorded in other income in the Income Statement.
(d) Cash and liquid assets Cash and liquid assets comprise cash at branches, cash on deposit and
balances with the Reserve Bank of Australia.
(e) Receivables due from other financial institutions
Receivables due from other financial institutions are recognised and measured at amortised cost and include nostro balances (an account held with a foreign bank usually in a foreign currency) and settlement account balances.
(f) Loans and advances at amortised cost Loans and advances are originated by the Bank and are recognised
upon cash being advanced to the borrower. Loans and advances are initially recognised at fair value plus incremental direct transaction costs and subsequently measured at each reporting date at amortised cost using the effective interest method. Refer to Note 3 (j) for impairment of loans and advances.
(g) Leases Finance Leases
Finance leases in which the Bank is the lessor, are recorded in the Balance Sheet as loans and advances at amortised cost. They are recorded on the commencement of the lease as the net investment in the lease, being the present value of the minimum lease payments.
The Consolidated Entity does not have finance leases as lessee.
Operating Leases
Operating leases in which the Bank is the lessee, are expensed on a straight-line basis over the term of the lease, except where an alternative basis is more representative of the pattern of benefits to be derived from the leased property. When an operating lease terminates before the lease period expires, any payment required to be made to the lessor by way of penalty, is recognised as an expense in the period in which termination takes place.
(h) Property, plant and equipment Recognition and initial measurement
Items of property, plant and equipment are stated at cost or deemed cost less accumulated depreciation and accumulated impairment losses. The cost of self-constructed assets includes the cost of materials, direct labour and an appropriate proportion of production overheads.

16
Bank of Queensland Limited and its Controlled Entities A.B.N. 32 009 656 740.
(ii) Collective impairment provisions
Where no evidence of impairment has been identified for loans and
advances, these loans and advances are grouped together on the
basis of similar credit characteristics for the purpose of calculating a
collective impairment loss. Collective impairment provisions are based
on historical loss experience adjusted for current observable data. The
amount required to bring the collective provision for impairment to its
required level is charged to profit or loss in the Income Statement.
Non-financial assets
Non-financial assets other than deferred tax assets are reviewed for
impairment whenever events or changes in circumstances indicate
that the carrying amount may not be recoverable. For goodwill, and
intangible assets with an indefinite life, the recoverable amount is
estimated each year at the same time.
The Bank conducts an annual internal review of non-financial asset
values to assess for any indicators of impairment. If any indication
of impairment exists, an estimate of the asset’s recoverable amount
is calculated.
For the purposes of assessing impairment, assets are grouped at the
lowest levels for which there are separately identifiable cash inflows
that are largely independent of the cash inflows from other assets or
groups of assets - Cash Generating Units (“CGU”). An impairment loss
is recognised in profit or loss in the Income Statement for the amount
by which the asset’s carrying amount exceeds its recoverable amount.
Impairment losses recognised in respect of CGUs are allocated first to
reduce the carrying amount of goodwill allocated to the units, and then
to reduce the carrying amounts of the other assets in the unit on a pro
rata basis. This grouping is subject to an operating segment ceiling
test. Non-financial assets, other than goodwill, that suffered impairment
are tested for possible reversal of the impairment whenever events
or changes in circumstances indicate that the impairment may have
reversed. An impairment loss in respect of goodwill is not reversed.
Calculation of recoverable amount
The recoverable amount of a non-financial asset or CGU is the greater
of their fair value less costs to sell and value in use. In assessing
value in use, the estimated future cash flows are discounted to
their present value using a pre-tax discount rate that reflects current
market assessments of the time value of money and the risks specific
to the asset.
(k) Financial liabilities
Financial liabilities including current accounts, deposits, subordinated
and convertible notes and term deposits are initially recognised at fair
value plus transaction costs that are directly attributable to the issue of
the financial liability and are subsequently measured at amortised cost
using the effective interest method.
Securitisation set-up costs relating to on-balance sheet assets are
included with securitisation borrowings and amortisation is recorded as
interest expense.
The Bank classifies capital instruments as financial liabilities or equity
instruments in accordance with the substance of the contractual terms
of the instrument.
3. SIGNIFICANT ACCOUNTING POLICIES (CONTINUED)
(i) Intangible assets (continued)
Amortisation (continued)
The amortisation rates used in the current and comparative periods are as follows:
Years
Computer software 5-12
Customer related intangibles and brands 3-10
(j) Impairment
Financial assets
Financial assets other than loans and advances at amortised cost
The Consolidated Entity assesses at the end of each reporting period whether there is objective evidence that a financial asset or group of financial assets, not carried at fair value through profit and loss, is impaired. A financial asset is impaired if objective evidence indicates that a loss event has occurred after the initial recognition of the asset, and that the loss event had a negative effect on the estimated future cash flow of that asset that can be estimated reliably. In the case of equity securities classified as available-for-sale, a significant or prolonged decline in the fair value of a security below its cost is considered as an indicator that the securities are impaired. If any such evidence exists for available-for-sale financial assets, the cumulative loss - measured as the difference between the acquisition cost and the current fair value, less any impairment loss on that financial asset previously recognised in profit or loss in the Income Statement - is reclassified from equity and recognised in profit or loss in the Income Statement as a reclassification adjustment. Impairment losses recognised in profit or loss in the Income Statement on equity instruments classified as available-for-sale are not reversed through the profit or loss in the Income Statement.
For available for sale debt securities, if any increase in the fair value can be related objectively to an event occurring after the impairment loss was recognised, then the impairment loss is reversed through profit or loss in the Income Statement.
Loans and advances and other assets at amortised cost
If there is evidence of impairment for any of the Consolidated Entity’s financial assets carried at amortised cost, the loss is measured as the difference between the asset’s carrying amount and the present value of estimated future cash flows, excluding future credit losses that have not been incurred. The cash flows are discounted at the financial asset’s original effective interest rate. The loss is recognised in profit or loss in the Income Statement.
The Bank uses two methods for calculating impairment of loans and advances:
(i) Specific impairment provisions
Impairment losses on individually assessed loans and advances are determined on a case-by-case basis. If there is objective evidence that an individual loan or advance is impaired, then a specific provision for impairment is raised. The amount of the specific provision is based on the carrying amount of the loan or advance, including the security held against the loan or advance and the present value of expected future cash flows. Any subsequent write-offs for bad debts are then made against the specific provision for impairment.

17
PRELIMINARY FINAL REPORT
(n) Shares
Ordinary Shares
Ordinary shares are classified as equity. Incremental costs directly
attributable to the issue of ordinary shares and share options are
recognised as a deduction from equity, net of any tax effects.
Preference Shares
Preference share capital is classified as equity if it is non-redeemable.
Dividends thereon are recognised as distributions within equity upon
declaration by the Directors.
Preference share capital is classified as a financial liability if it is
redeemable on a specific date. Dividends thereon are recognised as
interest expense in the Income Statement as accrued.
Treasury shares
Ordinary shares of the Bank may be purchased from time to time by
a subsidiary of the Bank authorised to do so under the Bank’s Award
Rights Plan. Where these shares remain unvested to employees they
are treated as treasury shares and deducted from capital as required
by AASB 132 Financial Instruments: Presentation and Disclosure. No
profit or loss is recorded on purchase, sale, issue or cancellation of
these shares.
(o) Revenue
Interest income and expense
Interest income and expense for all interest-bearing financial
instruments are recognised in the profit or loss using the effective
interest rates of the financial assets or financial liabilities to which
they relate.
The effective interest rate is the rate that exactly discounts the
estimated future cash payments or receipts through the expected life of
the financial asset or financial liability (or, where appropriate, a shorter
period, to the net carrying amount of the financial asset or financial
liability). When calculating the effective interest rate, the Bank estimates
cash flows considering all contractual terms of the financial instrument
but not future credit losses. The calculation includes all amounts paid
or received by the Bank that are an integral part of the effective interest
rate, including transaction costs and all other premiums or discounts.
Transaction costs include loan acquisition costs such as commissions
paid to Owner Managed Branches and other intermediaries.
Non-interest income
Non-yield related lending application fees received are recognised as
income when the loan is disbursed or the commitment to lend expires.
Service fees that represent the recoupment of the costs of providing
the service are recognised on an accruals basis when the service
is provided.
3. SIGNIFICANT ACCOUNTING POLICIES (CONTINUED)
(l) Employee benefits
(i) Wages, Salaries and Annual Leave
Liabilities for employee benefits for wages, salaries and annual leave
represents present obligations resulting from employees’ services
provided up to the reporting date, calculated at undiscounted amounts
based on remuneration wage and salary rates that the Bank expects to
pay as at reporting date including related on-costs.
(ii) Long Service Leave
The provision for employee benefits to long service leave represents
the present value of the estimated future cash outflows to be made
resulting from employee’s services provided to reporting date. The
provision is calculated using expected future increases in wage and
salary rates including related on-costs, and expected settlement dates
based on turnover history and is discounted using the rates attached to
national government bonds at reporting date which most closely match
the terms of maturity of the related liabilities.
(iii) Superannuation plan
The Bank contributes to a number of defined contribution superannuation
plans which comply with the Superannuation Industry (Supervision)
Act 1993. Contributions are charged to profit or loss in the Income
Statement as they are made.
(iv) Share based payments
The Bank operates the following equity-settled compensation plans:
• Senior Management Option Plan (“SMOP”) - there are no longer any
outstanding options under the SMOP as at 31 August 2013.
• Award Rights Plan.
The above plans allow Consolidated Entity employees to acquire shares
in the Bank. The fair value of options and rights granted is recognised
as an employee expense with a corresponding increase to the Employee
Benefits Reserve. The fair value is measured at grant date and spread
over the period during which the employees become unconditionally
entitled to the options and rights. The fair value of the options and
rights granted is measured using industry accepted option pricing
methodologies, taking into account the terms and conditions upon
which the options and rights are granted. The fair value of the options
and rights is expensed over the vesting period. Where options and rights
do not vest due to failure to meet a non market condition (e.g. employee
service period) the expense is reversed. Where options and rights do not
vest due to failure to meet a market condition (e.g. Total Shareholder
Return test) the expense is not reversed.
(m) Provisions
A provision is recognised in the Balance Sheet when the Consolidated
Entity has a present legal or constructive obligation as a result of a
past event, and it is probable that an outflow of economic benefits will
be required to settle the obligation. If the effect is material, provisions
are determined by discounting the expected future cash flows at a pre-
tax rate that reflects current market assessments of the time value of
money and, when appropriate, the risks specific to the liability.

18
Bank of Queensland Limited and its Controlled Entities A.B.N. 32 009 656 740.
The Bank recognises deferred tax assets arising from unused tax losses of the tax-consolidated group to the extent that it is probable that future taxable profits of the tax-consolidated group will be available against which the asset can be utilised.
Any subsequent period adjustments to deferred tax assets arising from unused tax losses as a result of revised assessments of the probability of recoverability is recognised by the head entity only.
Nature of tax funding and tax sharing arrangements
The Bank, in conjunction with other members of the tax-consolidated group, has entered into a tax funding agreement which sets out the funding obligations of members of the tax-consolidated group in respect of tax amounts. The tax funding agreement requires payments to / from the head entity equal to the current tax liability (asset) assumed by the head entity and any tax-loss deferred tax asset assumed by the head entity, resulting in the Bank recognising an inter-entity payable (receivable) equal in amount to the tax liability (asset) assumed.
Contributions to fund the current tax liabilities are payable as per the Tax Funding Arrangement and reflect the timing of the head entity’s obligation to make payments for tax liabilities to the relevant tax authorities.
The Bank, in conjunction with other members of the tax-consolidated group, has also entered into a Tax Sharing Agreement (“TSA”). The TSA provides for the determination of the allocation of income tax liabilities between the entities should the head entity default on its tax payment obligations. No amounts have been recognised in the financial statements in respect of this agreement as payment of any amounts under the TSA is considered remote.
Taxation of Financial Arrangements (“TOFA”)
TOFA began to apply to the BOQ Tax Consolidated group on 1 July 2010. The regime aims to align the tax and accounting treatment of financial arrangements.
The Tax Consolidated group made a transitional election to bring pre-existing arrangements into TOFA. The deferred tax in relation to the transitional adjustment that this created is being amortised equally over the four years from 1 September 2010.
(q) Goods and services tax Revenues, expenses and assets are recognised net of the amount
of goods and services tax (“GST”), except where the amount of GST incurred is not recoverable from the Australian Tax Office (“ATO”). In these circumstances the GST is recognised as part of the cost of acquisition of the asset or as part of the expense.
Receivables and payables are stated with the amount of GST included.
The net amount of GST recoverable from, or payable to, the ATO is included as a current asset or liability in the Balance Sheet.
Cash flows are included in the Statements of Cash Flows on a gross basis. The GST components of cash flows arising from investing and financing activities which are recoverable from, or payable to, the ATO are classified as operating cash flows.
(r) Earnings per share Basic earnings per share (“EPS”) is calculated by dividing the net
profit / (loss) attributable to members of the Consolidated Entity for the reporting period, after excluding any costs of servicing equity (other than ordinary shares), by the weighted average number of ordinary shares of the Bank, adjusted for any bonus issues.
3. SIGNIFICANT ACCOUNTING POLICIES (CONTINUED)
(o) Revenue (continued)
Non-interest income (continued)
Lending fees that are considered an integral part of the effective interest
rate are recognised within interest revenue on an effective interest
rate basis.
Fair value gains and losses from financial assets held at fair value are
recognised in the Income Statement immediately.
Dividend income
Dividends are recognised when control of a right to receive consideration
is established.
(p) Income tax
Income tax comprises current and deferred tax. Income tax is recognised
in profit or loss in the Income Statement except to the extent that it
relates to business combinations, or items recognised directly in equity,
or other comprehensive income.
Current tax is the expected tax payable / receivable on the taxable
income for the year, using tax rates enacted or substantially enacted
at the reporting date, and any adjustment to tax payable / receivable in
respect of previous years.
Deferred tax is provided for using the Balance Sheet method, providing
for temporary differences between the carrying amounts of assets and
liabilities for financial reporting purposes and the amounts used for
taxation purposes. The amount of deferred tax provided is based on the
expected manner of realisation or settlement of the carrying amount of
assets and liabilities, using tax rates enacted or substantially enacted at
the reporting date. A deferred tax asset is recognised only to the extent
that it is probable that future taxable profits will be available against
which the asset can be utilised. Deferred tax assets are reviewed at
each reporting date and are reduced to the extent that it is no longer
probable that the related tax benefit will be realised.
Tax Consolidation
The Bank is the head entity in the tax consolidated group comprising all
the Australian wholly-owned subsidiaries. The implementation date for
the tax-consolidated group was 1 September 2003.
Current tax expense / income, deferred tax liabilities and deferred tax
assets arising from temporary differences of the members of the tax-
consolidated group are recognised in the separate financial statements
of the members of the tax-consolidated group using a ‘group allocation’
approach by reference to the carrying amounts in the separate financial
statements of each entity and the tax values applying under tax
consolidation.
Any current tax liabilities (or assets) and deferred tax assets arising from
unused tax losses of the subsidiaries is assumed by the head entity
in the tax consolidated group and are recognised as amounts payable
(receivable) to (from) other entities in the tax-consolidated group in
conjunction with any tax funding arrangement amounts (refer below).
Any difference between these amounts is recognised by the Bank as an
equity contribution, or distribution from the subsidiary.

19
PRELIMINARY FINAL REPORT
(v) Life insurance business
Principles for life insurance
The life insurance operations of the Consolidated Entity are conducted within separate funds as required by the Life Insurance Act 1995 and is reported in aggregate with the Shareholders’ Fund in the Income Statement, Balance Sheet and Statement of Cash Flows of the Consolidated Entity. The life insurance operations of the Consolidated Entity comprise the selling and administration of life insurance contracts.
Life insurance contracts involve the acceptance of significant insurance risk. Insurance risk is defined as significant if, and only if, an insured event could cause an insurer to pay significant additional benefits in any scenario, excluding scenarios that lack commercial substance (i.e. have no discernible effect on the economics of the transaction). Any products sold that do not meet the definition of a life insurance contract are classified as life investment contracts. Insurance contracts include those where the insured benefit is payable on the occurrence of a specified event such as death, injury or disability caused by accident or illness. The insured benefit is either not linked or only partly linked to the market value of the investments held by the Consolidated Entity, and the financial risks are substantially borne by the Consolidated Entity.
Monies held in the statutory fund are subject to distribution and transfer restrictions and other requirements of the Life Insurance Act 1995.
Under AASB 1038, the financial statements must include all assets, liabilities, revenues, expenses and equity, irrespective of whether they are designated as relating to shareholders or policy owners. Therefore, the Consolidated Entity’s financial statements comprise the total of all statutory funds and the Shareholders’ Fund.
Insurance contract liability
Profits of the insurance contract business are brought to account on a Margin on Services (“MoS”) basis in accordance with guidance provided by LPS 1.04: Valuation of Policy Liabilities as determined by APRA. Under MoS, profit is recognised as fees are received and services are provided to policyholders. When fees are received but the service has not been provided, the profit is deferred. Losses are expensed when identified.
Consistent with the principle of deferring unearned profit is the requirement to defer expenditure associated with the deferred profit. MoS permits costs associated with the acquisition of policies to be charged to profit or loss in the Income Statement over the period that the policy will generate profits. Costs may only be deferred to the extent that a policy is expected to be profitable.
Profit arising from life insurance is based on actuarial assumptions, and calculated as the excess of premiums and investment earnings less claims, operating expenses and the amortisation of acquisition costs that will be incurred over the estimated life of the policies. The profit is systematically recognised over the estimated time period the policy will remain in force.
Under MoS, insurance contract liabilities may be valued using an accumulation approach where this does not result in a material difference to the projection approach. The accumulation approach is deemed appropriate by the Directors and the appointed actuary. Under this approach, premiums received are deferred and earned in accordance with the underlying incidence of risk. Costs of acquiring insurance contracts, both direct and indirect, are deferred to the extent that related product groups are expected to be profitable. Where a related product group is not expected to be profitable, the insurance contract liability is increased by the excess of the present value of future expenses over future revenues.
3. SIGNIFICANT ACCOUNTING POLICIES (CONTINUED)
(r) Earnings per share (continued)
Diluted EPS is calculated by dividing the basic EPS earnings, adjusted by
the after tax effect of financing costs associated with dilutive potential
ordinary shares and the effect on revenues and expenses of conversion
to ordinary shares associated with dilutive potential ordinary shares, by
the weighted average number of ordinary shares and dilutive potential
ordinary shares adjusted for any bonus issue.
(s) Business combinations
Acquisitions on or after 1 July 2009
The Consolidated Entity has adopted revised AASB 3 Business
Combinations (2008) and amended AASB 127 Consolidated and
Separate Financial Statements (2008) for business combinations
occurring in the financial year starting 1 July 2009. All business
combinations occurring on or after 1 July 2009 are accounted for by
applying the acquisition method.
For every business combination, the Group identifies the acquirer, which
is the combining entity that obtains control of the other combining
entities or businesses. Control is the power to govern the financial and
operating policies of an entity so as to obtain benefits from its activities.
Contingent Liabilities
A contingent liability of the acquiree is assumed in a business
combination only if such a liability represents a present obligation and
arises from a past event, and its fair value can be measured reliably.
Transactions Costs
Transaction costs that the Group incurs in connection with a business
combination, such as a finders fee, legal fees, due diligence fees and
other professional and consulting fees are expensed as incurred.
(t) Equity reserve for credit losses
The Bank is required by the APRA to maintain a general provision for
credit losses. As the Bank is unable to hold a general provision under
current accounting standards, the Bank has created an equity reserve
for credit losses. The equity reserve for credit losses and the eligible
component of the collective provision for impairment are aggregated for
the purpose of satisfying the APRA requirement for a general reserve for
credit losses.
(u) Investments in joint arrangements
The Bank’s investments in joint venture entities are accounted for
under the equity method of accounting in the consolidated financial
statements. These are entities in which the Bank has joint control over
all operational decisions and activities.
Under the equity method, the investments in joint ventures are
recognised at the cost of acquisition and the carrying value is
subsequently adjusted by the Bank’s share of the joint venture entity’s
profit or loss and movement in post-acquisition reserves, after adjusting
to align the accounting policies with that of the Bank.
The Bank’s share of the joint venture entity’s net profit or loss is
calculated based on the sale of land, together with any tax expense,
and is brought to account based on the proportion of settled land
sales contracts.

20
Bank of Queensland Limited and its Controlled Entities A.B.N. 32 009 656 740.
Policy liabilities
Policy liabilities for life insurance contracts are computed using statistical or mathematical methods, which are expected to give approximately the same results as if an individual liability was calculated for each contract. The computations are made by suitably qualified personnel on the basis of recognised actuarial methods, with due regard to relevant actuarial principles. The methodology takes into account the risks and uncertainties of the particular classes of life insurance business written. The key factors that affect the estimation of these liabilities and related assets are:
• The cost of providing benefits and administering these insurance contracts;
• Mortality and morbidity experience on life insurance products, including enhancements to policyholder benefits; and
• Discontinuance experience, which affects the Bank’s ability to recover the cost of acquiring new business over the lives of the contracts.
In addition, factors such as regulation, competition, interest rates, taxes, securities market conditions and general economic conditions affect the level of these liabilities. Details of specific actuarial policies and methods are set out in Note 35.
(w) Segment reporting The Bank determines and presents operating segments based on the
information that is provided internally to the Managing Director, who is the Bank’s chief operating decision maker.
An operating segment is a component of the Bank that engages in business activities from which it may earn revenues and incur expenses, including revenues and expenses that relate to transactions with any of the Bank’s other components. All operating segments’ operating results are regularly reviewed by the Bank’s Managing Director to make decisions about resources to be allocated to the segment and assess its performance, and for which discrete financial information is available.
Segment results that are reported to the Managing Director include items directly attributable to a segment as well as those that can be allocated on a reasonable basis.
3. SIGNIFICANT ACCOUNTING POLICIES (CONTINUED)
(v) Life insurance business (continued)
Revenue Recognition
Premiums in respect of life insurance contracts are recognised as revenue in the Income Statement from the date of attachment of risk. Premiums with no due date are recognised as revenue on a received basis. Premiums with a regular due date are recognised as revenue on an accruals basis. Unpaid premiums are only recognised as revenue during the days of grace or where secured by the surrender value of the policy and are included in the intergroup balance in the Balance Sheet.
Investment income is recognised on an accruals basis. Realised and unrealised gains and losses are included in the Income Statement as investment income.
Claims expense – insurance contracts
Claims incurred all relate to the provision of services, including the bearing of risks, and are treated as expenses.
Claims are recognised when the liability to the policyholder under the policy contract has been established. Claims recognition is based upon:
• cost estimates for losses reported to the close of the financial year; and
• estimated incurred, but not reported losses, based upon past experience.
Deferred acquisition costs - Life insurance contracts
The fixed and variable costs of acquiring new life insurance business are deferred to the extent that such costs are deemed recoverable from future premiums or policy charges. These costs include commission, policy issue and underwriting costs, certain advertising costs and other sales costs. Acquisition costs deferred are limited to the lesser of the actual costs incurred and the allowance for the recovery of such costs in the premium or policy charges. The actual acquisition costs incurred are recorded in profit or loss in the Income Statement. The value and future recovery of these costs are assessed in determining policy liabilities. This has the effect that acquisition costs are deferred within the policy liability balance and amortised over the period that they will be recovered from premiums or policy charges.
Critical Accounting Judgements and Estimates:
The Consolidated Entity’s insurance subsidiary makes estimates and assumptions that affect the reported amounts of assets and liabilities within the next financial year. Estimates and judgements are continually evaluated and are based on historical experience and other factors, including expectations of future events that are believed to be reasonable under the circumstances. The areas where critical accounting judgements and estimates are applied are noted below.

21
PRELIMINARY FINAL REPORT
Consolidated Bank
2013
$m
2012
$m
2013
$m
2012
$m
Interest income
Loans and advances 2,084.3 2,345.1 1,765.0 1,998.4
Securities at fair value 213.1 251.1 471.6 550.8
Total interest income 2,297.4 2,596.2 2,236.6 2,549.2
Interest expense
Retail deposits 897.9 1,025.8 897.9 1,025.8
Wholesale deposits and borrowings 706.4 918.9 813.2 1,060.9
Total interest expense 1,604.3 1,944.7 1,711.1 2,086.7
Net interest income 693.1 651.5 525.5 462.5
Income from operating activities
Other customer fees and charges 102.1 106.1 101.9 105.6
Share of fee revenue paid to Owner Managed Branches (14.2) (14.8) (14.2) (14.8)
Securitisation income - - 55.7 53.8
Net income from financial instruments and derivatives at fair value 5.4 0.3 3.7 1.0
Commission 12.1 6.2 11.4 10.0
Management fee – controlled entities - - 24.9 25.4
Foreign exchange income – customer based 7.5 7.4 7.5 7.3
Net profit / (loss) on sale of property, plant and equipment 3.2 1.8 0.1 (0.5)
Other income 6.4 4.5 27.8 47.9
122.5 111.5 218.8 235.7
Other operating income 122.5 111.5 218.8 235.7
Net Insurance operating income 40.3 41.3 - -
Total operating income 855.9 804.3 744.3 698.2
4. OPERATING INCOME

22
Bank of Queensland Limited and its Controlled Entities A.B.N. 32 009 656 740.
Consolidated Bank
2013
$m
2012
$m
2013
$m
2012
$m
Operating expenses
Advertising 12.4 14.0 11.8 13.3
Commissions to Owner Managed Branches 8.7 5.6 9.2 6.7
Communications and postage 22.5 18.7 21.3 17.7
Printing and stationery 4.0 5.7 3.8 5.3
Non-lending losses 47.5 14.7 47.5 12.9
Processing costs 25.0 24.2 25.0 24.2
Other operating expenses 15.0 19.9 12.2 16.2
135.1 102.8 130.8 96.3
Administrative expenses
Professional fees 20.4 18.7 17.9 15.9
Directors fees 1.6 1.7 1.1 1.2
Other 8.3 7.4 9.3 8.7
30.3 27.8 28.3 25.8
IT expenses
Data processing 61.1 53.1 58.2 50.2
Amortisation and impairment – computer software (intangible) 18.6 31.9 16.5 29.6
Depreciation – IT equipment 1.5 1.3 0.8 0.7
81.2 86.3 75.5 80.5
Occupancy expenses
Lease rental 21.9 20.4 19.9 18.8
Depreciation - plant, furniture, equipment and leasehold improvements 7.7 8.2 6.5 7.0
Other 2.5 2.5 2.4 2.4
32.1 31.1 28.8 28.2
Employee expenses
Salaries and wages 144.5 134.0 123.7 111.1
Superannuation contributions 11.9 12.5 10.5 10.7
Amounts set aside to provision for employee entitlements 1.7 1.4 1.8 1.0
Payroll tax 8.4 7.9 7.1 6.6
Equity settled transactions 5.2 4.7 4.6 3.8
Other 7.0 5.4 6.4 4.4
178.7 165.9 154.1 137.6
Other
Amortisation – acquired intangibles 8.1 8.7 1.4 1.3
Expenses 465.5 422.6 418.9 369.7
5. EXPENSES

23
PRELIMINARY FINAL REPORT
Consolidated Bank
2013
$m
2012
$m
2013
$m
2012
$m
Current tax expense
Current year 75.3 67.2 58.0 39.4
Adjustments for prior years (3.2) 3.3 (1.8) (3.6)
72.1 70.5 56.2 35.8
Deferred tax expense
Origination and reversal of temporary differences 17.9 (72.7) 12.3 (63.4)
17.9 (72.7) 12.3 (63.4)
Total income tax expense / (benefit) 90.0 (2.2) 68.5 (27.6)
Attributable to:
Continuing operations 90.0 (2.2) 68.5 (27.6)
Deferred tax recognised in equity
Equity raising costs - (3.2) - (3.2)
Cash flow hedge reserve 5.1 (8.1) (1.3) 3.5
Other (1.8) 2.7 (1.7) 3.9
3.3 (8.6) (3.0) 4.2
Numerical reconciliations between tax expense and pre-tax profit / (loss)
Profit / (loss) before tax – continuing operations 275.8 (19.3) 238.2 (31.4)
Profit / (loss) before tax 275.8 (19.3) 238.2 (31.4)
Income tax using the domestic corporate tax rate of 30% (2012: 30%) 82.7 (5.8) 71.5 (9.4)
Increase in income tax expense due to:
Non-deductible expenses 8.3 4.3 4.8 0.3
Decrease in income tax expense due to:
Other (1) (0.4) (4.3) (7.3) (18.7)
90.6 (5.8) 69.0 (27.8)
Under / (Over) provided in prior years (0.6) 3.6 (0.5) 0.2
Income tax expense on pre-tax net profit / (loss) 90.0 (2.2) 68.5 (27.6)
(1) In the Bank, this includes the impact of dividends received from subsidiary Group members which are eliminated at a Group level, other non-assessable income and franking credits.
6. INCOME TAX EXPENSE / (BENEFIT)

24
Bank of Queensland Limited and its Controlled Entities A.B.N. 32 009 656 740.
Bank
2013 2012
Cents per share $m
Percentage franked
%Cents per
share $m
Percentage franked
%
Ordinary shares
Final 2012 dividend paid 8 December 2012 (2011: 2 December 2011) 26 80.2 100% 28 63.1 100%
Interim 2013 dividend paid 27 May 2013 (2012: 25 May 2012) 28 88.5 100% 26 79.0 100%
168.7 142.1
Preference shares
Half-yearly PEPS dividend paid on 15 October 2012 (2012: 17 October 2011) 217 4.3 100% 250 5.0 100%
Prorated PEPS dividend paid on 24 December 2012 (2012: nil) 69 1.3 100% - - -
Half-yearly PEPS dividend paid on 15 April 2013 (2012: 16 April 2012) 179 0.3 100% 234 4.7 100%
Half-yearly CPS dividend paid on 15 April 2013 (2012: nil) 177 5.3 100% - - -
11.2 9.7
Since the end of the financial year, the Directors have declared the following dividends: Cents per share $m
Percentage franked
% Date of payment
- CPS half-yearly dividend 286 8.6 100% 15 October 2013
- Final – ordinary shares 30 95.9 100% 4 December 2013
Bank
2013$m
2012$m
30% franking credits available to shareholders of the Bank for subsequent financial years 106.2 124.9
The above available amounts are based on the balance of the dividend franking account at year-end adjusted for:
(a) franking debits that will arise from the refund of the amount of the current tax assets and franking credits arising from the payment of current tax liabilities;
(b) franking debits that will arise from the payment of dividends subsequent to year-end;
(c) franking credits that will arise from the receipt of dividends recognised as receivables at the year end; and
(d) franking credits that the entity may be prevented from distributing in subsequent years.
The ability to utilise the franking credits is dependent upon there being sufficient available profits to declare dividends.
All the franked dividends paid or declared by the Bank since the end of the previous financial year were franked at the tax rate of 30%.
The balance of the Bank of Queensland Limited dividend franking account at the date of this report, after adjusting for franking credits and debits that will arise on payment of income tax and dividends relating to the year ended 31 August 2013, is $106.2 million credit calculated at the 30% tax rate (2012: $124.9 million credit).
It is anticipated, based on these franking account balances that the Bank will continue to pay fully franked dividends in the foreseeable future.
Dividend reinvestment plan
The Bank of Queensland Dividend Reinvestment Plan provides shareholders with the opportunity to convert all or part of their entitlement to a dividend into new shares. Shares are issued under the Plan at a discount. On 17 April 2013, the Board resolved to change the discount to 1.5% on the arithmetic average of the daily volume weighted average share prices of the Bank’s shares sold on the Australian Securities Exchange during the ten trading day period commencing on the second trading day after the Record Date. All shares issued in comparative periods were at discount of 2.5%. Shares issued are fully paid and rank equally with existing fully paid ordinary shares. The last date for election to participate in the Dividend Reinvestment Plan for 2013 final dividend is 13 November 2013.
7. DIVIDENDS

25
PRELIMINARY FINAL REPORT
Consolidated
2013
cents
2012
cents
Basic earnings per share - Ordinary shares (cents) 58.4 (10.2c)
Diluted earnings per share - Ordinary shares (cents) 57.2 (10.2c)
2013$m
2012$m
Earnings reconciliation
Net profit / (loss) 185.8 (17.1)
Less other equity instrument dividends (1) (2.7) (9.6)
Basic earnings 183.1 (26.7)
Effect of PEPS (1) 2.7 -
Effect of distributions on CPS 11.8 -
Effect of convertible notes 0.6 -
Diluted earnings 198.2 (26.7)
Consolidated
Weighted average number of shares used as the denominator
2013
Number
2012
Number
Number for basic earnings per share
Ordinary shares 313,535,179 263,815,724
Number for diluted earnings per share
Ordinary shares 313,535,179 263,815,724
Effect of award rights 2,414,842 1,343,916
Effect of PEPS 7,360,404 -
Effect of CPS 21,988,604 -
Effect of convertible notes 1,277,927 -
346,576,956 265,159,640
(1) PEPS distribution on an accrual basis.
8. EARNINGS PER SHARE

26
Bank of Queensland Limited and its Controlled Entities A.B.N. 32 009 656 740.
9. CASH AND LIQUID ASSETS
10. DUE FROM OTHER FINANCIAL INSTITUTIONS
11. OTHER FINANCIAL ASSETS
Consolidated Bank
2013
$m
2012
$m
2013
$m
2012
$m
Notes, coin and cash at bank 712.8 522.5 81.8 79.7
Remittances in transit 160.4 148.0 160.4 148.0
873.2 670.5 242.2 227.7
Term deposits 118.5 119.7 23.8 23.5
118.5 119.7 23.8 23.5
At fair value through profit and loss
Floating rate notes and bonds 931.8 894.3 931.8 894.3
Negotiable certificates of deposit 2,812.3 2,650.6 2,812.3 2,650.6
Deposits at call 176.0 289.1 176.0 289.1
Bank accepted bills 377.6 445.2 377.6 445.2
Promissory notes 36.9 345.3 36.9 345.3
4,334.6 4,624.5 4,334.6 4,624.5
Investment securities available for sale
Debt instruments 1,057.0 1,055.0 1,258.6 1,142.5
Unlisted equity instruments 9.8 9.9 9.8 9.9
1,066.8 1,064.9 1,268.4 1,152.4
Total other financial assets 5,401.4 5,689.4 5,603.0 5,776.9

27
PRELIMINARY FINAL REPORT
12. LOANS AND ADVANCES AT AMORTISED COST
Consolidated Bank
2013
$m
2012
$m
2013
$m
2012
$m
Residential property loans – secured by mortgages 18,577.0 17,324.9 18,577.0 17,324.9
Securitised residential property loans – secured by mortgages 7,571.9 8,115.2 7,571.9 8,115.2
Total residential property loans – secured by mortgages 26,148.9 25,440.1 26,148.9 25,440.1
Personal loans 180.7 224.3 180.7 224.3
Overdrafts 387.3 473.9 387.3 473.9
Commercial loans 5,079.4 4,935.9 5,049.3 4,886.4
Leasing finance 3,909.6 3,930.0 - -
Gross loans and advances at amortised cost 35,705.9 35,004.2 31,766.2 31,024.7
Less:
Unearned lease finance income (404.3) (444.1) - -
Collective provision for impairment (137.5) (192.6) (112.3) (165.8)
Specific provisions for impairment (174.8) (220.3) (162.7) (204.3)
Total loans and advances at amortised cost 34,989.3 34,147.2 31,491.2 30,654.6
Loans and advances at amortised cost include the following finance lease receivables for leases of certain property and equipment where the Bank is the lessor:
Consolidated Bank
2013
$m
2012
$m
2013
$m
2012
$m
Gross investment in finance lease receivables:
Less than one year 1,572.6 1,520.2 - -
Between one and five years 2,312.1 2,386.4 - -
More than five years 24.9 23.4 - -
3,909.6 3,930.0 - -
Unearned lease finance income (404.3) (444.1) - -
Net investment in finance leases 3,505.3 3,485.9 - -
The net investment in finance leases comprise:
Less than one year 1,370.0 1,300.7 - -
Between one and five years 2,112.6 2,163.7 - -
More than five years 22.7 21.5 - -
3,505.3 3,485.9 - -

28
Bank of Queensland Limited and its Controlled Entities A.B.N. 32 009 656 740.
12. LOANS AND ADVANCES AT AMORTISED COST (CONTINUED)
Transfer of financial assets
The Bank conducts a loan securitisation program whereby mortgage loans
are transferred to the REDS Trusts.
A subsidiary of the Bank also securitises Hire Purchase, Chattel Mortgages
and Finance Leases which are transferred to REDS EHP Trusts.
The Trusts fund their purchase of the assets by issuing floating-rate
debt securities. The securities are issued by the Trusts. Neither Bank of
Queensland Limited nor any other member of the Bank of Queensland
group in any way stands behind the capital value or performance of the
securitisation programs. The Bank does however provide the securitisation
programs with arm’s length services and facilities including the management
and servicing of the leases securitised.
The Bank has no right to repurchase any of the securitised assets and no obligation to do so, other than in certain circumstances where there is a breach of warranty within 120 days of the sale or when certain criteria are met under the Clean up Provision per the Trust Deed Supplement.
The transferred assets are equitably assigned to the securitisation trusts. The investors in the securities issued by the Trusts have full recourse to the assets transferred to the Trusts.
The Bank receives the residual income distributed by the Trusts after all payments due to investors and associated costs of the program have been met and as a result the Bank is considered to retain the risks and rewards of the Trusts.
The following table sets out the transferred financial assets that did not qualify for derecognition and associated liabilities from conducting the securitisation program.
Consolidated Bank
2013
$m
2012
$m
2013
$m
2012
$m
Transferred financial assets
Loans and advances at amortised cost 4,564.5 5,100.8 4,564.5 5,100.8
Lease receivables 899.1 513.7 - -
5,463.6 5,614.5 4,564.5 5,100.8
Associated financial liabilities
Securitisation liabilities - external investors 5,836.0 5,801.3 - -
Amounts due to controlled entities - - (4,865.8) (5,259.6)
5,836.0 5,801.3 (4,865.8) (5,259.6)
For those liabilities that have recourse only to transferred assets:
Fair value of transferred assets 5,463.6 5,614.5 4,564.5 5,100.8
Fair value of associated liabilities (5,836.0) (5,801.3) (4,865.8) (5,259.6)
(372.4) (186.8) (301.3) (158.8)

29
PRELIMINARY FINAL REPORT
13. PROVISIONS FOR IMPAIRMENT Consolidated Bank
2013
$m
2012
$m
2013
$m
2012
$m
Specific provision:
Balance at the beginning of the year 220.3 173.7 204.3 154.4
Add: Expensed during the year 151.6 227.8 122.6 190.2
Less: Bad debts written off net of recoveries (195.1) (193.2) (162.8) (152.9)
Transfers from collective provision 14.5 34.8 14.5 34.8
Unwind of discount (16.5) (22.8) (15.9) (22.2)
Balance at the end of the year 174.8 220.3 162.7 204.3
Collective provision:
Balance at the beginning of the year 192.6 80.1 165.8 56.8
Add: Expensed / (released) during the year (37.0) 173.2 (35.4) 169.7
Impairment losses written off (3.6) (25.9) (3.6) (25.9)
Transfers to specific provision (14.5) (34.8) (14.5) (34.8)
Balance at the end of the year 137.5 192.6 112.3 165.8
Total provisions for impairment 312.3 412.9 275.0 370.1
Consolidated Bank
2013
$m
2012
$m
2013
$m
2012
$m
Accrued interest 61.1 67.8 59.6 66.2
Other debtors and prepayments 68.0 45.6 217.1 211.7
129.1 113.4 276.7 277.9
14. OTHER ASSETS

30
Bank of Queensland Limited and its Controlled Entities A.B.N. 32 009 656 740.
2013Leasehold
improvementsPlant, furniture and equipment IT equipment
Capital works in progress
Assets under Operating Lease Total
Consolidated $m $m $m $m $m $m
Cost
Balance at the beginning of the financial year 35.5 32.1 33.0 0.3 17.3 118.2
Additions 3.4 1.1 1.6 2.2 8.0 16.3
Disposals (1.2) (0.9) (0.2) - (5.0) (7.3)
Transfers between categories 0.1 0.1 - (0.2) - -
Balance at the end of the financial year 37.8 32.4 34.4 2.3 20.3 127.2
Depreciation
Balance at the beginning of the financial year 20.6 19.8 29.5 - 9.8 79.7
Depreciation charge for the year 5.3 2.4 1.5 - 6.9 16.1
Disposals (0.8) (0.6) (0.2) - (4.8) (6.4)
Balance at the end of the financial year 25.1 21.6 30.8 - 11.9 89.4
Carrying amounts
Carrying amount at the beginning of the financial year 14.9 12.3 3.5 0.3 7.5 38.5
Carrying amount at the end of the financial year 12.7 10.8 3.6 2.3 8.4 37.8
Bank
Cost
Balance at the beginning of the financial year 31.4 31.1 30.0 0.3 - 92.8
Additions 3.4 1.1 1.6 2.2 - 8.3
Disposals (1.2) (0.9) (0.2) - - (2.3)
Transfers between categories 0.1 0.1 - (0.2) - -
Balance at the end of the financial year 33.7 31.4 31.4 2.3 - 98.8
Depreciation
Balance at the beginning of the financial year 18.5 19.7 28.5 - - 66.7
Depreciation charge for the year 4.3 2.2 0.8 - - 7.3
Disposals (0.8) (0.6) (0.2) - - (1.6)
Balance at the end of the financial year 22.0 21.3 29.1 - - 72.4
Carrying amounts
Carrying amount at the beginning of the financial year 12.9 11.4 1.5 0.3 - 26.1
Carrying amount at the end of the financial year 11.7 10.1 2.3 2.3 - 26.4
15. PROPERTY, PLANT AND EQUIPMENT

31
PRELIMINARY FINAL REPORT
2012Leasehold
improvementsPlant, furniture and equipment IT equipment
Capital works in progress
Assets under Operating Lease Total
Consolidated $m $m $m $m $m $m
Cost
Balance at the beginning of the financial year 30.7 28.9 31.9 0.7 12.9 105.1
Additions 5.5 3.5 1.1 0.3 7.4 17.8
Disposals (0.9) (0.7) (0.1) - (3.0) (4.7)
Transfers between categories 0.2 0.4 0.1 (0.7) - -
Balance at the end of the financial year 35.5 32.1 33.0 0.3 17.3 118.2
Depreciation
Balance at the beginning of the financial year 15.3 17.6 28.3 - 7.3 68.5
Depreciation charge for the year 5.7 2.5 1.3 - 5.2 14.7
Disposals (0.4) (0.3) (0.1) - (2.7) (3.5)
Balance at the end of the financial year 20.6 19.8 29.5 - 9.8 79.7
Carrying amounts
Carrying amount at the beginning of the financial year 15.4 11.3 3.6 0.7 5.7 36.7
Carrying amount at the end of the financial year 14.9 12.3 3.5 0.3 7.5 38.5
Bank
Cost
Balance at the beginning of the financial year 26.6 27.9 29.7 0.7 - 84.9
Additions 5.6 3.4 0.4 0.3 - 9.7
Disposals (1.0) (0.7) (0.1) - - (1.8)
Transfers between categories 0.2 0.5 - (0.7) - -
Balance at the end of the financial year 31.4 31.1 30.0 0.3 - 92.8
Depreciation
Balance at the beginning of the financial year 14.3 17.5 27.8 - - 59.6
Depreciation charge for the year 4.6 2.4 0.7 - - 7.7
Disposals (0.4) (0.2) - - - (0.6)
Balance at the end of the financial year 18.5 19.7 28.5 - - 66.7
Carrying amounts
Carrying amount at the beginning of the financial year 12.3 10.4 1.9 0.7 - 25.3
Carrying amount at the end of the financial year 12.9 11.4 1.5 0.3 - 26.1
15. PROPERTY, PLANT AND EQUIPMENT (CONTINUED)

32
Bank of Queensland Limited and its Controlled Entities A.B.N. 32 009 656 740.
Assets Liabilities Net
Consolidated
2013
$m
2012
$m
2013
$m
2012
$m
2013
$m
2012
$m
Accruals 5.0 6.4 - - 5.0 6.4
Capitalised expenditure - - (11.4) (17.6) (11.4) (17.6)
Intangibles - - (0.7) (1.7) (0.7) (1.7)
Leasing - - (0.4) (1.2) (0.4) (1.2)
Property, plant, equipment and software - - (2.7) (4.9) (2.7) (4.9)
Provision for impairment 104.1 125.2 - - 104.1 125.2
Other provisions 10.3 13.7 - - 10.3 13.7
Receivables - - (0.3) (0.2) (0.3) (0.2)
Other 7.0 8.1 (2.8) (2.7) 4.2 5.4
Equity reserves - 0.6 (3.6) - (3.6) 0.6
Tax assets / (liabilities) 126.4 154.0 (21.9) (28.3) 104.5 125.7
Bank
Accruals 3.1 3.0 - - 3.1 3.0
Capitalised expenditure - - (9.6) (19.1) (9.6) (19.1)
Property, plant, equipment and software - - (2.8) (5.0) (2.8) (5.0)
Provision for impairment 91.3 111.0 - - 91.3 111.0
Other provisions 9.6 12.2 - - 9.6 12.2
Receivables - - (0.3) (0.2) (0.3) (0.2)
Other 6.9 7.8 - - 6.9 7.8
Equity reserves - - (2.7) (4.8) (2.7) (4.8)
Tax assets / (liabilities) 110.9 134.0 (15.4) (29.1) 95.5 104.9
16. DEFERRED TAX ASSETS AND LIABILITIESRecognised deferred tax assets and liabilities
Deferred tax assets and liabilities are attributable to the following:

33
PRELIMINARY FINAL REPORT
17. INTANGIBLE ASSETS
Consolidated Bank
2013Goodwill
$m
Customer related
intangibles and brands
$m
Computer software
$mOther$m
Total$m
Goodwill$m
Customer contracts
$m
Computer software
$mOther$m
Total$m
Cost
Balance at the beginning of the financial year 444.4 107.4 203.8 7.4 763.0 8.1 5.0 191.0 2.1 206.2
Additions 43.6 - 29.0 2.1 74.7 - - 28.6 2.1 30.7
Disposals - - (2.0) - (2.0) - - (0.6) - (0.6)
Balance at the end of the financial year 488.0 107.4 230.8 9.5 835.7 8.1 5.0 219.0 4.2 236.3
Amortisation and impairment losses
Balance at the beginning of the financial year - 60.7 144.2 3.5 208.4 - 5.0 140.5 1.4 146.9
Amortisation for the year - 14.6 18.6 1.4 34.6 - - 16.5 1.4 17.9
Balance at the end of the financial year - 75.3 162.8 4.9 243.0 - 5.0 157.0 2.8 164.8
Carrying amounts
Carrying amount at the beginning of the financial year 444.4 46.7 59.6 3.9 554.6 8.1 - 50.5 0.7 59.3
Carrying amount at the end of the financial year 488.0 32.1 68.0 4.6 592.7 8.1 - 62.0 1.4 71.5

34
Bank of Queensland Limited and its Controlled Entities A.B.N. 32 009 656 740.
17. INTANGIBLE ASSETS (CONTINUED)
Consolidated Bank
2012Goodwill
$m
Customer related
intangibles and brands
$m
Computer software
$mOther$m
Total$m
Goodwill$m
Customer contracts
$m
Computer software
$mOther$m
Total$m
Cost
Balance at the beginning of the financial year 444.4 107.4 190.3 7.3 749.4 8.1 5.0 181.0 2.0 196.1
Additions - - 21.6 0.1 21.7 - - 18.1 0.1 18.2
Impairment - - (8.1) - (8.1) - - (8.1) - (8.1)
Balance at the end of the financial year 444.4 107.4 203.8 7.4 763.0 8.1 5.0 191.0 2.1 206.2
Amortisation and impairment losses
Balance at the beginning of the financial year - 46.3 121.6 1.5 169.4 - 5.0 120.2 0.3 125.5
Amortisation for the year - 14.4 24.6 2.0 41.0 - - 22.3 1.1 23.4
Impairment - - (2.0) - (2.0) - - (2.0) - (2.0)
Balance at the end of the financial year - 60.7 144.2 3.5 208.4 - 5.0 140.5 1.4 146.9
Carrying amounts
Carrying amount at the beginning of the financial year 444.4 61.1 68.7 5.8 580.0 8.1 - 60.8 1.7 70.6
Carrying amount at the end of the financial year 444.4 46.7 59.6 3.9 554.6 8.1 - 50.5 0.7 59.3

35
PRELIMINARY FINAL REPORT
17. INTANGIBLE ASSETS (CONTINUED)
Impairment testing of the cash generating units containing goodwill
Consolidated Bank
The aggregate carrying amounts of goodwill are:
2013
$m
2012
$m
2013
$m
2012
$m
BOQ Equipment Finance Limited 12.9 12.9 - -
Orix debtor finance division 8.1 8.1 8.1 8.1
Pioneer Permanent Building Society Limited 24.0 24.0 - -
Home Building Society Ltd 399.4 399.4 - -
Virgin Money (Australia) Pty Ltd 43.6 - - -
488.0 444.4 8.1 8.1
Goodwill on acquisition of all of the above entities has been allocated to the Banking cash generating unit (“CGU”).
The impairment test for goodwill is performed by comparing the CGU’s carrying amount with its recoverable amount. The recoverable amount is based on the CGU’s value in use.
Value in use was determined by discounting the future cash flows generated from the continued use of the CGU and was based on the following assumptions:
• cash flows based on the banking segment’s 3 year projections (2012: 3 years);
• a medium term growth rate of 9% (2012: 9%) for the 7 years subsequent to these projections;
• a terminal value at year 10 based on a long term growth rate of 3% (2012: 3%) and a terminal price earnings multiple of 13.6 (2012: 15.1) times earnings; and
• a pre tax discount rate of 14.8% (2012: 13.8%).
The values assigned to the key assumptions represent management’s assessments of future trends in banking and are based on both external sources and internal sources. Management has identified two key assumptions for which there could be a reasonably possible change that could cause the carrying amount to exceed the recoverable amount for the Banking CGU. The table below shows the amounts these two assumptions are required to move to individually in order for the estimated recoverable amount to be equal to the carrying amount.
2013
%
2012
%
Pre tax discount rate 19 8
Medium term growth rate 4 8
18. DUE TO OTHER FINANCIAL INSTITUTIONS
Consolidated Bank
2013
$m
2012
$m
2013
$m
2012
$m
Amounts payable – at call 201.1 177.8 201.1 177.8

36
Bank of Queensland Limited and its Controlled Entities A.B.N. 32 009 656 740.
19. DEPOSITSConsolidated Bank
2013 $m
2012 $m
2013 $m
2012 $m
Deposits at call 10,252.1 8,134.9 10,306.3 8,216.6
Term deposits 16,857.9 16,753.6 16,890.5 16,788.7
Certificates of deposit 4,588.7 6,283.4 4,588.7 6,283.4
Total 31,698.7 31,171.9 31,785.5 31,288.7
Concentration of deposits:
Retail deposits 23,968.0 22,270.0 24,022.2 22,351.6
Wholesale deposits 7,730.7 8,901.9 7,763.3 8,937.1
Total 31,698.7 31,171.9 31,785.5 31,288.7
20. PROVISIONS Consolidated Bank
2013 $m
2012 $m
2013 $m
2012 $m
Employee benefits (1) 15.4 16.1 13.1 13.3
Directors' retiring allowance (2) - 0.2 - 0.2
Leases 0.8 0.8 0.4 0.4
Product Review (3) 44.6 - 44.6 -
Other (4) 18.1 27.0 10.6 19.6
Total 78.9 44.1 68.7 33.5
(1) Employee benefits provisions consist of annual leave and long service leave entitlements for employees. (2) The Directors’ retiring allowance was frozen as at 31 August 2003 and the final benefit was paid this financial year. (3) Product review provision for customer refunds and review costs. (4) Other provisions include provision for non-lending losses and in the Consolidated Entity, insurance claims reserves.
Movements in provisions Movements in each class of provision during the year, other than employee benefits, are as follows:
Consolidated Bank
2013Leases
$mProduct Review
$mOther $m
Leases $m
Product Review $m
Other $m
Carrying amount at beginning of year 0.8 - 27.0 0.4 - 19.6
Additional provision recognised 0.2 46.0 5.3 0.2 46.0 3.7
Amounts utilised during the year (0.2) (1.4) (14.2) (0.2) (1.4) (12.7)
Carrying amount at end of year 0.8 44.6 18.1 0.4 44.6 10.6
Consolidated Bank
2012Leases
$mRestructuring
$mOther $m
Leases $m
Restructuring $m
Other $m
Carrying amount at beginning of year 0.4 0.8 13.0 0.1 0.8 7.2
Additional provision recognised 0.5 0.3 15.8 0.4 0.3 14.2
Amounts utilised during the year (0.1) (1.1) (1.8) (0.1) (1.1) (1.8)
Carrying amount at end of year 0.8 - 27.0 0.4 - 19.6

37
PRELIMINARY FINAL REPORT
21. BORROWINGS INCLUDING SUBORDINATED NOTES
The Consolidated Entity recorded the following movements on borrowings including subordinated notes:
Securitisation liabilities (1)
$m
EMTN Program
$m
ECP Program
$m
Borrowings including
subordinated notes (2)
$m
Convertible Preference Shares (3)
$m
Syndicated Loan$m
Total$m
Year ended 31 August 2013
Balance at beginning of year 5,792.6 33.0 169.6 500.1 - 192.8 6,688.1
Proceeds from issues 3,395.8 63.8 1,535.6 - 119.9 - 5,115.1
Exchange to CPS - - - - 180.1 - 180.1
Repayments (3,461.0) (11.0) (1,341.4) (229.9) - - (5,043.3)
Deferred establishment costs (8.6) - - - (8.1) - (16.7)
Amortisation of deferred costs 5.5 - - - 0.9 0.8 7.2
Foreign exchange translation 99.8 10.5 66.6 - - 29.5 206.4
Balance at end of the year 5,824.1 96.3 430.4 270.2 292.8 223.1 7,136.9
Securitisation liabilities (1)
$m
EMTN Program
$m
ECP Program
$m
Borrowings including
subordinated notes (2)
$m
Syndicated Loan$m
Total$m
Year ended 31 August 2012
Balance at beginning of year 5,525.6 20.6 378.4 541.2 185.2 6,651.0
Proceeds from issues 1,950.4 22.0 911.6 50.8 - 2,934.8
Repayments (1,667.1) (10.0) (1,127.0) (91.9) - (2,896.0)
Deferred establishment costs (4.0) - - - - (4.0)
Amortisation of deferred costs 5.1 - - - - 5.1
Foreign exchange translation (17.4) 0.4 6.6 - 7.6 (2.8)
Balance at end of the year 5,792.6 33.0 169.6 500.1 192.8 6,688.1
(1) Securitisation liabilities are secured by a floating charge over securitised assets for amounts owing to noteholders and any other secured creditors of the securitisation vehicles.
(2) Includes Convertible Notes which were issued in three tranches of $60 million (“Tranche 1”), $45 million (“Tranche 2”) and $45 million (“Tranche 3”), and are cumulative, convertible, subordinated notes due June 2020, and pay, subject to a solvency condition, a monthly coupon equal to the 30 day bank bill rate plus 400 basis points. The Convertible Notes are unlisted. Tranche 2 and Tranche 3 were redeemed during the 2012 financial year and Tranche 1 in the current financial year.
(3) 3,000,000 CPS were issued on 24 December 2012. CPS are fully-paid, perpetual, convertible, unguaranteed and unsecured preference shares with preferred, discretionary, non-cumulative dividends. CPS will mandatorily convert into ordinary shares on 15 April 2020. The Bank is entitled to convert, redeem or transfer some or all of the CPS on the optional conversion/redemption date of 15 April 2018 subject to prior written approval from APRA. The Bank is also entitled to convert, redeem or transfer some or all of the CPS on the occurrence of a regulatory event or tax event and in addition, conversion of the CPS into ordinary shares must occur immediately following the occurrence of a capital trigger event or a non-viability trigger event. CPS rank for payment of capital ahead of ordinary shareholders, equally with PEPS and other securities or instruments ranking equally with CPS, but behind all other securities or instruments ranking ahead of CPS, and behind all depositors and other creditors.

38
Bank of Queensland Limited and its Controlled Entities A.B.N. 32 009 656 740.
21. BORROWINGS INCLUDING SUBORDINATED NOTES (CONTINUED)
The Bank recorded the following movements on borrowings including subordinated notes:
EMTN Program
$m
ECP Program
$m
Borrowings including
subordinated notes (2)
$m
Convertible Preference Shares (3)
$m
Syndicated Loan$m
Total$m
Year ended 31 August 2013
Balance at beginning of year 33.0 169.6 499.9 - 192.8 895.3
Proceeds from issues 63.8 1,535.6 - 119.9 - 1,719.3
Exchange to CPS - - - 180.1 - 180.1
Repayments (11.0) (1,341.4) (229.7) - - (1,582.1)
Deferred establishment costs - - - (8.1) - (8.1)
Amortisation of deferred costs - - - 0.9 0.8 1.7
Foreign exchange translation 10.5 66.6 - - 29.5 106.6
Balance at end of the year 96.3 430.4 270.2 292.8 223.1 1,312.8
EMTN Program
$m
ECP Program
$m
Borrowings including
subordinated notes (2)
$m
Syndicated Loan$m
Total$m
Year ended 31 August 2012
Balance at beginning of year 20.6 378.4 539.6 185.2 1,123.8
Proceeds from issues 22.0 911.6 49.9 - 983.5
Repayments (10.0) (1,127.0) (89.6) - (1,226.6)
Foreign exchange translation 0.4 6.6 - 7.6 14.6
Balance at end of the year 33.0 169.6 499.9 192.8 895.3
22. CAPITAL AND RESERVES
(a) Ordinary shares Consolidated Bank
2013 Number
2012 Number
2013 Number
2012 Number
Movements during the year
Balance at the beginning of the year – fully paid 308,797,525 225,369,848 308,797,525 225,369,848
Dividend reinvestment plan 7,809,654 8,991,342 7,809,654 8,991,342
Institutional placement and entitlement offer (1) - 47,690,067 - 47,690,067
Retail entitlement offer (1) - 26,746,268 - 26,746,268
Virgin Money (Australia) Pty Limited acquisition (2) 3,203,115 - 3,203,115 -
Balance at the end of the year – fully paid 319,810,294 308,797,525 319,810,294 308,797,525
Treasury shares (included in ordinary shares above)
Balance at the beginning of the year 867,293 906,311 304,580 108,000
Net acquisitions and disposals during the year (704,922) (39,018) (274,729) 196,580
Balance at the end of the year 162,371 867,293 29,851 304,580
(1) In the prior year, the Bank completed a capital raising by way of Institutional Placement, Institutional Entitlement and Retail Entitlement offers of full paid ordinary shares at an issue price of $6.05 per share.
(2) On 30 April 2013, the Bank acquired 100% of Virgin Money (Australia) Pty Limited for consideration of $42.6 million. $30.6 million of new shares were issued in two tranches (Tranche 1 - 1,585,353 and Tranche 2 -
1,617,762) as part of the acquisition consideration. Fair value of the ordinary shares issued was based on the listed share price of BOQ at 30 April 2013 of $10.24 per share.
Terms and conditions Holders of ordinary shares are entitled to receive dividends as declared from time to time and are entitled to one vote per share at shareholders’ meetings.
In the event of winding up of the Bank, ordinary shareholders rank after preference shareholders and creditors and are fully entitled to any residual proceeds of liquidation.

39
PRELIMINARY FINAL REPORT
22. CAPITAL AND RESERVES (CONTINUED)
(b) Perpetual Equity Preference Shares (“PEPS”)
Consolidated Bank
2013 Number
2012 Number
2013 Number
2012 Number
Balance at beginning of the year – fully paid 2,000,000 2,000,000 2,000,000 2,000,000
Exchange to CPS (1,801,339) - (1,801,339) -
Redemption of PEPs (198,661) - (198,661) -
Balance at end of the year – fully paid - 2,000,000 - 2,000,000
Terms and conditions
The PEPS are fully paid, redeemable, perpetual, non-cumulative preference shares. Dividends are non-cumulative and payable semi-annually at the discretion of Directors and subject to certain conditions being met, such as sufficient distributable profit. The Bank is entitled to redeem, buy-back or cancel the preference shares on a call date (5 years from issue date) and each subsequent dividend payment date, subject to the prior written approval from the APRA. The Bank is also entitled to redeem the preference shares on the occurrence of a regulatory event, tax event or a control event. The preference shareholders have no right to demand redemption of preference shares but they are entitled to receive a liquidation amount being equal to the issue price plus all dividends due but unpaid. PEPS are subordinate to all creditors and depositors, and rank ahead of ordinary shareholders for return of capital on liquidation.
The Bank redeemed all remaining PEPS on issue on 15 April 2013 in accordance with the PEPS terms of issue. The Bank paid a pro-rata dividend on 24 December 2012. The remaining 198,661 PEPS were redeemed at the redemption price of $100 per PEPS and the final PEPS dividend paid on 15 April 2013.
(c) Nature and purpose of reserves
Employee benefits reserve
The employee equity benefits reserve is used to record the value of share based payments provided to employees, including key management personnel, as part of their remuneration. Refer to Note 38 for further details of these plans.
Equity reserve for credit losses
Refer to significant accounting policies Note 3 (t).
Available-for-sale reserve
Changes in the fair value of investments, such as bonds and floating rate notes classified as available-for-sale financial assets, are recognised in other comprehensive income as described in Note 3(c) and accumulated in a separate reserve within equity. Amounts are reclassified to profit or loss when the associated assets are sold or impaired.
Cash flow hedge reserve
The hedging reserve is used to record gains or losses on a hedging instrument in a cash flow hedge that are recognised in other comprehensive income, as described in Note 3(c). Amounts are reclassified to profit or loss when the associated hedged transaction affects profit or loss.
Translation reserve
As described in Note 3(b) and (c), the translation reserve comprises all foreign currency differences arising from the translation of the financial statements of foreign operations, as well as from the movement in fair value of derivatives that hedge the Bank’s net investment in a foreign subsidiary.
23. SEGMENT REPORTING
Segment informationThe Bank has determined and presented the following two segments based on information provided to the Chief Operating Decision Maker.
Banking Retail banking, commercial, personal, small business loans, equipment and debtor finance, savings and transaction accounts and treasury.
Insurance Life insurance and income protection insurance.
Management monitors the operating results of its business units separately for the purpose of making decisions about resource allocation and performance assessment. Segment performance is evaluated based on operating profit or loss which in certain respects is measured differently from operating profit or loss in the consolidated financial statements. Income taxes are managed within the individual operating segments and thus disclosed this way.

40
Bank of Queensland Limited and its Controlled Entities A.B.N. 32 009 656 740.
23. SEGMENT REPORTING (CONTINUED)
Transfer prices between operating segments are on an arm’s length basis in a manner similar to transactions with third parties.
No revenue from transactions with a single external customer or counterparty amounted to 10% or more of the Bank’s total revenue in 2013 or 2012.
(a) Financial information about reportable segments
The following table presents income and profit / (loss) and certain asset and liability information regarding the Bank’s operating segments.
Banking Insurance Segment Total
2013$m
2012 (1)
$m2013$m
2012 (1)
$m2013$m
2012 (1)
$m
Income
External 816.3 763.4 39.6 40.9 855.9 804.3
Inter-segment 5.7 6.6 - - 5.7 6.6
Total operating income 822.0 770.0 39.6 40.9 861.6 810.9
Segment profit / (loss) before income tax 249.6 (43.6) 27.0 26.4 276.6 (17.2)
Income tax expense / (benefit) 82.2 (7.9) 7.8 6.3 90.0 (1.6)
Segment profit / (loss) after income tax 167.4 (35.7) 19.2 20.1 186.6 (15.6)
Results
Interest income 2,297.5 2,598.6 - - 2,297.5 2,598.6
Interest expense 1,602.5 1,944.7 1.9 2.4 1,604.4 1,947.1
Depreciation and amortisation 27.4 40.7 0.4 0.7 27.8 41.4
Impairment losses 114.6 401.0 - - 114.6 401.0
Assets 42,415.5 41,633.5 145.4 159.7 42,560.9 41,793.2
Liabilities 39,621.5 38,764.6 118.5 126.5 39,740.0 38,891.1
Information provided to the Chief Operating Decision Maker no longer includes the BOQ Finance segment separately from Banking and Insurance. Therefore, the BOQ Finance segment has been removed and included within the Banking segment.
(b) Reconciliations
2013$m
2012 (1)
$m2013$m
2012 (1)
$m
Revenue Profit/(loss) before tax
Segment total 861.6 810.9 276.6 (17.2)
Elimination of inter-segment revenue (5.7) (6.6) - -
Less other consolidation eliminations - - (0.8) (2.1)
Consolidated total 855.9 804.3 275.8 (19.3)
Assets Liabilities
Segment total 42,560.9 41,793.2 39,740.0 38,891.1
Elimination of inter-segment bank accounts (33.9) (36.2) (33.9) (36.2)
Less other consolidation eliminations 1.3 1.0 4.4 3.9
Consolidated total 42,528.3 41,758.0 39,710.5 38,858.8
(1) The prior year has been restated so that the amounts are comparable to the current year.
(c) Geographical segments
The Consolidated Entity’s business segments operate principally in Australia.

41
PRELIMINARY FINAL REPORT
24. RISK MANAGEMENT
The Consolidated Entity adopts a “managed risk” approach to its banking and insurance activities. As such, the articulation of a risk aware culture is prevalent
throughout the Consolidated Entity’s credit, liquidity, market, operational, insurance risk and compliance policies and procedures. The Board has adopted policies
in relation to the assessment, management and monitoring of these risks and ownership of the frameworks within which these risks are managed reside with the
Chief Risk Officer.
The Chief Risk Officer contributes towards the achievement of the Consolidated Entity’s corporate objectives through the operationalisation and progressive
development of the Bank’s risk management function. In particular, improvement of the risk management function is focussed in a number of areas:
1. the efficiency and effectiveness of the Consolidated Entity’s credit, liquidity, market, operational risk and compliance management process controls and
policies to support improved competitive advantage, support growth and enable improved cost controls;
2. to provide management and the Board with risk reporting that contributes to the further development of sound corporate governance standards;
3. to maintain regulatory compliance in line with regulators’ expectations;
4. to provide a sound basis from which the Bank can progress to the required compliance level under the Basel II accord; and
5. to contribute to the Consolidated Entity achieving risk based performance management.
Group Risk is an independent function and is responsible for providing the framework, policies and procedures for managing credit, liquidity, market, operational
risk and compliance throughout the Group. Policies are set in line with the governing strategy and risk guidelines set by the Board.
Monitoring
The Consolidated Entity’s enterprise risk management framework incorporates active management and monitoring of a range of risks including (but not limited to):
1. Market
2. Credit
3. Operational
4. Liquidity
5. Insurance
(a) Market risk
Market risk is the risk that movements in market rates and prices will result in profits or losses to the Bank. The objective of market risk management is to manage
and control market risk.
(i) Interest Rate Risk in the Banking Book
The operations of the Bank are subject to the risk of interest rate fluctuations as a result of mismatches in the timing of the repricing of interest rates on the Bank’s
assets and liabilities.
It is the principal objective of the Bank’s asset/liability management process to maximise levels of net interest income whilst limiting the effects of volatile and
unpredictable movements in interest rates. To achieve these objectives, the Bank uses derivative financial instruments, principally interest rate swaps, forward rate
agreements and futures.
The current policy of the Bank is to eliminate market risk in the Balance Sheet where practical and to consciously establish specific positions within conservative
limits for changes in value of the residual risk.
A 1% parallel shock in the yield curve is used to determine the potential adverse change in net interest income in the ensuing 12 month period. This is a standard
risk quantification measure used by the Bank. A number of supplementary scenarios comprising variations in size and duration of interest rate moves together with
changes in the balance sheet size and mix are also used to provide a range of net interest income outcomes.
The figures in the table below indicate the potential increase in net interest income for an ensuing 12 month period. The change is expressed as a percentage and
dollar impact of expected net interest earnings based on a 1% parallel positive shock.
Consolidated and Bank
2013
%
2012
%
2013
$m
2012
$m
Exposure at the end of the year 0.90 0.61 6.2 4.9
Average monthly exposure during the year 0.78 0.91 5.4 7.3
High month exposure during the year 1.41 1.88 9.7 15.3
Low month exposure during the year 0.16 0.06 1.1 0.5

42
Bank of Queensland Limited and its Controlled Entities A.B.N. 32 009 656 740.
24. RISK MANAGEMENT (CONTINUED)
(a) Market risk (continued)(ii) Foreign exchange risk
It is the Bank’s policy not to carry material foreign exchange rate exposures. At balance date there are no material foreign exchange rate exposures.
The Bank uses cross currency swaps and foreign exchange forwards to hedge its exchange rate exposures arising from borrowing off-shore in foreign currencies. The Bank uses forward foreign exchange contracts to hedge potential exchange rate exposures created by customer-originated foreign currency transactions.
The Bank’s investment in its New Zealand subsidiary is hedged by forward foreign exchange contracts which mitigate the currency risk arising from the subsidiary’s net assets.
(iii) Traded market risk
Market risks attributable to trading activities are primarily measured using a parametric Value-at-Risk (“VaR”) based on historical data. BOQ estimates VaR as the potential loss in earnings from adverse market movements and is calculated over a 1-day time horizon to a 99% confidence level using 2 years of historical data. VaR takes account of all material market variables that may cause a change in the value of the trading portfolio. Although an important tool for the measurement of market risk, the assumptions underlying the model have some limitations:
• VaR typically understates the losses that may occur beyond the 99% confidence level;
• The reliance on historical data may prove insufficient to predict the severity of possible outcomes; and
• A 1-day holding period assumes that it is possible to hedge or dispose of positions within that period. For certain illiquid assets or in certain market situations this might not be possible.
As VaR is a statistical measure and only attempts to cover losses to a 99% confidence level, the Bank supplements this analysis with stress testing. Stress testing attempts to adequately assess the risks inherent in its trading activities by applying appropriate scenario analyses, whilst not addressing the likelihood of those outcomes.
As an overlay, the individual market risks of interest rate, FX, credit and equity sensitivities are monitored and measured against limits delegated by the ALCO.
The portfolio (interest rate, FX, credit and equity) VaR for the Bank’s trading portfolio for the year was as follows:
Trading VaR
2013
$m
2012
$m
Average 0.80 1.59
Maximum 1.67 2.61
Minimum 0.35 0.96
(b) Credit risk Credit risk arises in the business from lending activities, the provision of guarantees including letters of credit and commitments to lend, investment in bonds and notes, financial market transactions and other associated activities. Credit risk is the potential loss arising from the possibility that customers or counterparties fail to meet contractual payment obligations to the Bank as they fall due.
The Board of Directors have implemented a structured framework of systems and controls to monitor and manage credit risk comprising:
• documented credit risk management principles which are disseminated to all staff involved with the lending process;
• documented policies;
• a process for approving risk, based on tiered delegated approval authorities, whereby the largest exposures are assessed by a committee consisting of Group Executives and senior risk managers chaired by the Chief Risk Officer;
• risk grading the Bank’s commercial exposures for facilities greater than $100,000 based on items inclusive of financial performance and stability, organisational structure, industry segment and security support. Exposures within this segment of the portfolio are generally subject to annual review including reassessment of the assigned risk grade;
• an automated scorecard approval model for the Bank’s retail portfolio inclusive of home loans, personal loans, and lines of credit. This model is supported by experienced Risk Assessment Managers; and
• a series of management reports detailing industry concentrations, counterparty concentrations, loan grades and security strength ratings.

43
PRELIMINARY FINAL REPORT
24. RISK MANAGEMENT (CONTINUED)
(b) Credit risk (continued)The Consolidated Entity uses derivative financial instruments to hedge its exposure to foreign exchange and interest rate risks arising from operating, financing and investing activities. In accordance with its treasury policy, the Consolidated Entity can hold derivative financial instruments for trading purposes. Credit risk on derivative contracts used for these purposes is minimised as counterparties are recognised financial intermediaries with acceptable credit ratings determined by a recognised rating agency.
Maximum exposure to credit risk
The amounts disclosed are the maximum exposure to credit risk, before taking account of any collateral held or other credit enhancements. For financial assets recognised on the Balance Sheet, the exposure to credit risk equals their carrying amount. For customer commitments, the maximum exposure to credit risk is the full amount of the committed facilities as at the reporting date.
The carrying amount of the Consolidated Entity’s and Bank’s financial assets represents the maximum credit exposure. The maximum exposure to credit risk at the reporting date was:
Consolidated Bank
2013 $m
2012 $m
2013 $m
2012 $m
Cash and liquid assets 873.2 670.5 242.2 227.7
Due from other financial institutions 118.5 119.7 23.8 23.5
Other financial assets (including accrued interest) 5,462.5 5,757.2 5,662.6 5,843.1
Derivative financial instruments 260.4 276.1 234.0 276.1
Financial assets other than loans and advances 6,714.6 6,823.5 6,162.6 6,370.4
Gross loans and advances at amortised cost 35,705.9 35,004.2 31,766.2 31,024.7
Total financial assets 42,420.5 41,827.7 37,928.8 37,395.1
Customer commitments (1) 1,470.3 1,341.8 921.7 839.6
Total potential exposure to credit risk 43,890.8 43,169.5 38,850.5 38,234.7
(1) Refer to Note 30(b) for full details of customer commitments.
Distribution of financial assets by credit quality
Consolidated Bank
2013 $m
2012 $m
2013 $m
2012 $m
Neither past due or impaired
Gross loans and advances at amortised cost 33,958.4 32,993.3 30,134.1 29,143.3
Financial assets other than loans and advances 6,714.6 6,823.5 6,162.6 6,370.4
Past due but not impaired
Gross loans and advances at amortised cost 1,365.9 1,485.6 1,269.7 1,380.9
Impaired
Gross loans and advances at amortised cost 381.6 525.3 362.4 500.5
42,420.5 41,827.7 37,928.8 37,395.1
There is no individual exposure included in impaired assets which exceeds 5.0% of shareholders’ equity (2012: nil).
The Bank holds collateral against loans and advances to customers in the form of mortgage interest over property, other registered securities over assets and guarantees and mortgage insurance. To mitigate credit risk, the Bank can take possession of the security held against the loans and advances as a result of customer default. To ensure reduced exposure to losses, the collateral held by the Bank as mortgagee in possession is realised promptly.

44
Bank of Queensland Limited and its Controlled Entities A.B.N. 32 009 656 740.
24. RISK MANAGEMENT (CONTINUED)
(b) Credit risk (continued)Estimates of fair value are based on the value of collateral assessed at the time of borrowing, and generally are not updated except when a loan is individually assessed as impaired. An estimate of the collateral held against past due but not impaired and impaired loans and advances at amortised cost is outlined below. It is not practicable to determine the fair value of collateral held against performing loans.
Consolidated Bank
2013 $m
2012 $m
2013 $m
2012 $m
Held against past due but not impaired assets 1,679.0 1,777.9 1,608.1 1,710.6
Held against impaired assets 260.4 349.3 252.1 337.4
Credit quality
The credit quality of financial assets has been determined based on Standard and Poors credit ratings, APRA risk weightings and the Bank’s standard risk grading.
The table below presents an analysis of the credit quality of financial assets:
Consolidated
2013 $m
2012 $m
Gross loans and advances Gross loans and advances
Retail Commercial
Total loans and advances
Financial assets other than loans
and advances Retail Commercial
Total loans and advances
Financial assets other than loans
and advances
High Grade 22,172.9 2,231.4 24,404.3 6,704.8 21,384.4 1,896.8 23,281.2 6,813.6
Satisfactory 3,618.4 5,143.0 8,781.1 - 3,616.1 5,469.0 9,085.1 -
Weak 457.4 1,553.5 2,052.2 9.8 590.1 1,500.1 2,090.2 9.9
Unrated (1) 468.3 31.1 468.3 - 547.7 - 547.7 -
26,717.0 8,988.9 35,705.9 6,714.6 26,138.3 8,865.9 35,004.2 6,823.5
Bank
2013 $m
2012 $m
Gross loans and advances Gross loans and advances
Retail Commercial
Total loans and advances
Financial assets other than loans
and advances Retail Commercial
Total loans and advances
Financial assets other than loans
and advances
High Grade 22,172.9 1,525.3 23,698.2 5,932.1 21,384.4 1,651.6 23,036.0 6,273.1
Satisfactory 3,618.3 2,783.7 6,391.7 142.3 3,616.1 2,481.7 6,097.8 59.5
Weak 457.4 709.2 1,208.0 88.2 590.1 753.1 1,343.2 37.8
Unrated (1) 468.3 31.1 468.3 - 547.7 - 547.7 -
26,716.9 5,049.3 31,766.2 6,162.6 26,138.3 4,886.4 31,024.7 6,370.4
(1) Those items that remain unrated for gross loans and advances represent mainly loans and advances, which although not secured, are not determined to be weak. Any loans which have been rated, have been included in the appropriate category.

45
PRELIMINARY FINAL REPORT
24. RISK MANAGEMENT (CONTINUED)
(b) Credit risk (continued)
Loans and advances which were past due but not impaired
Loans which are 90 or more days past due are not classified as impaired assets where the estimated net realisable value of the security is sufficient to cover the repayment of all principal and interest amounts due.
Consolidated Bank
2013 $m
2012 $m
2013 $m
2012 $m
Less than 30 days - Retail 611.4 651.7 611.4 651.7
- Commercial 231.5 233.2 159.8 157.9
31 to 90 days - Retail 176.2 162.8 176.2 162.8
- Commercial 76.0 91.3 56.5 68.1
More than 90 days - Retail 152.2 231.8 152.2 231.8
- Commercial 118.6 114.8 113.6 108.6
1,365.9 1,485.6 1,269.7 1,380.9
Concentration of exposure for gross loans and advances at amortised cost
Concentration of credit risk exists when a number of counterparties are engaged in similar activities, or operate in the same geographical areas or industry sectors and have similar economic characteristics so that their ability to meet contractual obligations is similarly affected by changes in economic, political or other conditions.
The Bank monitors concentrations of credit risk by geographical location for loans and advances. An analysis of these concentrations of credit risk at the reporting date is shown below:
Consolidated Bank
Geographical concentration of credit risk for loans and advances at amortised cost (before provisions and unearned income):
2013 $m
2012 $m
2013 $m
2012 $m
Queensland 20,580.5 20,893.2 19,169.4 19,348.4
New South Wales 5,387.8 4,631.1 4,517.2 3,864.0
Victoria 5,659.0 5,477.1 4,849.3 4,653.9
Northern Territory 237.2 182.9 231.7 176.1
Australian Capital Territory 347.2 413.5 227.0 222.0
Western Australia 2,885.1 2,807.4 2,458.7 2,437.2
South Australia 213.8 205.4 120.3 102.5
Tasmania 196.9 223.8 192.6 220.6
International (New Zealand) 198.4 169.8 - -
35,705.9 35,004.2 31,766.2 31,024.7

46
Bank of Queensland Limited and its Controlled Entities A.B.N. 32 009 656 740.
24. RISK MANAGEMENT (CONTINUED)
(c) Liquidity riskLiquidity risk arises from the possibility that the Bank is unable to meet its financial obligations as they fall due. Liquidity risk is managed through a series of detailed policies, including the management of cash flow mismatches, the maintenance of a stable, core retail deposits base, the diversification of the funding base and the retention of adequate levels of high quality liquid assets.
The Consolidated Entity manages liquidity risk by maintaining adequate reserves and facilities by continuously monitoring forecast and actual cash flows, matching maturity profiles of financial assets and liabilities and liquidity scenario analysis.
Consolidated 2013
Carrying amount
$mAt Call
$m3 mths or less
$m3 to 12 mths
$m1 to 5 years
$mOver 5 years
$mPolicyholder
$m
Total contractual cash flows
$m
Financial liabilities
Due to other financial institutions 201.1 201.1 - - - - - 201.1
Deposits 31,698.7 13,156.5 13,627.5 6,601.0 1,657.9 - - 35,042.9
Derivative financial instruments (1) 3.4 - 1.4 1.2 1.1 - - 3.7
Accounts payable and other liabilities 362.0 - 362.0 - - - - 362.0
Securitisation liabilities (2) 5,824.1 - 868.4 1,087.7 3,379.9 1,227.7 - 6,563.7
Borrowings including subordinated notes 1,312.8 - 313.7 474.5 672.6 - - 1,460.8
Insurance policy liabilities 72.5 - - - - - 72.5 72.5
Total 39,474.6 13,357.6 15,173.0 8,164.4 5,711.5 1,227.7 72.5 43,706.7
Derivative financial instruments (hedging relationship)
Contractual amounts payable - - 485.7 772.4 620.0 224.0 - 2,102.1
Contractual amounts receivable - - (533.7) (802.1) (582.0) (225.6) - (2,143.4)
(103.3) - (48.0) (29.7) 38.0 (1.6) - (41.3)
Off balance sheet positions
Guarantees, indemnities and letters of credit - 235.7 - - - - - 235.7
Customer funding commitments - 1,234.6 - - - - - 1,234.6
- 1,470.3 - - - - - 1,470.3
Consolidated 2012
Carrying amount
$mAt Call
$m3 mths or less
$m3 to 12 mths
$m1 to 5 years
$mOver 5 years
$mPolicyholder
$m
Total contractual cash flows
$m
Financial liabilities
Due to other financial institutions 177.8 177.8 - - - - - 177.8
Deposits 31,171.9 10,879.2 16,682.0 4,586.2 2,197.8 - - 34,345.2
Derivative financial instruments (1) 1.2 - 2.0 0.3 (0.7) - - 1.6
Accounts payable and other liabilities 450.4 - 450.4 - - - - 450.4
Securitisation liabilities (2) 5,792.6 - 1,939.4 1,601.2 2,293.8 746.8 - 6,581.2
Borrowings including subordinated notes 895.5 - 227.9 225.9 547.7 - - 1,001.5
Insurance policy liabilities 73.5 - - - - - 73.5 73.5
Total 38,562.9 11,057.0 19,301.7 6,413.6 5,038.6 746.8 73.5 42,631.2
(1) Derivative financial instruments other than those designated in a cashflow hedge relationship. (2) Repayment of securitisation bonds is forecast based on the expected repayment profile of the underlying assets of the Trusts.

47
PRELIMINARY FINAL REPORT
24. RISK MANAGEMENT (CONTINUED)
(c) Liquidity risk (continued)
Consolidated 2012
Carrying amount
$mAt Call
$m3 mths or less
$m3 to 12 mths
$m1 to 5 years
$mOver 5 years
$mPolicyholder
$m
Total contractual cash flows
$m
Derivative financial instruments (hedging relationship)
Contractual amounts payable - - 408.3 415.1 1,063.7 27.4 - 1,914.5
Contractual amounts receivable - - (506.8) (409.0) (990.4) (19.9) - (1,926.1)
(19.9) - (98.5) 6.1 73.3 7.5 - (11.6)
Off balance sheet positions
Guarantees, indemnities and letters of credit - 130.8 - - - - - 130.8
Customer funding commitments - 1,211.0 - - - - - 1,211.0
- 1,341.8 - - - - - 1,341.8
Bank 2013
Carrying amount
$mAt Call
$m3 mths or less
$m3 to 12 mths
$m1 to 5 years
$mOver 5 years
$m
Total contractual cash flows
$m
Financial liabilities
Due to other financial institutions 201.1 201.1 - - - - 201.1
Deposits 31,785.5 13,243.3 13,627.5 6,601.0 1,657.9 - 35,129.7
Derivative financial instruments (1) 3.4 - 1.4 1.2 1.1 - 3.7
Accounts payable and other liabilities 320.7 - 320.7 - - - 320.7
Borrowings including subordinated notes 1,312.8 - 313.7 474.5 672.6 - 1,460.8
Amounts due to controlled entities 2,457.5 2,457.5 - - - - 2,457.5
Total 36,081.0 15,901.9 14,263.3 7,076.7 2,331.6 - 39,573.5
Derivative financial instruments (hedging relationship)
Contractual amounts payable - - 457.3 699.8 420.3 18.2 1,595.6
Contractual amounts receivable - - (507.8) (738.5) (418.5) (11.4) (1,676.2)
(101.6) - (50.5) (38.7) 1.8 6.8 (80.6)
Off balance sheet positions
Guarantees, indemnities and letters of credit - 235.7 - - - - 235.7
Customer funding commitments - 686.0 - - - - 686.0
- 921.7 - - - - 921.7
(1) Derivative financial instruments other than those designated in a cashflow hedge relationship.

48
Bank of Queensland Limited and its Controlled Entities A.B.N. 32 009 656 740.
24. RISK MANAGEMENT (CONTINUED)
(c) Liquidity risk (continued)
Bank 2012
Carrying amount
$mAt Call
$m3 mths or less
$m3 to 12 mths
$m1 to 5 years
$mOver 5 years
$m
Total contractual cash flows
$m
Financial liabilities
Due to other financial institutions 177.8 177.8 - - - - 177.8
Deposits 31,288.7 10,996.0 16,682.0 4,586.2 2,197.8 - 34,462.0
Derivative financial instruments (1) 1.3 - 2.1 0.3 (0.7) - 1.7
Accounts payable and other liabilities 404.8 - 404.8 - - - 404.8
Borrowings including subordinated notes 895.3 - 227.9 225.8 547.7 - 1,001.4
Amounts due to controlled entities 2,553.6 2,553.6 - - - - 2,553.6
Total 35,321.5 13,727.4 17,316.8 4,812.3 2,744.8 - 38,601.3
Derivative financial instruments (hedging relationship)
Contractual amounts payable - - 373.0 282.2 693.2 27.4 1,375.8
Contractual amounts receivable - - (482.3) (303.6) (707.6) (19.9) (1,513.4)
(142.7) - (109.3) (21.4) (14.4) 7.5 (137.6)
Off balance sheet positions
Guarantees, indemnities and letters of credit - 130.8 - - - - 130.8
Customer funding commitments - 708.8 - - - - 708.8
- 839.6 - - - - 839.6
(1) Derivative financial instruments other than those designated in a cashflow hedge relationship.

49
PRELIMINARY FINAL REPORT
24. RISK MANAGEMENT (CONTINUED)
(d) Operational riskOperational risk is the risk of loss resulting from inadequate or failed internal processes, people and systems or from external events. Operational risk failures could lead to reputational damage, financial loss, legal disputes and/or regulatory consequences.
Group Risk are responsible for ensuring an appropriate framework exists to define, assess and manage operational risk and that resources are available to support it.
The Bank has developed an Operational Risk Management Framework (“ORMF”) which is designed to articulate, assess and manage operational risks throughout the Bank and its subsidiaries. The key objectives of the framework are as follows:
• risk identification, analysis and acceptance;
• execution and monitoring of risk management practices; and
• reporting and escalation of risk information on a regular and/or exception basis.
The ORMF consists of the following mandatory elements:
• Bank-wide policies which require a consistent approach and minimum standards on specific operational risk matters;
• Enterprise and Business Unit Specific Risk profiling; and
• Risk Self Assessments through the completion of controls attestation questionnaires.
These provide the basis for the business unit and Bank-wide risk profiles. The Bank-wide risk profile is reported to the Board and Risk Committee on a regular basis.
(e) Insurance risk
(i) Risk management objectives and policies for risk mitigation
Insurance risks are controlled through the use of underwriting procedures, adequate premium rates and policy charges and sufficient reinsurance arrangements, all of which are approved through a Board approved governance structure. Controls are also maintained over claims management practices to assure the correct and timely payment of insurance claims.
(ii) Strategy for managing insurance risk
Portfolio of risks
The Bank’s insurance subsidiary issues consumer credit insurance, term life insurance, group life insurance, accidental death insurance and motor vehicle gap insurance contracts. The performance of the Bank’s insurance subsidiary and its continuing ability to write business depends on its ability to pre-empt and control risks. The Bank’s insurance subsidiary has a risk management strategy which has been approved by its Board. It summarises the approach to risk and risk management.
Risk strategy
In compliance with contractual and regulatory requirements, a strategy is in place to ensure that the risks underwritten satisfy objectives whilst not adversely affecting the Consolidated Entity’s ability to pay benefits and claims when due. The strategy involves the identification of risks by type, impact and likelihood, the implementation of processes and controls to mitigate the risks, and continuous monitoring and improvement of the procedures in place to minimise the chance of an adverse compliance or operational risk event occurring. Included in this strategy is the process for underwriting and product pricing to ensure products are appropriately priced. Capital management is also a key aspect of the Consolidated Entity’s risk management strategy. Capital requirements take account of all of the various regulatory reporting requirements to which the Consolidated Entity is subject.
Prudential capital requirements
Prudential capital requirements established by the APRA are in place to safeguard policyholders’ interests, which are primarily the ability to meet future claim payments to policyholders. These require the Company’s Capital Base to exceed the Prudential Capital Requirement throughout the year, not just at year end. The level of capital requirements also take into account specific risks faced by the Bank’s insurance subsidiary.
(iii) Methods to limit or transfer insurance risk exposures
Reinsurance
The insurance subsidiary uses reinsurance arrangements to pass on or cede to reinsurers, risks that are outside of the subsidiary’s risk appetite.

50
Bank of Queensland Limited and its Controlled Entities A.B.N. 32 009 656 740.
24. RISK MANAGEMENT (CONTINUED)
(e) Insurance (continued)
(iii) Methods to limit or transfer insurance risk exposures (continued)
Underwriting procedures
Strategic underwriting decisions are put into effect using the underwriting procedures detailed in the Bank’s insurance subsidiary’s Underwriting Policy. Such procedures include limits to delegated authorities and signing powers.
Claims management
Strict claims management procedures ensure timely and correct payment of claims in accordance with policy conditions.
Asset and liability management techniques
Assets are allocated to different classes of business using a risk based approach. The Bank’s insurance subsidiary has a mix of short and long term business and invests accordingly. Market risk is managed through investing in cash and deposits, bank issued commercial bills, cash management trusts and managed income funds. No more than 35% of shareholder funds and funds backing insurance policy liabilities can be invested with any one counterparty subject to counterparty credit ratings.
(v) Concentration of insurance risk
Insurance risks associated with human life events
The Bank’s insurance subsidiary aims to maintain a stable age profile and mix of the sexes within its portfolio of policyholders. This policy maintains a balance between the current and future profitability of the life business, and exposure to the significant external events. Despite the inevitable growth in policyholders at the age of retirement, the age profile and mix of sexes within the population of policyholders is sufficiently spread so that the risk concentration in relation to any particular age group is minimal.
25. CAPITAL MANAGEMENTThe Bank and Consolidated Entity’s capital management strategy aims to ensure that the Consolidated Entity maintains adequate capital to act as a buffer against risks associated with activities whilst maximising returns to shareholders. The Bank’s capital is measured and managed in line with Prudential Standards issued by APRA. This regulatory capital differs from statutory capital in that certain liabilities such as preference shares are considered capital from a regulatory perspective and certain assets including goodwill and other intangibles are considered a deduction from regulatory capital.
The Bank and Consolidated Entity have a capital management plan, consistent with their overall business plans, for managing capital levels on an ongoing basis. This plan sets out:
(i) the strategy for maintaining adequate capital over time including the capital target, how the target level is to be met and the means available for sourcing additional capital when required; and
(ii) the actions and procedures for monitoring compliance with minimum regulatory capital adequacy requirements, including trigger ratios to alert management to, and avert, potential breaches of these requirements.
For capital adequacy purposes, a bank’s capital base is the sum of Tier 1 Capital and Tier 2 Capital, net of specified deductions;
• Under APRA’s previous prudential standards, Tier 1 Capital is comprised of Fundamental Tier 1 Capital and Residual Tier 1 Capital.
• Effective 1 January 2013, Tier 1 Capital will be comprised of Common Equity Tier 1 Capital and Additional Tier 1 Capital.
The capital management plan is updated at least annually and submitted to the Board for approval. Current and projected capital positions are reported to the Board and APRA on a monthly basis.
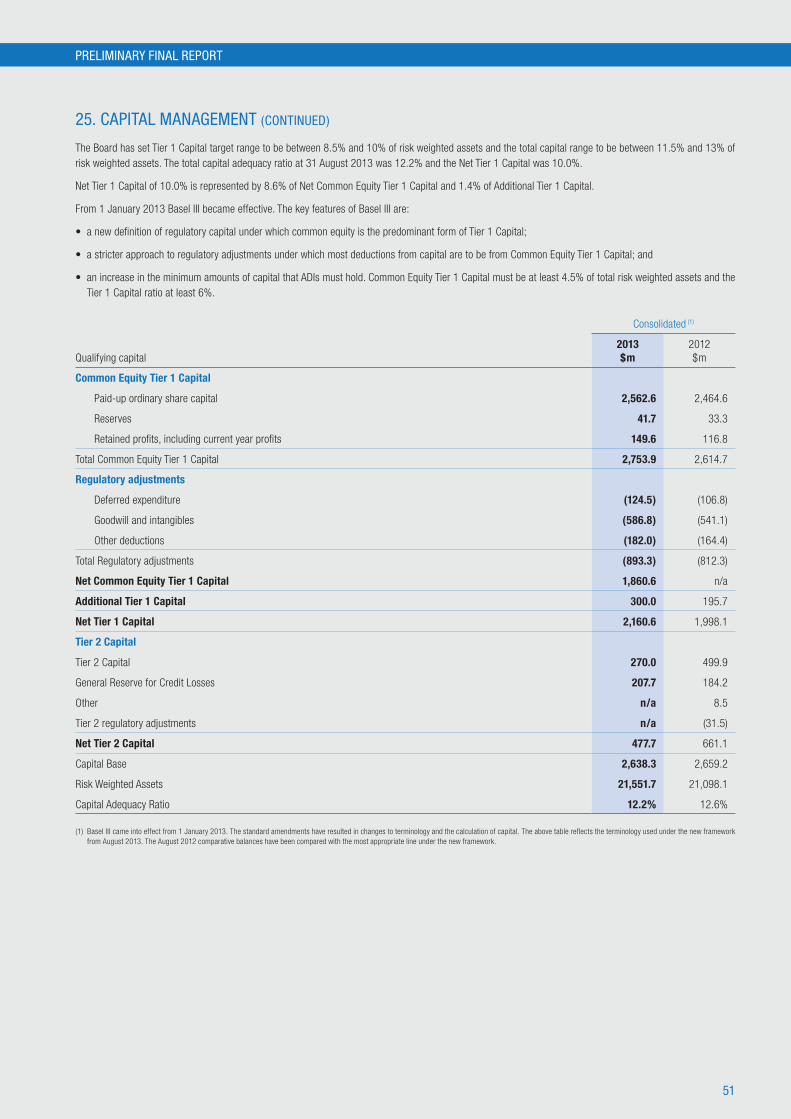
51
PRELIMINARY FINAL REPORT
25. CAPITAL MANAGEMENT (CONTINUED)
The Board has set Tier 1 Capital target range to be between 8.5% and 10% of risk weighted assets and the total capital range to be between 11.5% and 13% of risk weighted assets. The total capital adequacy ratio at 31 August 2013 was 12.2% and the Net Tier 1 Capital was 10.0%.
Net Tier 1 Capital of 10.0% is represented by 8.6% of Net Common Equity Tier 1 Capital and 1.4% of Additional Tier 1 Capital.
From 1 January 2013 Basel III became effective. The key features of Basel III are:
• a new definition of regulatory capital under which common equity is the predominant form of Tier 1 Capital;
• a stricter approach to regulatory adjustments under which most deductions from capital are to be from Common Equity Tier 1 Capital; and
• an increase in the minimum amounts of capital that ADIs must hold. Common Equity Tier 1 Capital must be at least 4.5% of total risk weighted assets and the Tier 1 Capital ratio at least 6%.
Consolidated (1)
Qualifying capital2013 $m
2012 $m
Common Equity Tier 1 Capital
Paid-up ordinary share capital 2,562.6 2,464.6
Reserves 41.7 33.3
Retained profits, including current year profits 149.6 116.8
Total Common Equity Tier 1 Capital 2,753.9 2,614.7
Regulatory adjustments
Deferred expenditure (124.5) (106.8)
Goodwill and intangibles (586.8) (541.1)
Other deductions (182.0) (164.4)
Total Regulatory adjustments (893.3) (812.3)
Net Common Equity Tier 1 Capital 1,860.6 n/a
Additional Tier 1 Capital 300.0 195.7
Net Tier 1 Capital 2,160.6 1,998.1
Tier 2 Capital
Tier 2 Capital 270.0 499.9
General Reserve for Credit Losses 207.7 184.2
Other n/a 8.5
Tier 2 regulatory adjustments n/a (31.5)
Net Tier 2 Capital 477.7 661.1
Capital Base 2,638.3 2,659.2
Risk Weighted Assets 21,551.7 21,098.1
Capital Adequacy Ratio 12.2% 12.6%
(1) Basel III came into effect from 1 January 2013. The standard amendments have resulted in changes to terminology and the calculation of capital. The above table reflects the terminology used under the new framework from August 2013. The August 2012 comparative balances have been compared with the most appropriate line under the new framework.

52
Bank of Queensland Limited and its Controlled Entities A.B.N. 32 009 656 740.
26. FINANCIAL INSTRUMENTS
(a) Derivative financial instrumentsThe Consolidated Entity and Bank used derivative financial instruments for both hedging and trading purposes in the current year. Refer to Note 24 (a) for an explanation of the Consolidated Entity’s and Bank’s risk management framework.
The following table summarises the notional and fair value of the Consolidated Entity’s and Bank’s commitments to derivative financial instruments at reporting date. Fair value in relation to derivative financial instruments is calculated using the quoted market price less transaction costs. Where the instrument does not have a quoted market price, fair value is estimated using net present value techniques.
Consolidated
2013 2012
Notional Amount
Fair Value
Asset / (Liability) Notional Amount
Fair Value
Asset / (Liability)
$m Asset
$mLiability
$m $m Asset $m
Liability $m
Derivatives at fair value through income statement
Interest Rate Swaps 18,519.9 18.8 (2.5) 18,100.0 0.1 (0.9)
Foreign Exchange Forwards 72.4 1.5 (0.9) 68.9 0.7 (0.3)
Futures 8,300.0 5.8 - 6,085.7 3.6 -
26,892.3 26.1 (3.4) 24,254.6 4.4 (1.2)
Derivatives held as cash flow hedges
Interest Rate Swaps 22,857.4 143.6 (94.6) 29,014.0 268.3 (118.3)
Cross Currency Swaps 914.5 57.4 (38.5) 832.1 0.9 (133.3)
Foreign Exchange Forwards 455.6 33.1 (0.9) 129.8 2.5 (0.2)
24,227.5 234.1 (134.0) 29,975.9 271.7 (251.8)
Derivatives designated as net investment hedges
Foreign Exchange Forwards 15.5 0.2 - 12.9 - -
51,135.3 260.4 (137.4) 54,243.4 276.1 (253.0)
Bank
2013 2012
Notional Amount
Fair Value
Asset / (Liability) Notional Amount
Fair Value
Asset / (Liability)
$m Asset
$mLiability
$m $m Asset $m
Liability $m
Derivatives at fair value through income statement
Interest Rate Swaps 18,519.9 18.8 (2.5) 18,100.0 0.1 (0.9)
Foreign Exchange Forwards 87.9 1.7 (0.9) 81.8 0.7 (0.4)
Futures 8,300.0 5.8 - 6,085.7 3.6 -
26,907.8 26.3 (3.4) 24,267.5 4.4 (1.3)
Derivatives held as cash flow hedges
Interest Rate Swaps 22,857.4 143.6 (94.6) 29,014.0 268.3 (118.3)
Cross Currency Swaps 377.3 31.0 (10.6) 307.0 0.9 (10.5)
Foreign Exchange Forwards 455.6 33.1 (0.9) 129.8 2.5 (0.2)
23,690.3 207.7 (106.1) 29,450.8 271.7 (129.0)
50,598.1 234.0 (109.5) 53,718.3 276.1 (130.3)

53
PRELIMINARY FINAL REPORT
26. FINANCIAL INSTRUMENTS (CONTINUED)
(b) Other financial instrumentsThe fair value estimates for specific instruments are based on the following methodologies and assumptions:
Cash and liquid assets, due from and to other financial institutions, accounts payable and other liabilities
The fair value approximates their carrying value as they are short term in nature or are receivable or payable on demand.
Loans and advances
Loans and advances are net of specific and collective provisions for doubtful debts and unearned income. The fair values of loans and advances that reprice within six months of year end are assumed to equate to the carrying value. The fair values of all other loans and advances are calculated using discounted cash flow models based on the maturity of the loans and advances. The discount rates applied are based on the current interest rates at the reporting date for similar types of loans and advances, if the loans and advances were performing at the reporting date. The differences between estimated fair values of loans and advances and carrying value reflect changes in interest rates and creditworthiness of borrowers since loan or advance origination.
Deposits
The fair value of non-interest-bearing, call and variable rate deposits and fixed rate deposits repricing within six months is the carrying value. The fair value of other term deposits is calculated using discounted cash flow models based on the deposit type and its related maturity.
Borrowings including subordinated notes
The fair values are calculated based on a discounted cash flow model using a yield curve appropriate to the remaining maturity of the instruments. Fair values of financial instruments at the reporting date are as follows:
Consolidated Entity
Carrying value Fair value
Note2013 $m
2012 $m
2013 $m
2012 $m
Assets carried at fair value
Available for sale financial assets 11 1,066.8 1,064.9 1,066.8 1,064.9
Financial assets designated at fair value through profit and loss
114,334.6 4,624.5 4,334.6 4,624.5
Derivative assets 26 260.4 276.1 260.4 276.1
5,661.8 5,965.5 5,661.8 5,965.5
Assets carried at amortised cost
Cash and liquid assets 9 873.2 670.5 873.2 670.5
Due from other financial institutions 10 118.5 119.7 118.5 119.7
Loans and advances at amortised cost 12 34,989.3 34,147.2 35,104.7 34,290.6
35,981.0 34,937.4 36,096.4 35,080.8
Liabilities carried at fair value
Derivative liabilities 26 (137.4) (253.0) (137.4) (253.0)
Insurance policy liabilities 37 (72.5) (73.5) (72.5) (73.5)
(209.9) (326.5) (209.9) (326.5)
Liabilities carried at amortised cost
Due to other financial institutions 18 (201.1) (177.8) (201.1) (177.8)
Deposits 19 (31,698.7) (31,171.9) (31,766.7) (31,240.9)
Borrowings including subordinated notes 21 (7,136.9) (6,688.1) (7,168.7) (6,738.6)
Accounts payable and other liabilities (362.0) (450.4) (362.0) (450.4)
(39,398.7) (38,488.2) (39,498.5) (38,607.7)

54
Bank of Queensland Limited and its Controlled Entities A.B.N. 32 009 656 740.
26. FINANCIAL INSTRUMENTS (CONTINUED)
(b) Other financial instruments (continued)
Bank
Carrying value Fair value
Note2013 $m
2012 $m
2013 $m
2012 $m
Assets carried at fair value
Available for sale financial assets 11 1,268.4 1,152.4 1,268.4 1,152.4
Financial assets designated at fair value through profit and loss
114,334.6 4,624.5 4,334.6 4,624.5
Derivative assets 26 234.0 276.1 234.0 276.1
5,837.0 6,053.0 5,837.0 6,053.0
Assets carried at amortised cost
Cash and liquid assets 9 242.2 227.7 242.2 227.7
Due from other financial institutions 10 23.8 23.5 23.8 23.5
Loans and advances at amortised cost 12 31,491.2 30,654.6 31,540.8 30,710.8
31,757.2 30,905.8 31,806.8 30,962.0
Liabilities carried at fair value
Derivative liabilities 26 (109.5) (130.3) (109.5) (130.3)
Liabilities carried at amortised cost
Due to other financial institutions 18 (201.1) (177.8) (201.1) (177.8)
Deposits 19 (31,785.5) (31,288.7) (31,853.5) (31,357.7)
Borrowings including subordinated notes 21 (1,312.8) (895.3) (1,344.6) (945.8)
Accounts payable and other liabilities (320.7) (404.8) (320.7) (404.8)
Amounts due to controlled entities (2,457.5) (2,553.6) (2,457.5) (2,553.6)
(36,077.6) (35,320.2) (36,177.4) (35,439.7)
The estimated fair values disclosed do not include the assets and liabilities that are not financial instruments.
Interest rates used for determining fair values
The interest rates used to discount estimated cash flows, when applicable, are based on the Bank’s yield curve at the reporting date plus an adequate credit spread, and were as follows:
2013 2012
Derivatives, deposits and borrowings including subordinated notes 2.51% - 4.58% 3.56% - 3.95%
Leases 6.24% - 13.5% 6.79% - 20.3%
Loans and advances at amortised cost 4.75% - 6.85% 5.55% - 7.3%
Fair value hierarchy
The table below analyses financial instruments carried at fair value, by valuation method. The different levels have been defined as follows:
• Level 1: quoted prices (unadjusted) in active markets for identical assets or liabilities;
• Level 2: inputs other than quoted prices included within Level 1 that are observable for the asset or liability, either directly (i.e. as prices) or indirectly (i.e. derived from prices); and
• Level 3: inputs for the asset or liability that are not based on observable market data (unobservable inputs).
There were no material movements in Level 3 during the year.

55
PRELIMINARY FINAL REPORT
26. FINANCIAL INSTRUMENTS (CONTINUED)
(b) Other financial instruments (continued)
2013
Consolidated EntityLevel 1
$mLevel 2
$mLevel 3
$mTotal $m
Instruments carried at fair value
Available for sale financial assets 426.2 630.8 9.8 1,066.8
Financial assets designated at fair value through profit and loss 134.2 4,200.4 - 4,334.6
Derivative assets - 260.4 - 260.4
560.4 5,091.6 9.8 5,661.8
Derivative liabilities - (137.4) - (137.4)
560.4 4,954.2 9.8 5,524.4
2012
Consolidated EntityLevel 1
$mLevel 2
$mLevel 3
$mTotal $m
Instruments carried at fair value
Available for sale financial assets 454.1 600.9 9.9 1,064.9
Financial assets designated at fair value through profit and loss - 4,624.5 - 4,624.5
Derivative assets - 276.1 - 276.1
454.1 5,501.5 9.9 5,965.5
Derivative liabilities - (253.0) - (253.0)
454.1 5,248.5 9.9 5,712.5
2013
Bank Level 1
$mLevel 2
$mLevel 3
$mTotal $m
Instruments carried at fair value
Available for sale financial assets 426.2 832.4 9.8 1,268.4
Financial assets designated at fair value through profit and loss 134.2 4,200.4 - 4,334.6
Derivative assets - 234.0 - 234.0
560.4 5,266.8 9.8 5,837.0
Derivative liabilities - (109.5) - (109.5)
560.4 5,157.8 9.8 5,727.5
2012
Bank Level 1
$mLevel 2
$mLevel 3
$mTotal $m
Instruments carried at fair value
Available for sale financial assets 454.1 688.4 9.9 1,152.4
Financial assets designated at fair value through profit and loss - 4,624.5 - 4,624.5
Derivative assets - 276.1 - 276.1
454.1 5,589.0 9.9 6,053.0
Derivative liabilities - (130.3) - (130.3)
454.1 5,458.7 9.9 5,922.7

56
Bank of Queensland Limited and its Controlled Entities A.B.N. 32 009 656 740.
27. NOTES TO THE STATEMENTS OF CASH FLOWS
Reconciliation of profit / (loss) for the year to net cash provided by operating activities.
Consolidated Bank
2013 $m
2012 $m
2013 $m
2012 $m
Profit / (loss) from ordinary activities after income tax 185.8 (17.1) 169.7 (3.8)
Add / (less) items classified as investing / financing activities or non-cash items
Depreciation 16.1 14.8 7.3 7.7
Amortisation 16.0 4.0 1.4 1.3
Dividends received from subsidiaries - - (23.3) (44.2)
Software amortisation 18.6 24.6 16.5 22.3
Investments equity accounted 1.1 - - -
Equity settled transactions 5.2 4.4 4.6 4.4
(Profit) / loss on sale of property, plant and equipment (3.2) 5.5 (0.1) 7.7
(Increase) / decrease in due from other financial institutions 1.2 12.2 (0.3) 2.4
(Increase) / decrease in other financial assets 288.0 (529.4) 174.0 (544.2)
(Increase) in loans and advances at amortised cost (741.6) (1,030.2) (741.5) (1,067.6)
(Increase) / decrease in derivatives (25.4) (155.4) (25.3) (185.1)
Increase / (decrease) in provision for impairment (100.5) 159.1 (95.1) 158.7
(Increase) / decrease in deferred tax asset 41.4 (67.1) 23.1 (55.3)
(Increase) in other assets (16.7) (7.9) (1.8) (54.6)
Decrease in amounts due from controlled entities - - (212.3) (121.3)
Increase in due to other financial institutions 23.3 8.6 23.3 8.6
Increase in deposits 518.3 1,530.1 488.2 1,398.4
Increase / (decrease) in accounts payable and other liabilities (75.2) 19.2 (75.3) 42.8
Increase / (decrease) in current tax liabilities 23.3 (80.5) 24.3 (81.7)
Increase in provisions 35.9 14.1 35.2 12.1
Decrease in deferred tax liabilities (18.8) (13.2) (11.5) 13.9
Decrease in insurance policy liabilities (1.0) (5.7) - -
Increase in borrowings including subordinated notes 28.8 265.9 - -
Net cash from operating activities 220.6 156.0 (218.9) (477.5)
Cash flows from the following activities are presented on a net basis in the statements of cash flows:• Sales and purchases of investment securities;• Customer deposits in and withdrawals from deposit accounts; and• Loan drawdowns and repayments.
28. AUDITOR’S REMUNERATIONConsolidated Bank
2013 $’000
2012 $’000
2013 $’000
2012 $’000
Audit services – KPMG Australia
- Audit and review of the financial reports 919.8 1,127.1 595.9 818.3
- Other regulatory and audit services 342.2 532.6 182.2 346.1
1,262.0 1,659.7 778.1 1,164.4
Audit related services – KPMG Australia
- Other assurance services (1) 230.2 123.9 - -
230.2 123.9 - -

57
PRELIMINARY FINAL REPORT
28. AUDITOR’S REMUNERATION (CONTINUED)
Consolidated Bank
2013 $’000
2012 $’000
2013 $’000
2012 $’000
Non-audit services – KPMG Australia
- Taxation services 225.1 222.5 225.1 218.2
- Compliance services 249.2 - 249.2 -
- Other 88.7 75.6 72.6 75.6
- Due diligence services 64.5 103.2 64.5 103.2
627.5 401.3 611.4 397.0
(1) Other assurance services comprise audit related services provided in relation to mortgage securitisation trusts which are consolidated under Australian Accounting Standards.
29. CONTINGENT LIABILITIES
Consolidated Bank
2013 $m
2012 $m
2013 $m
2012 $m
Guarantees 227.3 123.4 227.3 123.4
Letters of credit 8.4 7.4 8.4 7.4
Guarantees, indemnities and letters of credit
There are contingent liabilities arising in the normal course of business for which there are equal and opposite contingent assets and against which no loss is anticipated. Guarantees are provided to third parties on behalf of customers. The credit risks of such facilities are similar to the credit risks of loans and advances.
Legal proceedings
On 22 December 2010, the Australian Securities and Investment Commission (“ASIC”) lodged legal proceedings against parties including the Bank, arising out of the collapse of Storm Financial. One proceeding has been heard and the Bank is awaiting judgement. The proceedings are regulatory in nature. At this stage no estimate of any potential liability can be made.
On 6 December 2012 a class action was commenced against the Bank, also arising out of the collapse of Storm Financial. The Bank’s intention is to defend this action vigorously. At this stage no estimate of any potential liability can be made.
The trials involving the Bank by a number of former Owner Managers in NSW are almost complete with only closing submissions remaining. It is expected that closing submissions will be completed by the end of October 2013. It is not known when judgement will be delivered. At this stage no estimate of any potential liability can be made.
30. COMMITMENTS
Consolidated Bank
2013 $m
2012 $m
2013 $m
2012 $m
(a) Lease commitmentsFuture rentals in respect of operating leases (principally in respect of premises) not provided for in these financial statements comprise amounts payable:
Within 1 year 39.0 41.6 37.1 40.0
Between 1 year and 5 years 65.6 70.6 61.7 65.2
Later than 5 years 0.3 2.5 0.3 2.5
104.9 114.7 99.1 107.7
(b) Customer funding commitments
Loans to customers approved but not drawn at year end 1,021.5 1,008.7 564.5 588.2
Amounts undrawn against lines of credit 448.8 333.1 357.2 251.4
1,470.3 1,341.8 921.7 839.6
In the normal course of business the Bank makes commitments to extend credit to its customers. Most commitments either expire if not taken up within a specified time or can be cancelled by the Bank within one year. Credit risk is significantly less than the notional amount and does not crystallise until a commitment is funded.

58
Bank of Queensland Limited and its Controlled Entities A.B.N. 32 009 656 740.
31. CONTROLLED ENTITIES(a) Particulars in relation to controlled entities
Parent entity’sinterest
Amount of Investment(at cost)
Controlled entities:2013 2012 2013
$m2012$m
B.Q.L. Management Pty Ltd 100% 100% - -
B.Q.L. Nominees Pty Ltd 100% 100% - -
B.Q.L. Properties Limited 100% 100% 5.0 5.0
Queensland Electronic Switching Pty Ltd 100% 100% - -
BOQ Equipment Finance Limited 100% 100% 0.1 0.1
St Andrew’s Australia Services Pty Ltd 100% 100% 15.4 15.4
Series 2005-1 REDS Trust - 100% - -
Series 2005-2 REDS Trust 100% 100% - -
REDS Warehouse Trust No.1 100% 100% - -
REDS Warehouse Trust No.2 100% 100% - -
Series 2006-1E REDS Trust 100% 100% - -
Series 2007-1E REDS Trust 100% 100% - -
Series 2007-2 REDS Trust 100% 100% - -
Series 2008-1 REDS Trust 100% 100% - -
Series 2008-2 REDS Trust 100% 100% - -
Series 2009-1 REDS Trust 100% 100% - -
REDS Warehouse Trust No.3 100% 100% - -
Series 2010-1 REDS Trust 100% 100% - -
Series 2010-2 REDS Trust 100% 100% - -
Series 2012-1E EHP REDS Trust 100% 100% - -
Series 2012-1E REDS Trust 100% - - -
Series 2013-1 EHP REDS Trust 100% - - -
Series 2013-1 REDS Trust 100% - - -
Pioneer Permanent Building Society Limited 100% 100% 60.1 60.1
Home Building Society Ltd 100% 100% 600.2 600.2
Home Financial Planning Pty Ltd 100% 100% - -
Home Credit Management Ltd 100% 100% - -
Statewest Financial Services Ltd 100% 100% - -
Statewest Financial Planning Pty Ltd 100% 100% - -
BOQ Share Plans Nominee Pty Ltd 100% 100% - -
Bank of Queensland Limited Employee Share Plans Trust 100% 100% - -
St Andrew’s Life Insurance Pty Ltd 100% 100% - -
St Andrew’s Insurance (Australia) Pty Ltd 100% 100% - -
BOQ Finance (Aust) Limited 100% 100% 230.2 230.2
BOQ Credit Pty Limited 100% 100% - -
BOQ Funding Pty Limited 100% 100% - -
BOQ Finance (NZ) Limited 100% 100% 22.1 22.1
Equipment Rental Billing Services Pty Ltd 100% 100% - -
Hunter Leasing Ltd 100% 100% - -
Newcourt Financial (Australia) Pty Limited 100% 100% - -
Virgin Money (Australia) Pty Limited 100% - 42.6 -
Virgin Money Home Loans Pty Limited 100% - - -
Virgin Money Financial Services Pty Ltd 100% - - -
975.7 933.1

59
PRELIMINARY FINAL REPORT
31. CONTROLLED ENTITIES (CONTINUED)
(b) Acquisition of controlled entitiesOn 30 April 2013, the Bank acquired 100% of Virgin Money (Australia) Pty Limited (“VMA”) for consideration of $42.6 million. $30.6 million of new shares were issued in two tranches (Tranche 1 - 1,585,353 and Tranche 2 - 1,617,762) as part of the acquisition consideration. Fair value of the ordinary shares issued was based on the listed share price of BOQ at 30 April 2013 of $10.24 per share.
VMA engages in the provision of financial services (e.g: insurance, superannuation and home lending) on behalf of business partners. The Bank purchased VMA to expand its customer reach.
In the period from 30 April 2013 to 31 August 2013 VMA contributed a loss after tax of $0.2 million.
The provisional acquisition accounting had the following effect on the consolidated entity’s assets and liabilities:
Recognised values on acquisition
$m
Pre-acquisition carrying amounts
$m
Cash 3.9 3.9
Property, plant and equipment 0.1 0.1
Other assets 2.5 2.5
Unearned income (1.3) (1.3)
Accounts payable and other liabilities (5.7) (15.6)
Provisions (0.5) (0.5)
Net identifiable assets and liabilities (1.0) (10.9)
Goodwill and other identifiable assets on acquisition 43.6
Total Consideration 42.6
Consideration paid, satisfied in cash 9.8
Equity purchase consideration 32.8
Cash acquired (3.9)
Net cash outflow 5.9
At 31 August 2013, the acquisition accounting balances were provisional due to ongoing work related to various matters which will impact the acquisition accounting entries.
The following entities were established during the financial year:
• Series 2012-1E REDS Trust was opened on 15 November 2012.• Series 2013-1 EHP REDS Trust was opened on 17 May 2013.• Series 2013-1 REDS Trust was opened on 26 July 2013.
(c) Disposal of controlled entitiesSeries 2005-1 REDS Trust was closed on 12 February 2013.
32. RELATED PARTIES INFORMATION
Controlled entitiesDetails of interests in controlled entities are set out in Note 31.
During the year there have been transactions between the Bank and all of its controlled entities. The Bank conducted normal banking business with its operating controlled entities. Amounts owing to or from controlled entities do not attract interest, except in respect of BOQ Equipment Finance Limited, St Andrew’s Australia Services Pty Ltd, BOQ Finance (Aust) Ltd and BOQ Finance (NZ) Ltd where interest is charged on normal terms and conditions.
The Bank receives management fees from B.Q.L. Management Pty Ltd and BOQ Equipment Finance Limited.
The Bank has a related party relationship with equity accounted investees, refer to Note 37.

60
Bank of Queensland Limited and its Controlled Entities A.B.N. 32 009 656 740.
33. AVERAGE BALANCES AND MARGIN ANALYSIS
Consolidated 2013
Consolidated 2012
Average Balance
$mInterest
$m
Average Rate
%
Average Balance
$mInterest
$m
Average Rate %
Interest earning assets
Gross loans and advances at amortised cost (1) 35,054.1 2,084.3 5.95 34,060.9 2,345.1 6.89
Investments and other securities (1) 6,027.8 213.1 3.54 5,348.9 251.1 4.69
Total interest earning assets 41,081.9 2,297.4 5.59 39,409.8 2,596.2 6.59
Non-interest earning assets
Property, plant and equipment 36.8 31.8
Other assets 1,367.8 1,125.4
Provision for impairment (376.3) (367.8)
Total non-interest earning assets 1,028.3 789.4
Total assets 42,110.2 40,199.2
Interest bearing liabilities
Retail deposits (1) 22,890.9 897.9 3.92 20,923.5 1,025.8 4.90
Wholesale deposits and borrowings (1) 15,677.4 706.4 4.51 15,850.0 918.9 5.80
Total interest bearing liabilities 38,568.3 1,604.3 4.16 36,773.5 1,944.7 5.29
Non-interest bearing liabilities 705.4 741.6
Total liabilities 39,273.7 37,515.1
Shareholders' funds 2,836.5 2,684.1
Total liabilities and shareholders' funds 42,110.2 40,199.2
Interest margin and interest spread
Interest earning assets 41,081.9 2,297.4 5.59 39,409.8 2,596.2 6.59
Interest bearing liabilities 38,568.3 1,604.3 4.16 36,773.5 1,944.7 5.29
Net interest spread (2) 1.43 1.30
Net interest margin - on average interest earning assets 41,081.9 693.1 1.69 39,409.8 651.5 1.65
(1) Calculated on average monthly balances.
(2) Interest spread is calculated after taking into account third party and OMB commissions.
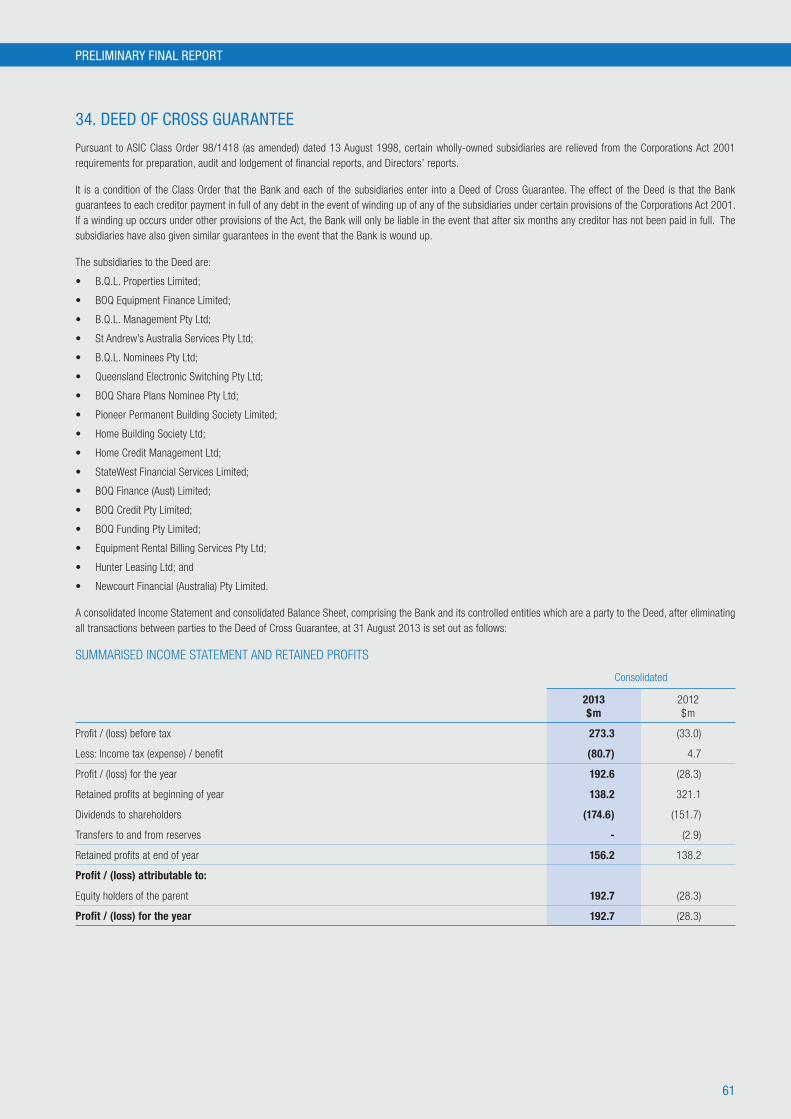
61
PRELIMINARY FINAL REPORT
34. DEED OF CROSS GUARANTEE
Pursuant to ASIC Class Order 98/1418 (as amended) dated 13 August 1998, certain wholly-owned subsidiaries are relieved from the Corporations Act 2001 requirements for preparation, audit and lodgement of financial reports, and Directors’ reports.
It is a condition of the Class Order that the Bank and each of the subsidiaries enter into a Deed of Cross Guarantee. The effect of the Deed is that the Bank guarantees to each creditor payment in full of any debt in the event of winding up of any of the subsidiaries under certain provisions of the Corporations Act 2001. If a winding up occurs under other provisions of the Act, the Bank will only be liable in the event that after six months any creditor has not been paid in full. The subsidiaries have also given similar guarantees in the event that the Bank is wound up.
The subsidiaries to the Deed are:
• B.Q.L. Properties Limited;
• BOQ Equipment Finance Limited;
• B.Q.L. Management Pty Ltd;
• St Andrew’s Australia Services Pty Ltd;
• B.Q.L. Nominees Pty Ltd;
• Queensland Electronic Switching Pty Ltd;
• BOQ Share Plans Nominee Pty Ltd;
• Pioneer Permanent Building Society Limited;
• Home Building Society Ltd;
• Home Credit Management Ltd;
• StateWest Financial Services Limited;
• BOQ Finance (Aust) Limited;
• BOQ Credit Pty Limited;
• BOQ Funding Pty Limited;
• Equipment Rental Billing Services Pty Ltd;
• Hunter Leasing Ltd; and
• Newcourt Financial (Australia) Pty Limited.
A consolidated Income Statement and consolidated Balance Sheet, comprising the Bank and its controlled entities which are a party to the Deed, after eliminating all transactions between parties to the Deed of Cross Guarantee, at 31 August 2013 is set out as follows:
SUMMARISED INCOME STATEMENT AND RETAINED PROFITS
Consolidated
2013 $m
2012 $m
Profit / (loss) before tax 273.3 (33.0)
Less: Income tax (expense) / benefit (80.7) 4.7
Profit / (loss) for the year 192.6 (28.3)
Retained profits at beginning of year 138.2 321.1
Dividends to shareholders (174.6) (151.7)
Transfers to and from reserves - (2.9)
Retained profits at end of year 156.2 138.2
Profit / (loss) attributable to:
Equity holders of the parent 192.7 (28.3)
Profit / (loss) for the year 192.7 (28.3)

62
Bank of Queensland Limited and its Controlled Entities A.B.N. 32 009 656 740.
34. DEED OF CROSS GUARANTEE (CONTINUED)
Consolidated
2013 $m
2012 $m
Assets
Cash and liquid assets 350.9 258.8
Due from other financial institutions 1.9 4.4
Other financial assets 5,602.0 5,777.0
Derivative financial instruments 234.0 276.1
Loans and advances at amortised cost 34,992.4 34,147.2
Other assets 284.2 258.7
Shares in controlled entities 92.4 49.8
Property, plant and equipment 29.6 31.0
Current tax asset - 0.7
Deferred tax assets 104.5 118.1
Intangible assets 543.6 541.3
Investments in accounted for using the equity method 21.4 22.2
Total assets 42,256.9 41,485.3
Liabilities
Due to other financial institutions 201.1 177.8
Deposits 31,705.3 31,188.0
Derivative financial instruments 109.5 130.3
Accounts payable and other liabilities 348.9 434.3
Current tax liabilities 23.0 -
Provisions 73.9 40.9
Borrowings including subordinated notes 1,300.9 886.8
Amounts due to controlled entities 5,666.6 5,710.3
Total liabilities 39,429.2 38,568.4
Net assets 2,827.7 2,916.9
Equity
Issued capital 2,562.6 2,660.1
Reserves 108.9 118.6
Retained profits 156.2 138.2
Total equity 2,827.7 2,916.9

63
PRELIMINARY FINAL REPORT
35. INSURANCE BUSINESS
The effective date of the actuarial report on life insurance policy liabilities and regulatory capital requirements, is 31 August 2013. The actuarial report was prepared by Mr Wayne Kenafacke, Fellow of the Institute of Actuaries of Australia. This report indicates that Mr Kenafacke is satisfied as to the accuracy of the data upon which policy liabilities have been determined.
The amount of policy liabilities have been determined in accordance with methods and assumptions disclosed in this financial report and the requirements of applicable accounting standards. Specifically, policy liabilities for life insurance contracts are determined in accordance with AASB 1038 Life Insurance Contracts.
In addition, life insurance contract liabilities have been calculated in accordance with relevant actuarial guidance being LPS: 340 Valuation of Policy Liabilities. The Prudential Standard requires policy liabilities to be calculated in a way which allows for the systematic release of planned margins as services are provided to policyholders and premiums are received.
The methods used for the major product groups in order to achieve the systematic release of planned margins were as follows:
Product group Method (Projection or other) Profit Carriers
Consumer credit insurance Accumulation N/A
Direct Life Accumulation N/A
Real / Asia Accumulation N/A
Policy liabilities have been calculated as the provision for unearned premium reserve less a deferred acquisition cost component. Outstanding claims liabilities and Incurred But Not Reported liabilities (“IBNR”) are included in provisions.
Premium earning pattern
For single premium products, the Unearned Premium Reserve (“UPR”) is based on a premium earning pattern that is similar to the pattern of expected future claim payments. The future claim payments are based on an assessment of the future sum insured (e.g. outstanding loan balances for mortgage and loan protection) and future claims frequencies. Past experience is used to set these assumptions. This earning pattern is also used to recognise commissions incurred.
For regular premium products, the UPR is based on the unearned proportion of premium for the given premium payment frequency.
Mortality and morbidity
Mortality and morbidity assumptions used in determining IBNR, pending and continuing claims provisions have been based on the experience of similar products issued by the Company and recent experience. The disputed claims provision is based on individual claim estimates and an assumed 50% probability of disputed claims being incurred.
Processes used to determine actuarial assumptions
Sensitivity analysis
As a result of using an accumulation approach in the determination of policy liabilities, changes of assumptions will not affect the policy liabilities in the current period. As at 31 August 2013, no Related Product Groups were in loss recognition.
Changes in the underlying variables and assumptions will give rise to a difference in the emergence of profit margins in the future.
Changes in assumptions relating to claims provisions would affect policy liabilities in the current period.
Variable Impact of movement in underlying variable
Mortality rates For contracts providing death benefits, greater mortality rates would lead to higher levels of claims occurring sooner than anticipated, increasing associated claims cost and therefore reducing profit and shareholder equity.
Morbidity rates The cost of disability related claims depends on both the incidence of policyholders becoming disabled and the duration which they remain so. Higher than expected incidence and duration would be likely to increase claim costs, reducing profit and shareholders equity.

64
Bank of Queensland Limited and its Controlled Entities A.B.N. 32 009 656 740.
35. INSURANCE BUSINESS (CONTINUED)
2013 $m
2012 $m
Reconciliation of movements in insurance policy liabilities
Life Insurance contract policy liabilities
Gross life insurance contract liabilities at the beginning of the financial year 62.6 65.5
Decrease in life insurance contract policy liabilities (i) (1.9) (2.9)
Gross life insurance contract liabilities at the end of the financial year 60.7 62.6
Liabilities ceded under reinsurance
Opening balance at the beginning of the financial year (2.8) (2.4)
Increase / (decrease) in life reinsurance assets (ii) 0.5 (0.4)
Closing balance at the end of the financial year (2.3) (2.8)
Net life policy liabilities at the end of the financial year 58.4 59.8
(i) plus (ii) = change in life insurance contract liabilities reflected in the Income Statement (1.4) (3.3)
Components of net life insurance contract liabilities
Future policy benefits 81.4 77.8
Future charges for acquisition costs (23.0) (18.0)
Total net life insurance contract policy liabilities 58.4 59.8
Components of general insurance liabilities
Unearned Premium Liability 13.3 13.1
Outstanding Claims Liability 0.8 0.6
14.1 13.7
Total Insurance Policy Liabilities 72.5 73.5
Note: Future policy benefits include the unearned premium components of the liability. The accumulation method has been used to calculate policy liabilities and components relating to expenses and profits are not separately calculated.

65
PRELIMINARY FINAL REPORT
35. INSURANCE BUSINESS (CONTINUED)
Life Insurance Regulatory Capital requirements
Since Prudential Requirements changed on 1st January 2013, the regulatory capital requirement of each fund and for the subsidiary in total is the amount required to be held in accordance with LPS 110: Capital Adequacy. These are amounts required to meet the prudential standards prescribed by the Life Insurance Act 1995 to provide protection against the impact of fluctuations and unexpected adverse circumstances on the life company.
The methodology and bases for determining the Capital Base and regulatory capital requirements are in accordance with relevant Prudential Requirements.
2013
Statutory Fund No. 1
$m
Shareholders’ Fund
$m
Capital Base
Net Assets 32.2 1.2
Add / (subtract) regulatory adjustments to Net Assets (11.6) -
Total capital base 20.6 1.2
Asset risk charge 1.3 -
Operational risk charge 2.1 -
Total prescribed capital amount 3.4 -
Assets in excess of prescribed capital amount 17.2 1.2
Capital adequacy multiple 6.1 61.9
2013 $m
Composition of capital Base
Common equity tier 1 capital 33.4
Add / (subtract) regulatory adjustments to common equity tier 1 capital (11.6)
Total capital base 21.8
Prescribed Capital Amount
Statutory Fund No. 1 3.4
Shareholders' Fund -
Additional amount to meet company minimum 6.6
Total prescribed capital amount 10.0
Assets in excess of prescribed capital amount 11.8
Capital adequacy multiple 2.2
The prudential standards determining prudential capital requirements for life insurance companies changed during the year on 1 January 2013. The prior year’s prudential capital requirements are outlined below, however are not directly comparable.
Prior to 1st January 2013, the regulatory capital requirement of each statutory fund was the amount required to be held in accordance with LPS 2.04: Solvency Standard. These were amounts required to meet the prudential standards prescribed by the Life Insurance Act 1995 to provide protection against the impact of fluctuations and unexpected adverse circumstances on the life company. The methodology and bases for determining regulatory capital requirements were in accordance with the requirements of LPS 2.04: Solvency Standard.

66
Bank of Queensland Limited and its Controlled Entities A.B.N. 32 009 656 740.
35. INSURANCE BUSINESS (CONTINUED)
Life Insurance Regulatory Capital requirements (continued)
Statutory Fund No. 1 2012 $m
Solvency requirement (1) 77.5
Total assets less assets arising from reinsurance contracts 89.2
Assets in excess of solvency requirement 11.7
(1) The minimum level of assets required to be held in each statutory fund as prescribed in LPS 2.04: Solvency Standard
The Shareholders’ Fund held a minimum regulatory capital requirement in accordance with Prudential Standard No. 2 (PS 2) of $10,000,000. As at 31 August 2012, the Shareholders’ Fund held an excess of $853,300 above the minimum capital requirement.
Disaggregated information life insurance (before consolidation adjustments)
Summarised Statement of Profit and Loss and Other Comprehensive Income2013 $m
2012 $m
Revenue
Life insurance premium revenue 62.3 63.2
Investment income 4.4 5.6
Net life insurance premium revenue 66.7 68.8
Expenses
Net claims and other liability expense from insurance contracts 35.0 36.3
Other expenses 7.4 7.2
42.4 43.5
Profit / (loss) before income tax 24.3 25.3
Income tax expense (7.3) (7.6)
Profit / (loss) after income tax 17.0 17.7
Statement of Sources of Profit / (Loss) for Statutory Funds
Operating profit / (loss) after income tax arose from:
Components of profit / (loss) related to movement in life insurance liabilities:
Planned margins of revenues over expenses released 15.3 16.2
Difference between actual and assumed experience (0.1) (0.5)
Summarised Balance Sheet
Assets
Investment assets 98.5 98.4
Other assets 2.1 1.8
100.6 100.2
Liabilities
Net life insurance liabilities 50.2 46.2
Liabilities other than life insurance liabilities 16.9 14.5
67.1 60.7
Issued capital, reserves and retained profits
Directly attributable to shareholders 33.4 39.5
33.4 39.5
The life insurance business has no life investment contracts.

67
PRELIMINARY FINAL REPORT
36. EVENTS SUBSEQUENT TO BALANCE DATEOther than as disclosed below, no matters or circumstances have arisen since the end of the financial year and up until the date of this report which significantly affects the operations of the Bank, the results of those operations, or the state of affairs of the Bank in subsequent years.
Dividends have been declared after 31 August 2013, refer to Note 7.
The financial effect of the above transactions have not been brought to account in the financial statements for the year ended 31 August 2013.
37. INVESTMENTS ACCOUNTED FOR USING THE EQUITY METHODThe Consolidated Entity’s share of profit in its equity accounted investees for the year was $1.1m (2012: nil).
The principal activity of the joint venture entities is land subdivision, development and sale. Details of interest in joint ventures are as follows:
Percentage Ownership Interest
2013 (%)
2012 (%)
Ocean Springs Pty Ltd (Brighton) 9.31 9.31
Dalyellup Beach Pty Ltd (Dalyellup) 17.08 17.08
Wanneroo North Pty Ltd (The Grove) 21.42 21.42
East Busselton Estate Pty Ltd (Provence) 25.00 25.00
Coastview Nominees Pty Ltd (Margaret River) 5.81 5.81
Provence 2 Pty Ltd (Provence 2) 25.00 25.00
The above companies are proprietary companies incorporated in Australia. There are no material capital commitments or contingent liabilities relating to the joint ventures.
Summary financial information for equity accounted investees, not adjusted for the percentage ownership held by the consolidated entity and fair value adjustments on acquisition, is contained in the table below:
2013 $m
2012 $m
Balance Sheet
Current assets 90.2 106.5
Non-current assets 97.8 113.4
Total assets 188.0 219.9
Current liabilities 60.9 44.0
Non-current liabilities 5.6 18.9
Total liabilities 66.5 62.9
Net assets 121.5 157.0
Profit and Loss
Revenues 49.0 65.4
Expenses (23.0) (23.7)
Profit 26.0 41.7

68
Bank of Queensland Limited and its Controlled Entities A.B.N. 32 009 656 740.
SHAREHOLDING DETAILS
As at 18 September 2013, the following shareholding details applied:
1. Twenty largest ordinary shareholders
Shareholder No. of ordinary shares %
HSBC CUSTODY NOMINEES (AUSTRALIA) LIMITED 41,997,329 13.13%
NATIONAL NOMINEES LIMITED 36,136,769 11.30%
J P MORGAN NOMINEES AUSTRALIA LIMITED 26,272,009 8.21%
CITICORP NOMINEES PTY LIMITED 12,006,717 3.75%
MILTON CORPORATION LIMITED 6,550,276 2.05%
BNP PARIBAS NOMS PTY LTD 6,160,477 1.93%
JP MORGAN NOMINEES AUSTRALIA LIMITED 6,120,234 1.91%
AMP LIFE LIMITED 3,554,370 1.11%
CORVINA HOLDINGS LIMITED 3,203,115 1.00%
CITICORP NOMINEES PTY LIMITED 2,172,778 0.68%
HSBC CUSTODY NOMINEES (AUSTRALIA) LIMITED 2,091,356 0.65%
RBC INVESTOR SERVICES AUSTRALIA NOMINEES PTY 1,966,231 0.61%
WASHINGTON H SOUL PATTINSON AND COMPANY LIMITED 1,344,347 0.42%
NEWECONOMY COM AU NOMINEES PTY LIMITED 1,342,338 0.42%
QIC LIMITED 1,263,981 0.40%
UBS WEALTH MANAGEMENT AUSTRALIA NOMINEES PTY LTD 1,120,180 0.35%
UBS NOMINEES PTY LTD 1,111,575 0.35%
BNP PARIBAS NOMINEES PTY LTD 1,036,107 0.32%
JBWERE (NZ) NOMINEES LTD 935,860 0.29%
KARATAL HOLDINGS P/L 830,380 0.26%
Total 157,216,429 49.14%
Voting rights
On a show of hands every person present who is a holder or ordinary shares or a duly appointed representative of a holder of ordinary shares has one vote, and on a poll each member present in person or by proxy or attorney has one vote for each share that person holds.

69
PRELIMINARY FINAL REPORT
SHAREHOLDING DETAILS (CONTINUED)
As at 18 September 2013, the following shareholding details applied:
2. Twenty largest CPS shareholders
Shareholder No. of ordinary shares %
J P MORGAN NOMINEES AUSTRALIA LIMITED 67,504 2.25%
MILTON CORPORATION LIMITED 50,000 1.67%
DOMER MINING CO PTY LTD 32,200 1.07%
NAVIGATOR AUSTRALIA LTD 32,118 1.07%
UBS WEALTH MANAGEMENT AUSTRALIA NOMINEES PTY LTD 31,783 1.06%
NATIONAL NOMINEES LIMITED 25,749 0.86%
HSBC CUSTODY NOMINEES (AUSTRALIA) LIMITED 24,740 0.82%
RBC INVESTOR SERVICES AUSTRALIA NOMINEES PTY LIMITED 24,252 0.81%
THE AUSTRALIAN NATIONAL UNIVERSITY 20,000 0.67%
NULIS NOMINEES (AUSTRALIA) LIMITED 17,446 0.58%
BNP PARIBAS NOMS PTY LTD 16,400 0.55%
WENTHOR PTY LTD THE JOHN THORSEN FAMILY 15,000 0.50%
CITICORP NOMINEES PTY LIMITED 11,518 0.38%
BCITF (QLD) 10,700 0.36%
AUSTRALIAN EXECUTOR TRUSTEES LIMITED 10,237 0.34%
SOUTHERN METROPOLITAN CEMETERIES 10,000 0.33%
F & B INVESTMENTS PTY LIMITED 10,000 0.33%
EASTCOTE PTY LTD 10,000 0.33%
MR JOHN HARRISON VALDER & MRS KAY ORMONDE VALDER 10,000 0.33%
CANTALA PTY LTD 9,150 0.31%
Total 438,797 14.62%
Voting rights
The CPS do not give the holders any voting rights at any general shareholders meetings, except in certain circumstances.
3. Distribution of equity security holders
Ordinary Shares CPS
Category 2013 2012 2013 2012
1 - 1,000 56,120 55,474 6,332 4,065
1,001 - 5,000 24,722 21,665 355 208
5,001 - 10,000 4,164 3,408 22 17
10,001 - 100,000 2,134 1,696 15 11
100,000 - and over 77 66 - 1
Total 87,217 82,309 6,724 4,302
The number of ordinary shareholders holding less than a marketable parcel is 3,051.
The number of convertible preference shareholders holding less than a marketable parcel is nil.

70
Bank of Queensland Limited and its Controlled Entities A.B.N. 32 009 656 740.
SHAREHOLDING DETAILS (CONTINUED)
4. Partly Paid Shares
There are no partly paid shares.
5. There are currently no substantial shareholders in the Bank
6. Stock exchange listing
The shares of Bank of Queensland Limited (“BoQ”) and CPS (“BOQPD”) are quoted on the Australian Securities Exchange.
7. Options
At 31 August 2013 there were no options over unissued ordinary shares.
8. On market buy-back
There is no current on market buy-back.
9. Other information
Bank of Queenland Limited is a publicly listed company limited by shares and is incorporated and domiciled in Australia.