2012 mobile home market facts - insurance quotes: home, auto insurance …€¦ · ·...
TRANSCRIPT
2012 Mobile Home Market Facts


1
Background and Methodology
Since 1952, Foremost Insurance Company has been the nation’s leading manufactured home insurance specialist, providing manufactured home insurance products to meet the needs of manufactured home owners and contributing to industry growth through innovative insurance and financing programs.
Foremost Insurance Company has sponsored corporate studies of the manufactured home market since 1979. We have continued to evolve the study to make sure the data collected is as useful and relevant as possible. We have collected data to help us not only understand the market and how it is changing, but also the motivations and attitudes of the diverse population of manufactured home owners and residents.
MethodBeginning October 2 through October 18, 2012, email invitations were sent to members of the Survey Sampling International (SSI) online survey panel. SSI provided both pre-screened mobile home owners/residents and general population panelists. For our study, 10,002 completed surveys were collected.
Sample Requirements• Must own or reside in a manufactured, mobile or
modular home within the United States
• Must be 18 years of age or older
29,641 interviews were started:
• Resultingin10,002completedsurveys.17,173failedtoqualify,2,459failedtocompleteentiresurvey,7surveyerrors
• 9,055completescamefromtargetedSSIsample(pre-screenedformobilehomeownership)
• 947completescamefromuntargetedSSIsample(notpre-screenedformobilehomeownership)

The Mobile Home Market Shifts Toward Older Homes and Lower Income Households
• 55% of mobile home owners reported an annual household income less than $30,000, representing a 16% increase from 2008
• Despite four years between the surveys, the median model year is older in the 2012 Market Facts report
• 52% of respondents estimated the market value of their mobile home was under $20,000, a 6% increase from 2008
• 41% of mobile home units were purchased for under $20,000, representing a 6% increase from 2008
Market Trends• 27% of all mobile home households (owner-occupied) own one or more specialty product, which includes Boat,
Motorcycle, Motor Home, Travel Trailer, Sailboat, Personal Watercraft, ATV and Snowmobile
• 25% of owners expect to move or sell their mobile home within the next five years
• Of those planning to move or sell, 34% expect a mobile home to be their next residence (up 3% from 2008 Market Facts)
• Median model year and estimated value have decreased from Market Facts 2008
• Single-section homes represented 59% of all units
• Multi-section homes are down 8% since our 2008 study
Mobile Home Residents Profile• 68% own or are buying their mobile home; 24% rent
• 9% have a four-year college or advanced degree
• 40% of mobile home owners don’t anticipate ever selling or moving from their current home
• 26% of owner-occupied manufactured homes are currently uninsured
2

3399
36
294
52
38
113
115
31
40
86
192
756
76
81
234
217
270185 306
355
242
163
133382
190268
380
660
178157
312
28611
437
53
10622
241
196
576
78
442
1092
20
8
4947
60
Demographics
Respondents by State
3
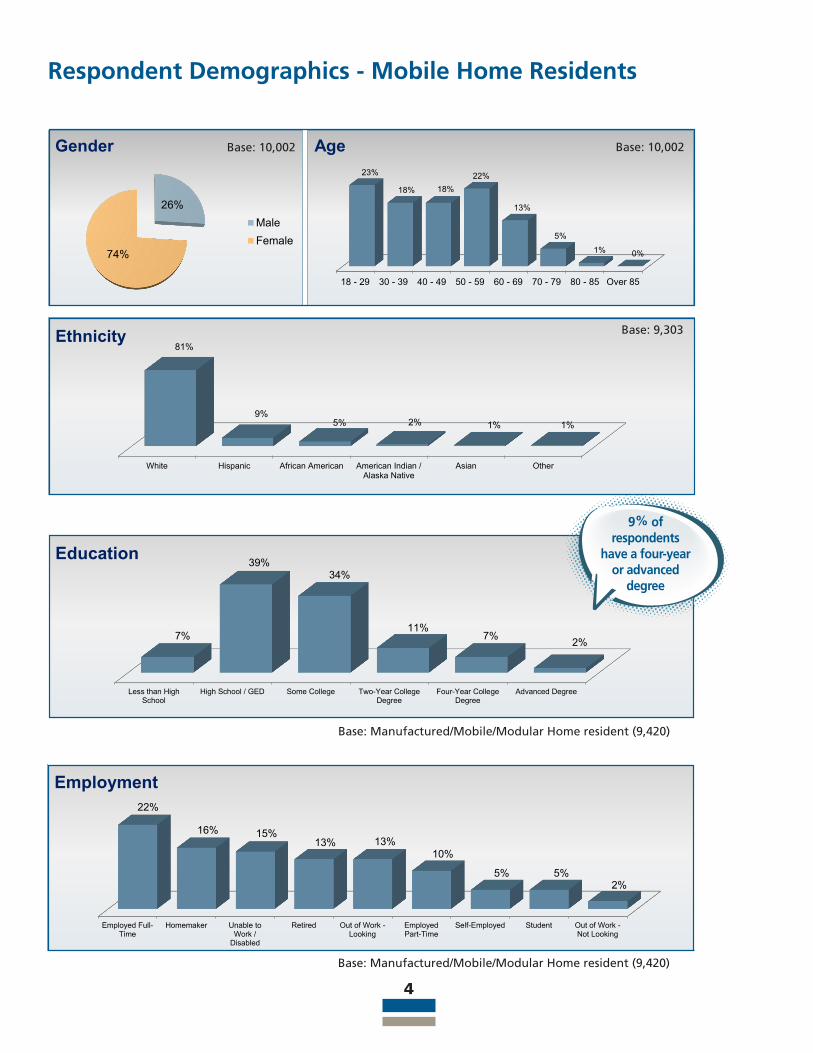
Respondent Demographics - Mobile Home Residents
White Hispanic African American American Indian /Alaska Native
Asian Other
81%
9%5% 2% 1% 1%
Ethnicity
Less than HighSchool
High School / GED Some College Two-Year CollegeDegree
Four-Year CollegeDegree
Advanced Degree
7%
39%34%
11%7% 2%
Education
Base: Manufactured/Mobile/Modular Home resident (9,420)
9% of respondents
have a four-year or advanced
degree
Employed Full-Time
Homemaker Unable toWork /
Disabled
Retired Out of Work -Looking
EmployedPart-Time
Self-Employed Student Out of Work -Not Looking
22%
16% 15%13% 13%
10%
5% 5%2%
Employment
Base: Manufactured/Mobile/Modular Home resident (9,420)
4
Base: 9,303
26%
74%
Gender
MaleFemale
18 - 29 30 - 39 40 - 49 50 - 59 60 - 69 70 - 79 80 - 85 Over 85
23%
18% 18%22%
13%
5%
1% 0%
Age Base: 10,002Base: 10,002
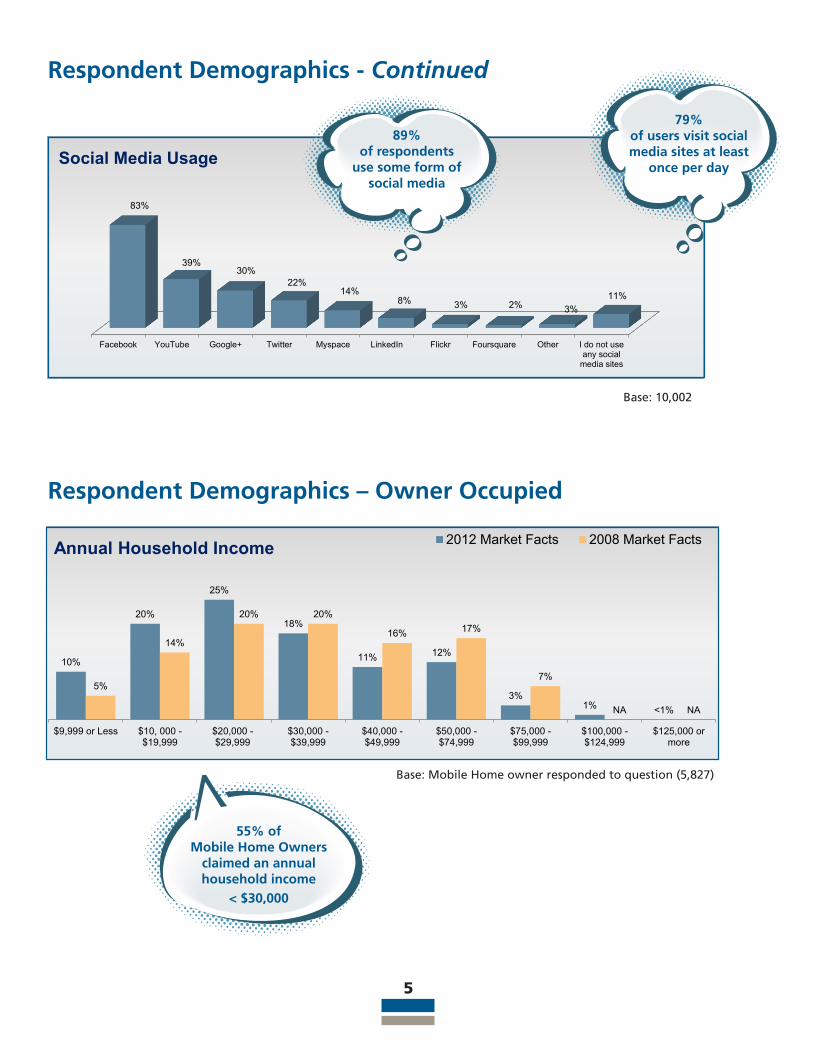
Facebook YouTube Google+ Twitter Myspace LinkedIn Flickr Foursquare Other I do not useany social
media sites
83%
39%30%
22%14%
8% 3% 2% 3%11%
Social Media Usage
10%
20%
25%
18%
11% 12%
3%1% <1%
5%
14%
20% 20%
16% 17%
7%
NA NA
$9,999 or Less $10, 000 -$19,999
$20,000 -$29,999
$30,000 -$39,999
$40,000 -$49,999
$50,000 -$74,999
$75,000 -$99,999
$100,000 -$124,999
$125,000 ormore
Annual Household Income 2012 Market Facts 2008 Market Facts
Respondent Demographics - Continued
79% of users visit social media sites at least
once per day
89% of respondents
use some form of social media
Respondent Demographics – Owner Occupied
55% of Mobile Home Owners
claimed an annual household income
< $30,000
5
Base: 10,002
Base: Mobile Home owner responded to question (5,827)

Just estimating, what is your total net worth? Include stocks, bonds, savings, value of your home, retirement funds, 401ks, personal belongings, assets, other real estate investments, etc., minus any liabilities. This question is asking about your total net worth and NOT your annual income.
In 2012, we saw a higher concentration
of respondents reporting net worth below $25,000
Base: Total Sample, not including “prefer not to answer” (5,351)
2008 Base: Total Sample, not including “prefer not to answer” (8,129)
Two Generations(i.e. parents and adult children over
the age of 25)
Three Generations(i.e. parents, adult children,
grandchildren)
Skipped Generation(i.e. grandparents, and
grandchildren, without parents)
More than Three Generations(i.e. grandparents, parents, adult
children, and great grandchildren)
No, none of these are representative of my household
17%
10%
2%
2%
71%
MH Owner /Resident
NON MH Owner / Resident
20%
8%
1%
1%
70%
Household CompositionDo any of the following describe your current household composition?
Base: 10,002 Base: 17,173
Estimated Net Worth – Owner Occupied
6
Mobile Home NON Mobile Home Owner/Resident Owner/Resident
Less than $25,000
$25,000 - $49,999
$50,000 - $99,999
$100,000 - $249,999
$250,000 - $499,999
$500,000 and over
36%
21%
21%
16%
5%
2%
32%
22%
21%
18%
5%
2%
2012 Market Facts 2008 Market Facts
Two Generations(i.e. parents and adult children
over the age of 25)
Three Generations(i.e. parents, adult children,
and grandchildren)
Skipped Generation(i.e. grandparents, and
grandchildren without parents)
More than Three Generations(i.e. grandparents, parents, adult
children, and great grandchildren)
No, none of these are representative of my household
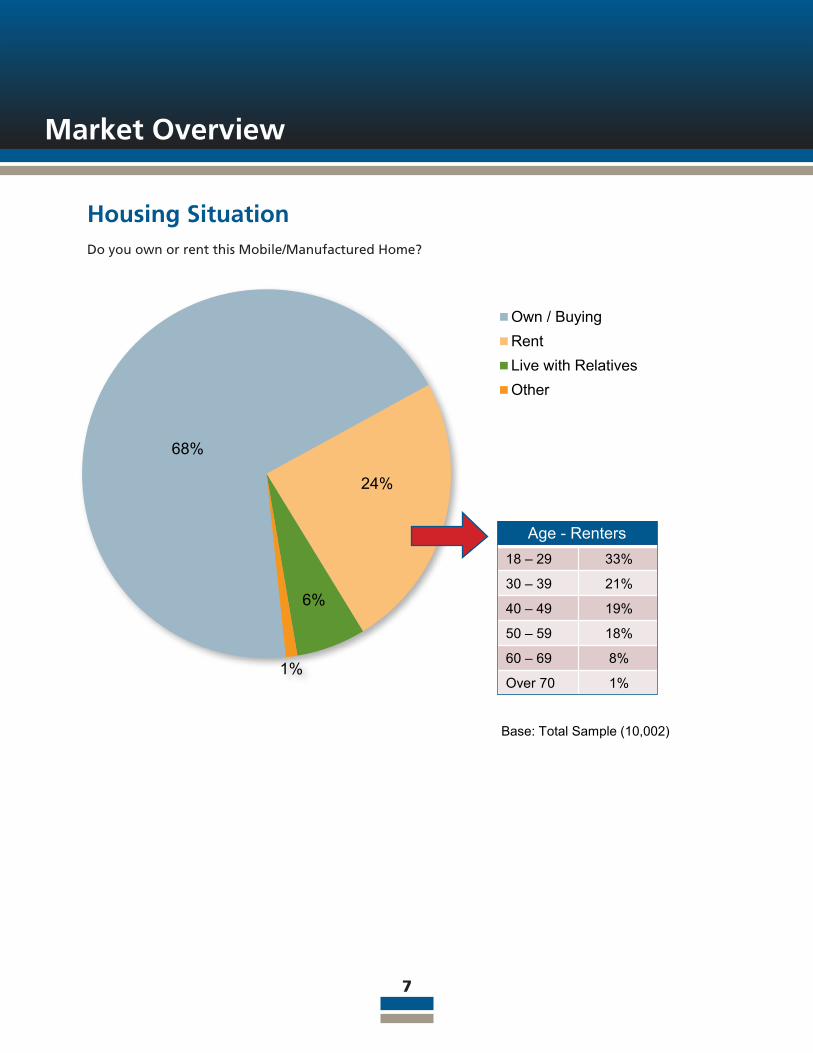
68%
24%
6%
1%
Own / BuyingRentLive with RelativesOther
Market Overview
Housing SituationDo you own or rent this Mobile/Manufactured Home?
Age – Renters
18 – 29 33%
30 – 39 21%
40 – 49 19%
50 – 59 18%
60 – 69 8%
Over 70 1%
Base: Total Sample (10,002)
7
Age - Renters
Market Overview
68%
24%
6%
1%
Own / BuyingRentLive with RelativesOther

Prior to 1960
1960 ― 1965
1966 ― 1970
1971 ― 1976
1977 ― 1980
1981 ― 1985
1986 ― 1990
1991 ― 1995
1996 ― 2000
2001 ― 2005
2006 to present
<1%
<1%
<1%
1%
1%
3%
5%
9%
17%
23%
39%
0%
<1%
<1%
1%
2%
3%
6%
12%
26%
32%
17%
2012 Market Facts 2008 Market Facts
Manufactured Home LocationWhich of the following best describes the location of your Mobile/Manufactured Home?
Year of PurchaseIn what year did you purchase or acquire your Mobile/Manufactured Home?
1999 2002 2005 2008 2012
A mobile home park –do not own the lot 39% 35% 36% 37% 39%
On (owners) private property** 47% 51% 51% 49% 46%
On someone else’s property** 8% 8% 6% 6% 7%
Mobile home subdivision or park – own the lot 6% 6% 6% 7% 7%
Condo / Co-op mobilehome park 1% 1% 1% 1% 1%
Base: 17,926 17,432 16,094 10,600 10,002
Respondents who reside within a Mobile Home park continue
to grow slightly
Base: Owners, answered question (7,213)
**Numbers based on mobile home owners (7,406)
8
Nearly 40% of the Mobile Home units in this survey were purchased/acquired
within the last seven years
Less than $4,999
$5,000 ― $9,999
$10,000 ― $19,999
$20,000 ― $29,999
$30,000 ― $39,999
$40,000 ― $49,999
$50,000 ― $74,999
$75,000 ― $99,999
$100,000 ― $124,999
$125,000 or more
12%
11%
18%
14%
13%
9%
13%
6%
2%
2%
9%
9%
17%
16%
13%
9%
15%
7%
2%
3%
2012 Market Facts 2008 Market Facts
Older than 1960
1960 ― 1965
1966 ― 1970
1971 ― 1976
1977 ― 1980
1981 ― 1985
1986 ― 1990
1991 ― 1995
1996 ― 2000
2001 ― 2005
2006 or newer
1%
2%
4%
12%
9%
11%
11%
13%
18%
11%
7%
<1%
1%
4%
12%
9%
10%
12%
14%
23%
11%
4%
2012 Market Facts 2008 Market Facts
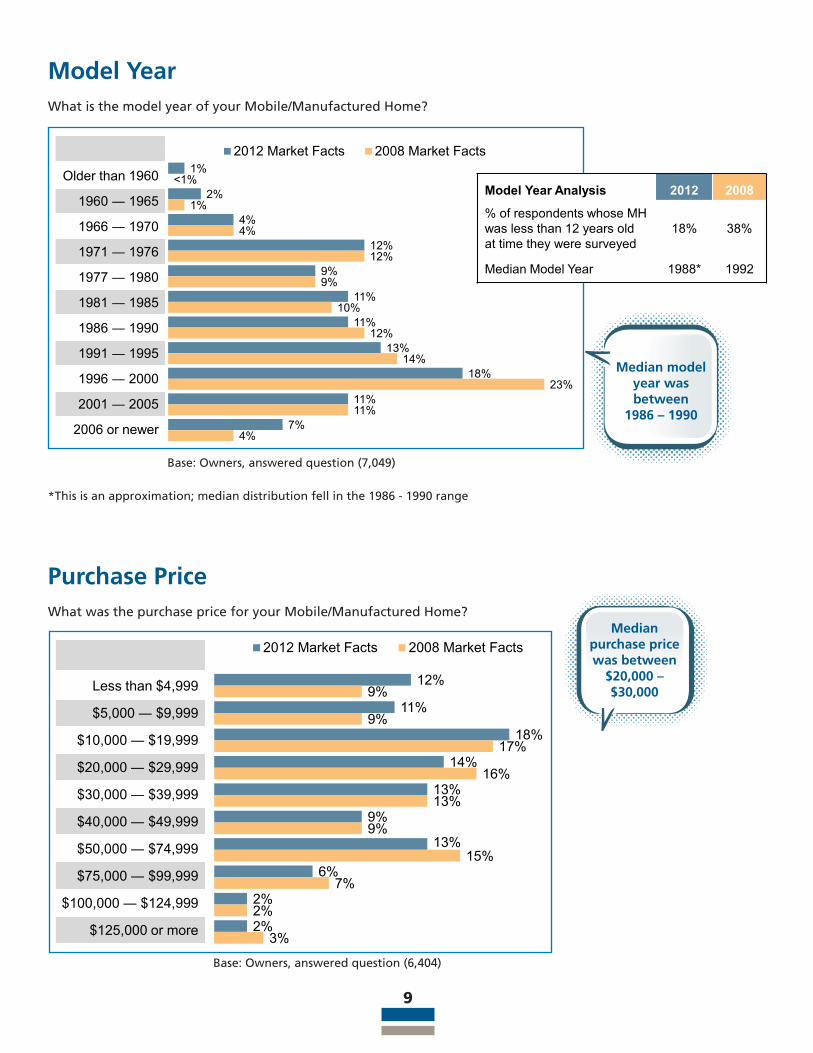
Model YearWhat is the model year of your Mobile/Manufactured Home?
Median model year was between
1986 – 1990
*This is an approximation; median distribution fell in the 1986 - 1990 range
Base: Owners, answered question (7,049)
Purchase PriceWhat was the purchase price for your Mobile/Manufactured Home?
Median purchase price was between
$20,000 – $30,000
Base: Owners, answered question (6,404)
9
Model Year Analysis 2012 2008
% of respondents whose MH was less than 12 years old at time they were surveyed
18% 38%
Median Model Year 1988* 1992

57%
43%38%
34%29%
23%17%
7%3% 1% 1%
9%
24%
22%
21%24%
24%
23%
21%
12%
5%2%
9%13%
13%18%
17%
18%
21%
23%
23%
14%
6%
6%
6%
8% 9%9%
10%11%
15%
16%
13%
11%
2%
6%
4% 5%5%
5% 8%
9%
11%
13%
16%
3%
3%5% 4%
4%5% 5%
6%
9%
14%
13%
6%
1% 5% 5%7% 7% 8%
8%
11%
17%
18%
3%1% 2% 2% 4% 4% 3%
6%7%
11%
17%
2% 2% 2% 2% 1% 2% 2%2% 3%
6%
8%
2% 2% 1% 1% 2% 1% 1% 3% 4% 6%10%
0%
10%
20%
30%
40%
50%
60%
70%
80%
90%
100%
Older than1960
1960 - 1965 1966 - 1970 1971 - 1976 1977 - 1980 1981 - 1985 1986 - 1990 1991 - 1995 1996 - 2000 2001 - 2005 2006 ornewer
Less than $4,999 $5,000 - $9,999 $10,000 - $19,999 $20,000 - $29,999 $30,000 - $39,999$40,000 - $49,999 $50,000 - $74,999 $75,000 - $99,999 $100,000 - $124,999 $125,000 or more
The average estimated replacement
value of personal property within home was $30,188*, up more than $5,000 from 2008
Less than $4,999
$5,000 ― $9,999
$10,000 ― $19,999
$20,000 ― $29,999
$30,000 ― $39,999
$40,000 ― $49,999
$50,000 ― $74,999
$75,000 ― $99,999
$100,000 ― $124,999
$125,000 or more
17%
17%
18%
12%
8%
7%
9%
6%
3%
3%
17%
12%
17%
12%
8%
6%
12%
7%
3%
5%
2012 Market Facts 2008 Market Facts
Estimated Market ValueIn your estimation, if you were to sell this Mobile/Manufactured Home today, what price do you think you could get?
Median market value estimate was $10,000 -
$20,000
Estimated Market Value by Model YearIn your estimation, if you were to sell this Mobile/Manufactured Home today, what price do you think you could get?
10
*Only estimates between $100 - $125,000 were used for calculation (base: 8,124)
13% of respondents didn’t know the estimated market value of their Mobile Home

1999 2002 2005 2008 2012
Mobile Home 65% 63% 57% 61% 52%
Trailer 16% 14% 15% 14% 18%
Double Wide* 1% 1% 2% 1% 18%
Manufactured Home 11% 13% 17% 16% 8%
House 4% 5% 6% 5% 3%
Modular Home 3% 3% 3% 2% 1%
Travel Trailer 0% 0% 0% 0% 1%
Base: 17,536 17,107 16,047 10,595 10,002
Mobile Home DescriptionFor consistency, how do you describe or characterize your Mobile/Manufactured or Modular Home when someone asks what type of residence it is?
*Prior to 2012, this was captured as an “Other” please specify, open-text category
Single Wide / Single Section
Double Wide / Double Section
Triple Wide / Triple Section
Other
Don’t know / Not sure
59%
36%
2%
1%
2%
Floor PlanWhich of these floor plans best describes your Mobile/Manufactured or Modular Home?
Base: Total Sample (10,002)
11
46%of manufactured
homes were described as multi-section
in 2008

Less than one year
One to five years
Six to ten years
Eleven to fifteen years
Sixteen to twenty years
More than twenty years
I don’t anticipate ever selling this home
I anticipate this will always be my home
Base:
5%
25%
15%
6%
3%
6%
40%
NA
22%
49%
9%
2%
1%
1%
15%
Future Housing PlanHow many years do you anticipate owning, living in or renting this Mobile/Manufactured Home?
Base: (7,670) (2,332)
12
Owner Occupied Non-Owner
NA
Standard built house
Double Wide[Mobile/Manufactured Home]
Single Wide[Mobile/Manufactured Home]
Apartment
Senior Citizen Community /Assisted Living Center
Condominium or Town House
Triple Wide[Mobile/Manufactured Home]
Duplex / Triplex / Quadriplex
Other
40%
21%
10%
7%
7%
4%
3%
1%
7%
52%
21%
8%
6%
6%
2%
2%
0%
2%
2012 Market Facts 2008 Market Facts
Base: Currently own and reside in a Mobile Home, anticipate moving in the future (3,798)
Next Residence - Owner OccupiedAt this time, what do you anticipate your next residence will be?
Manufactured home as next anticipated
residence up 3% from 2008

Features / EquipmentWhich of the following items do you have in your Mobile/Manufactured Home?
13
1999 2002 2005 2008 2012
Fire extinguisher 66% 68% 71% 68% 62%
Dead-bolt locks on every exterior door 52% 56% 67% 66% 60%
Carbon monoxide detector 17% 22% 27% 31% 35%
Fire alarm with central monitoring service 3% 4% 5% 12% 27%
Wood burning stove or fireplace 18% 20% 24% 23% 18%
Burglar alarm with central monitoring service 5% 6% 8% 7% 10%
Base: 17,926 17,432 16,094 10,600 10,002

“Foremost” and the “F” logo are registered trademarks of FCOA, LLC, 5600 Beech Tree Lane, Caledonia, MI 49316. Insurance provided by a member of the Farmers Insurance Group®, that includes the Foremost Insurance Group. 9008833 05/13
Foremost Means More.™