key facts about health insurance and
TRANSCRIPT
REPORT
December 2017The Uninsured: A Primer Key Facts about Health Insurance and the Uninsured Under the Affordable Care Act
Prepared by:
Julia FoutzEllen SquiresRachel GarfieldKaiser Family Foundation
and
Anthony DamicoConsultant
The Uninsured: A Primer
Executive Summary ................................................................................................................................................. 1
Introduction ............................................................................................................................................................ 2
How has health insurance coverage changed under the ACA? .............................................................................. 3
Health Insurance Coverage before the ACA ........................................................................................................ 3
ACA Coverage Provisions .................................................................................................................................... 4
Changes in The Number of Uninsured Under the ACA ...................................................................................... 6
Who remains uninsured after the ACA and why do they lack coverage? ............................................................... 9
How does lack of insurance affect access to health care? ...................................................................................... 11
What are the financial implications of lacking insurance? .................................................................................... 13
Conclusion ............................................................................................................................................................. 15
Endnotes ................................................................................................................................................................ 16
The Uninsured: A Primer 1
In the past, gaps in the public insurance system and lack of access to affordable private coverage left millions
without health insurance, and the number of uninsured Americans grew over time, particularly during
economic downturns. By 2013, the year before the major coverage provisions of the Affordable Care Act (ACA)
went into effect, more than 44 million nonelderly individuals lacked coverage.1
Under the ACA, as of 2014, Medicaid coverage has expanded to nearly all adults with incomes at or below 138%
of poverty in states that have adopted the expansion, and tax credits are available for people with incomes up to
400% of poverty who purchase coverage through a health insurance marketplace. Millions of people have
enrolled in these new coverage options, and the uninsured rate has dropped to a historic low. Coverage gains
were particularly large among low-income people living in states that expanded Medicaid.
Still, millions of people—27.6 million nonelderly individuals as of 2016— remain without coverage.2 Those
most at risk of being uninsured include low-income individuals, adults, and people of color. Cost continues to
pose a major barrier to coverage with nearly half (45%) of nonelderly uninsured adults in 2016 saying that they
remained uninsured because the cost of coverage was too high.3
Health insurance makes a difference in whether and when people get necessary medical care, where they get
their care, and ultimately, how healthy they are. Uninsured people are far more likely than those with
insurance to postpone health care or forgo it altogether. The consequences can be severe, particularly when
preventable conditions or chronic diseases go undetected. While the safety net of public hospitals, community
clinics and health centers, and local providers provide a crucial health care safety net for uninsured people, it
does not close the access gap for the uninsured.
For many uninsured people, the costs of health insurance and medical care are weighed against equally
essential needs, like housing, food, and transportation to work, and many uninsured adults report being very or
moderately worried about paying basic monthly expenses such as rent or other housing costs and normal
monthly bills.4 When uninsured people use health care, they may be charged for the full cost of that care
(versus insurers, who negotiate discounts) and often face difficulty paying medical bills and potential medical
debt. Providers absorb some of the cost of care for the uninsured, and while uncompensated care funds cover
some of those costs, these funds do not fully offset the cost of care for the uninsured.
Under current law, nearly half (47%) of the remaining uninsured are outside the reach of the ACA either
because their state did not expand Medicaid, they are subject to immigrant eligibility restrictions, or their
income makes them ineligible for financial assistance.5 The remainder are eligible for assistance under the law
but may still struggle with affordability and knowledge of options and require targeted outreach to help them
gain coverage. However, proposed policies to change the structure of the Medicaid program or cut back
subsidies for Marketplace coverage may pose a challenge to further reducing the number of uninsured and may
threaten coverage gains seen in recent years. On the other hand, state action to take up the ACA Medicaid
expansion could make more people eligible for affordable coverage. The outcome of current debate over health
coverage policy in the United States has substantial implications for people’s coverage, access, and overall
health and well-being.
The Uninsured: A Primer 2
The Affordable Care Act (ACA) led to historic gains in health insurance coverage. The ACA builds on the
foundation of employer-based coverage and fills gaps in insurance availability and affordability by expanding
Medicaid for adults with incomes at or below 138% of the federal poverty level ($16,643 per year for an
individual in 2017)6 and providing premium tax credits to make private insurance in the individual market
more affordable for many with incomes between 100-400% of poverty (between $11,880 and $47,520 per year
for an individual in 2016). Most of the ACA’s major coverage provisions went into effect in 2014, and millions
of people have gained coverage under the law. Despite historic coverage gains, millions of people continue to
lack coverage for a variety of reasons. For example, Medicaid eligibility for adults remains limited in states that
have not adopted the expansion, some people remain ineligible for financial assistance for private coverage,
and some still find coverage unaffordable even with financial assistance. Furthermore, recent efforts to alter
the ACA or fundamentally change the structure of Medicaid may pose a challenge to further reducing the
number of uninsured and may threaten coverage gains seen in recent years.
The gaps in our health insurance system affect people of all ages, races and ethnicities; however, those with the
lowest incomes face the greatest risk of being uninsured. Being uninsured affects people’s ability to access
needed medical care and their financial security. As a result, uninsured people are less likely to receive
preventive care, are more likely to be hospitalized for conditions that could have been prevented, and are more
likely to die in the hospital than those with insurance. The financial impact can also be severe. Uninsured
families struggle financially to meet basic needs, and medical bills can quickly lead to medical debt.
The Uninsured: A Primer provides information on how insurance has changed under the ACA, how many
people remain uninsured, who they are, and why they lack health coverage. It also summarizes what we know
about the impact that a lack of insurance can have on health outcomes and personal finances and the difference
health insurance can make in people’s lives.
The Uninsured: A Primer 3
In the past, gaps in the public insurance system and lack of access to affordable private coverage left millions
without health insurance, and the number of uninsured Americans grew over time, particularly during
economic downturns. By 2013, the year before the major coverage provisions of the ACA went into effect, more
than 44 million people lacked coverage.7 Under the ACA, as of 2014, Medicaid coverage has been expanded to
nearly all adults with incomes at or below 138% of poverty in states that have adopted the expansion, and tax
credits are available for people with incomes up to 400% of poverty who purchase coverage through a health
insurance marketplace. Millions of people have enrolled in these new coverage options, and the uninsured rate
has dropped to a historic low. Coverage gains were particularly large among low-income people living in states
that expanded Medicaid. Still, millions of people—27.6 million nonelderly in 20168—remain without coverage.
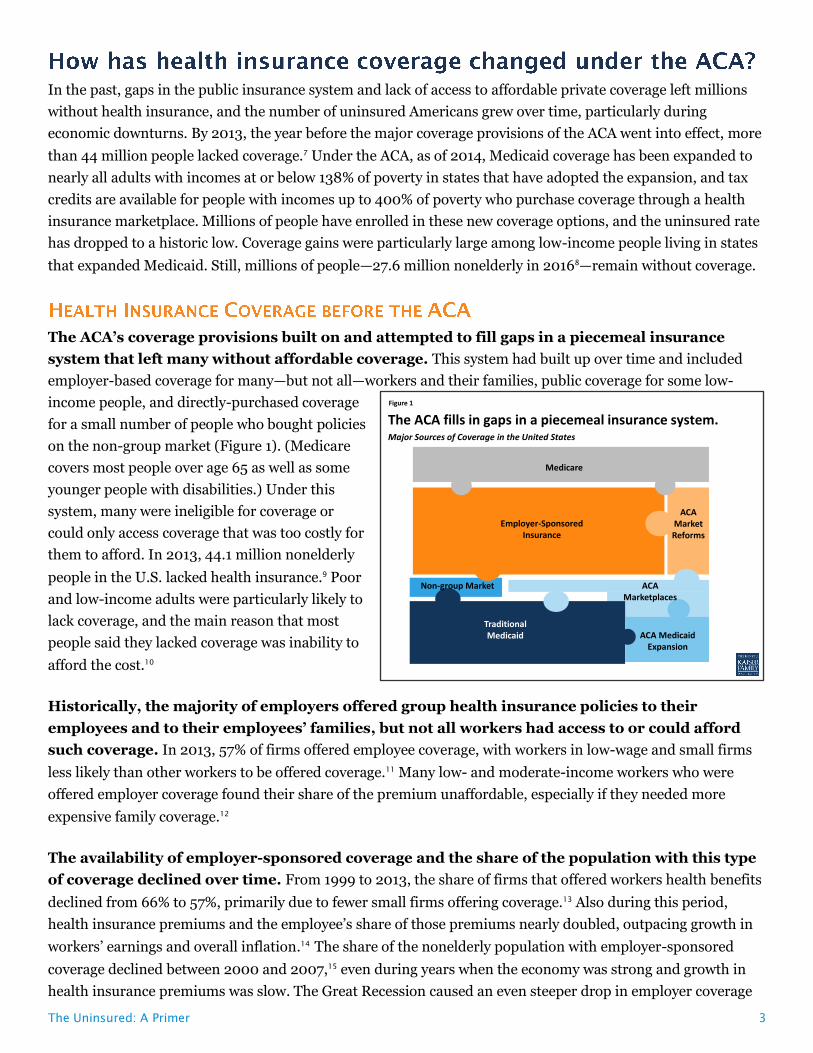
The ACA’s coverage provisions built on and attempted to fill gaps in a piecemeal insurance
system that left many without affordable coverage. This system had built up over time and included
employer-based coverage for many—but not all—workers and their families, public coverage for some low-
income people, and directly-purchased coverage
for a small number of people who bought policies
on the non-group market (Figure 1). (Medicare
covers most people over age 65 as well as some
younger people with disabilities.) Under this
system, many were ineligible for coverage or
could only access coverage that was too costly for
them to afford. In 2013, 44.1 million nonelderly
people in the U.S. lacked health insurance.9 Poor
and low-income adults were particularly likely to
lack coverage, and the main reason that most
people said they lacked coverage was inability to
afford the cost.10
Historically, the majority of employers offered group health insurance policies to their
employees and to their employees’ families, but not all workers had access to or could afford
such coverage. In 2013, 57% of firms offered employee coverage, with workers in low-wage and small firms
less likely than other workers to be offered coverage.11 Many low- and moderate-income workers who were
offered employer coverage found their share of the premium unaffordable, especially if they needed more
expensive family coverage.12
The availability of employer-sponsored coverage and the share of the population with this type
of coverage declined over time. From 1999 to 2013, the share of firms that offered workers health benefits
declined from 66% to 57%, primarily due to fewer small firms offering coverage.13 Also during this period,
health insurance premiums and the employee’s share of those premiums nearly doubled, outpacing growth in
workers’ earnings and overall inflation.14
The share of the nonelderly population with employer-sponsored
coverage declined between 2000 and 2007,15 even during years when the economy was strong and growth in
health insurance premiums was slow. The Great Recession caused an even steeper drop in employer coverage
Figure 1
The ACA fills in gaps in a piecemeal insurance system.
Traditional Medicaid ACA Medicaid
Expansion
Employer-Sponsored Insurance
ACA Market Reforms
ACA Marketplaces
Non-group Market
Major Sources of Coverage in the United States
Medicare
The Uninsured: A Primer 4
from 2008 to 2010 due to rising unemployment. As the economy began to stabilize from 2010 to 2013, the
decline in employer coverage slowed, but rates of employer coverage remained below pre-recession levels.16
Very few people were covered by non-group health insurance policies prior to the ACA. Private
policies directly purchased in the non-group, or individual, market (i.e., outside of employer-sponsored
benefits) covered only 5% of people under age 65 in 2013.17
Though, on average, non-group insurance
premiums were lower than those for employer-sponsored coverage, enrollees paid 100% of the cost because
they could not share that premium expense with an employer. Further, premiums in the non-group market
could vary by age or health status, and people with health problems or at risk for health problems could be
charged high rates, offered only limited coverage, or denied coverage altogether.
Medicaid and CHIP have been important sources of coverage for low-income children and
people with disabilities, but in the past, coverage for adults without disabilities was limited. In
2013, Medicaid and CHIP covered just under a fifth (19%) of the nonelderly population18 by primarily covering
four categories of low-income individuals: children, their parents, pregnant women, and individuals with
disabilities.19 Prior to the ACA, federal law required state Medicaid programs to cover school age children up to
100% of the poverty level (133% for infants and preschool children), and states took up options to expand
coverage to children in families with higher incomes (typically 200% of poverty or higher) through both
Medicaid and CHIP. In contrast, the role of Medicaid for nonelderly adults without a disability remained very
limited. In most states, parent eligibility remained very limited, often below 50% of the poverty level, and
adults without dependent children—regardless of how poor—were ineligible for Medicaid.
Insurance coverage varied by state depending on the income distribution in the state, the
nature of employment in the state, and the reach of state Medicaid programs. Insurance market
regulations and the availability of jobs with employer-sponsored coverage also influenced the insurance rate in
each state.20
Massachusetts had the lowest uninsured rate in the country in 2013 (4%), due in part to health
reform legislation enacted in 2006, while four states (Nevada, Texas, Arizona and Florida) had uninsured rates
above 20%.21
The ACA expanded Medicaid eligibility to adults with incomes at or below 138% of poverty, but
the 2012 Supreme Court ruling effectively made the expansion a state option. In addition to
Medicaid’s traditional role of covering low-income children, parents, pregnant women, and people with
disabilities (as well as some low-income elderly), the ACA expanded Medicaid to nearly all adults with incomes
at or below 138% of the poverty level (including low-income adults without dependent children who had
historically had no path to coverage). Under the law, the federal government provided 100 percent of the cost
of expansion from calendar years 2014-2016, and the federal share of costs gradually phases down to (and
remains at) 90 percent by 2020. As of September 2017, 32 states22, including DC, had expanded Medicaid
under the ACA.23 There is no deadline for states to expand Medicaid under the ACA, and discussion about the
Medicaid expansion continues in other states.
The ACA established health insurance marketplaces where individuals and small employers
can purchase insurance. Health insurance marketplaces operate in each state, but only some states run
their own marketplace.24 These marketplaces are designed to ensure a more level competitive environment for
The Uninsured: A Primer 5
insurers and to provide consumers with information on cost and quality to help them choose among plans. To
help make coverage purchased in these new marketplaces more affordable, the federal government provides
tax credits for people with incomes between 100% and 400% of poverty ($20,160 to $80,640 for a family of
three in 2016).25,26 These tax credits are available on a sliding scale based on income and limit premium costs to
a share of income. In addition, ACA makes available cost-sharing subsidies to reduce what people with incomes
between 100% and 250% of poverty have to pay out-of-pocket to access health services.27
Coverage for immigrants remains limited under the ACA. Lawfully-present immigrants can receive
coverage through the ACA coverage expansions, although they continue to face eligibility restrictions in
Medicaid that have been in place since prior to the ACA. Specifically, many lawfully present non-citizens who
would otherwise be eligible for Medicaid remain subject to a five-year waiting period before they may enroll.28
Lawfully present immigrants are eligible for tax credits for coverage purchased through a marketplace,
regardless of the number of years they have been in the U.S.29 In addition, lawfully present immigrants who
would be eligible for Medicaid but are in a five-year waiting period are also eligible for tax credits for
marketplace coverage. Undocumented immigrants are ineligible for Medicaid and are prohibited from
purchasing coverage through a marketplace or receiving tax credits.
The ACA includes provisions to promote employer-based coverage. Large and medium-size
employers (those with 50 or more full-time equivalent employees, or FTEs) now are assessed a fee up to
$2,000 per full-time employee (in excess of 30 employees) if they do not offer affordable coverage and have at
least one employee who receives a marketplace premium tax credit. To avoid penalties, employers must offer
insurance that pays for at least 60% of covered health care expenses, and the employee’s share of the individual
premium must not exceed 9.5% of family income.30 In addition, the ACA established the Small Business Health
Options Program (SHOP) marketplace, where employers with no more than 50 full-time equivalent (FTE)
employees can purchase coverage31 and employers with no more than 25 FTE employees and annual wages
of less than $52,000 may be eligible for tax credits (for up to two years) to reduce the cost of SHOP
coverage.32, 33 The Centers for Medicare and Medicaid Services (CMS) recently announced plans to change the
way that employers access SHOP plans, effective January 1, 2018.34
The ACA also extends dependent coverage in the private market. As of 2010, young adults may
remain on their parents’ private plans (including non-group and employer-based plans) until age 26. This
provision led to drastic decline in the young adult uninsured rate from 34% in 2010 to 14% in 2016.35
Under the ACA, almost all people are required to have health insurance coverage or be subject
to a tax penalty. This requirement was intended to encourage healthier individuals to purchase coverage
through the marketplace. The requirement only applies to those with access to affordable coverage, defined as
costing no more than 8% of an individual’s or family’s income (certain other exemptions to the mandate also
are granted). The penalty is assessed as 2.5% percent of family income, with both a minimum and maximum.
The penalty can be no less than a flat dollar amount equal to $695 per adult plus $347.50 per child, up to
$2,085 for the family. The penalty also can be no more than the national average premium for a bronze plan,
which averaged $272 for single coverage and $1,360 for a family of five or more in 2017.
The Uninsured: A Primer 6
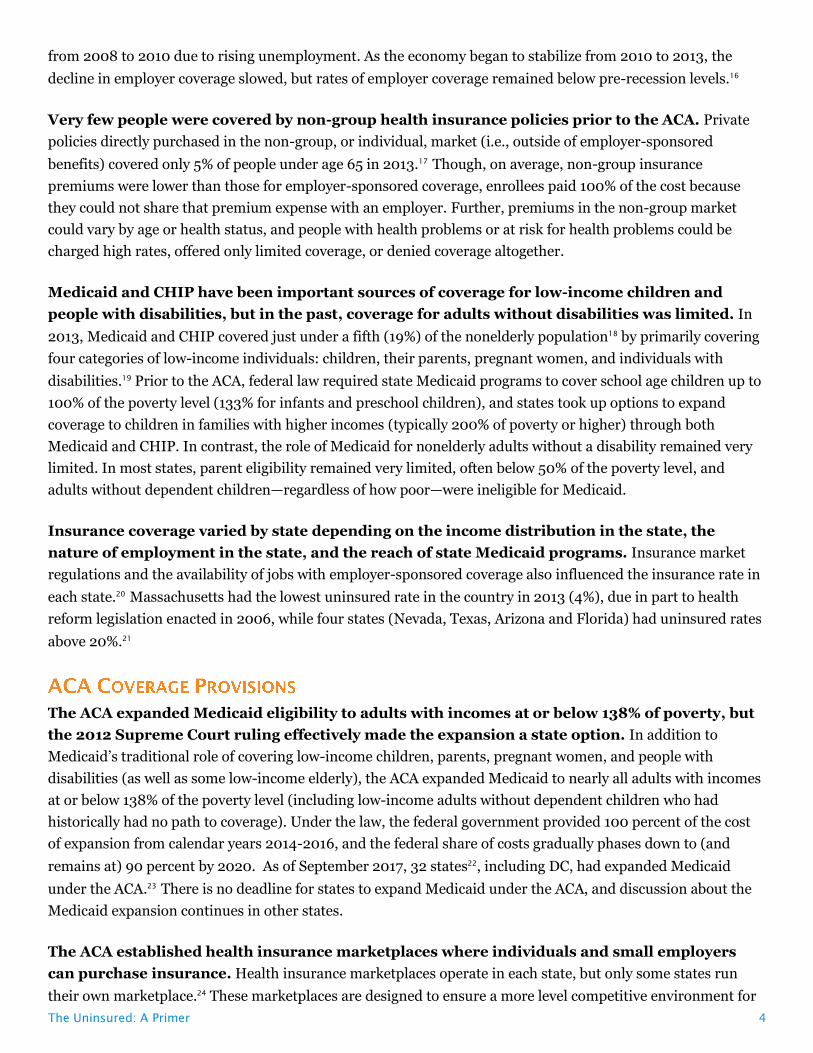
Under the ACA, the uninsured rate has
declined to a historic low. The share of the
nonelderly population that lacked insurance
coverage hovered around 16% between 1998 and
2007, then peaked during the ensuing economic
recession (Figure 2). As early provisions of the
ACA went into effect in 2010, and as the
economy improved, the uninsured rate began to
drop. When the major ACA coverage provisions
went into effect in 2014, the uninsured rate
dropped dramatically and continued to fall in
subsequent years. In 2016, the nonelderly
uninsured rate was 10.3%, the lowest in decades.
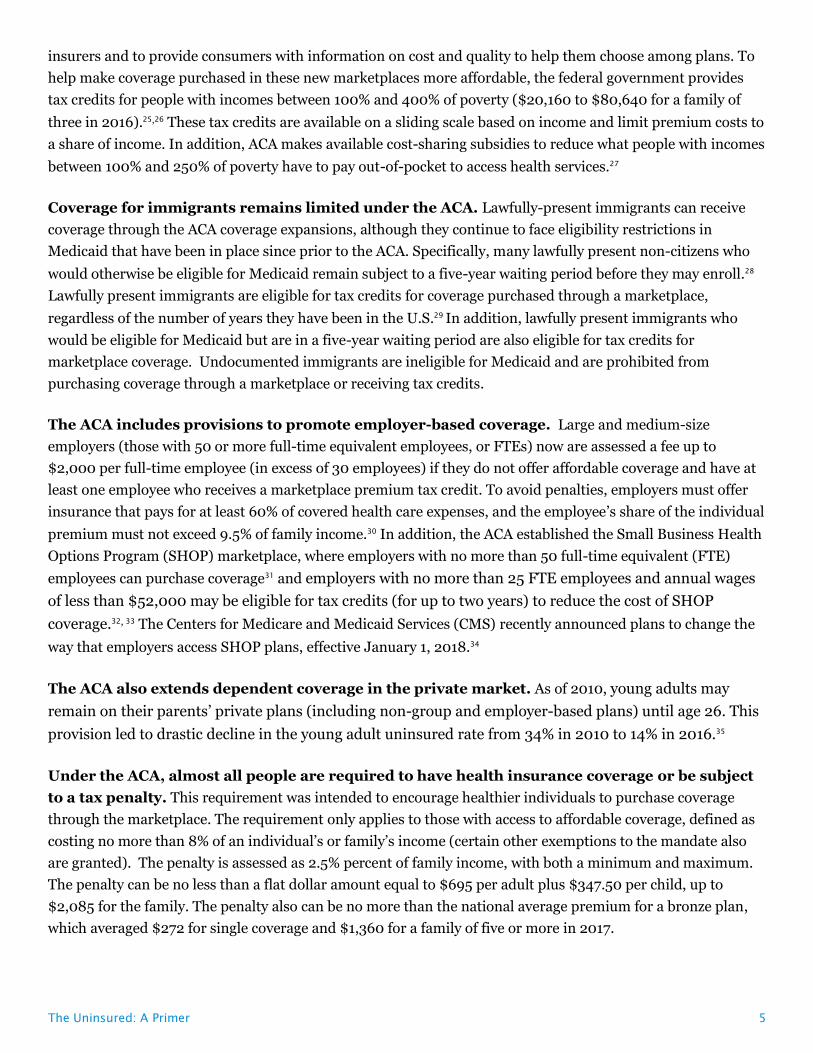
Over 16 million more people have health
coverage in 2016 compared to 2013.
Corresponding with implementation of the ACA’s
coverage provisions, the total number of
nonelderly uninsured individuals nationally
dropped from 44.1 million in 2013 to 27.6 million
in 2016, with the biggest decline in the first two
years of ACA implementation.36 Because the
expansions are largely targeted to adults, who
have historically had higher uninsured rates than
children, nearly the entire decline in the number
of uninsured people under the ACA has occurred
among adults (Figure 3).
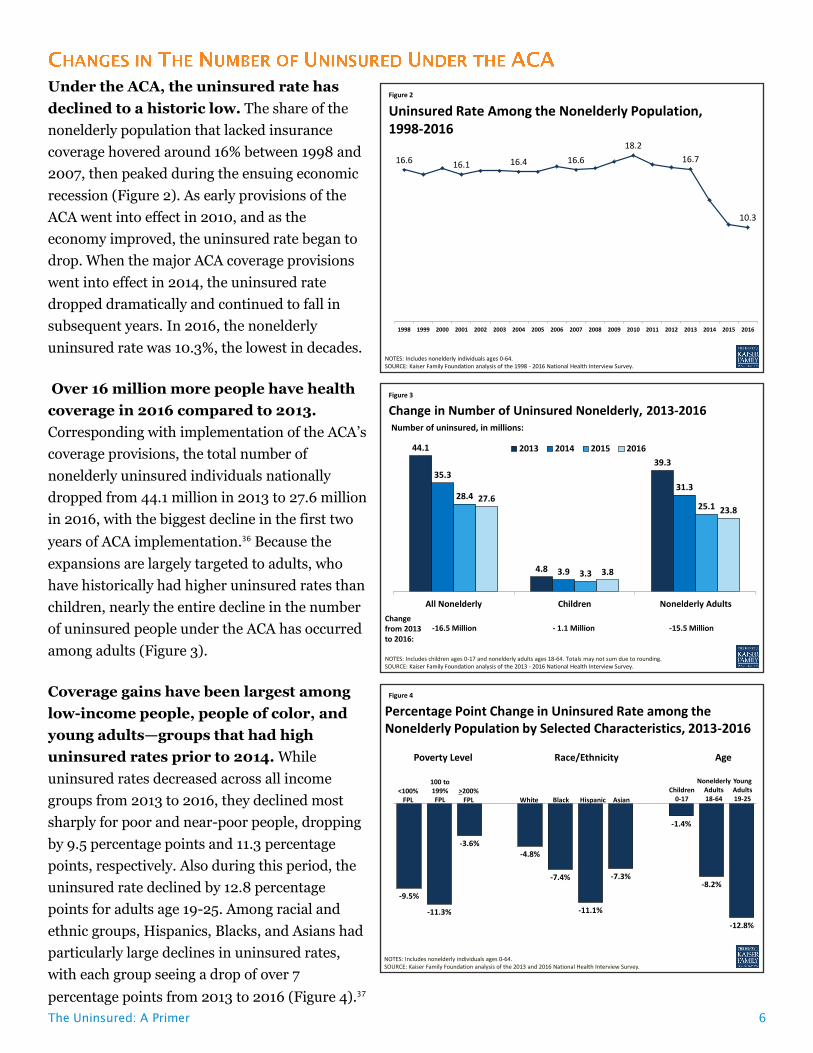
Coverage gains have been largest among
low-income people, people of color, and
young adults—groups that had high
uninsured rates prior to 2014. While
uninsured rates decreased across all income
groups from 2013 to 2016, they declined most
sharply for poor and near-poor people, dropping
by 9.5 percentage points and 11.3 percentage
points, respectively. Also during this period, the
uninsured rate declined by 12.8 percentage
points for adults age 19-25. Among racial and
ethnic groups, Hispanics, Blacks, and Asians had
particularly large declines in uninsured rates,
with each group seeing a drop of over 7
percentage points from 2013 to 2016 (Figure 4).37
Figure 2
16.6 16.1 16.4 16.6
18.2
16.7
10.3
1998 1999 2000 2001 2002 2003 2004 2005 2006 2007 2008 2009 2010 2011 2012 2013 2014 2015 2016
NOTES: Includes nonelderly individuals ages 0-64.SOURCE: Kaiser Family Foundation analysis of the 1998 - 2016 National Health Interview Survey.
Uninsured Rate Among the Nonelderly Population, 1998-2016
Figure 3
44.1
4.8
39.3
35.3
3.9
31.328.4
3.3
25.127.6
3.8
23.8
All Nonelderly Children Nonelderly Adults
2013 2014 2015 2016
NOTES: Includes children ages 0-17 and nonelderly adults ages 18-64. Totals may not sum due to rounding. SOURCE: Kaiser Family Foundation analysis of the 2013 - 2016 National Health Interview Survey.
Change in Number of Uninsured Nonelderly, 2013-2016
-16.5 Million
Number of uninsured, in millions:
Change from 2013 to 2016:
- 1.1 Million -15.5 Million
Figure 4
-9.5%
-11.3%
-3.6%
-4.8%
-7.4%
-11.1%
-7.3%
-1.4%
-8.2%
-12.8%
Percentage Point Change in Uninsured Rate among the Nonelderly Population by Selected Characteristics, 2013-2016
Poverty Level Race/Ethnicity
<100% FPL
100 to 199%FPL
>200%FPL White Black Hispanic Asian
Age
Children0-17
Young Adults 19-25
NOTES: Includes nonelderly individuals ages 0-64. SOURCE: Kaiser Family Foundation analysis of the 2013 and 2016 National Health Interview Survey.
Nonelderly Adults18-64
The Uninsured: A Primer 7
Growth in Medicaid and directly-purchased coverage accounted for much of the decline in the
uninsured rate. As of June 2017, national enrollment in Medicaid and CHIP had grown by over 17 million
people since September 2013 (before the ACA Medicaid expansion), a 29% increase in monthly Medicaid
enrollment.38 In addition, as of March 2017, over 10 million individuals were enrolled in a marketplace plan
and had paid their first month’s premium, the vast majority of whom (84%) received premium subsidies.39
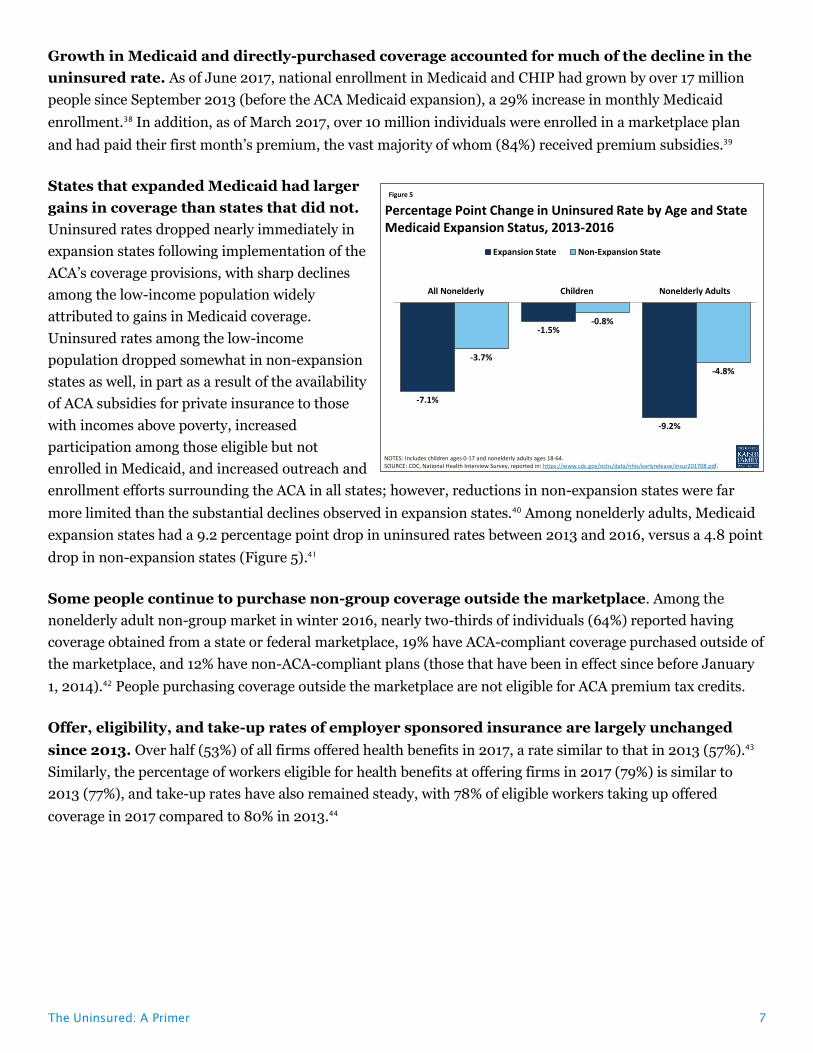
States that expanded Medicaid had larger
gains in coverage than states that did not.
Uninsured rates dropped nearly immediately in
expansion states following implementation of the
ACA’s coverage provisions, with sharp declines
among the low-income population widely
attributed to gains in Medicaid coverage.
Uninsured rates among the low-income
population dropped somewhat in non-expansion
states as well, in part as a result of the availability
of ACA subsidies for private insurance to those
with incomes above poverty, increased
participation among those eligible but not
enrolled in Medicaid, and increased outreach and
enrollment efforts surrounding the ACA in all states; however, reductions in non-expansion states were far
more limited than the substantial declines observed in expansion states.40 Among nonelderly adults, Medicaid
expansion states had a 9.2 percentage point drop in uninsured rates between 2013 and 2016, versus a 4.8 point
drop in non-expansion states (Figure 5).41
Some people continue to purchase non-group coverage outside the marketplace. Among the
nonelderly adult non-group market in winter 2016, nearly two-thirds of individuals (64%) reported having
coverage obtained from a state or federal marketplace, 19% have ACA-compliant coverage purchased outside of
the marketplace, and 12% have non-ACA-compliant plans (those that have been in effect since before January
1, 2014).42 People purchasing coverage outside the marketplace are not eligible for ACA premium tax credits.
Offer, eligibility, and take-up rates of employer sponsored insurance are largely unchanged
since 2013. Over half (53%) of all firms offered health benefits in 2017, a rate similar to that in 2013 (57%).43
Similarly, the percentage of workers eligible for health benefits at offering firms in 2017 (79%) is similar to
2013 (77%), and take-up rates have also remained steady, with 78% of eligible workers taking up offered
coverage in 2017 compared to 80% in 2013.44
Figure 5
-7.1%
-1.5%
-9.2%
-3.7%
-0.8%
-4.8%
Expansion State Non-Expansion State
Percentage Point Change in Uninsured Rate by Age and State Medicaid Expansion Status, 2013-2016
NOTES: Includes children ages 0-17 and nonelderly adults ages 18-64.SOURCE: CDC, National Health Interview Survey, reported in: https://www.cdc.gov/nchs/data/nhis/earlyrelease/insur201708.pdf.
All Nonelderly Children Nonelderly Adults
The Uninsured: A Primer 8
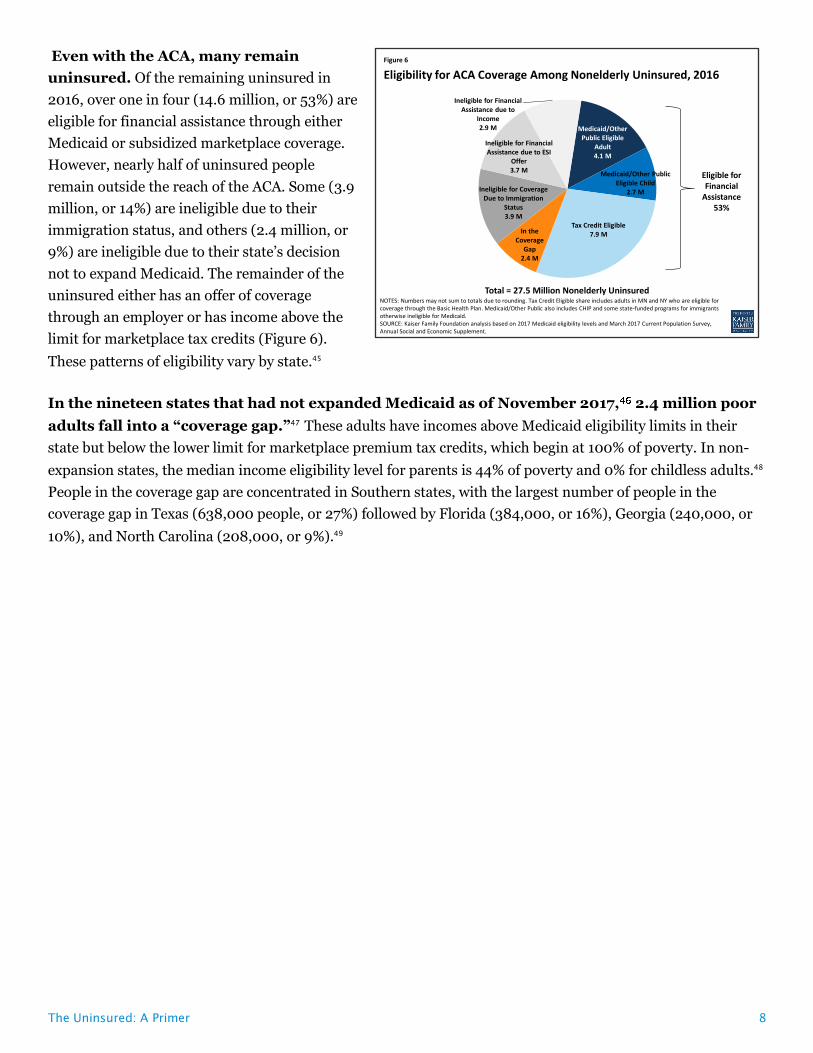
Even with the ACA, many remain
uninsured. Of the remaining uninsured in
2016, over one in four (14.6 million, or 53%) are
eligible for financial assistance through either
Medicaid or subsidized marketplace coverage.
However, nearly half of uninsured people
remain outside the reach of the ACA. Some (3.9
million, or 14%) are ineligible due to their
immigration status, and others (2.4 million, or
9%) are ineligible due to their state’s decision
not to expand Medicaid. The remainder of the
uninsured either has an offer of coverage
through an employer or has income above the
limit for marketplace tax credits (Figure 6).
These patterns of eligibility vary by state.45
In the nineteen states that had not expanded Medicaid as of November 2017, 2.4 million poor
adults fall into a “coverage gap.”47
These adults have incomes above Medicaid eligibility limits in their
state but below the lower limit for marketplace premium tax credits, which begin at 100% of poverty. In non-
expansion states, the median income eligibility level for parents is 44% of poverty and 0% for childless adults.48
People in the coverage gap are concentrated in Southern states, with the largest number of people in the
coverage gap in Texas (638,000 people, or 27%) followed by Florida (384,000, or 16%), Georgia (240,000, or
10%), and North Carolina (208,000, or 9%).49
Figure 6
NOTES: Numbers may not sum to totals due to rounding. Tax Credit Eligible share includes adults in MN and NY who are eligible for coverage through the Basic Health Plan. Medicaid/Other Public also includes CHIP and some state-funded programs for immigrants otherwise ineligible for Medicaid. SOURCE: Kaiser Family Foundation analysis based on 2017 Medicaid eligibility levels and March 2017 Current Population Survey, Annual Social and Economic Supplement.
Eligibility for ACA Coverage Among Nonelderly Uninsured, 2016
Medicaid/Other Public Eligible
Adult 4.1 M
Medicaid/Other Public Eligible Child
2.7 M
Tax Credit Eligible7.9 MIn the
Coverage Gap
2.4 M
Ineligible for Coverage Due to Immigration
Status3.9 M
Ineligible for Financial Assistance due to ESI
Offer3.7 M
Ineligible for Financial Assistance due to
Income2.9 M
Total = 27.5 Million Nonelderly Uninsured
Eligible for Financial
Assistance53%
The Uninsured: A Primer 9
Despite coverage gains, groups with historically high uninsured rates continue to be at highest risk of being
uninsured, including low-income individuals, adults, and people of color. Although most remaining uninsured
people are in working families, cost continues to pose a major barrier to coverage with nearly half (45%) of
uninsured nonelderly adults in 2016 saying that they lacked coverage because it was too expensive.50
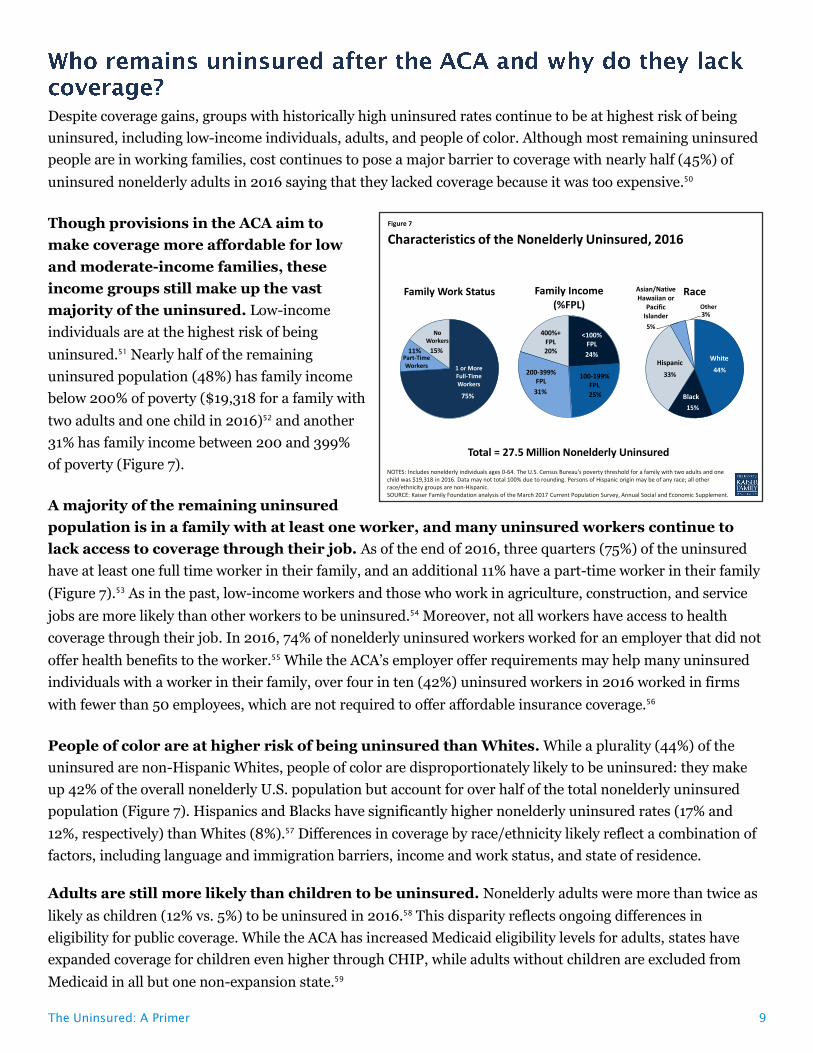
Though provisions in the ACA aim to
make coverage more affordable for low
and moderate-income families, these
income groups still make up the vast
majority of the uninsured. Low-income
individuals are at the highest risk of being
uninsured.51 Nearly half of the remaining
uninsured population (48%) has family income
below 200% of poverty ($19,318 for a family with
two adults and one child in 2016)52 and another
31% has family income between 200 and 399%
of poverty (Figure 7).
A majority of the remaining uninsured
population is in a family with at least one worker, and many uninsured workers continue to
lack access to coverage through their job. As of the end of 2016, three quarters (75%) of the uninsured
have at least one full time worker in their family, and an additional 11% have a part-time worker in their family
(Figure 7).53 As in the past, low-income workers and those who work in agriculture, construction, and service
jobs are more likely than other workers to be uninsured.54 Moreover, not all workers have access to health
coverage through their job. In 2016, 74% of nonelderly uninsured workers worked for an employer that did not
offer health benefits to the worker.55 While the ACA’s employer offer requirements may help many uninsured
individuals with a worker in their family, over four in ten (42%) uninsured workers in 2016 worked in firms
with fewer than 50 employees, which are not required to offer affordable insurance coverage.56
People of color are at higher risk of being uninsured than Whites. While a plurality (44%) of the
uninsured are non-Hispanic Whites, people of color are disproportionately likely to be uninsured: they make
up 42% of the overall nonelderly U.S. population but account for over half of the total nonelderly uninsured
population (Figure 7). Hispanics and Blacks have significantly higher nonelderly uninsured rates (17% and
12%, respectively) than Whites (8%).57 Differences in coverage by race/ethnicity likely reflect a combination of
factors, including language and immigration barriers, income and work status, and state of residence.
Adults are still more likely than children to be uninsured. Nonelderly adults were more than twice as
likely as children (12% vs. 5%) to be uninsured in 2016.58 This disparity reflects ongoing differences in
eligibility for public coverage. While the ACA has increased Medicaid eligibility levels for adults, states have
expanded coverage for children even higher through CHIP, while adults without children are excluded from
Medicaid in all but one non-expansion state.59
Figure 7
24%
25%31%
400%+ FPL20%
Family Income (%FPL)
<100% FPL
100-199% FPL
200-399% FPL
75%
11% 15%
Family Work Status
NOTES: Includes nonelderly individuals ages 0-64. The U.S. Census Bureau's poverty threshold for a family with two adults and one child was $19,318 in 2016. Data may not total 100% due to rounding. Persons of Hispanic origin may be of any race; all other race/ethnicity groups are non-Hispanic.SOURCE: Kaiser Family Foundation analysis of the March 2017 Current Population Survey, Annual Social and Economic Supplement.
44%
15%
33%
5%
3%
Race
Characteristics of the Nonelderly Uninsured, 2016
Total = 27.5 Million Nonelderly Uninsured
1 or More Full-Time Workers
No Workers
Part-Time Workers Hispanic
White
Other
Asian/Native Hawaiian or
Pacific Islander
Black
The Uninsured: A Primer 10
Uninsured rates for children are low, and most uninsured children are eligible for Medicaid or
CHIP. Largely due to expanded eligibility for public coverage under Medicaid and CHIP, the uninsured rate
for children is relatively low: in 2016, 5% of children nationwide were uninsured.60 Over three in five (64%)
uninsured children are eligible for Medicaid, CHIP, or other public programs.61 Some of these children may be
reached by covering their parents, as research
has found that parent coverage in public
programs is associated with higher enrollment of
eligible children.62,63
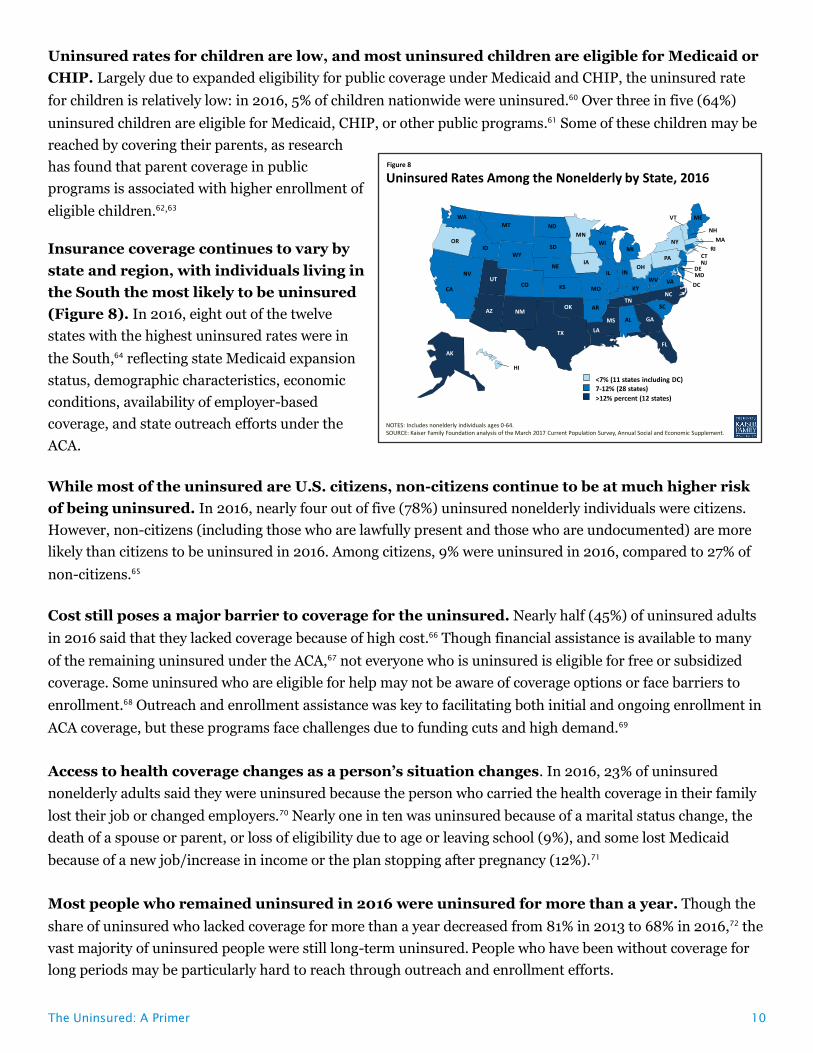
Insurance coverage continues to vary by
state and region, with individuals living in
the South the most likely to be uninsured
(Figure 8). In 2016, eight out of the twelve
states with the highest uninsured rates were in
the South,64 reflecting state Medicaid expansion
status, demographic characteristics, economic
conditions, availability of employer-based
coverage, and state outreach efforts under the
ACA.
While most of the uninsured are U.S. citizens, non-citizens continue to be at much higher risk
of being uninsured. In 2016, nearly four out of five (78%) uninsured nonelderly individuals were citizens.
However, non-citizens (including those who are lawfully present and those who are undocumented) are more
likely than citizens to be uninsured in 2016. Among citizens, 9% were uninsured in 2016, compared to 27% of
non-citizens.65
Cost still poses a major barrier to coverage for the uninsured. Nearly half (45%) of uninsured adults
in 2016 said that they lacked coverage because of high cost.66 Though financial assistance is available to many
of the remaining uninsured under the ACA,67 not everyone who is uninsured is eligible for free or subsidized
coverage. Some uninsured who are eligible for help may not be aware of coverage options or face barriers to
enrollment.68 Outreach and enrollment assistance was key to facilitating both initial and ongoing enrollment in
ACA coverage, but these programs face challenges due to funding cuts and high demand.69
Access to health coverage changes as a person’s situation changes. In 2016, 23% of uninsured
nonelderly adults said they were uninsured because the person who carried the health coverage in their family
lost their job or changed employers.70 Nearly one in ten was uninsured because of a marital status change, the
death of a spouse or parent, or loss of eligibility due to age or leaving school (9%), and some lost Medicaid
because of a new job/increase in income or the plan stopping after pregnancy (12%).71
Most people who remained uninsured in 2016 were uninsured for more than a year. Though the
share of uninsured who lacked coverage for more than a year decreased from 81% in 2013 to 68% in 2016,72 the
vast majority of uninsured people were still long-term uninsured. People who have been without coverage for
long periods may be particularly hard to reach through outreach and enrollment efforts.
Figure 8
DE
WY
WI
WV
WA
VA
VT
UT
TX
TN
SD
SC
RI
PA
OR
OK
OH
ND
NC
NY
NM
NJ
NH
NVNE
MT
MO
MS
MN
MI
MA
MD
ME
LA
KYKS
IA
INIL
ID
HI
GA
FL
DC
CT
COCA
ARAZ
AK
AL
>12% percent (12 states)
7-12% (28 states)<7% (11 states including DC)
Uninsured Rates Among the Nonelderly by State, 2016
NOTES: Includes nonelderly individuals ages 0-64.SOURCE: Kaiser Family Foundation analysis of the March 2017 Current Population Survey, Annual Social and Economic Supplement.
The Uninsured: A Primer 11
Health insurance makes a difference in whether and when people get necessary medical care, where they get
their care, and ultimately, how healthy they are. Uninsured people are far more likely than those with
insurance to postpone health care or forgo it altogether. The consequences can be severe, particularly when
preventable conditions or chronic diseases go undetected.
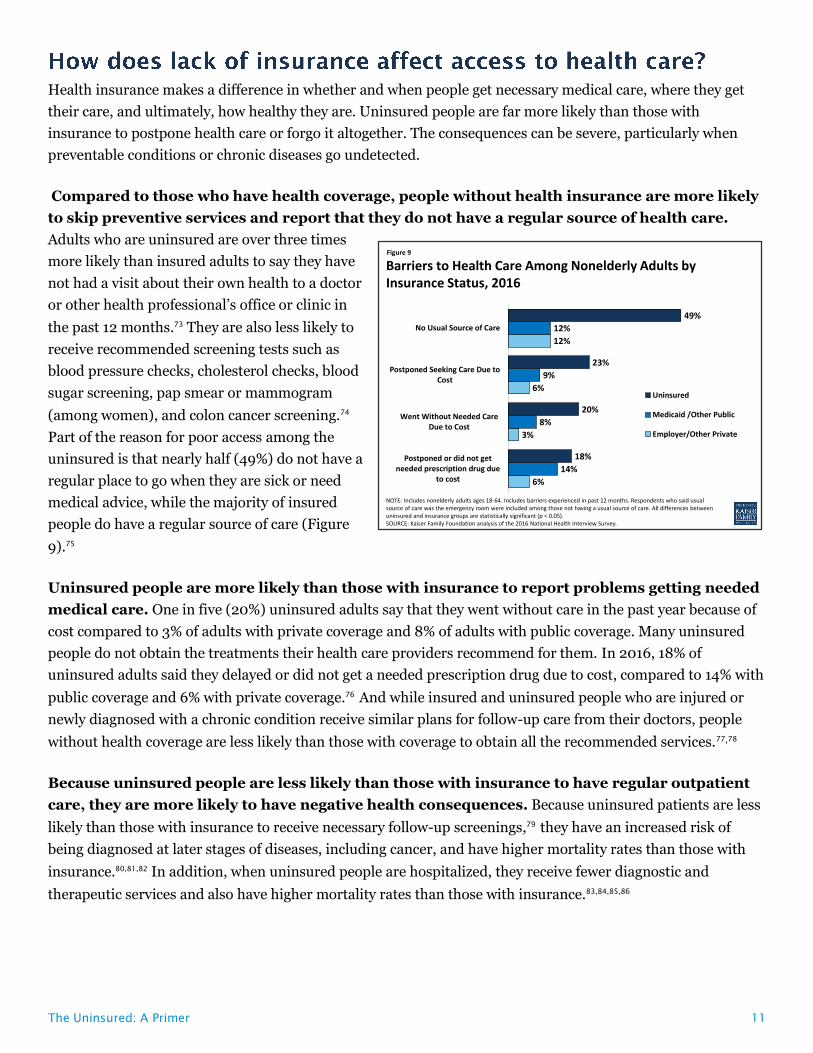
Compared to those who have health coverage, people without health insurance are more likely
to skip preventive services and report that they do not have a regular source of health care.
Adults who are uninsured are over three times
more likely than insured adults to say they have
not had a visit about their own health to a doctor
or other health professional’s office or clinic in
the past 12 months.73 They are also less likely to
receive recommended screening tests such as
blood pressure checks, cholesterol checks, blood
sugar screening, pap smear or mammogram
(among women), and colon cancer screening.74
Part of the reason for poor access among the
uninsured is that nearly half (49%) do not have a
regular place to go when they are sick or need
medical advice, while the majority of insured
people do have a regular source of care (Figure
9).75
Uninsured people are more likely than those with insurance to report problems getting needed
medical care. One in five (20%) uninsured adults say that they went without care in the past year because of
cost compared to 3% of adults with private coverage and 8% of adults with public coverage. Many uninsured
people do not obtain the treatments their health care providers recommend for them. In 2016, 18% of
uninsured adults said they delayed or did not get a needed prescription drug due to cost, compared to 14% with
public coverage and 6% with private coverage.76
And while insured and uninsured people who are injured or
newly diagnosed with a chronic condition receive similar plans for follow-up care from their doctors, people
without health coverage are less likely than those with coverage to obtain all the recommended services.77,78
Because uninsured people are less likely than those with insurance to have regular outpatient
care, they are more likely to have negative health consequences. Because uninsured patients are less
likely than those with insurance to receive necessary follow-up screenings,79
they have an increased risk of
being diagnosed at later stages of diseases, including cancer, and have higher mortality rates than those with
insurance.80,81,82 In addition, when uninsured people are hospitalized, they receive fewer diagnostic and
therapeutic services and also have higher mortality rates than those with insurance.83,84,85,86
Figure 9
Barriers to Health Care Among Nonelderly Adults by Insurance Status, 2016
6%
3%
6%
12%
14%
8%
9%
12%
18%
20%
23%
49%
Postponed or did not getneeded prescription drug due
to cost
Went Without Needed CareDue to Cost
Postponed Seeking Care Due toCost
No Usual Source of Care
Uninsured
Medicaid /Other Public
Employer/Other Private
NOTE: Includes nonelderly adults ages 18-64. Includes barriers experienced in past 12 months. Respondents who said usual source of care was the emergency room were included among those not having a usual source of care. All differences between uninsured and insurance groups are statistically significant (p < 0.05).SOURCE: Kaiser Family Foundation analysis of the 2016 National Health Interview Survey.
The Uninsured: A Primer 12
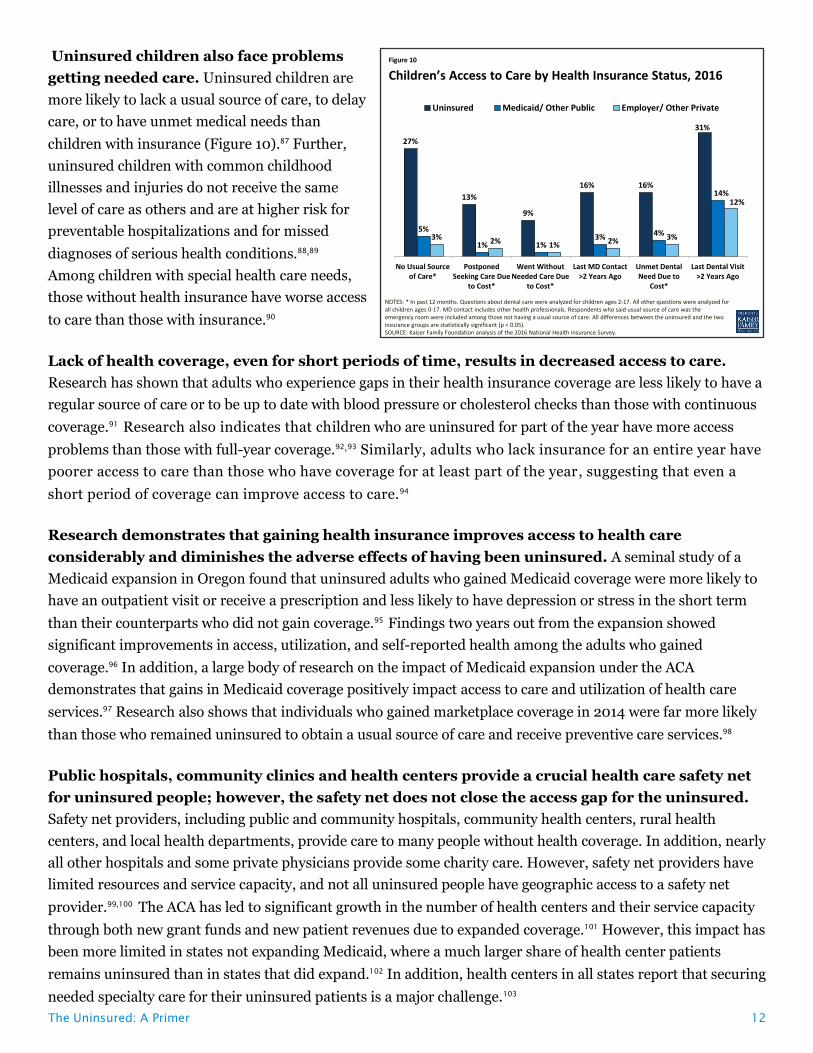
Uninsured children also face problems
getting needed care. Uninsured children are
more likely to lack a usual source of care, to delay
care, or to have unmet medical needs than
children with insurance (Figure 10).87 Further,
uninsured children with common childhood
illnesses and injuries do not receive the same
level of care as others and are at higher risk for
preventable hospitalizations and for missed
diagnoses of serious health conditions.88,89
Among children with special health care needs,
those without health insurance have worse access
to care than those with insurance.90
Lack of health coverage, even for short periods of time, results in decreased access to care.
Research has shown that adults who experience gaps in their health insurance coverage are less likely to have a
regular source of care or to be up to date with blood pressure or cholesterol checks than those with continuous
coverage.91
Research also indicates that children who are uninsured for part of the year have more access
problems than those with full-year coverage.92,93 Similarly, adults who lack insurance for an entire year have
poorer access to care than those who have coverage for at least part of the year, suggesting that even a
short period of coverage can improve access to care.94
Research demonstrates that gaining health insurance improves access to health care
considerably and diminishes the adverse effects of having been uninsured. A seminal study of a
Medicaid expansion in Oregon found that uninsured adults who gained Medicaid coverage were more likely to
have an outpatient visit or receive a prescription and less likely to have depression or stress in the short term
than their counterparts who did not gain coverage.95
Findings two years out from the expansion showed
significant improvements in access, utilization, and self-reported health among the adults who gained
coverage.96 In addition, a large body of research on the impact of Medicaid expansion under the ACA
demonstrates that gains in Medicaid coverage positively impact access to care and utilization of health care
services.97 Research also shows that individuals who gained marketplace coverage in 2014 were far more likely
than those who remained uninsured to obtain a usual source of care and receive preventive care services.98
Public hospitals, community clinics and health centers provide a crucial health care safety net
for uninsured people; however, the safety net does not close the access gap for the uninsured.
Safety net providers, including public and community hospitals, community health centers, rural health
centers, and local health departments, provide care to many people without health coverage. In addition, nearly
all other hospitals and some private physicians provide some charity care. However, safety net providers have
limited resources and service capacity, and not all uninsured people have geographic access to a safety net
provider.99,100 The ACA has led to significant growth in the number of health centers and their service capacity
through both new grant funds and new patient revenues due to expanded coverage.101 However, this impact has
been more limited in states not expanding Medicaid, where a much larger share of health center patients
remains uninsured than in states that did expand.102 In addition, health centers in all states report that securing
needed specialty care for their uninsured patients is a major challenge.103
Figure 10
Children’s Access to Care by Health Insurance Status, 2016
27%
13%
9%
16% 16%
31%
5%
1% 1%3% 4%
14%
3% 2% 1% 2% 3%
12%
No Usual Sourceof Care*
PostponedSeeking Care Due
to Cost*
Went WithoutNeeded Care Due
to Cost*
Last MD Contact>2 Years Ago
Unmet DentalNeed Due to
Cost*
Last Dental Visit>2 Years Ago
Uninsured Medicaid/ Other Public Employer/ Other Private
NOTES: * In past 12 months. Questions about dental care were analyzed for children ages 2-17. All other questions were analyzed for all children ages 0-17. MD contact includes other health professionals. Respondents who said usual source of care was the emergency room were included among those not having a usual source of care. All differences between the uninsured and the two insurance groups are statistically significant (p < 0.05).SOURCE: Kaiser Family Foundation analysis of the 2016 National Health Insurance Survey.
The Uninsured: A Primer 13
For many uninsured people, the costs of health insurance and medical care are weighed against equally
essential needs, like housing, food, and transportation to work, and many uninsured adults report being very or
moderately worried about paying basic monthly expenses such as rent or other housing costs and monthly
bills.104 When uninsured people use health care, they may be charged for the full cost of that care (versus
insurers, who negotiate discounts) and often face difficulty paying medical bills. Providers absorb some of the
cost of care for the uninsured, and while uncompensated care funds cover some of those costs, these funds do
not fully offset the cost of care for the uninsured.
Most uninsured people do not receive health services for free or at reduced charge. Hospitals
frequently charge uninsured patients two to four times what health insurers and public programs actually pay
for hospital services.105, 106
In 2014, only 40% of uninsured adults who received health care services reported
receiving free or reduced cost care.107
Uninsured people often must pay "up front" before services will be rendered. When people
without health coverage are unable to pay the full medical bill in cash at the time of service, they can sometimes
negotiate a payment schedule with a provider, pay with credit cards (typically with high interest rates), or be
turned away.108 Among uninsured adults who received health care in 2013, nearly a third (31%) were asked to
pay for the full cost of medical care before they could see a doctor.109
People without health insurance have lower medical expenditures than those with insurance,
but they pay a much larger portion of their medical costs out-of-pocket. Compared to insured
nonelderly people with full-year coverage, whose average per capita medical expenditures were $4,876 in 2013,
nonelderly people who were full-year uninsured used health care services valued at about half that amount, or
just $2,443 per capita in 2013.110 Despite lower overall medical spending, people without insurance pay nearly
as much out-of-pocket as insured people.111
The uncompensated costs of care for the uninsured amounted to about $84.9 billion in 2013.
Funding from a number of sources, totaling $53.3 billion in 2013, helps providers defray the costs associated
with uncompensated care. Most of these funds (62%) came from the federal government through a variety of
programs including Medicaid and Medicare, the Veterans Health Administration, the Indian Health Service,
the Community Health Centers block grant, and the Ryan White CARE Act. States and localities provided $19.8
billion, and the private sector provided $0.7 billion. While substantial, these payments to providers for
uncompensated care amount to a small slice of total health care spending in the U.S.112
The burden of uncompensated care varies across providers. Hospitals, community providers (such as
clinics and health centers), and office-based physicians all provide care to the uninsured. Given the high cost of
hospital-based care, the majority (60%) of the cost of uncompensated care is incurred in hospitals.
Community-based providers that receive public funds provide a little over a quarter (26%) of total
uncompensated care, and the remainder of uncompensated care, 14%, is provided by office-based physicians.113
With the expansion of coverage under the ACA, providers in states that expanded Medicaid are
seeing reductions in uncompensated care costs. For example, between 2013 and 2014, total
uncompensated care costs for hospitals (including charity care costs and bad debt) dropped from $34.9 billion
The Uninsured: A Primer 14
to $28.9 billion, a $6 billion or 17% drop, with nearly all of the decrease occurring in expansion states. In non-
expansion states, the change in uncompensated care was nearly flat between 2013 and 2014, dropping just 1%
in 2014.114
Many safety net hospitals that serve a large number of Medicaid and low-income uninsured
individuals receive Medicaid disproportionate share hospital payments (DSH); however,
federal DSH payments are scheduled to be cut beginning in FY 2018.115 Federal law requires that
state Medicaid programs make DSH payments to qualifying hospitals that serve a large number of Medicaid
and uninsured individuals. Unlike other Medicaid payments, federal DSH funds are capped and each state
receives a capped allotment. DSH allotments vary across states and totaled about $11.9 billion in FY 2016.116
Anticipating fewer uninsured and lower levels of uncompensated care, the ACA called for a reduction in federal
Medicaid DSH payments. Cuts were originally scheduled to begin in 2014 but were delayed to FY 2018. These
reductions will amount to $43 billion between 2018 and 2025.117 The HHS Secretary is required to develop a
methodology to allocate the reductions that must take into account factors outlined in the law.118 While safety-
net hospitals across the country will be affected, hospitals in states that do not expand Medicaid may face cuts
without additional revenues from new coverage.
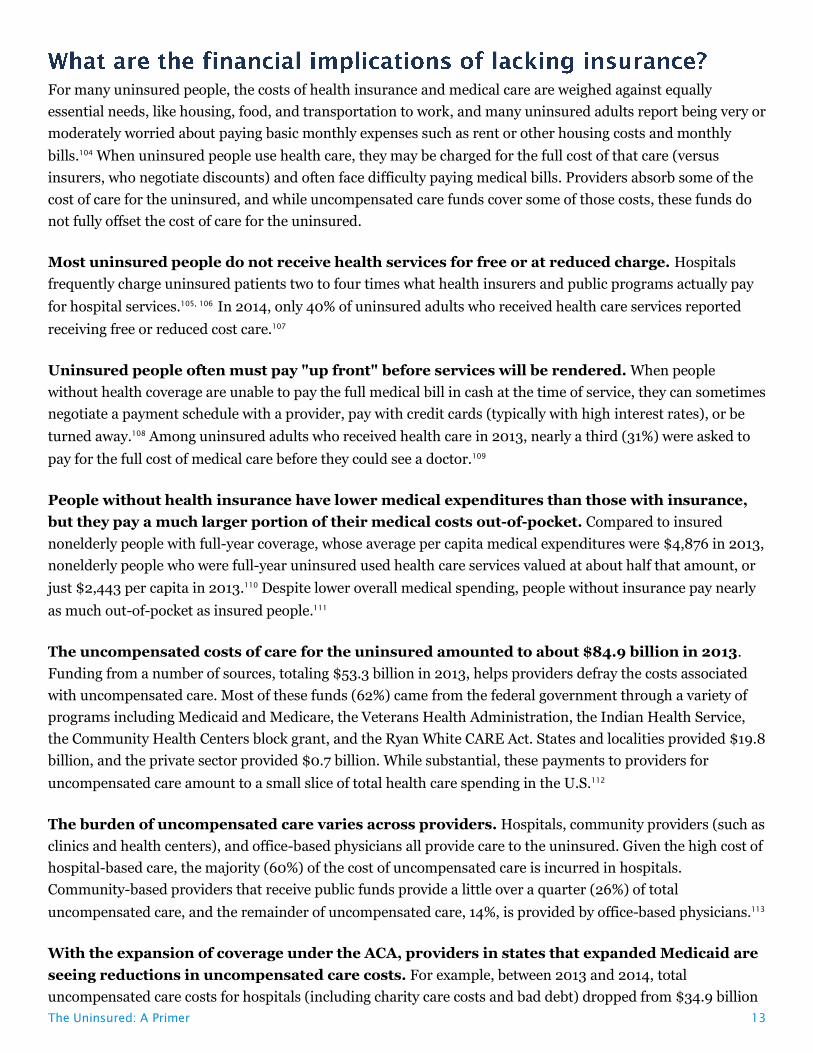
Being uninsured leaves individuals at an
increased risk of financial strain due to
medical bills. In 2016, nonelderly uninsured
adults were over twice as likely as those with
insurance to have problems paying medical bills
(29% vs. 14%; Figure 7) with two thirds of
uninsured who had medical bill problems unable
to pay their medical bills at all (67%).119
Uninsured adults are also more likely to face
negative consequences due to medical bills, such
as using up savings, having difficulty paying for
necessities, borrowing money, or having medical
bills sent to collection.120
Most uninsured people have few, if any, savings or assets they can easily use to pay health care
costs. The average uninsured household has no net assets,121 and half of uninsured families living below 200%
of poverty have no savings.122,123
Uninsured nonelderly adults are over twice as likely as insured adults to worry
about being able to pay costs for normal health care (63% vs. 26%; Figure 11). Furthermore, over three quarters
of uninsured nonelderly adults (76%) say they are very or somewhat worried about paying medical bills if they
get sick or have an accident, compared to 44% of insured adults.124
Uninsured people are at risk of medical debt. Like any bill, when medical bills are not paid or are paid
off too slowly, they are turned over to a collection agency. In 2016, uninsured adults were more likely than
insured adults to say they have medical bills that are being paid off over time (30% vs. 24%).125
Medical debts
contribute to over half (52%) of debt collections actions that appear on consumer credit reports in the United
States,126 and uninsured people are at higher risk of falling into medical bankruptcy than people with
insurance.127
Figure 11
29%
63%
76%
30%
14%
26%
44%
24%
Problems paying orunable to pay medical
bills
Worried about being ableto pay costs for normal
care
Worried about payingmedical bills if get sick
Medical bills being paidoff over time
Uninsured Insured
NOTE: Includes nonelderly adults ages 18-64. All differences between uninsured and insured groups are statistically significant (p < 0.05). SOURCE: Kaiser Family Foundation analysis of the 2016 National Health Interview Survey.
Problems Paying Medical Bills by Insurance Status, 2016
The Uninsured: A Primer 15
The ACA led to historic drops in the uninsured rate, with millions of previously uninsured Americans now
insured and gaining access to health services and protection from catastrophic health costs. Prior to the ACA,
the options for the uninsured population were limited in the individual market, as coverage was often
expensive and insurers could deny coverage based on health status. Medicaid and CHIP have provided
coverage to many families, but pre-2014 eligibility levels were low for parents and few states provided coverage
to adults without dependent children. The ACA fills in many of these gaps by expanding Medicaid to low-
income adults and providing subsidized coverage to people with incomes from 100 to 400% of poverty in the
marketplaces.
Nonetheless, even with the ACA, the nation’s system of health insurance continues to have many gaps that
currently leave millions of people without coverage. Nearly half (47%) of the remaining uninsured are outside
the reach of the ACA either because their state did not expand Medicaid, they are subject to immigrant
eligibility restrictions, or their income makes them ineligible for financial assistance. The remainder are eligible
for assistance under the law but may still struggle with affordability and knowledge of options and require
targeted outreach to help them gain coverage. Going without coverage can have serious health consequences
for the uninsured because they receive less preventative care, and delayed care often results in serious illness or
other health problems. Being uninsured can also have serious financial consequences, with many unable to pay
their medical bills, resulting in medical debt.
The ACA has provided coverage to millions of people in the United States. Current debate over rolling back
ACA coverage threaten these gains and may make it difficult to reach the nearly 28 million nonelderly who
remain without coverage. Proposed policies to change the structure of the Medicaid program or cut back
subsidies for Marketplace coverage may lead to even more uninsured individuals. On the other hand, if
additional states opt to expand Medicaid as allowed under the ACA, there may be additional coverage gains as
low-income individuals gain access to affordable coverage. The outcome of current debate over health coverage
policy in the United States has substantial implications for people’s coverage, access, and overall health and
well-being.
Julia Foutz, Ellen Squires, and Rachel Garfield are with the Kaiser Family Foundation. Anthony
Damico is an independent consultant to the Kaiser Family Foundation.
The Uninsured: A Primer 16
1 Kaiser Family Foundation analysis of the 2013 National Health Interview Survey.
2 Kaiser Family Foundation analysis of the 2016 National Health Interview Survey.
3 Ibid.
4 Ibid.
5 Rachel Garfield, Anthony Damico, Julia Foutz, Gary Claxton, and Larry Levitt, Estimates of Eligibility for ACA Coverage among the Uninsured in 2016 (Washington, DC: Kaiser Family Foundation, October 2017), https://www.kff.org/uninsured/issue-brief/estimates-of-eligibility-for-aca-coverage-among-the-uninsured-in-2016-october-2017-update/.
6 “Poverty Guidelines,” U.S. Department of Health and Human Services, Office of the Assistant Secretary for Planning and Evaluation, accessed September 2017, https://aspe.hhs.gov/poverty-guidelines.
7 Kaiser Family Foundation analysis of the 2013 National Health Interview Survey.
8 Kaiser Family Foundation analysis of the 2016 National Health Interview Survey.
9
Kaiser Family Foundation analysis of the 2013 National Health Interview Survey.
10 Kaiser Family Foundation analysis of the 2013 Kaiser Survey of Low-Income Americans and the ACA, 2014.
11 Kaiser Family Foundation and Health Research and Educational Trust, 2013 Employer Health Benefits Survey (Washington, DC: Kaiser Family Foundation, August 2013), http://www.kff.org/private-insurance/report/2013-employer-health-benefits/.
12 Larry Levitt, Gary Claxton, and Anthony Damico, Measuring the Affordability of Employer Health Coverage (Washington, DC: Kaiser Family Foundation, August 2011), http://www.kff.org/health-costs/perspective/measuring-the-affordability-of-employer-health-coverage/.
13 Kaiser Family Foundation and Health Research and Educational Trust, 2013 Employer Health Benefits Survey (Washington, DC: Kaiser Family Foundation, August 2013), http://www.kff.org/private-insurance/report/2013-employer-health-benefits/.
14 Ibid.
15 John Holohan and Megan McGrath, Reversing the Trend? Understanding the Recent Increase in Health Insurance Coverage among the Nonelderly Population (Washington, DC: Kaiser Commission on Medicaid and the Uninsured and The Urban Institute, March 2013), http://kff.org/uninsured/issue-brief/reversing-the-trend-understanding-the-recent-increase-in-health-insurance-coverage-among-the-nonelderly-population/.
16 Laura Skopec, John Holahan, and Megan McGrath, Health Insurance Coverage in 2013: Gains in Public Coverage Continue to Offset Loss of Private Insurance (Washington, DC: Kaiser Commission on Medicaid and the Uninsured, April 2015), http://kff.org/uninsured/issue-brief/health-insurance-coverage-in-2013-gains-in-public-coverage-continue-to-offset-loss-of-private-insurance/.
17 Kaiser Family Foundation State Health Facts, “Health Insurance Coverage of Nonelderly 0-64,” accessed September 2017, http://www.kff.org/other/state-indicator/nonelderly-0-64/.
18 Kaiser Family Foundation State Health Facts, “Health Insurance Coverage of Nonelderly 0-64,” accessed September 2017, http://www.kff.org/other/state-indicator/nonelderly-0-64/.
19 Medicaid also covers low-income elderly individuals, many of whom also have Medicare coverage. Molly O'Malley Watts, Elizabeth Cornachione, and MaryBeth Musumeci, Medicaid Financial Eligibility for Seniors and People with Disabilities in 2015 (Washington, DC: Kaiser Commission on Medicaid and the Uninsured, March 2016), http://kff.org/medicaid/report/medicaid-financial-eligibility-for-seniors-and-people-with-disabilities-in-2015/.
20 Caryn Marks, Tanya Schwartz, and Lindsay Donaldson, State Variation and Health Reform: A Chartbook (Washington, DC: Kaiser Commission on Medicaid and the Uninsured, October 2009), http://www.kff.org/health-reform/report/state-variation-and-health-reform-a-chartbook/.
21
Kaiser Family Foundation State Health Facts, “Health Insurance Coverage of Nonelderly 0-64,” accessed September 2017, http://www.kff.org/other/state-indicator/nonelderly-0-64/.
22 Maine adopted the Medicaid expansion through a ballot initiative in November 2017; due to uncertainty over the exact date of implementation, Maine is still categorized as a non-expansion state here.
23 Kaiser Family Foundation State Health Facts, “Status of State Action on the Medicaid Expansion Decision,” accessed September 2017, http://kff.org/health-reform/state-indicator/state-activity-around-expanding-medicaid-under-the-affordable-care-act/.
24 Kaiser Family Foundation State Health Facts, “State Health Insurance Marketplace Types, 2017,” accessed September 2017, http://kff.org/health-reform/state-indicator/state-health-insurance-marketplace-types/.
The Uninsured: A Primer 17
25 “Poverty Guidelines,” U.S. Department of Health and Human Services, Office of the Assistant Secretary for Planning and Evaluation, accessed September 2017, https://aspe.hhs.gov/poverty-guidelines.
26 Tax credit eligibility in a given calendar year is based on the previous year’s HHS poverty guidelines.
27 Though the Trump Administration has announced that it will not make payments to insurers for cost-sharing reductions (CSRs), the CSRs remain available to individuals purchasing marketplace coverage.
28 Samantha Artiga and Anthony Damico, Health Coverage and Care for Immigrants (Washington, DC: Kaiser Family Foundation, July 2017), http://www.kff.org/disparities-policy/issue-brief/health-coverage-and-care-for-immigrants/.
29 Ibid.
30 Richard Cauchi, Small and Large Business Health Insurance: State and Federal Roles (Denver, CO: National Conference of State Legislatures, July 2017), (http://www.ncsl.org/research/health/small-business-health-insurance.aspx.
31 Beginning in January 2016, states had the option to expand the SHOP to include employers with 100 or fewer FTEs. Centers for Medicare and Medicaid Services, Health Insurance Marketplace, Who Can Use the SHOP Marketplace (Baltimore, MD: CMS, Health Insurance Marketplace, October 2014), https://marketplace.cms.gov/outreach-and-education/who-can-use-shop.pdf.
32 For tax years beginning in 2014 or later, employers could receive a tax credit of up to 50% of the employer’s contribution to the premium, calculated on a sliding scale basis tied to average wages and number of employees. For small businesses with tax-exempt status meeting the requirements above, the tax credit is 35% of the employer contribution. In order to qualify, a business must pay premiums on behalf of employees enrolled in a qualified health plan offered through the SHOP marketplace or qualify for an exemption to this requirement.
33 “Small Business Health Care Tax Credit and the SHOP Marketplace,” Internal Revenue Service, accessed September 2017, https://www.irs.gov/affordable-care-act/employers/small-business-health-care-tax-credit-and-the-shop-marketplace.
34 CMS proposed that small employers enroll directly with insurers offering SHOP plans or through agents or brokers registered with the Federally-facilitated SHOP, while retaining access to the Small Business Health Care Tax Credit. Centers for Medicare and Medicaid Services, Center for Consumer Information and Insurance Oversight, The Future of the SHOP: CMS Intends to Allow Small Businesses in SHOPs Using HealthCare.gov More Flexibility when Enrolling in Healthcare Coverage (Washington, DC: CMS, May 2017), https://www.cms.gov/CCIIO/Resources/Regulations-and-Guidance/Downloads/The-Future-of-the-SHOP-CMS-Intends-to-Allow-Small-Businesses-in-SHOPs-Using-HealthCaregov-More-Flexibility-when-Enrolling-in-Healthcare-Coverage.pdf.
35 Kaiser Family Foundation analysis of the 2010 and 2016 National Health Interview Survey.
36 Kaiser Family Foundation analysis of the 2013 and 2016 National Health Interview Survey.
37 Ibid.
38 Kaiser Family Foundation State Health Facts, “Total Monthly Medicaid and CHIP Enrollment,” accessed September 2017, http://kff.org/health-reform/state-indicator/total-monthly-medicaid-and-chip-enrollment/.
39
Centers for Medicare and Medicaid Services, 2017 Effectuated Enrollment Snapshot (Baltimore, MD: CMS, June 2017), https://downloads.cms.gov/files/effectuated-enrollment-snapshot-report-06-12-17.pdf.
40 Larisa Antonisse, Rachel Garfield, Robin Rudowitz, and Samantha Artiga, The Effects of Medicaid Expansion on the ACA: Updated Findings From a Literature Review (Washington, DC: Kaiser Family Foundation, September 2017), http://www.kff.org/medicaid/issue-brief/the-effects-of-medicaid-expansion-under-the-aca-updated-findings-from-a-literature-review-september-2017/.
41 Robin A. Cohen, Michael E. Martinez, and Emily P. Zammitti, Health Insurance Coverage: Early Release of Estimates from the National Health Interview Survey, January – March 2017 (Hyattsville, MD: National Center for Health Statistics, August 2017), https://www.cdc.gov/nchs/data/nhis/earlyrelease/insur201708.pdf.
42 Liz Hamel, Jamie Firth, Larry Levitt, Gary Claxton, and Mollyann Brodie, Survey of Non-Group Health Insurance Enrollees, Wave 3 (Washington DC: Kaiser Family Foundation, May 2016), http://www.kff.org/health-reform/poll-finding/survey-of-non-group-health-insurance-enrollees-wave-3/.
43 Kaiser Family Foundation and Health Research and Educational Trust, 2017 Employer Health Benefits Survey, (Washington, DC: Kaiser Family Foundation, September 2017), http://www.kff.org/report-section/ehbs-2017-section-2-health-benefits-offer-rates/.
44 Kaiser Family Foundation and Health Research and Educational Trust, 2017 Employer Health Benefits Survey, (Washington, DC: Kaiser Family Foundation, September 2017), http://www.kff.org/report-section/ehbs-2017-section-3-employee-coverage-eligibility-and-participation/.
45 Rachel Garfield, Anthony Damico, Julia Foutz, Gary Claxton, and Larry Levitt, Estimates of Eligibility for ACA Coverage among the Uninsured in 2016 (Washington, DC: Kaiser Family Foundation, October 2017), https://www.kff.org/uninsured/issue-brief/estimates-of-eligibility-for-aca-coverage-among-the-uninsured-in-2016-october-2017-update/.
46 Maine adopted the Medicaid expansion through a ballot initiative in November 2017; due to uncertainty over the exact date of implementation, Maine is still categorized as a non-expansion state here.
The Uninsured: A Primer 18
47
Kaiser Family Foundation analysis based on 2017 Medicaid eligibility levels and March 2017 Current Population Survey, Annual Social and Economic Supplement.
48 Rachel Garfield and Anthony Damico, The Coverage Gap: Uninsured Poor Adults in States that Do Not Expand Medicaid (Washington, DC: Kaiser Family Foundation, November 2017), https://www.kff.org/uninsured/issue-brief/the-coverage-gap-uninsured-poor-adults-in-states-that-do-not-expand-medicaid/.
49 Ibid.
50 Kaiser Family Foundation analysis of the 2016 National Health Interview Survey.
51 Kaiser Family Foundation analysis of the March 2017 Current Population Survey, Annual Social and Economic Supplement.
52 “Poverty Thresholds,” U.S. Census Bureau, accessed September 2017, http://www.census.gov/data/tables/time-series/demo/income-poverty/historical-poverty-thresholds.html.
53 Kaiser Family Foundation analysis of the March 2017 Current Population Survey, Annual Social and Economic Supplement.
54 See Supplemental Tables, Table 8.
55 Kaiser Family Foundation analysis of the March 2017 Current Population Survey, Annual Social and Economic Supplement.
56 Ibid.
57 Ibid.
58 Ibid.
59 Tricia Brooks, Karina Wagnerman, Samantha Artiga, Elizabeth Cornachione, and Petry Ubri, Medicaid and CHIP Eligibility, Enrollment, Renewal, and Cost-Sharing Policies in Medicaid and CHIP as of January 2017: Findings from a 50-State Survey (Washington, DC: Kaiser Family Foundation, January 2017), http://www.kff.org/medicaid/report/medicaid-and-chip-eligibility-enrollment-renewal-and-cost-sharing-policies-as-of-january-2017-findings-from-a-50-state-survey/.
60 Kaiser Family Foundation analysis of the March 2017 Current Population Survey, Annual Social and Economic Supplement.
61 Other public programs include some state-funded programs for immigrants otherwise ineligible for Medicaid. Kaiser Family Foundation analysis based on 2016 Medicaid eligibility levels and March 2017 Current Population Survey, Annual Social and Economic Supplement.
62 Julie L. Hudson and Asako S. Moriya, “Medicaid Expansion for Adults Had Measureable ‘Welcome Mat’ Effects on Their Children,” Health Affairs 36, no.9 (September 2017): 1643-51.
63 Elisabeth W. Burak, Health Coverage for Parents and Caregivers Helps Children (Washington, DC: Georgetown University Center for Children and Families, March 2017), https://ccf.georgetown.edu/wp-content/uploads/2017/03/Covering-Parents-v2.pdf.
64 Kaiser Family Foundation analysis of the March 2017 Current Population Survey, Annual Social and Economic Supplement.
65 Ibid.
66 Kaiser Family Foundation analysis of the 2016 National Health Interview Survey.
67 Rachel Garfield, Anthony Damico, Cynthia Cox, Gary Claxton, and Larry Levitt, New Estimates of Eligibility for ACA Coverage among the Uninsured (Washington, DC: Kaiser Family Foundation, Jan 2016), http://kff.org/health-reform/issue-brief/new-estimates-of-eligibility-for-aca-coverage-among-the-uninsured/.
68 Bianca DiJulio, Jamie Firth, and Mollyann Brodie, Kaiser Health Tracking Poll: December 2015 (Washington, DC: Kaiser Family Foundation, Dec 2015), http://kff.org/health-costs/poll-finding/kaiser-health-tracking-poll-december-2015/.
69 Karen Pollitz, Jennifer Tolbert, and Ashley Semanskee, 2016 Survey of Health Insurance Marketplace Assister Programs and Brokers (Washington, DC: Kaiser Family Foundation, June 2016), http://www.kff.org/health-reform/report/2016-survey-of-health-insurance-marketplace-assister-programs-and-brokers/.
70 Kaiser Family Foundation analysis of the 2016 National Health Interview Survey.
71 Ibid.
72 Kaiser Family Foundation analysis of the 2013 and 2016 National Health Interview Survey.
73 Kaiser Family Foundation analysis of the 2016 National Health Interview Survey.
74 Ibid.
75 Ibid.
76 Ibid.
The Uninsured: A Primer 19
77 Jack Hadley, “Insurance Coverage, Medical Care Use, and Short-term Health Changes Following an Unintentional Injury or the Onset of a Chronic Condition,” JAMA 297, no. 10 (March 2007): 1073-84.
78 Broadwater-Hollifield et al. “Predictors of Patient Adherence to Follow-Up Recommendations after an ED Visit,” The American Journal of Emergency Medicine 33, no.10 (October 2015): 1368-73.
79 Silvia Tejada et al., “Patient Barriers to Follow-Up Care for Breast and Cervical Cancer Abnormalities.” Journal of Women's Health 22, no. 6 (June 2013): 507-517.
80 Andrew Wilper et al., “Health Insurance and Mortality in US Adults,” American Journal of Public Health 99, no. 12 (December 2009): 2289-2295.
81 Edgar Simard et al., “Widening Socioeconomic Disparities in Cervical Cancer Mortality Among Women in 26 States, 1993-2007.” Cancer 118, no. 20 (October 2012): 5110-6.
82 Institute of Medicine, America’s Uninsured Crisis: Consequences for Health and Health Care (Washington, DC: Institute of Medicine, February 2009), http://iom.nationalacademies.org/~/media/Files/Report%20Files/2009/Americas-Uninsured-Crisis-Consequences-for-Health-and-Health-Care/Americas%20Uninsured%20Crisis%202009%20Report%20Brief.pdf.
83 Fizan Abdullah et al., “Analysis of 23 Million US Hospitalizations: Uninsured Children Have Higher All-Cause In-Hospital Mortality,” Journal of Public Health 32, no. 2 (June 2010): 236-44.
84 Andrew Wilper et al., “Health Insurance and Mortality in US Adults,” American Journal of Public Health 99, no. 12 (December 2009): 2289-2295.
85 Wendy Greene et al., “Insurance Status is a Potent Predictor of Outcomes in Both Blunt and Penetrating Trauma.” American Journal of Surgery 199, no. 4 (April 2010): 554-7.
86 Sarah Lyon, “The Effect of Insurance Status on Mortality and Procedural Use in Critically Ill Patients,” American Journal of Critical Care Medicine 184, no. 7 (October 2011): 809-15.
87 Kaiser Family Foundation analysis of the 2016 National Health Interview Survey.
88 Institute of Medicine, America’s Uninsured Crisis: Consequences for Health and Health Care (Washington, DC: Institute of Medicine, February 2009), http://iom.nationalacademies.org/~/media/Files/Report%20Files/2009/Americas-Uninsured-Crisis-Consequences-for-Health-and-Health-Care/Americas%20Uninsured%20Crisis%202009%20Report%20Brief.pdf.
89 Amanda Haboush-Deloye, Spencer Hensley, Masaru Teramoto, Tara Phebus, Denise Tanata-Ashby, “The Impacts of Health Insurance Coverage on Access to Healthcare in Children Entering Kindergarten,” Maternal and Child Health Journal 18, no.7 (Sep 2014): 1753-64. 90 MaryBeth Musumeci, Medicaid Restructuring and Children with Special Health Care Needs (Washington, DC: Kaiser Family Foundation, July 2017), https://www.kff.org/report-section/medicaid-restructuring-and-children-with-special-health-care-needs-issue-brief/.
91 Sara Collins et al., Gaps in Health Insurance: Why So Many Americans Experience Breaks in Coverage and How the Affordable Care Act Will Help (The Commonwealth Fund, April 2012), http://www.commonwealthfund.org/~/media/Files/Publications/Issue%20Brief/2012/Apr/1594_collins_gaps_in_hlt_ins_tracking_brief_v2.pdf.
92 Amy Cassedy, Gerry Fairbrother, and Paul Newacheck, “The Impact of Insurance Instability on Children’s Access, Utilization, and Satisfaction with Health Care,” Ambulatory Pediatrics 8, no. 5 (October 2008): 321-8.
93 Thomas Buchmueller, Sean Orzol, and Lara Shore-Sheppard, “Stability of Children’s Insurance Coverage and Implications for Access to Care: Evidence from the Survey of Income and Program Participation”, International Journal of Health Care Finance and Economics 14, no.2 (Jun 2014).
94
Salam Abdus, “Part-Year Coverage and Access to Care for Nonelderly Adults,” Medical Care 52, no. 8 (August 2014): 709-14.
95 Amy Finkelstein et al., “The Oregon Health Insurance Experiment: Evidence from the First Year” (National Bureau of Economic Research, July 2011), http://www.nber.org/papers/w17190.
96 Katherine Baicker et al., “The Oregon Experiment — Effects of Medicaid on Clinical Outcomes,” New England Journal of Medicine 368 (May 2013): 1713-1722.
97 Larisa Antonisse, Rachel Garfield, Robin Rudowitz, and Samantha Artiga, The Effects of Medicaid Expansion on the ACA: Updated Findings From a Literature Review (Washington, D.C.: Kaiser Family Foundation, February 2017), https://www.kff.org/medicaid/issue-brief/the-effects-of-medicaid-expansion-under-the-aca-updated-findings-from-a-literature-review/.
98 James B Kirby and Jessica P. Vistnes,“Access to Care Improved for People Who Gained Medicaid or Marketplace Coverage in 2014” Health Affairs,35, no.10 (Oct 2016): 1830-1834.
99 Mark Hall, “Rethinking Safety Net Access for the Uninsured,” New England Journal of Medicine 364 (January 2011):7-9.
The Uninsured: A Primer 20
100 John Holahan and Brenda Spillman, Health Care Access for Uninsured Adults: A Strong Safety Net is not the Same as Insurance (Washington, DC: The Urban Institute, January 2002), http://www.urban.org/research/publication/health-care-access-uninsured-adults.
101 Peter Shin et al., Health Center Patient Trends, Enrollment Activities, and Service Capacity: Recent Experience in Medicaid Expansion and Non-Expansion States, (Washington, DC: Kaiser Commission for Medicaid and the Uninsured, Dec 2015), http://kff.org/medicaid/issue-brief/health-center-patient-trends-enrollment-activities-and-service-capacity-recent-experience-in-medicaid-expansion-and-non-expansion-states.
102 Julia Paradise, Sara Rosenbaum, Anne Markus, Jessica Sharac, Chi Tran, David Reynolds, and Peter Shin, Community Health Centers: Recent Growth and the Role of the ACA (Washington, DC: Kaiser Family Foundation, January 2017), https://www.kff.org/medicaid/issue-brief/community-health-centers-recent-growth-and-the-role-of-the-aca/.
103 Ibid.
104 Kaiser Family Foundation analysis of the 2016 National Health Interview Survey.
105 Gerard Anderson , “From ‘Soak The Rich’ To ‘Soak The Poor’: Recent Trends In Hospital Pricing” Health Affairs 26, no. 4 (May 2007): 780-789.
106 Stacie Dusetzina, Ethan Basch, and Nancy Keating, “For Uninsured Cancer Patients, Outpatient Charges Can Be Costly, Putting Treatments out of Reach,” Health Affairs 34, no. 4 (April 2015): 584-591.
107 Kaiser Family Foundation analysis of the 2014 Kaiser Survey of Low-Income Americans and the ACA, 2015.
108 Brent Asplin et al., “Insurance Status and Access to Urgent Ambulatory Care Follow-up Appointments,” JAMA 294, no. 10 (September 2005): 1248-54.
109 Kaiser Family Foundation analysis of the 2013 Kaiser Survey of Low-Income Americans and the ACA, 2014.
110 Teresa Coughlin et al., Uncompensated Care for the Uninsured in 2013: A Detailed Examination (Washington, DC: Kaiser Commission on Medicaid and the Uninsured, May 2014), http://kff.org/uninsured/report/uncompensated-care-for-the-uninsured-in-2013-a-detailed-examination/.
111 Ibid.
112 Ibid.
113 Ibid.
114 Peter Cunningham, Robin Rudowitz, Katherine Young, Rachel Garfield, and Julia Foutz, Understanding Medicaid Hospital Payment and the Impact of Recent Policy Changes, (Washington, DC: Kaiser Family Foundation, June 2016), http://kff.org/medicaid/issue-brief/understanding-medicaid-hospital-payments-and-the-impact-of-recent-policy-changes/.
115 H.R. Medicare Access and CHIP Reauthorization Act of 2015, H.R. 2, 114th Cong. (2015).
116 Kaiser Family Foundation State Health Facts, “Federal Medicaid Disproportionate Share Hospital (DSH) Allotments, FY 2016,” accessed September 2017, http://kff.org/medicaid/state-indicator/federal-dsh-allotments/?currentTimeframe=0&sortModel=%7B%22colId%22:%22Location%22,%22sort%22:%22asc%22%7D.
117 H.R. Medicare Access and CHIP Reauthorization Act of 2015, H.R. 2, 114th Cong. (2015).
118 82 Fed. Reg. 35155-35171 (July 28, 2017), https://www.federalregister.gov/documents/2017/07/28/2017-15962/medicaid-program-state-disproportionate-share-hospital-allotment-reductions.
119 Kaiser Family Foundation analysis of the 2016 National Health Interview Survey.
120 Liz Hamel, Mira Norton, Karen Pollitz, Larry Levitt, Gary Claxton, and Mollyann Brodie, The Burden of Medical Debt: Results from the Kaiser Family Foundation/New York Times Medical Bills Survey (Washington, DC: Kaiser Family Foundation, January 2016), http://www.kff.org/health-costs/report/the-burden-of-medical-debt-results-from-the-kaiser-family-foundationnew-york-times-medical-bills-survey/.
121 HHS, Office of the Assistant Secretary for Planning and Evaluation, The Value of Health Insurance: Few of the Uninsured Have Adequate Resources to Pay Potential Hospital Bills (HHS, ASPE, May 2011), https://aspe.hhs.gov/basic-report/value-health-insurance-few-uninsured-have-adequate-resources-pay-potential-hospital-bills.
122 Ibid.
123 Sherry Glied and Richard Kronick, The Value of Health Insurance: Few of the Uninsured Have Adequate Resources to Pay Potential Hospital Bills (Washington, DC: Office of Assistant Secretary for Planning and Evaluation, HHS, May 2011), http://aspe.hhs.gov/health/reports/2011/ValueofInsurance/rb.pdf.
124 Kaiser Family Foundation analysis of the 2016 National Health Interview Survey.
125 Ibid.

The Uninsured: A Primer 21
126 Consumer Financial Protection Bureau, Consumer Credit Reports: A Study of Medical and Non-Medical Collections (consumer Financial Protection Bureau, December 2014), http://files.consumerfinance.gov/f/201412_cfpb_reports_consumer-credit-medical-and-non-medical-collections.pdf.
127 David Himmelstein et al., “Medical bankruptcy in the United States, 2007: results of a national study,” The American Journal of Medicine 122, no. 8 (August 2009): 741-6, http://www.pnhp.org/new_bankruptcy_study/Bankruptcy-2009.pdf.
the henry j. kaiser family foundation
Headquarters2400 Sand Hill RoadMenlo Park, CA 94025Phone 650-854-9400
Washington Offices and Barbara Jordan Conference Center1330 G Street, NW Washington, DC 20005 Phone 202-347-5270
www.kff.org
This publication (#7451-13) is available on the Kaiser Family Foundation’s website at www.kff.org.
Filling the need for trusted information on national health issues, the Kaiser Family Foundation is a nonprofit organization based in Menlo Park, California.