canadian life and health insurance facts...canadian life and health insurance facts, 2016 edition...
TRANSCRIPT
Canadian Life and HealthInsurance Facts2016 Edition
President's MessageCanadian Life and Health Insurance Facts, 2016 Edition presents authoritative, factual information about life and health insurance in Canada.
It is published by the Canadian Life and Health Insurance Association (CLHIA). The CLHIA is a voluntary association whose member companies account for 99% of Canada’s life and health insurance business. The industry provides a wide range of financial security products such as life insurance, annuities (including RRSPs, RRIFs and pensions) and supplementary health insurance to over 28 million Canadians. It also holds over $760 billion of assets in Canada and employs about 148,600 Canadians.
The current edition includes information about the life, health and annuity business of all federally registered and provincially incorporated insurance providers in Canada (including the health business of property and casualty insurers), unless stated otherwise. The sources of material for this publication include information from these insurance providers as well as relevant data from government agencies, regulatory bodies, and other associations. Their assistance is acknowledged with thanks.
Wherever possible, figures presented here relate to the Canadian life and health insurance business of companies of all national origins. However, where relevant, the numbers relate only to the worldwide business of Canadian companies.
79 Wellington St. WestSuite 2300P.O. Box 99, TD South TowerToronto, Ontario M5K 1G8416-777-2221
www.clhia.catwitter.com/clhia
In order to simplify the text, we use the letters K, M, B, and T to refer to thousands, millions, billions and trillions, respectively.
Provincial and historical data are available in the appendices.
46 Elgin StreetSuite 400Ottawa, Ontario K1P 5K6 613-230-0031
1001 de Maisonneuve Blvd. W.Suite 630Montreal, Quebec H3A 3C8 514-845-9004
Toronto Ottawa Montréal

President's messageWelcome to the CLHIA’s new and improved Canadian Life and Health Insurance Facts. The life and health insurance industry in Canada continues to evolve to meet the needs of its customers and plays an important role in contributing to matters of public policy. We thought the time was right to take a fresh approach to communicating the data that underpins the major contribution the industry makes to Canada’s economy and illustrates how it provides financial security to Canadians when they need it the most.
Canada’s life and health insurance industry grows from strength to strength with every passing year. We have continued to weather significant shocks to the global economy, as well as a persistently low interest rate environment since 2008. The life and health insurance industry is one of the powerhouses driving the Canadian economy, and we are one of the few Canadian industries that hold global assets of more than $1.6 trillion.
I hope that you find the 2016 Edition of our “factbook” informative and that it communicates the significant value the life and health insurance industry represents to Canada’s economy and to Canadians.
Frank SwedlovePresident & CEO

What's inside
Industry profile 02 Industry at a glance04 Canadian marketplace
Lines of business08 Life insurance10 Retirement solutions 12 Health insurance
Industry in detail 16 Assets, liabilities and capital19 Total tax contributions 20 Global footprint
Appendices00 Provincial data00 Historical data00 CLHIA member companies00 Glossary of insurance terms


Industry profile
2
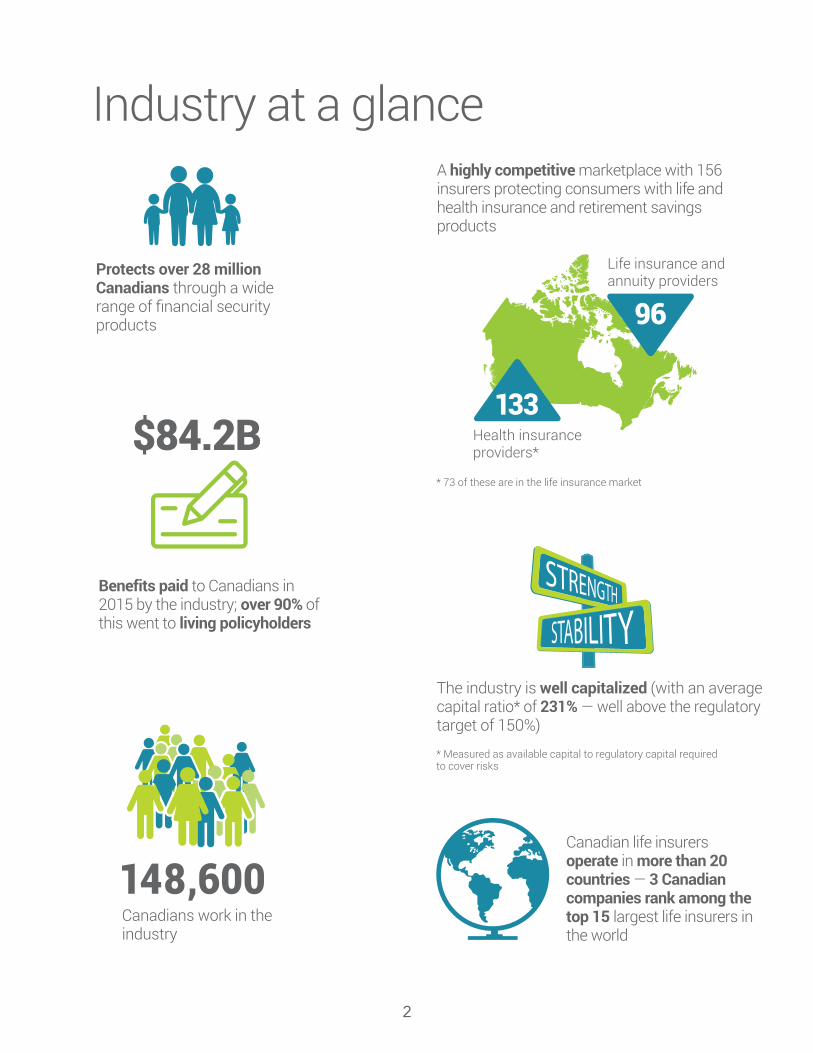
Protects over 28 million Canadians through a wide range of financial security products
A highly competitive marketplace with 156 insurers protecting consumers with life and health insurance and retirement savings products
Health insuranceproviders*
Life insurance andannuity providers
148,600Canadians work in the industry
The industry is well capitalized (with an average capital ratio* of 231% — well above the regulatory target of 150%)
* 73 of these are in the life insurance market
* Measured as available capital to regulatory capital requiredto cover risks
Canadian life insurers operate in more than 20 countries — 3 Canadian companies rank among the top 15 largest life insurers in the world
well capitalize231% — well ab
133
96
Benefits paid to Canadians in 2015 by the industry; over 90% of this went to living policyholders
$84.2B
Industry at a glance
3
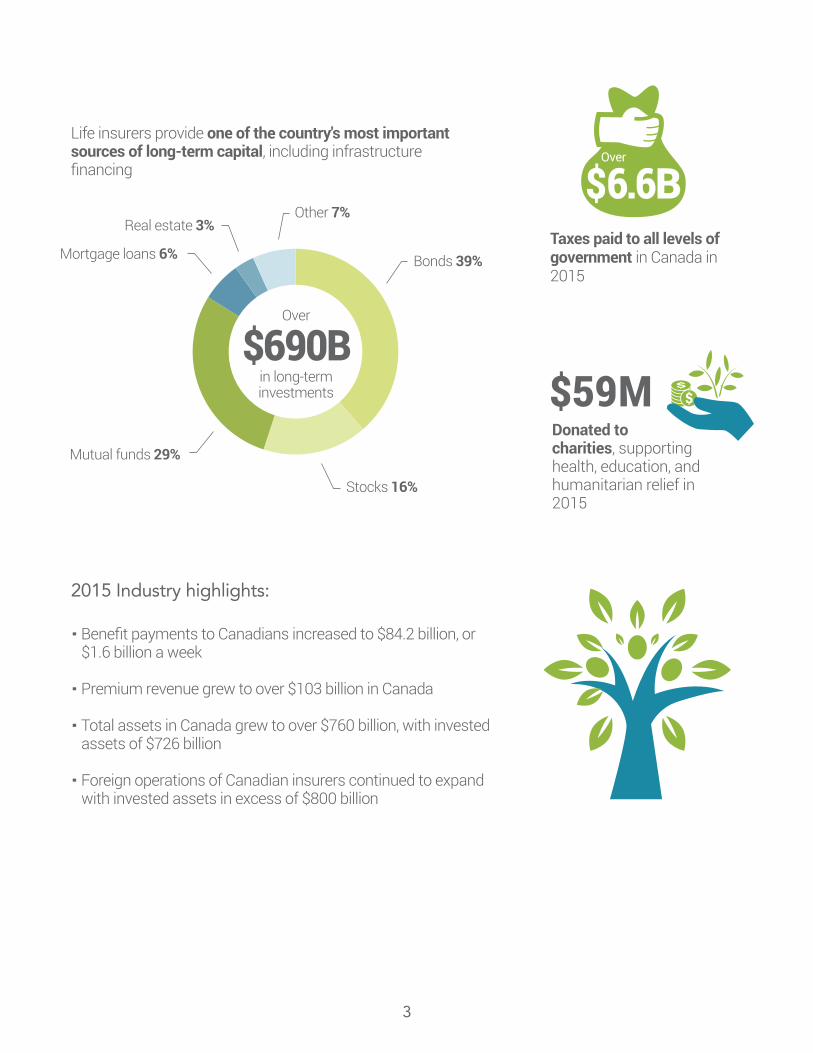
Taxes paid to all levels of government in Canada in 2015
· Benefit payments to Canadians increased to $84.2 billion, or $1.6 billion a week
· Premium revenue grew to over $103 billion in Canada
· Total assets in Canada grew to over $760 billion, with invested assets of $726 billion
· Foreign operations of Canadian insurers continued to expand with invested assets in excess of $800 billion
Donated to charities, supporting health, education, and humanitarian relief in 2015
Life insurers provide one of the country's most important sources of long-term capital, including infrastructure financing
$59M$690B
Bonds 39%
Stocks 16%
Mutual funds 29%
Mortgage loans 6%
Real estate 3%Other 7%
in long-terminvestments
$6.6BOver
2015 Industry highlights:
Over
4
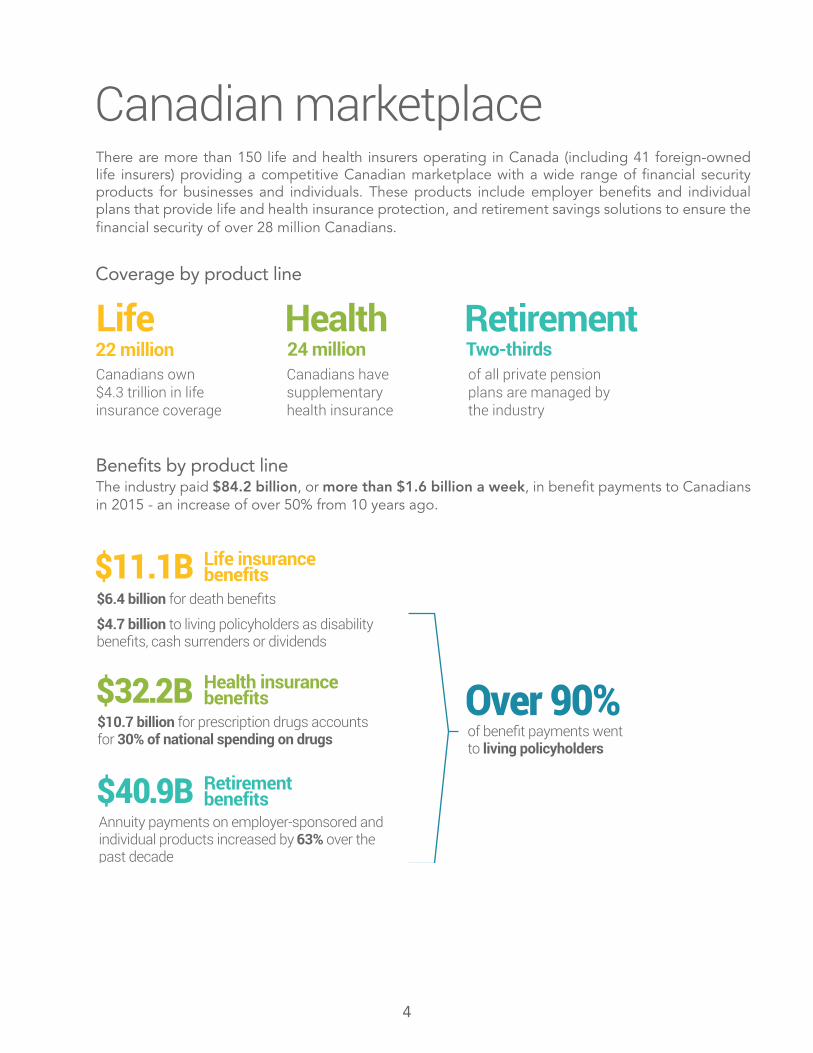
Canadian marketplaceThere are more than 150 life and health insurers operating in Canada (including 41 foreign-owned life insurers) providing a competitive Canadian marketplace with a wide range of financial security products for businesses and individuals. These products include employer benefits and individual plans that provide life and health insurance protection, and retirement savings solutions to ensure the financial security of over 28 million Canadians.
Benefits by product lineThe industry paid $84.2 billion, or more than $1.6 billion a week, in benefit payments to Canadians in 2015 - an increase of over 50% from 10 years ago.
Life22 million
Health24 million Two-thirds
RetirementCanadians own $4.3 trillion in life insurance coverage
Canadians have supplementary health insurance
of all private pension plans are managed by the industry
Coverage by product line
$11.1B Life insurancebenefits
$32.2B Health insurancebenefits
$40.9B Retirementbenefits
$10.7 billion for prescription drugs accounts for 30% of national spending on drugs
Annuity payments on employer-sponsored and individual products increased by 63% over the past decade
of benefit payments wentto living policyholders
Over 90%
$6.4 billion for death benefits
$4.7 billion to living policyholders as disability benefits, cash surrenders or dividends
5
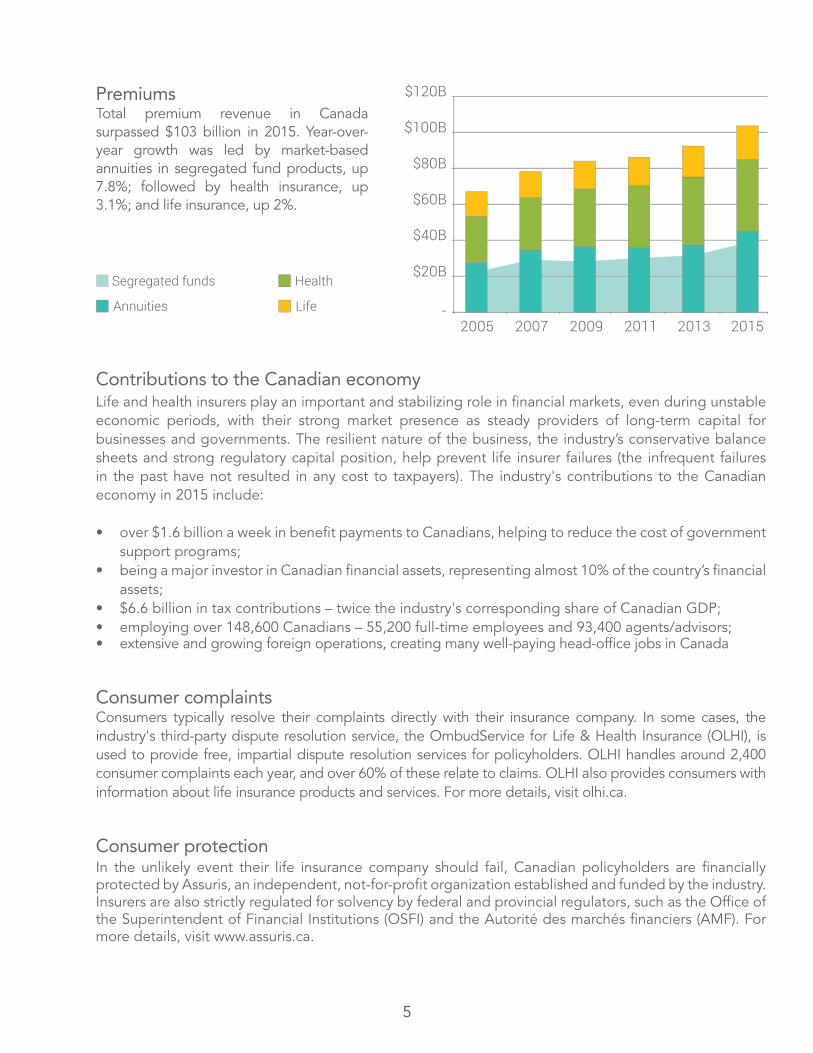
PremiumsTotal premium revenue in Canada surpassed $103 billion in 2015. Year-over-year growth was led by market-based annuities in segregated fund products, up 7.8%; followed by health insurance, up 3.1%; and life insurance, up 2%.
Contributions to the Canadian economyLife and health insurers play an important and stabilizing role in financial markets, even during unstable economic periods, with their strong market presence as steady providers of long-term capital for businesses and governments. The resilient nature of the business, the industry’s conservative balance sheets and strong regulatory capital position, help prevent life insurer failures (the infrequent failures in the past have not resulted in any cost to taxpayers). The industry's contributions to the Canadian economy in 2015 include:
• over $1.6 billion a week in benefit payments to Canadians, helping to reduce the cost of government support programs;
• being a major investor in Canadian financial assets, representing almost 10% of the country’s financial assets;
• $6.6 billion in tax contributions – twice the industry's corresponding share of Canadian GDP;• employing over 148,600 Canadians – 55,200 full-time employees and 93,400 agents/advisors;• extensive and growing foreign operations, creating many well-paying head-office jobs in Canada
Consumer complaintsConsumers typically resolve their complaints directly with their insurance company. In some cases, the industry's third-party dispute resolution service, the OmbudService for Life & Health Insurance (OLHI), is used to provide free, impartial dispute resolution services for policyholders. OLHI handles around 2,400 consumer complaints each year, and over 60% of these relate to claims. OLHI also provides consumers with information about life insurance products and services. For more details, visit olhi.ca.
Consumer protectionIn the unlikely event their life insurance company should fail, Canadian policyholders are financially protected by Assuris, an independent, not-for-profit organization established and funded by the industry. Insurers are also strictly regulated for solvency by federal and provincial regulators, such as the Office of the Superintendent of Financial Institutions (OSFI) and the Autorité des marchés financiers (AMF). For more details, visit www.assuris.ca.
2005 2007 2009 2011 2013 2015
$20B
-
$40B
$60B
$80B
$100B
$120B
Segregated funds
Annuities
Health
Life

Lines of business
8
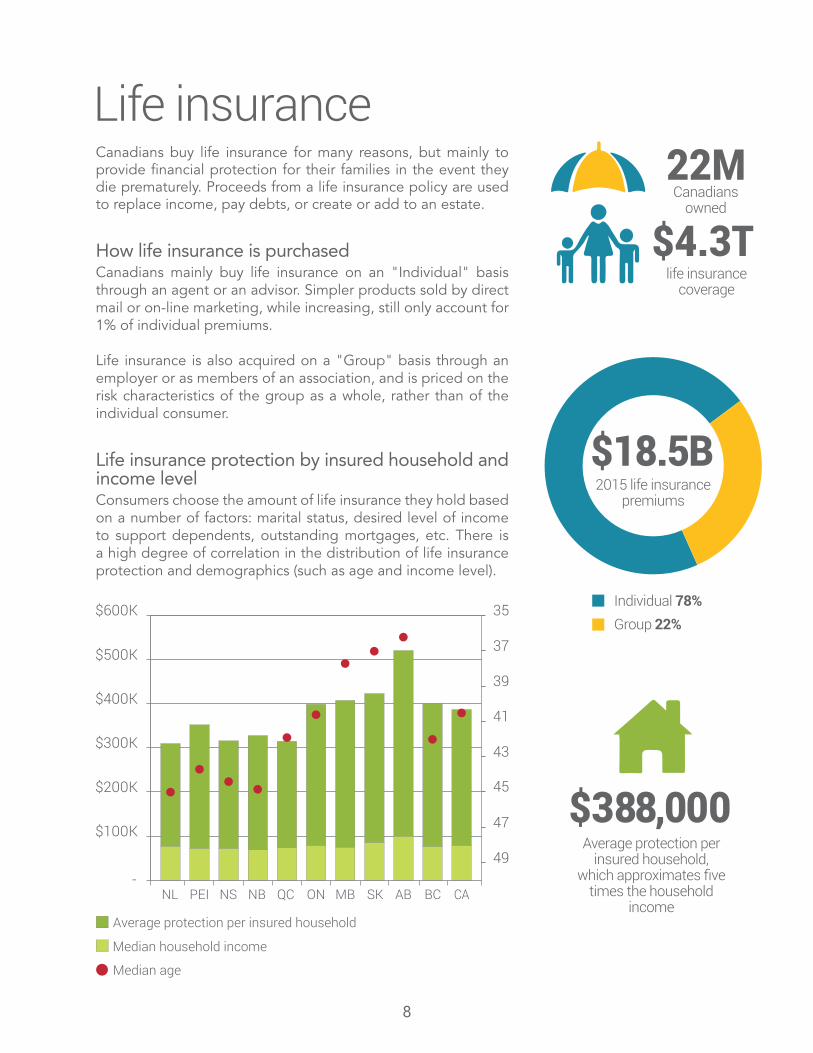
Life insuranceCanadians buy life insurance for many reasons, but mainly to provide financial protection for their families in the event they die prematurely. Proceeds from a life insurance policy are used to replace income, pay debts, or create or add to an estate.
How life insurance is purchasedCanadians mainly buy life insurance on an "Individual" basis through an agent or an advisor. Simpler products sold by direct mail or on-line marketing, while increasing, still only account for 1% of individual premiums.
Life insurance is also acquired on a "Group" basis through an employer or as members of an association, and is priced on the risk characteristics of the group as a whole, rather than of the individual consumer.
Life insurance protection by insured household and income levelConsumers choose the amount of life insurance they hold based on a number of factors: marital status, desired level of income to support dependents, outstanding mortgages, etc. There is a high degree of correlation in the distribution of life insurance protection and demographics (such as age and income level).
Individual 78%Group 22%
2015 life insurance premiums
$18.5B
Canadiansowned
life insurance coverage
22M
$4.3T
-
$100K
$200K
$300K
$400K
$500K
$600K
Average protection per insured household
Median age
Median household income
35
37
39
41
43
45
47
49
NL PEI NS NB QC ON MB SK AB BC CA
$388,000Average protection per
insured household, which approximates five
times the household income
9
$1T
$2T
$3T
$4T
2005 2007 2009 2011 2013 2015
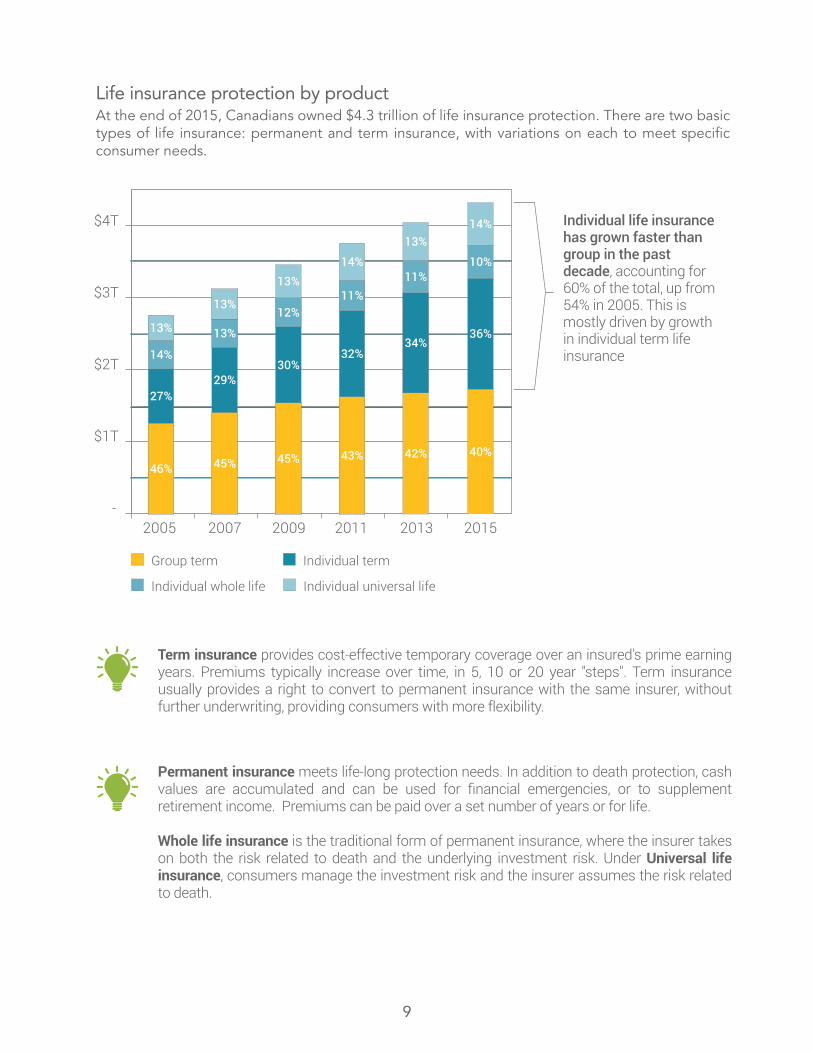
Individual universal lifeIndividual whole life
Individual termGroup term
Individual life insurance has grown faster than group in the past decade, accounting for 60% of the total, up from 54% in 2005. This is mostly driven by growth in individual term life insurance
-
46% 45% 45% 43% 42%
27%29%
30%32%
34%14%
13%
12%11%
11%
13%
13%
13%14%
13%
40%
36%
10%
14%
Life insurance protection by productAt the end of 2015, Canadians owned $4.3 trillion of life insurance protection. There are two basic types of life insurance: permanent and term insurance, with variations on each to meet specific consumer needs.
Term insurance provides cost-effective temporary coverage over an insured's prime earning years. Premiums typically increase over time, in 5, 10 or 20 year "steps". Term insurance usually provides a right to convert to permanent insurance with the same insurer, without further underwriting, providing consumers with more flexibility.
Permanent insurance meets life-long protection needs. In addition to death protection, cash values are accumulated and can be used for financial emergencies, or to supplement retirement income. Premiums can be paid over a set number of years or for life.
Whole life insurance is the traditional form of permanent insurance, where the insurer takes on both the risk related to death and the underlying investment risk. Under Universal life insurance, consumers manage the investment risk and the insurer assumes the risk related to death.
10
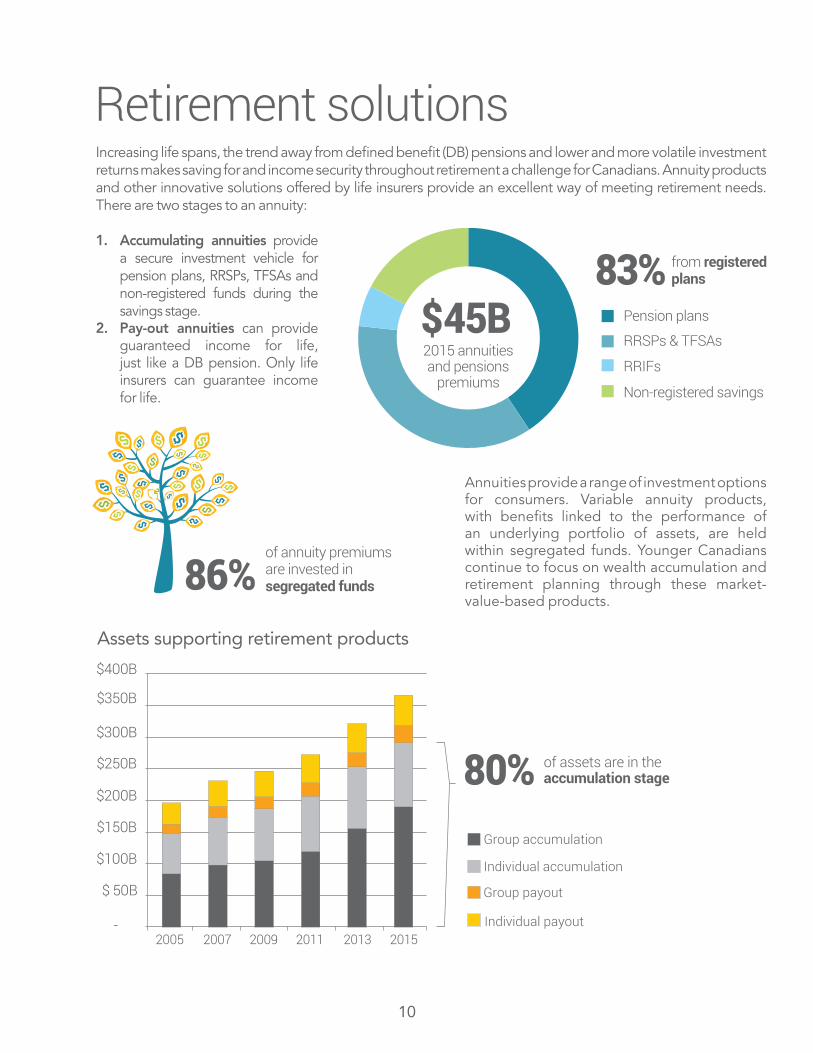
Retirement solutionsIncreasing life spans, the trend away from defined benefit (DB) pensions and lower and more volatile investment returns makes saving for and income security throughout retirement a challenge for Canadians. Annuity products and other innovative solutions offered by life insurers provide an excellent way of meeting retirement needs. There are two stages to an annuity:
1. Accumulating annuities provide a secure investment vehicle for pension plans, RRSPs, TFSAs and non-registered funds during the savings stage.
2. Pay-out annuities can provide guaranteed income for life, just like a DB pension. Only life insurers can guarantee income for life.
Annuities provide a range of investment options for consumers. Variable annuity products, with benefits linked to the performance of an underlying portfolio of assets, are held within segregated funds. Younger Canadians continue to focus on wealth accumulation and retirement planning through these market-value-based products.
86%of annuity premiums are invested in segregated funds
$$$$
$$
$$
$$
$$
$$
$$
$$
$$ $$
$$
$$$$ $$
$$
$$$$$$$$
$$
$$
$$$$
$$ $$
$$
$$
$$
$$
$$
Assets supporting retirement products
Group accumulation
Individual accumulation
Group payout
Individual payout -
$ 50B
$100B
$150B
$200B
$250B
$300B
$350B
$400B
2005 2007 2009 2011 2013 2015
of assets are in theaccumulation stage80%
Pension plans
RRSPs & TFSAs
RRIFs
Non-registered savings
2015 annuitiesand pensions
premiums
$45Bfrom registeredplans83%
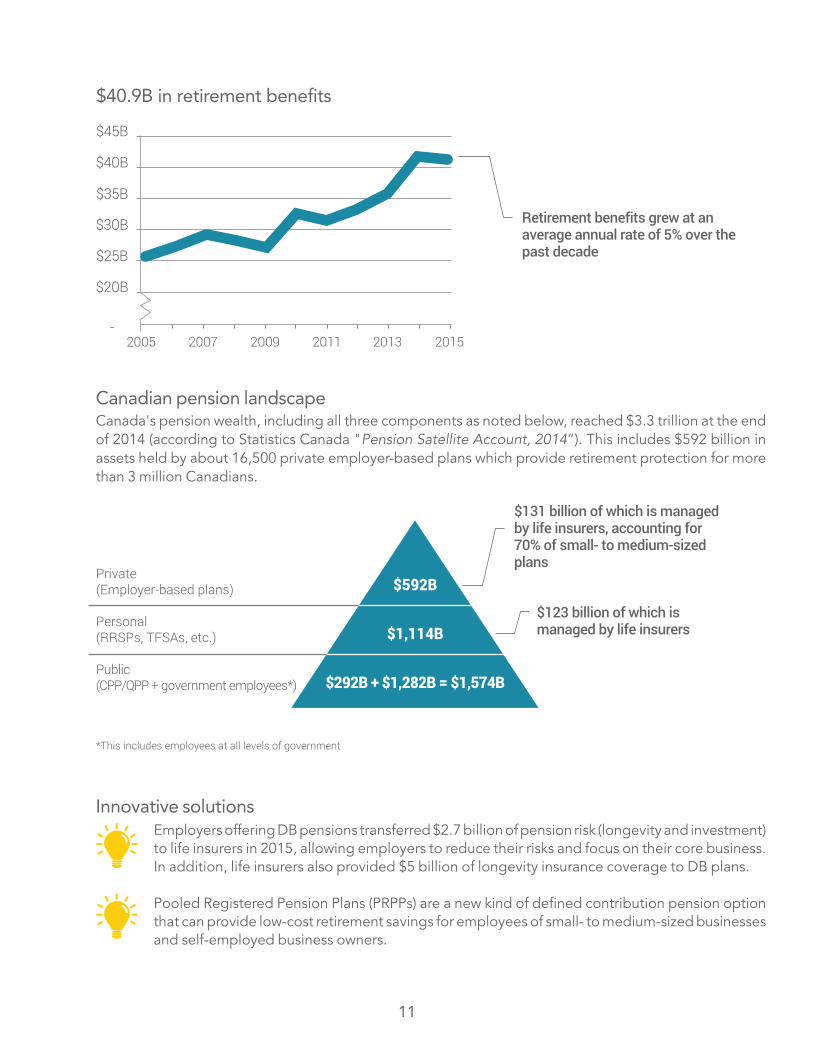
Canadian pension landscapeCanada's pension wealth, including all three components as noted below, reached $3.3 trillion at the end of 2014 (according to Statistics Canada "Pension Satellite Account, 2014”). This includes $592 billion in assets held by about 16,500 private employer-based plans which provide retirement protection for more than 3 million Canadians.
Innovative solutionsEmployers offering DB pensions transferred $2.7 billion of pension risk (longevity and investment) to life insurers in 2015, allowing employers to reduce their risks and focus on their core business. In addition, life insurers also provided $5 billion of longevity insurance coverage to DB plans.
Pooled Registered Pension Plans (PRPPs) are a new kind of defined contribution pension option that can provide low-cost retirement savings for employees of small- to medium-sized businesses and self-employed business owners.
-
$20B
$25B
$30B
$35B
$40B
$45B
$40.9B in retirement benefits
Retirement benefits grew at an average annual rate of 5% over the past decade
2005 2007 2009 2011 2013 2015
11
Private(Employer-based plans)
Personal(RRSPs, TFSAs, etc.)
Public(CPP/QPP + government employees*)
$592B
$1,114B
$292B + $1,282B = $1,574B
$131 billion of which is managed by life insurers, accounting for 70% of small- to medium-sized plans
$123 billion of which is managed by life insurers
*This includes employees at all levels of government
12
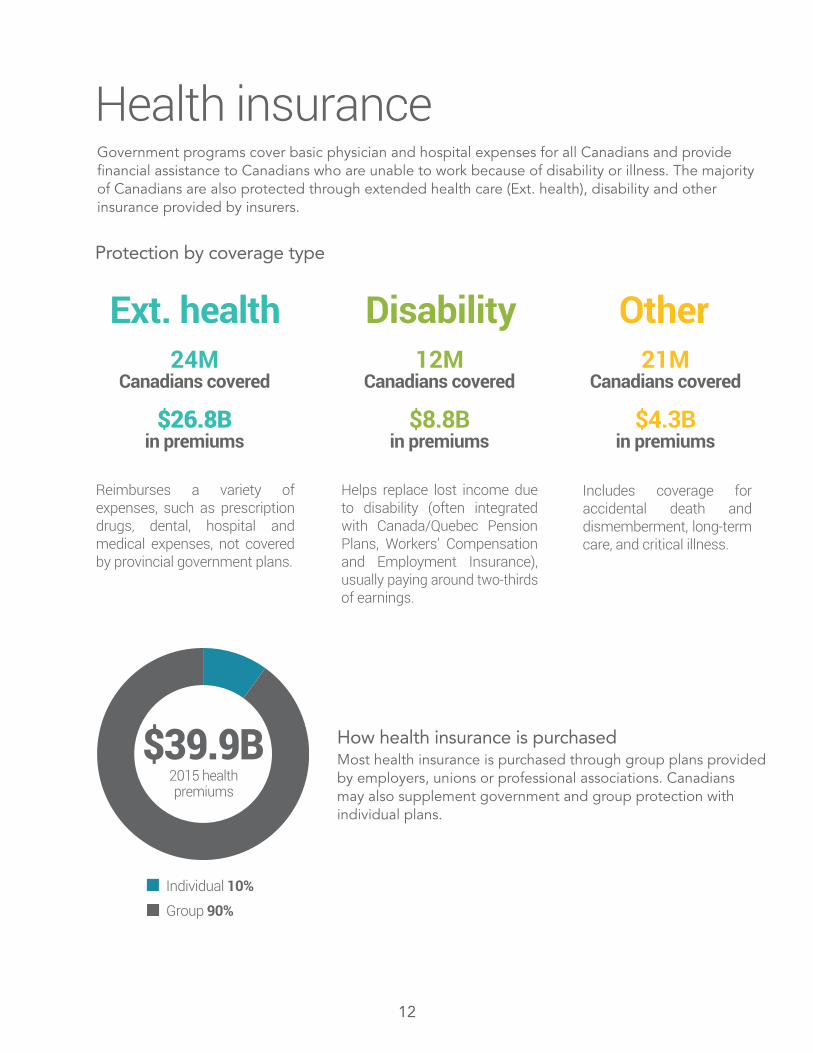
Health insuranceGovernment programs cover basic physician and hospital expenses for all Canadians and provide financial assistance to Canadians who are unable to work because of disability or illness. The majority of Canadians are also protected through extended health care (Ext. health), disability and other insurance provided by insurers.
How health insurance is purchasedMost health insurance is purchased through group plans provided by employers, unions or professional associations. Canadians may also supplement government and group protection with individual plans.
Ext. health Disability Other24M
Canadians covered
$26.8Bin premiums
12M Canadians covered
$8.8Bin premiums
21M Canadians covered
$4.3Bin premiums
Reimburses a variety of expenses, such as prescription drugs, dental, hospital and medical expenses, not covered by provincial government plans.
Helps replace lost income due to disability (often integrated with Canada/Quebec Pension Plans, Workers’ Compensation and Employment Insurance), usually paying around two-thirds of earnings.
Includes coverage for accidental death and dismemberment, long-term care, and critical illness.
Protection by coverage type
2015 health premiums
$39.9B
Individual 10%
Group 90%
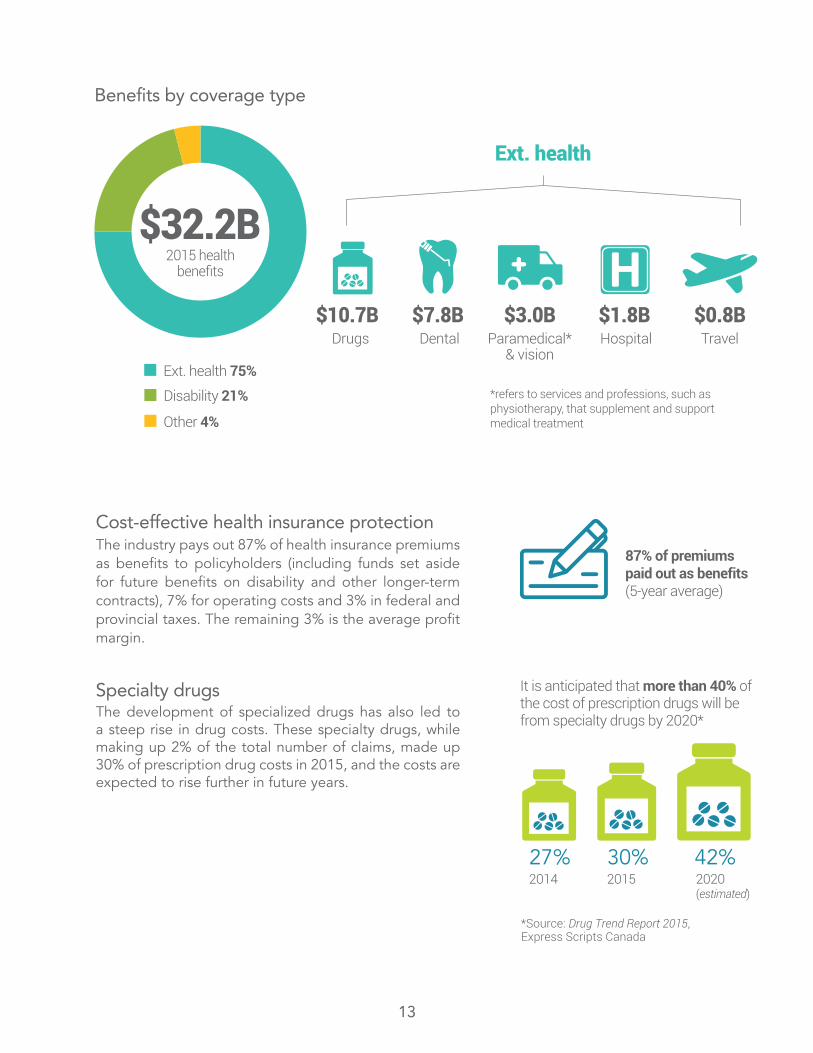
Cost-effective health insurance protectionThe industry pays out 87% of health insurance premiums as benefits to policyholders (including funds set aside for future benefits on disability and other longer-term contracts), 7% for operating costs and 3% in federal and provincial taxes. The remaining 3% is the average profit margin.
Specialty drugsThe development of specialized drugs has also led to a steep rise in drug costs. These specialty drugs, while making up 2% of the total number of claims, made up 30% of prescription drug costs in 2015, and the costs are expected to rise further in future years.
13
2015 healthbenefits
$32.2B
Ext. health 75%
Disability 21%
Other 4%
Benefits by coverage type
$10.7B Drugs
$7.8B Dental
$3.0BParamedical*
& vision
Ext. health
$1.8B Hospital
$0.8BTravel
*refers to services and professions, such as physiotherapy, that supplement and support medical treatment
87% of premiums paid out as benefits (5-year average)
It is anticipated that more than 40% of the cost of prescription drugs will be from specialty drugs by 2020*
27% 30% 42%2014 2015 2020
(estimated)
*Source: Drug Trend Report 2015,Express Scripts Canada


Industry in detail
16
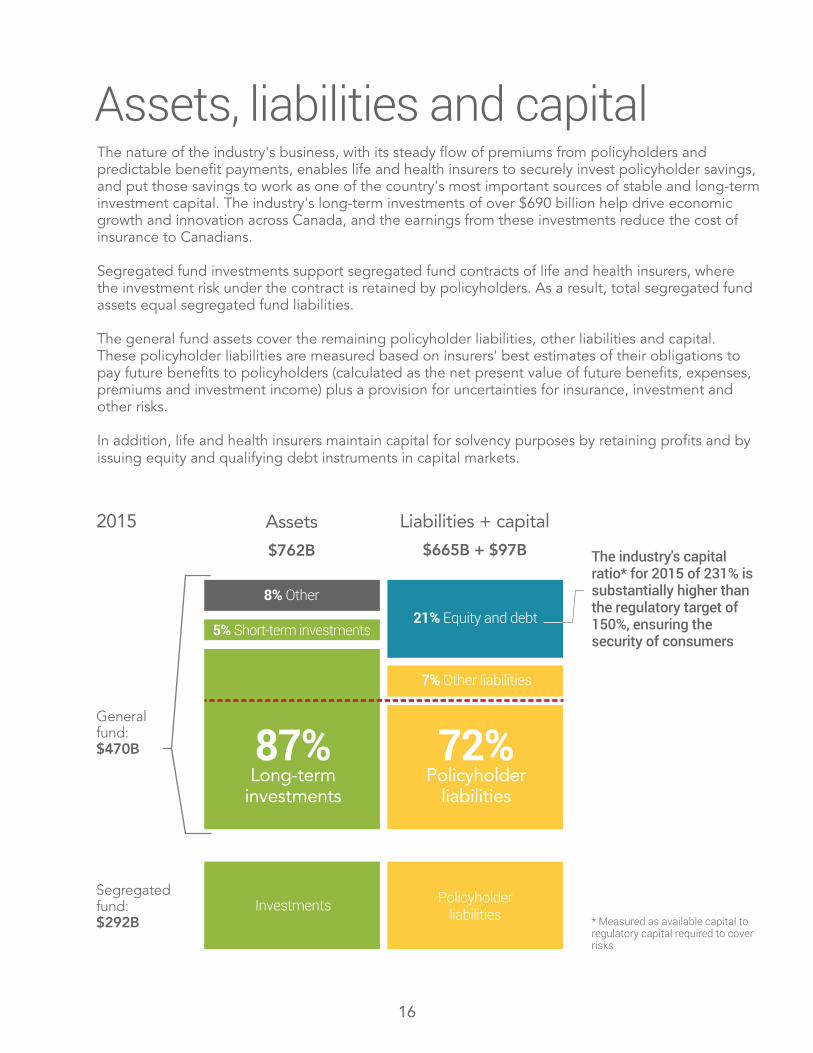
Assets, liabilities and capitalThe nature of the industry's business, with its steady flow of premiums from policyholders and predictable benefit payments, enables life and health insurers to securely invest policyholder savings, and put those savings to work as one of the country's most important sources of stable and long-term investment capital. The industry's long-term investments of over $690 billion help drive economic growth and innovation across Canada, and the earnings from these investments reduce the cost of insurance to Canadians.
Segregated fund investments support segregated fund contracts of life and health insurers, where the investment risk under the contract is retained by policyholders. As a result, total segregated fund assets equal segregated fund liabilities.
The general fund assets cover the remaining policyholder liabilities, other liabilities and capital. These policyholder liabilities are measured based on insurers' best estimates of their obligations to pay future benefits to policyholders (calculated as the net present value of future benefits, expenses, premiums and investment income) plus a provision for uncertainties for insurance, investment and other risks.
In addition, life and health insurers maintain capital for solvency purposes by retaining profits and by issuing equity and qualifying debt instruments in capital markets.
The industry's capital ratio* for 2015 of 231% is substantially higher than the regulatory target of 150%, ensuring the security of consumers
79%Long-Term
72%Policyholder
liabilities
87%Long-term
investments
Assets
$762B
2015
Generalfund:$470B
Segregatedfund:$292B
Liabilities + capital
$665B + $97B
8% Other21% Equity and debt
5% Short-term investments
7% Other liabilities
Investments Policyholderliabilities * Measured as available capital to
regulatory capital required to coverrisks
17
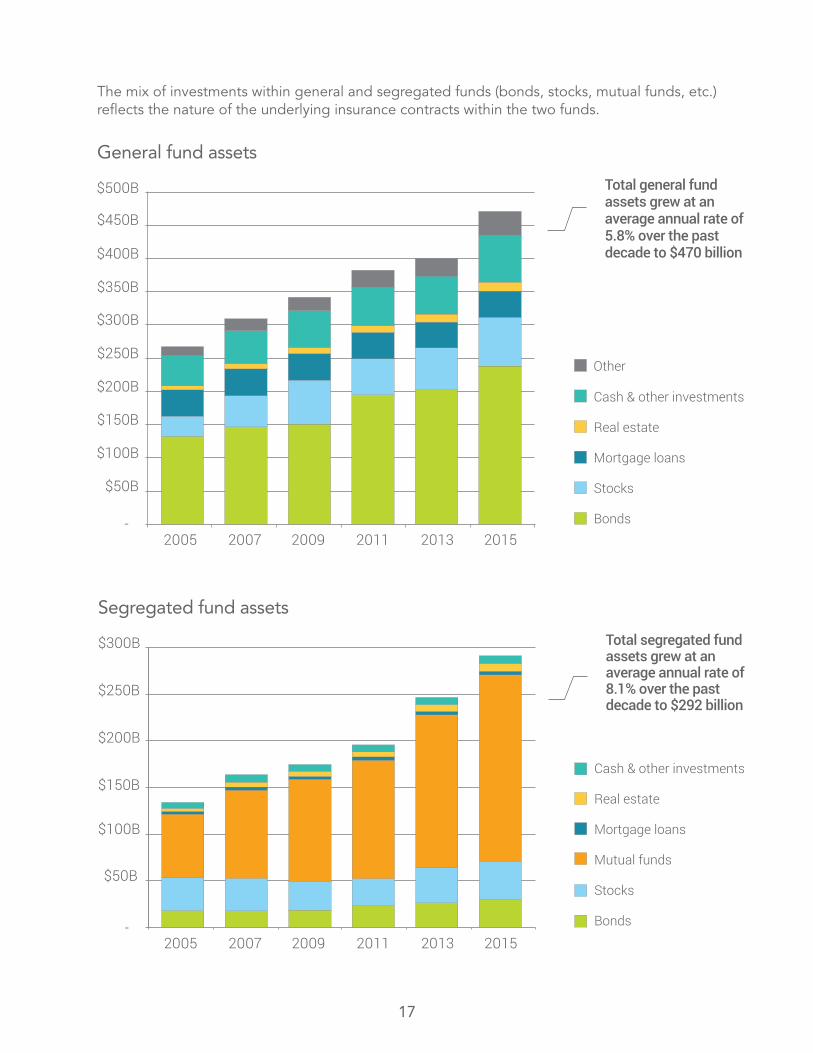
General fund assets
Cash & other investments
Real estate
Mortgage loans
Stocks
Bonds
Other
-
$50B
$100B
$150B
$200B
$250B
$300B
$350B
$400B
$450B
$500B Total general fund assets grew at an average annual rate of 5.8% over the past decade to $470 billion
2005 2007 2009 2011 2013 2015
-2005 2007 2009 2011 2013 2015
Segregated fund assets
$50B
$100B
$150B
$200B
$250B
$300B Total segregated fund assets grew at an average annual rate of 8.1% over the past decade to $292 billion
Cash & other investments
Real estate
Mortgage loans
Mutual funds
Stocks
Bonds
The mix of investments within general and segregated funds (bonds, stocks, mutual funds, etc.) reflects the nature of the underlying insurance contracts within the two funds.

18
THIS PAGE INTENTIONALLY LEFT BLANK.
19
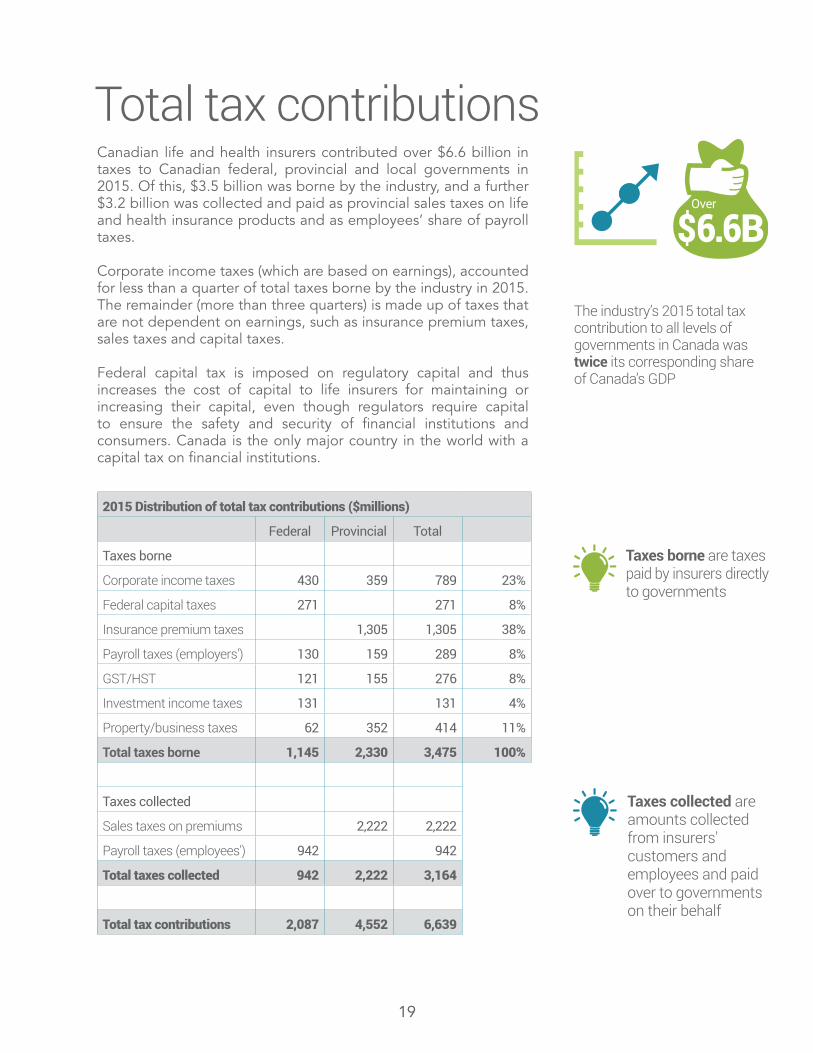
Total tax contributionsCanadian life and health insurers contributed over $6.6 billion in taxes to Canadian federal, provincial and local governments in 2015. Of this, $3.5 billion was borne by the industry, and a further $3.2 billion was collected and paid as provincial sales taxes on life and health insurance products and as employees’ share of payroll taxes.
Corporate income taxes (which are based on earnings), accounted for less than a quarter of total taxes borne by the industry in 2015. The remainder (more than three quarters) is made up of taxes that are not dependent on earnings, such as insurance premium taxes, sales taxes and capital taxes.
Federal capital tax is imposed on regulatory capital and thus increases the cost of capital to life insurers for maintaining or increasing their capital, even though regulators require capital to ensure the safety and security of financial institutions and consumers. Canada is the only major country in the world with a capital tax on financial institutions.
The industry’s 2015 total tax contribution to all levels of governments in Canada was twice its corresponding share of Canada’s GDP
$6.6BOver
2015 Distribution of total tax contributions ($millions)
Federal Provincial Total
Taxes borne
Corporate income taxes 430 359 789 23%
Federal capital taxes 271 271 8%
Insurance premium taxes 1,305 1,305 38%
Payroll taxes (employers') 130 159 289 8%
GST/HST 121 155 276 8%
Investment income taxes 131 131 4%
Property/business taxes 62 352 414 11%
Total taxes borne 1,145 2,330 3,475 100%
Taxes collected
Sales taxes on premiums 2,222 2,222
Payroll taxes (employees') 942 942
Total taxes collected 942 2,222 3,164
Total tax contributions 2,087 4,552 6,639
Taxes borne are taxes paid by insurers directly to governments
Taxes collected are amounts collected from insurers' customers and employees and paid over to governments on their behalf
20
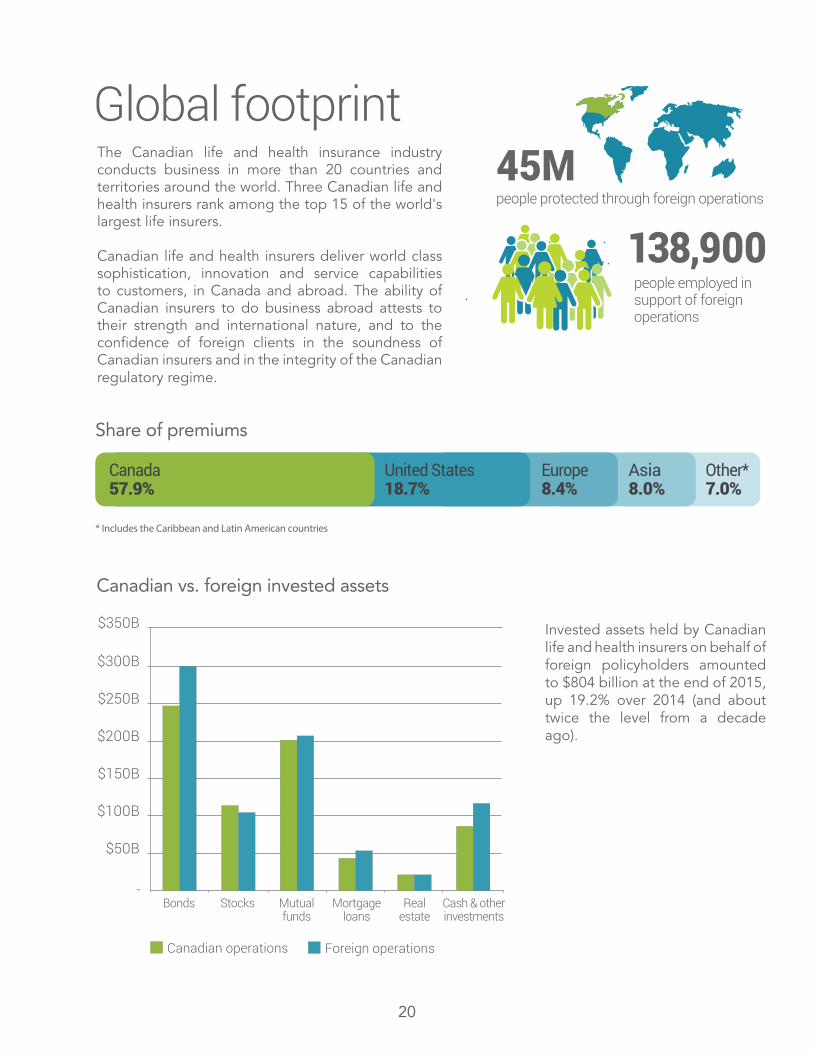
The Canadian life and health insurance industry conducts business in more than 20 countries and territories around the world. Three Canadian life and health insurers rank among the top 15 of the world's largest life insurers.
Canadian life and health insurers deliver world class sophistication, innovation and service capabilities to customers, in Canada and abroad. The ability of Canadian insurers to do business abroad attests to their strength and international nature, and to the confidence of foreign clients in the soundness of Canadian insurers and in the integrity of the Canadian regulatory regime.
Invested assets held by Canadian life and health insurers on behalf of foreign policyholders amounted to $804 billion at the end of 2015, up 19.2% over 2014 (and about twice the level from a decade ago).
45M people protected through foreign operations
138,900people employed in support of foreign operations
Share of premiums
Canada57.9%
United States18.7%
Europe8.4%
Asia8.0%
Other*7.0%
* Includes the Caribbean and Latin American countries
Canadian vs. foreign invested assets
Bonds Stocks Mutualfunds
Cash & otherinvestments
Mortgageloans
Realestate
Canadian operations Foreign operations
-
$100B
$50B
$150B
$200B
$250B
$300B
$350B
Global footprint
21
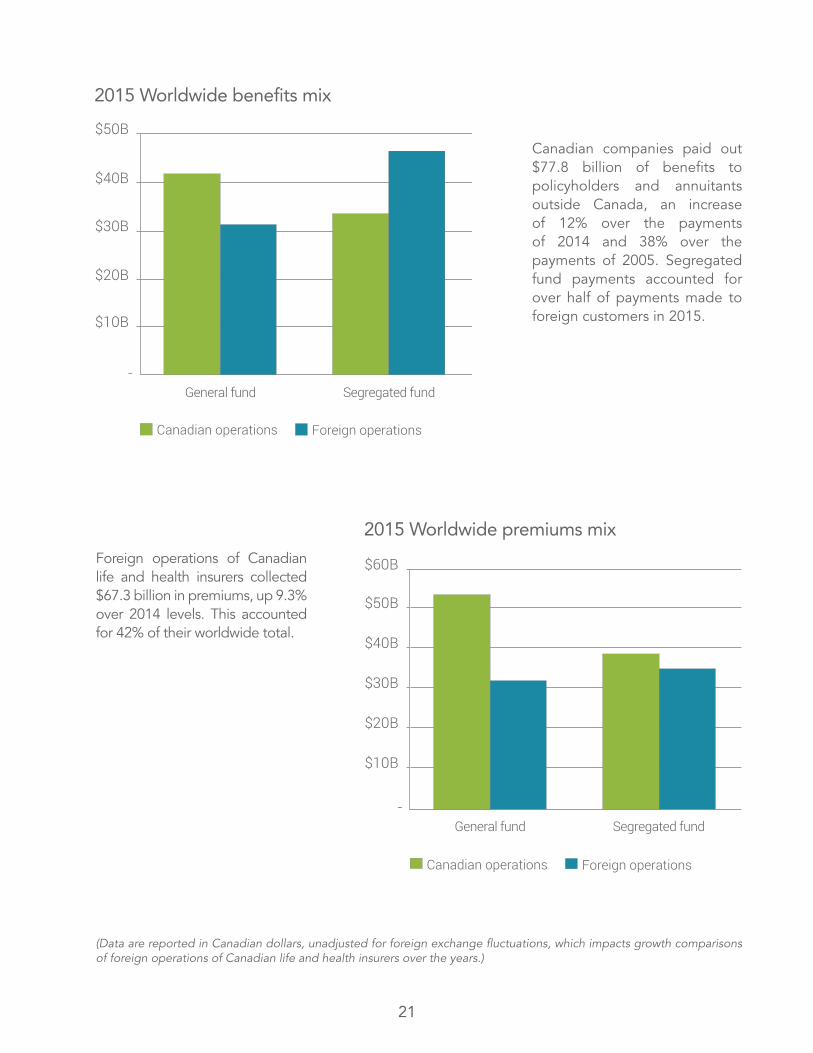
Canadian companies paid out $77.8 billion of benefits to policyholders and annuitants outside Canada, an increase of 12% over the payments of 2014 and 38% over the payments of 2005. Segregated fund payments accounted for over half of payments made to foreign customers in 2015.
Foreign operations of Canadian life and health insurers collected $67.3 billion in premiums, up 9.3% over 2014 levels. This accounted for 42% of their worldwide total.
-
$10B
$20B
$30B
$40B
$50B
$60B
General fund Segregated fund
2015 Worldwide premiums mix
Canadian operations Foreign operations
-
$10B
$20B
$30B
$40B
$50B
General fund Segregated fund
2015 Worldwide benefits mix
Canadian operations Foreign operations
(Data are reported in Canadian dollars, unadjusted for foreign exchange fluctuations, which impacts growth comparisons of foreign operations of Canadian life and health insurers over the years.)
Appendices
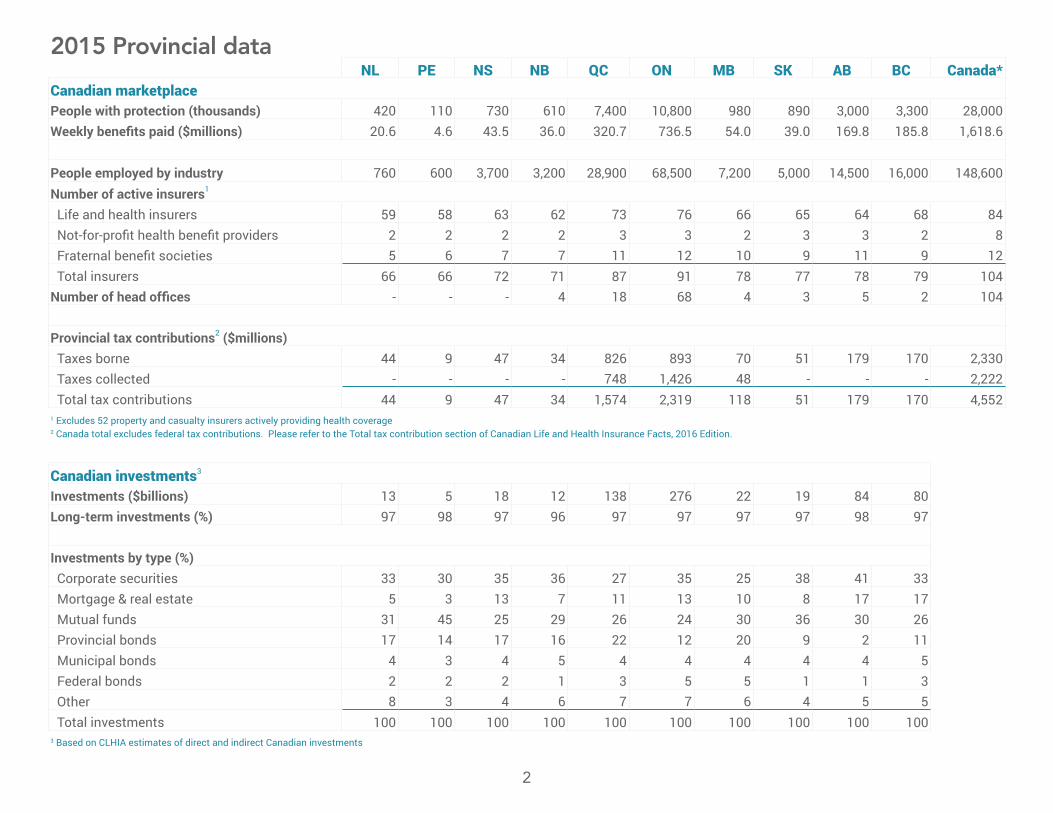
2015 Provincial dataNL PE NS NB QC ON MB SK AB BC Canada*
Canadian marketplacePeople with protection (thousands) 420 110 730 610 7,400 10,800 980 890 3,000 3,300 28,000Weekly benefits paid ($millions) 20.6 4.6 43.5 36.0 320.7 736.5 54.0 39.0 169.8 185.8 1,618.6
People employed by industry 760 600 3,700 3,200 28,900 68,500 7,200 5,000 14,500 16,000 148,600 Number of active insurers1
Life and health insurers 59 58 63 62 73 76 66 65 64 68 84 Not-for-profit health benefit providers 2 2 2 2 3 3 2 3 3 2 8 Fraternal benefit societies 5 6 7 7 11 12 10 9 11 9 12 Total insurers 66 66 72 71 87 91 78 77 78 79 104 Number of head offices - - - 4 18 68 4 3 5 2 104
Provincial tax contributions2 ($millions) Taxes borne 44 9 47 34 826 893 70 51 179 170 2,330 Taxes collected - - - - 748 1,426 48 - - - 2,222 Total tax contributions 44 9 47 34 1,574 2,319 118 51 179 170 4,552 1 Excludes 52 property and casualty insurers actively providing health coverage2 Canada total excludes federal tax contributions. Please refer to the Total tax contribution section of Canadian Life and Health Insurance Facts, 2016 Edition.
Canadian investments3
Investments ($billions) 13 5 18 12 138 276 22 19 84 80 Long-term investments (%) 97 98 97 96 97 97 97 97 98 97
Investments by type (%) Corporate securities 33 30 35 36 27 35 25 38 41 33 Mortgage & real estate 5 3 13 7 11 13 10 8 17 17 Mutual funds 31 45 25 29 26 24 30 36 30 26 Provincial bonds 17 14 17 16 22 12 20 9 2 11 Municipal bonds 4 3 4 5 4 4 4 4 4 5 Federal bonds 2 2 2 1 3 5 5 1 1 3 Other 8 3 4 6 7 7 6 4 5 5 Total investments 100 100 100 100 100 100 100 100 100 100 3 Based on CLHIA estimates of direct and indirect Canadian investments
2
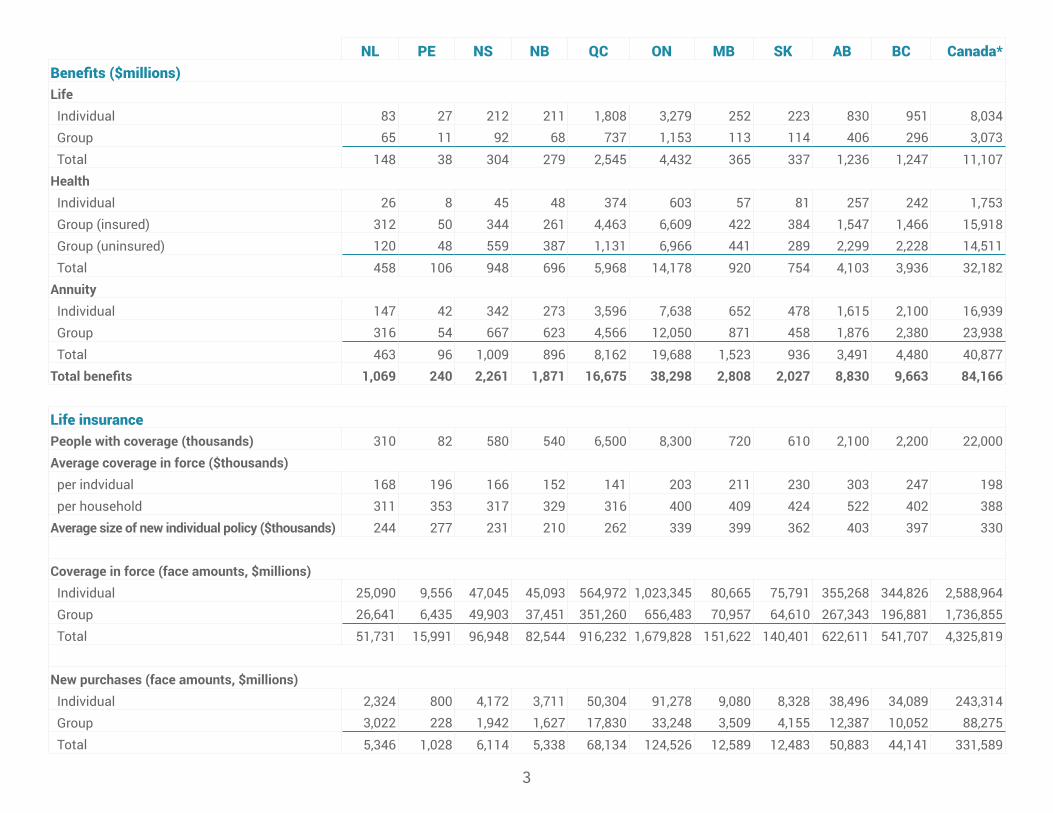
NL PE NS NB QC ON MB SK AB BC Canada*Benefits ($millions)Life Individual 83 27 212 211 1,808 3,279 252 223 830 951 8,034 Group 65 11 92 68 737 1,153 113 114 406 296 3,073 Total 148 38 304 279 2,545 4,432 365 337 1,236 1,247 11,107 Health Individual 26 8 45 48 374 603 57 81 257 242 1,753 Group (insured) 312 50 344 261 4,463 6,609 422 384 1,547 1,466 15,918 Group (uninsured) 120 48 559 387 1,131 6,966 441 289 2,299 2,228 14,511 Total 458 106 948 696 5,968 14,178 920 754 4,103 3,936 32,182 Annuity Individual 147 42 342 273 3,596 7,638 652 478 1,615 2,100 16,939 Group 316 54 667 623 4,566 12,050 871 458 1,876 2,380 23,938 Total 463 96 1,009 896 8,162 19,688 1,523 936 3,491 4,480 40,877 Total benefits 1,069 240 2,261 1,871 16,675 38,298 2,808 2,027 8,830 9,663 84,166
Life insurancePeople with coverage (thousands) 310 82 580 540 6,500 8,300 720 610 2,100 2,200 22,000Average coverage in force ($thousands) per indvidual 168 196 166 152 141 203 211 230 303 247 198 per household 311 353 317 329 316 400 409 424 522 402 388 Average size of new individual policy ($thousands) 244 277 231 210 262 339 399 362 403 397 330
Coverage in force (face amounts, $millions) Individual 25,090 9,556 47,045 45,093 564,972 1,023,345 80,665 75,791 355,268 344,826 2,588,964 Group 26,641 6,435 49,903 37,451 351,260 656,483 70,957 64,610 267,343 196,881 1,736,855 Total 51,731 15,991 96,948 82,544 916,232 1,679,828 151,622 140,401 622,611 541,707 4,325,819
New purchases (face amounts, $millions) Individual 2,324 800 4,172 3,711 50,304 91,278 9,080 8,328 38,496 34,089 243,314 Group 3,022 228 1,942 1,627 17,830 33,248 3,509 4,155 12,387 10,052 88,275 Total 5,346 1,028 6,114 5,338 68,134 124,526 12,589 12,483 50,883 44,141 331,589
3
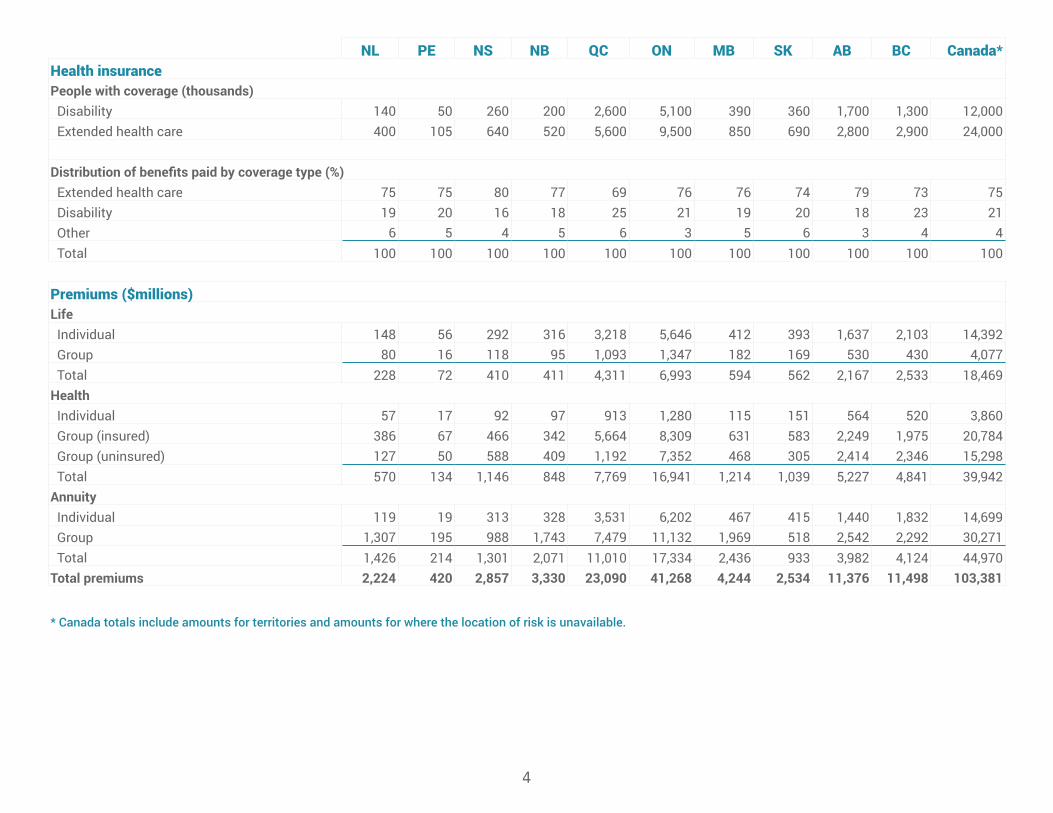
NL PE NS NB QC ON MB SK AB BC Canada*Health insurancePeople with coverage (thousands) Disability 140 50 260 200 2,600 5,100 390 360 1,700 1,300 12,000 Extended health care 400 105 640 520 5,600 9,500 850 690 2,800 2,900 24,000
Distribution of benefits paid by coverage type (%) Extended health care 75 75 80 77 69 76 76 74 79 73 75 Disability 19 20 16 18 25 21 19 20 18 23 21 Other 6 5 4 5 6 3 5 6 3 4 4 Total 100 100 100 100 100 100 100 100 100 100 100
Premiums ($millions)Life Individual 148 56 292 316 3,218 5,646 412 393 1,637 2,103 14,392 Group 80 16 118 95 1,093 1,347 182 169 530 430 4,077 Total 228 72 410 411 4,311 6,993 594 562 2,167 2,533 18,469 Health Individual 57 17 92 97 913 1,280 115 151 564 520 3,860 Group (insured) 386 67 466 342 5,664 8,309 631 583 2,249 1,975 20,784 Group (uninsured) 127 50 588 409 1,192 7,352 468 305 2,414 2,346 15,298 Total 570 134 1,146 848 7,769 16,941 1,214 1,039 5,227 4,841 39,942 Annuity Individual 119 19 313 328 3,531 6,202 467 415 1,440 1,832 14,699 Group 1,307 195 988 1,743 7,479 11,132 1,969 518 2,542 2,292 30,271 Total 1,426 214 1,301 2,071 11,010 17,334 2,436 933 3,982 4,124 44,970 Total premiums 2,224 420 2,857 3,330 23,090 41,268 4,244 2,534 11,376 11,498 103,381
* Canada totals include amounts for territories and amounts for where the location of risk is unavailable.
4
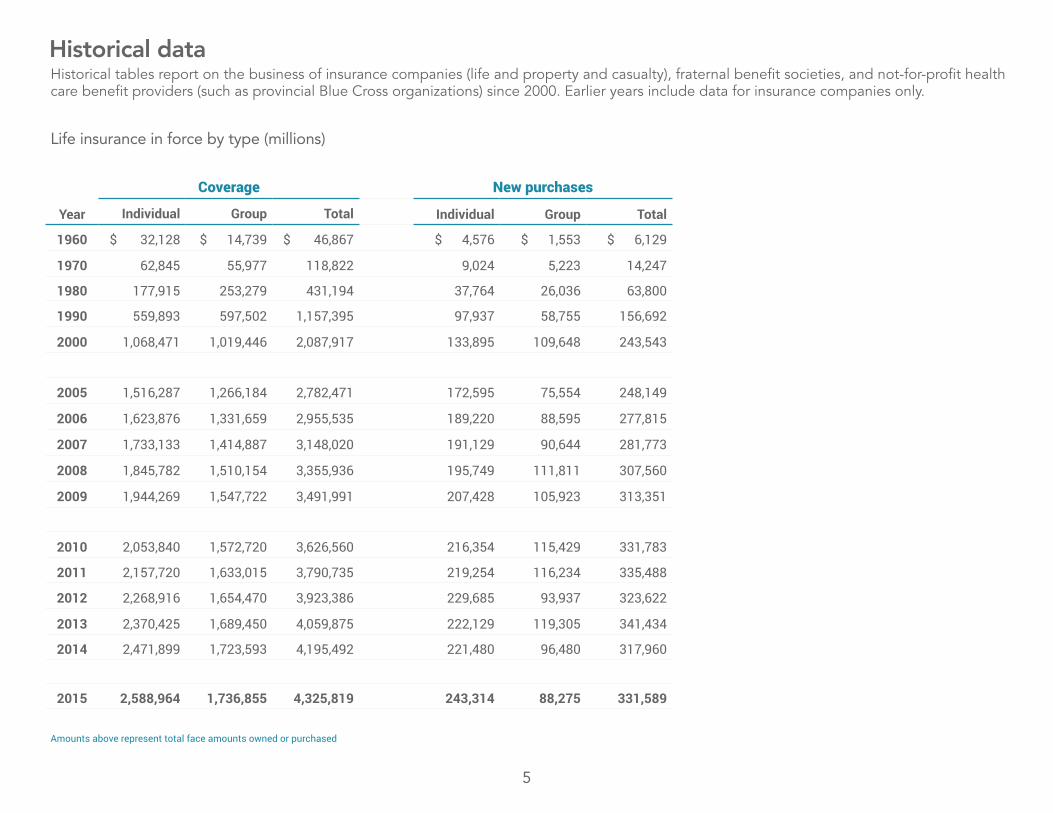
Life insurance in force by type (millions)
Year
Coverage New purchases
Individual Group Total Individual Group Total
1960 $ 32,128 $ 14,739 $ 46,867 $ 4,576 $ 1,553 $ 6,129
1970 62,845 55,977 118,822 9,024 5,223 14,247
1980 177,915 253,279 431,194 37,764 26,036 63,800
1990 559,893 597,502 1,157,395 97,937 58,755 156,692
2000 1,068,471 1,019,446 2,087,917 133,895 109,648 243,543
2005 1,516,287 1,266,184 2,782,471 172,595 75,554 248,149
2006 1,623,876 1,331,659 2,955,535 189,220 88,595 277,815
2007 1,733,133 1,414,887 3,148,020 191,129 90,644 281,773
2008 1,845,782 1,510,154 3,355,936 195,749 111,811 307,560
2009 1,944,269 1,547,722 3,491,991 207,428 105,923 313,351
2010 2,053,840 1,572,720 3,626,560 216,354 115,429 331,783
2011 2,157,720 1,633,015 3,790,735 219,254 116,234 335,488
2012 2,268,916 1,654,470 3,923,386 229,685 93,937 323,622
2013 2,370,425 1,689,450 4,059,875 222,129 119,305 341,434
2014 2,471,899 1,723,593 4,195,492 221,480 96,480 317,960
2015 2,588,964 1,736,855 4,325,819 243,314 88,275 331,589
Amounts above represent total face amounts owned or purchased
Historical dataHistorical tables report on the business of insurance companies (life and property and casualty), fraternal benefit societies, and not-for-profit health care benefit providers (such as provincial Blue Cross organizations) since 2000. Earlier years include data for insurance companies only.
5
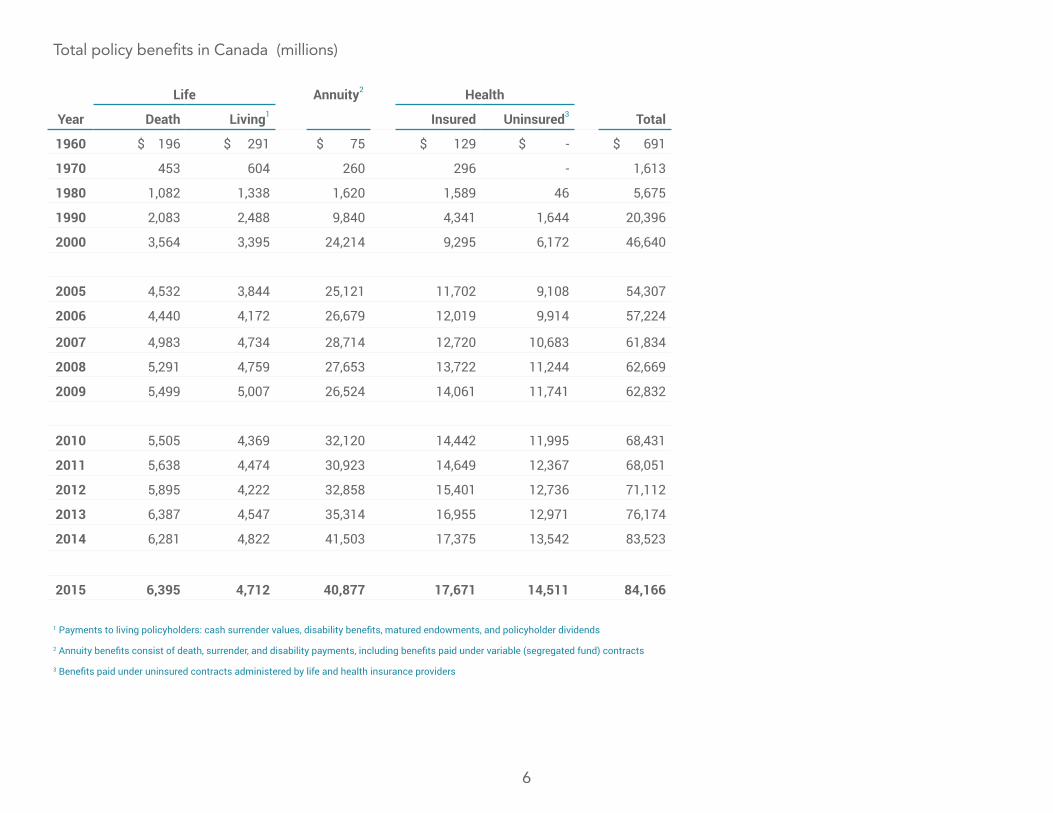
Total policy benefits in Canada (millions)
Year
Life Annuity2 Health
TotalDeath Living1 Insured Uninsured3
1960 $ 196 $ 291 $ 75 $ 129 $ - $ 691
1970 453 604 260 296 - 1,613
1980 1,082 1,338 1,620 1,589 46 5,675
1990 2,083 2,488 9,840 4,341 1,644 20,396
2000 3,564 3,395 24,214 9,295 6,172 46,640
2005 4,532 3,844 25,121 11,702 9,108 54,307
2006 4,440 4,172 26,679 12,019 9,914 57,224
2007 4,983 4,734 28,714 12,720 10,683 61,834
2008 5,291 4,759 27,653 13,722 11,244 62,669
2009 5,499 5,007 26,524 14,061 11,741 62,832
2010 5,505 4,369 32,120 14,442 11,995 68,431
2011 5,638 4,474 30,923 14,649 12,367 68,051
2012 5,895 4,222 32,858 15,401 12,736 71,112
2013 6,387 4,547 35,314 16,955 12,971 76,174
2014 6,281 4,822 41,503 17,375 13,542 83,523
2015 6,395 4,712 40,877 17,671 14,511 84,166
1 Payments to living policyholders: cash surrender values, disability benefits, matured endowments, and policyholder dividends
2 Annuity benefits consist of death, surrender, and disability payments, including benefits paid under variable (segregated fund) contracts
3 Benefits paid under uninsured contracts administered by life and health insurance providers
6
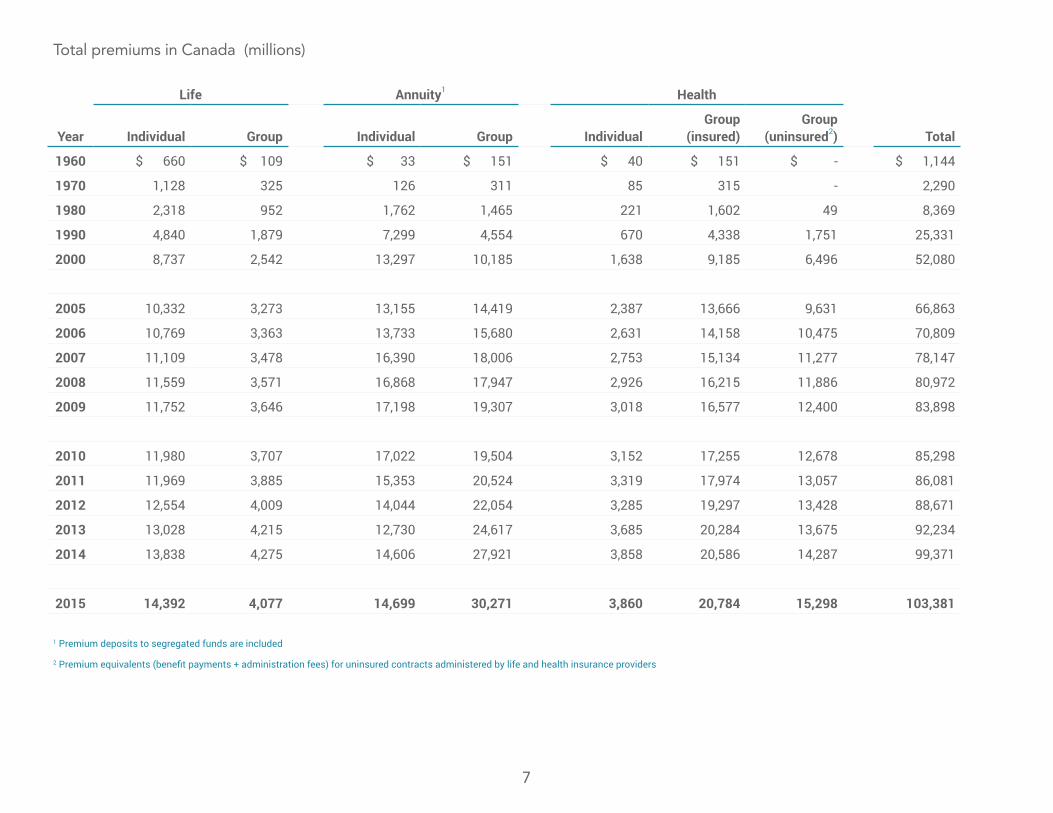
Total premiums in Canada (millions)
Year
Life Annuity1 Health
TotalIndividual Group Individual Group Individual Group
(insured) Group
(uninsured2)
1960 $ 660 $ 109 $ 33 $ 151 $ 40 $ 151 $ - $ 1,144
1970 1,128 325 126 311 85 315 - 2,290
1980 2,318 952 1,762 1,465 221 1,602 49 8,369
1990 4,840 1,879 7,299 4,554 670 4,338 1,751 25,331
2000 8,737 2,542 13,297 10,185 1,638 9,185 6,496 52,080
2005 10,332 3,273 13,155 14,419 2,387 13,666 9,631 66,863
2006 10,769 3,363 13,733 15,680 2,631 14,158 10,475 70,809
2007 11,109 3,478 16,390 18,006 2,753 15,134 11,277 78,147
2008 11,559 3,571 16,868 17,947 2,926 16,215 11,886 80,972
2009 11,752 3,646 17,198 19,307 3,018 16,577 12,400 83,898
2010 11,980 3,707 17,022 19,504 3,152 17,255 12,678 85,298
2011 11,969 3,885 15,353 20,524 3,319 17,974 13,057 86,081
2012 12,554 4,009 14,044 22,054 3,285 19,297 13,428 88,671
2013 13,028 4,215 12,730 24,617 3,685 20,284 13,675 92,234
2014 13,838 4,275 14,606 27,921 3,858 20,586 14,287 99,371
2015 14,392 4,077 14,699 30,271 3,860 20,784 15,298 103,381
1 Premium deposits to segregated funds are included
2 Premium equivalents (benefit payments + administration fees) for uninsured contracts administered by life and health insurance providers
7
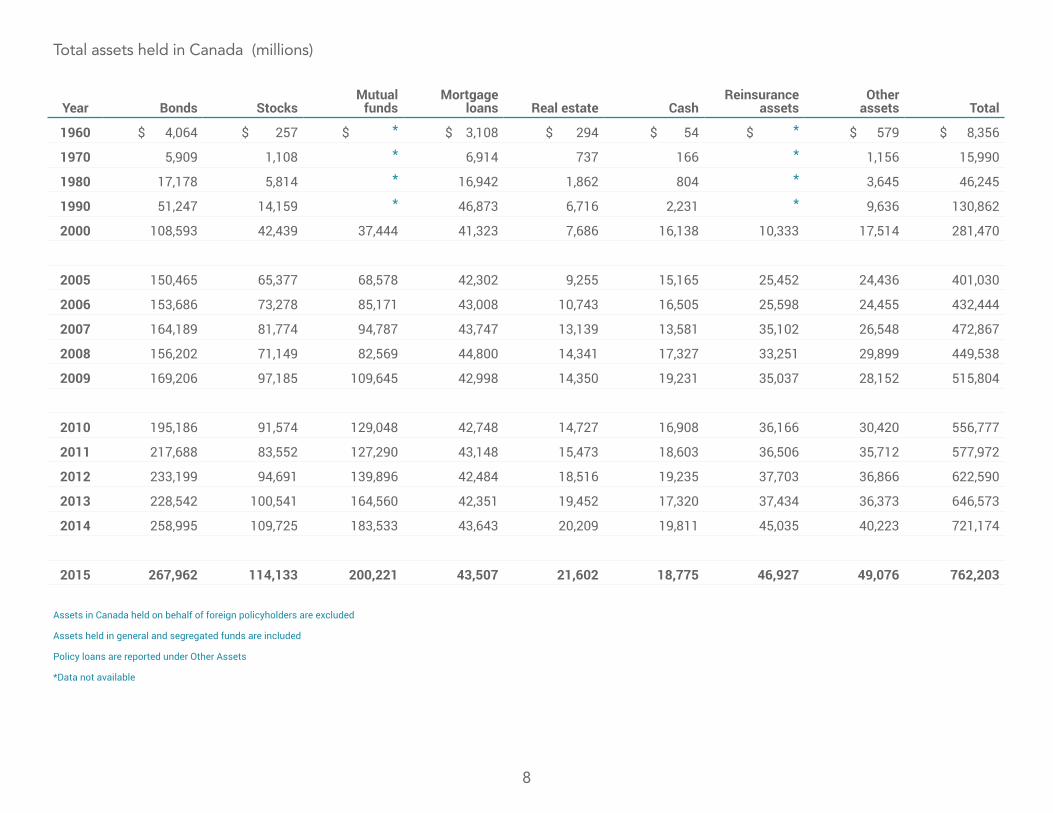
Total assets held in Canada (millions)
Year Bonds Stocks Mutual funds
Mortgage loans Real estate Cash
Reinsurance assets
Other assets Total
1960 $ 4,064 $ 257 $ * $ 3,108 $ 294 $ 54 $ * $ 579 $ 8,356
1970 5,909 1,108 * 6,914 737 166 * 1,156 15,990
1980 17,178 5,814 * 16,942 1,862 804 * 3,645 46,245
1990 51,247 14,159 * 46,873 6,716 2,231 * 9,636 130,862
2000 108,593 42,439 37,444 41,323 7,686 16,138 10,333 17,514 281,470
2005 150,465 65,377 68,578 42,302 9,255 15,165 25,452 24,436 401,030
2006 153,686 73,278 85,171 43,008 10,743 16,505 25,598 24,455 432,444
2007 164,189 81,774 94,787 43,747 13,139 13,581 35,102 26,548 472,867
2008 156,202 71,149 82,569 44,800 14,341 17,327 33,251 29,899 449,538
2009 169,206 97,185 109,645 42,998 14,350 19,231 35,037 28,152 515,804
2010 195,186 91,574 129,048 42,748 14,727 16,908 36,166 30,420 556,777
2011 217,688 83,552 127,290 43,148 15,473 18,603 36,506 35,712 577,972
2012 233,199 94,691 139,896 42,484 18,516 19,235 37,703 36,866 622,590
2013 228,542 100,541 164,560 42,351 19,452 17,320 37,434 36,373 646,573
2014 258,995 109,725 183,533 43,643 20,209 19,811 45,035 40,223 721,174
2015 267,962 114,133 200,221 43,507 21,602 18,775 46,927 49,076 762,203
Assets in Canada held on behalf of foreign policyholders are excluded
Assets held in general and segregated funds are included
Policy loans are reported under Other Assets
*Data not available
8
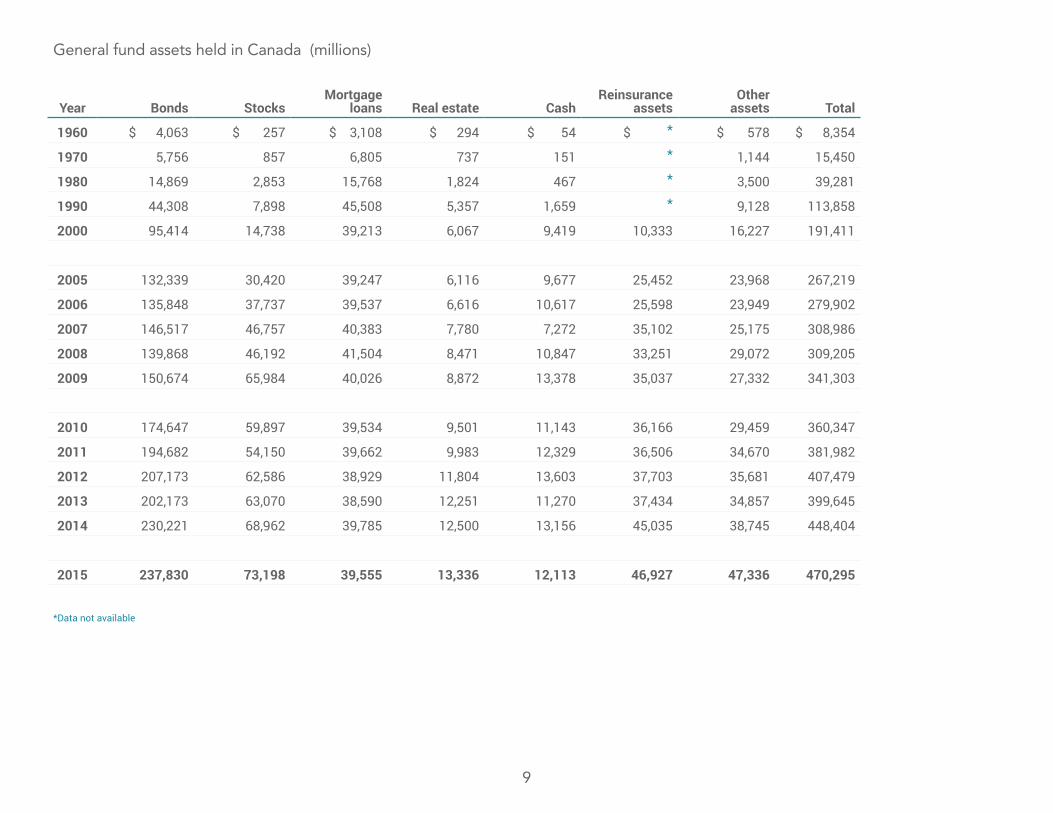
General fund assets held in Canada (millions)
Year Bonds StocksMortgage
loans Real estate CashReinsurance
assetsOther
assets Total
1960 $ 4,063 $ 257 $ 3,108 $ 294 $ 54 $ * $ 578 $ 8,354
1970 5,756 857 6,805 737 151 * 1,144 15,450
1980 14,869 2,853 15,768 1,824 467 * 3,500 39,281
1990 44,308 7,898 45,508 5,357 1,659 * 9,128 113,858
2000 95,414 14,738 39,213 6,067 9,419 10,333 16,227 191,411
2005 132,339 30,420 39,247 6,116 9,677 25,452 23,968 267,219
2006 135,848 37,737 39,537 6,616 10,617 25,598 23,949 279,902
2007 146,517 46,757 40,383 7,780 7,272 35,102 25,175 308,986
2008 139,868 46,192 41,504 8,471 10,847 33,251 29,072 309,205
2009 150,674 65,984 40,026 8,872 13,378 35,037 27,332 341,303
2010 174,647 59,897 39,534 9,501 11,143 36,166 29,459 360,347
2011 194,682 54,150 39,662 9,983 12,329 36,506 34,670 381,982
2012 207,173 62,586 38,929 11,804 13,603 37,703 35,681 407,479
2013 202,173 63,070 38,590 12,251 11,270 37,434 34,857 399,645
2014 230,221 68,962 39,785 12,500 13,156 45,035 38,745 448,404
2015 237,830 73,198 39,555 13,336 12,113 46,927 47,336 470,295
*Data not available
9
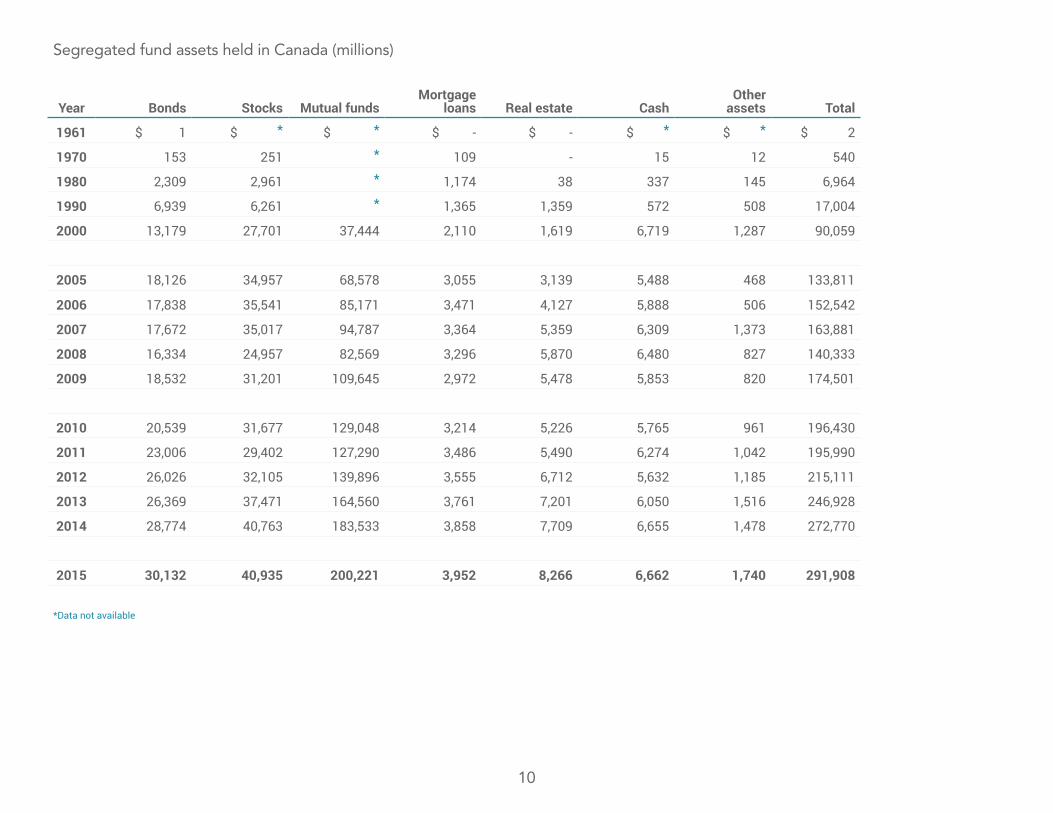
Segregated fund assets held in Canada (millions)
Year Bonds Stocks Mutual fundsMortgage
loans Real estate CashOther
assets Total
1961 $ 1 $ * $ * $ - $ - $ * $ * $ 2
1970 153 251 * 109 - 15 12 540
1980 2,309 2,961 * 1,174 38 337 145 6,964
1990 6,939 6,261 * 1,365 1,359 572 508 17,004
2000 13,179 27,701 37,444 2,110 1,619 6,719 1,287 90,059
2005 18,126 34,957 68,578 3,055 3,139 5,488 468 133,811
2006 17,838 35,541 85,171 3,471 4,127 5,888 506 152,542
2007 17,672 35,017 94,787 3,364 5,359 6,309 1,373 163,881
2008 16,334 24,957 82,569 3,296 5,870 6,480 827 140,333
2009 18,532 31,201 109,645 2,972 5,478 5,853 820 174,501
2010 20,539 31,677 129,048 3,214 5,226 5,765 961 196,430
2011 23,006 29,402 127,290 3,486 5,490 6,274 1,042 195,990
2012 26,026 32,105 139,896 3,555 6,712 5,632 1,185 215,111
2013 26,369 37,471 164,560 3,761 7,201 6,050 1,516 246,928
2014 28,774 40,763 183,533 3,858 7,709 6,655 1,478 272,770
2015 30,132 40,935 200,221 3,952 8,266 6,662 1,740 291,908
*Data not available
10
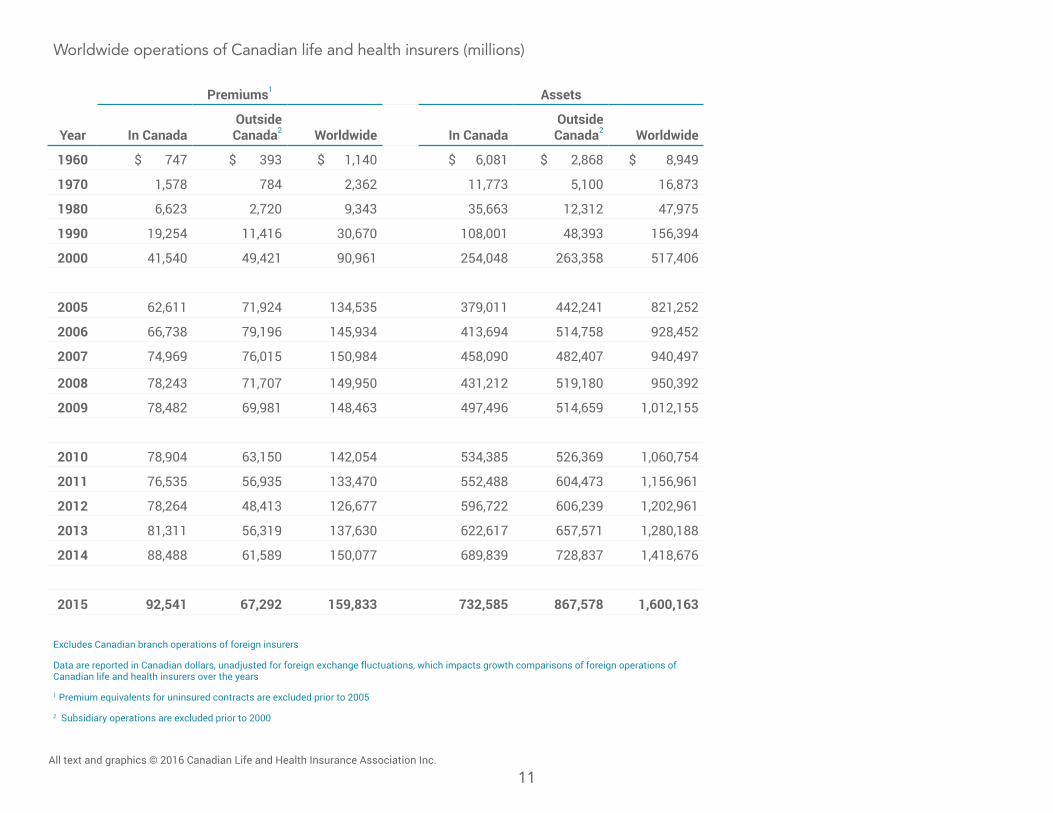
Worldwide operations of Canadian life and health insurers (millions)
Year
Premiums1 Assets
In CanadaOutside Canada2 Worldwide In Canada
Outside Canada2 Worldwide
1960 $ 747 $ 393 $ 1,140 $ 6,081 $ 2,868 $ 8,949
1970 1,578 784 2,362 11,773 5,100 16,873
1980 6,623 2,720 9,343 35,663 12,312 47,975
1990 19,254 11,416 30,670 108,001 48,393 156,394
2000 41,540 49,421 90,961 254,048 263,358 517,406
2005 62,611 71,924 134,535 379,011 442,241 821,252
2006 66,738 79,196 145,934 413,694 514,758 928,452
2007 74,969 76,015 150,984 458,090 482,407 940,497
2008 78,243 71,707 149,950 431,212 519,180 950,392
2009 78,482 69,981 148,463 497,496 514,659 1,012,155
2010 78,904 63,150 142,054 534,385 526,369 1,060,754
2011 76,535 56,935 133,470 552,488 604,473 1,156,961
2012 78,264 48,413 126,677 596,722 606,239 1,202,961
2013 81,311 56,319 137,630 622,617 657,571 1,280,188
2014 88,488 61,589 150,077 689,839 728,837 1,418,676
2015 92,541 67,292 159,833 732,585 867,578 1,600,163
Excludes Canadian branch operations of foreign insurers
Data are reported in Canadian dollars, unadjusted for foreign exchange fluctuations, which impacts growth comparisons of foreign operations of Canadian life and health insurers over the years
1 Premium equivalents for uninsured contracts are excluded prior to 2005
2 Subsidiary operations are excluded prior to 2000
11All text and graphics © 2016 Canadian Life and Health Insurance Association Inc.