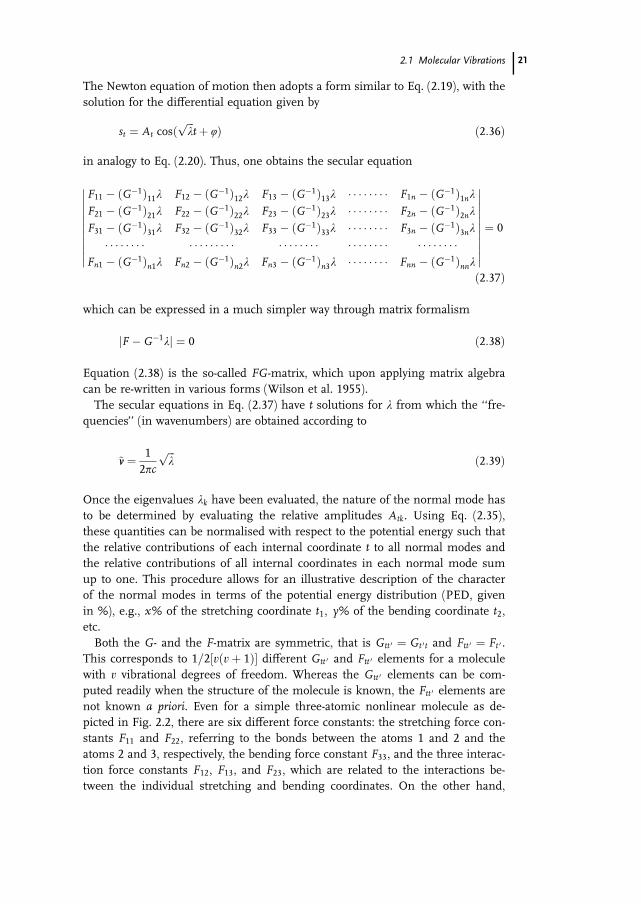
2 theory of infrared absorption and raman … theory of infrared absorption and raman spectroscopy...
TRANSCRIPT
2
Theory of Infrared Absorption and Raman
Spectroscopy
Molecular vibrations can be excited via two physical mechanisms: the absorption
of light quanta and the inelastic scattering of photons (Fig. 2.1) (Herzberg 1945).
Direct absorption of photons is achieved by irradiation of molecules with poly-
chromatic light that includes photons of energy matching the energy difference
hnk between two vibrational energy levels, the initial (i, e.g., ground state) and
the final ( f , e.g., first excited state) vibrational state.
hnk ¼ hnf � hni ð2:1Þ
As these energy differences are in the order of 0.5 and 0.005 eV, light with wave-
lengths longer than 2.5 mm, that is infrared (IR) light, is sufficient to induce the
vibrational transitions. Thus, vibrational spectroscopy that is based on the direct
absorption of light quanta is denoted as IR absorption or IR spectroscopy.
The physical basis of IR light absorption is very similar to light absorption in
the ultraviolet (UV)–visible (vis) range, which causes electronic transitions or
combined electronic–vibrational (vibronic) transitions. Thus, UV–vis absorption
spectroscopy can, in principle, also provide information about molecular vibra-
tions. However, for molecules in the condensed phase at ambient temperature,
the vibrational fine structure of the absorption spectra is only poorly resolved , if
at all, such that vibrational spectroscopy of biomolecules by light absorption is re-
stricted to the IR range.
11
Vibrational Spectroscopy in Life Science. Friedrich Siebert and Peter HildebrandtCopyright 8 2008 WILEY-VCH Verlag GmbH & Co. KGaA, WeinheimISBN: 978-3-527-40506-0
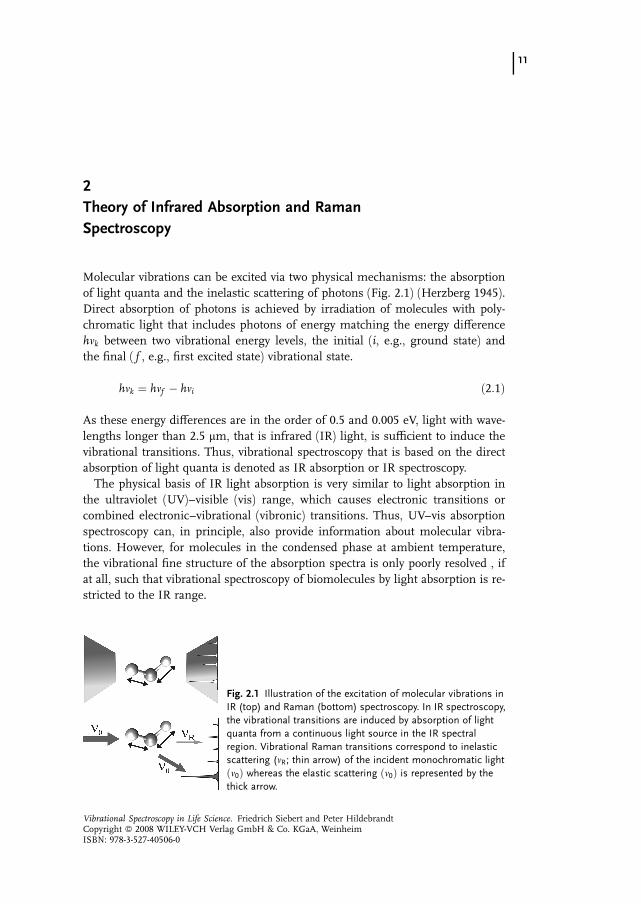
Fig. 2.1 Illustration of the excitation of molecular vibrations in
IR (top) and Raman (bottom) spectroscopy. In IR spectroscopy,
the vibrational transitions are induced by absorption of light
quanta from a continuous light source in the IR spectral
region. Vibrational Raman transitions correspond to inelastic
scattering (nR; thin arrow) of the incident monochromatic light
ðn0Þ whereas the elastic scattering ðn0Þ is represented by the
thick arrow.
In contrast to IR spectroscopy, the scattering mechanism for exciting molecular
vibrations requires monochromatic irradiation. A portion of the incident photons
is scattered inelastically such that the energy of the scattered photons ðhnRÞ dif-fers from that of the incident photons ðhn0Þ. According to the law of conversation
of energy, the energy difference corresponds to the energy change of the mole-
cule, which refers to the transition between two vibrational states. Thus, the en-
ergy differences
hn0 � hnR ¼ hnf � hni ð2:2Þ
lie in the same range as the transitions probed by the direct absorption of mid-IR
quanta, although photons of UV, visible, or near-infrared light are used to induce
scattering. This inelastic scattering of photons was first discovered by the Indian
scientist C. V. Raman in 1928 and is thus denoted as the Raman effect.
Vibrational transitions may be associated with rotational transitions that can
only be resolved in high resolution spectra of molecules in the gas phase and is,
therefore, not relevant for the vibrational spectroscopy of biomolecules. Thus,
vibration–rotation spectra will not be treated in this book.
Depending on the molecule, the same or different vibrational transitions are
probed in IR and Raman spectroscopy and both techniques provide complemen-
tary information in many instances. Hence, IR and Raman spectra are usually
plotted in an analogous way to facilitate comparison. The ordinate refers to the
extent of the absorbed (IR) or scattered (Raman) light. In IR absorption spectros-
copy, the amount of absorbed light is expressed in units of absorbance or, albeit
physically less correct but frequently used, in terms of the optical density. In
contrast, Raman intensities are measured in terms of counts per second, i.e., of
photons detected per second. As this value depends on many apparatus-specific
parameters, in most instances only relative intensities represent physically mean-
ingful quantities. Thus, the Raman intensity scale is typically expressed in terms
of arbitrary units or the scale is even omitted. The energy of the vibrational tran-
sition, expressed in terms of wavenumbers (cm�1), is given on the abscissa,
corresponding to the frequency of the absorbed light nabs in IR spectroscopy and
to the frequency difference between the exciting and scattered light, n0 � nR, in
Raman spectroscopy.
The principle sources of information in vibrational spectroscopy are the ener-
gies of the vibrational transitions and the strength of their interaction with the
IR or UV–vis radiation, i.e., the band intensities. Classical mechanics constitutes
the basis for describing the relationship between vibrational frequencies and the
molecular structure and force fields whereas quantum mechanics is indispens-
able for understanding the transition probabilities and thus the intensities of vi-
brational bands in the IR or Raman spectra.
2.1
Molecular Vibrations
As the starting point for introducing the concept of harmonic vibrations, it is in-
structive to consider molecules as an array of point masses that are connected
12 2 Theory of Infrared Absorption and Raman Spectroscopy

with each other by mass-less springs representing the intramolecular interactions
between the atoms (Wilson et al. 1955). The simplest case is given by two masses,
mA and mB, corresponding to a diatomic molecule A–B. Upon displacement of
the spheres along the x-axis from the equilibrium position by Dx, a restoring
force Fx acts on the spheres, which according to Hooke’s law, is given by
Fx ¼ �f Dx ð2:3Þ
Here f is the spring or force constant, which is a measure of the rigidity of the
spring, that is, the strength of the bond. The potential energy V then depends on
the square of the displacement from the equilibrium position
V ¼ 1
2f Dx2 ð2:4Þ
For the kinetic energy T of the oscillating motion one obtains
T ¼ 1
2mðD _xxÞ2 ð2:5Þ
where m is the reduced mass defined by
m ¼ mA �mB
mA þmBð2:6Þ
Because of the conservation of energy, the sum of V and Tmust be constant, such
that the sum of the first derivatives of V and T is equal to zero, as expressed by
Eq. (2.7):
0 ¼ dT
dtþ dV
dt¼ 1
2
dðD _xx2Þdt
þ 1
2fdðDx2Þ
dtð2:7Þ
which eventually leads to the Newton equation of motion
d2Dx
dt2þ f
mDx ¼ 0 ð2:8Þ
Equation (2.8) represents the differential equation for a harmonic motion with
the solution given by a sine or cosine function, i.e.,
Dx ¼ A � cosðotþ jÞ ð2:9Þ
where A, o, and j are the amplitude, circular frequency, and phase, respectively.
Combining Eq. (2.9) with its second derivative one obtains
d2Dx
dt2þ o2Dx ¼ 0 ð2:10Þ
2.1 Molecular Vibrations 13

such that comparison with Eq. (2.8) yields
o ¼
ffiffiffiffif
m
sð2:11Þ
Equation (2.11) describes what one intuitively expects: the circular frequency of
the harmonic vibration increases when the rigidity of the spring (or the strength
of the bond) increases but decreases with increasing masses of the spheres. In
order to express the circular frequency in wavenumbers (in cm�1), Eq. (2.11) has
to be divided by 2pc (with c given in cm s�1):
~nn ¼ 1
2pc
ffiffiffiffif
m
sð2:12Þ
In contrast to the straightforward treatment of a two-body system, including a
third sphere corresponding to a triatomic molecule clearly represents a concep-
tual challenge (Wilson et al. 1955). Let us consider a bent molecule such as H2O
as an example (Fig. 2.2). Following the same strategy as for the diatomic mole-
cule, we analyse the displacements of the individual atoms in terms of the restor-
ing forces. There are two questions to be answered. (a) What are the displace-
ments that lead to vibrations? (b) Are all possible displacements allowed?
In the Cartesian coordinate system, each atom can be displaced in the x-, y-,and z-directions, corresponding to three degrees of freedom. Thus, a molecule of
N atoms ðaÞ has in total 3N degrees of freedom, but not all of them correspond
to vibrational degrees of freedom. If all atoms are displaced in the x-, y-, and z-directions by the same increments, the entire molecule moves in a certain direc-
tion, representing one of the three translational degrees of freedom. Furthermore,
one can imagine displacements of the atoms that correspond to the rotation of
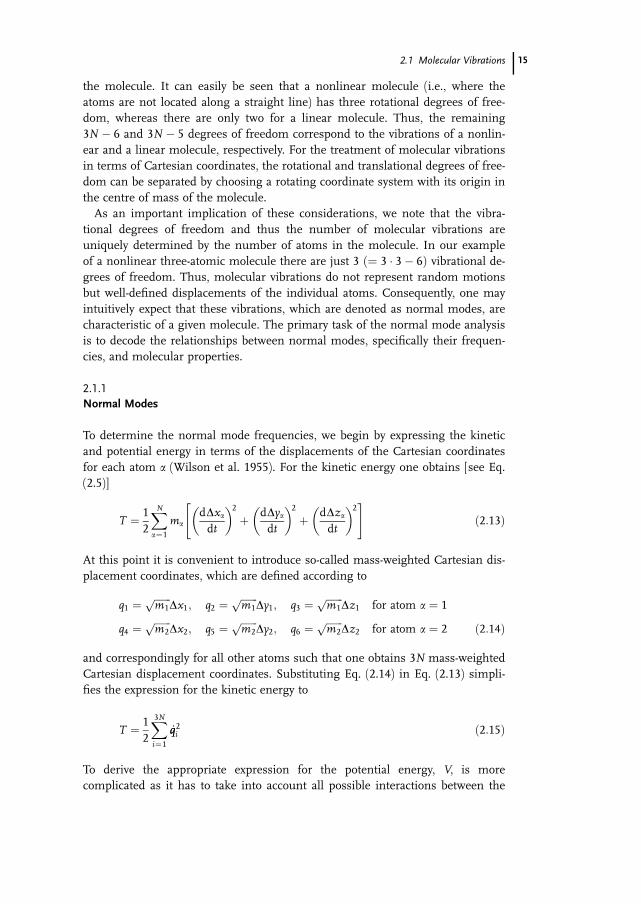
Fig. 2.2 Illustration of the vibrating H2O molecule represented by
spheres that are connected via springs of different strengths. The
tighter springs linking the large sphere (oxygen) with each of the small
spheres (hydrogen) symbolises the chemical bonds between two atoms,
whereas the looser spring refers to weaker interactions between two
atoms that are not connected via a chemical bond.
14 2 Theory of Infrared Absorption and Raman Spectroscopy
the molecule. It can easily be seen that a nonlinear molecule (i.e., where the
atoms are not located along a straight line) has three rotational degrees of free-
dom, whereas there are only two for a linear molecule. Thus, the remaining
3N � 6 and 3N � 5 degrees of freedom correspond to the vibrations of a nonlin-
ear and a linear molecule, respectively. For the treatment of molecular vibrations
in terms of Cartesian coordinates, the rotational and translational degrees of free-
dom can be separated by choosing a rotating coordinate system with its origin in
the centre of mass of the molecule.
As an important implication of these considerations, we note that the vibra-
tional degrees of freedom and thus the number of molecular vibrations are
uniquely determined by the number of atoms in the molecule. In our example
of a nonlinear three-atomic molecule there are just 3 ð¼ 3 � 3� 6Þ vibrational de-grees of freedom. Thus, molecular vibrations do not represent random motions
but well-defined displacements of the individual atoms. Consequently, one may
intuitively expect that these vibrations, which are denoted as normal modes, are
characteristic of a given molecule. The primary task of the normal mode analysis
is to decode the relationships between normal modes, specifically their frequen-
cies, and molecular properties.
2.1.1
Normal Modes
To determine the normal mode frequencies, we begin by expressing the kinetic
and potential energy in terms of the displacements of the Cartesian coordinates
for each atom a (Wilson et al. 1955). For the kinetic energy one obtains [see Eq.
(2.5)]
T ¼ 1
2
XNa¼1
ma
dDxadt
� �2þ dDya
dt
� �2þ dDza
dt
� �2" #ð2:13Þ
At this point it is convenient to introduce so-called mass-weighted Cartesian dis-
placement coordinates, which are defined according to
q1 ¼ffiffiffiffiffiffiffim1p
Dx1; q2 ¼ffiffiffiffiffiffiffim1p
Dy1; q3 ¼ffiffiffiffiffiffiffim1p
Dz1 for atom a ¼ 1
q4 ¼ffiffiffiffiffiffiffim2p
Dx2; q5 ¼ffiffiffiffiffiffiffim2p
Dy2; q6 ¼ffiffiffiffiffiffiffim2p
Dz2 for atom a ¼ 2 ð2:14Þ
and correspondingly for all other atoms such that one obtains 3N mass-weighted
Cartesian displacement coordinates. Substituting Eq. (2.14) in Eq. (2.13) simpli-
fies the expression for the kinetic energy to
T ¼ 1
2
X3Ni¼1
_qq2i ð2:15Þ
To derive the appropriate expression for the potential energy, V, is more
complicated as it has to take into account all possible interactions between the
2.1 Molecular Vibrations 15
individual atoms, which primarily include the bonding interactions but also non-
bonding (electrostatic, van-der-Waals) interactions. For the three-atomic water
molecule in Fig. 2.2 this implies that the displacement of one hydrogen atom de-
pends on the attractive and repulsive forces of both the central oxygen and the
second hydrogen atom. Within the framework of the sphere–spring model we
therefore also have to connect both hydrogen ‘‘spheres’’ via a spring which, how-
ever, is less rigid than those connecting the hydrogen spheres with the oxygen.
It is convenient to expand the potential energy in a Taylor series in terms of the
displacement coordinates Dxi, Dyi, Dzi, which can be also expressed in terms of
the coordinates qi defined in Eq. (2.14).
V ¼ V0 þX3Ni¼1
qV
qqi
� �0
qi þ1
2
X3Ni; j¼1
q2V
qqiqq j
� �0
qiq j þ � � � � � ð2:16Þ
The first term refers to the potential energy at equilibrium, which we can set
equal to zero as we are interested in changes to V brought about by displace-
ments of the individual atoms. At equilibrium, infinitesimal changes in qi donot cause a change in V, such that the second term is also zero. For small dis-
placements qi within the harmonic approximation, higher order terms can be ne-
glected, such that Eq. (2.16) is simplified to
V G1
2
X3Ni; j¼1
q2V
qqiqq j
� �0
¼ 1
2
X3Ni; j¼1
fijqiq j ð2:17Þ
where fij are the force constants.
In books on classical mechanics it is shown that, in the absence of external and
non-conservative forces, Newton’s equations of motion can be written in the fol-
lowing form:
d
dt
qT
q _qq jþ qV
qq j¼ 0 ð2:18Þ
which yields
€qq j þX3Ni¼1
fijqi ¼ 0 ð2:19Þ
Equation (2.19) is equivalent to Eq. (2.10) for the diatomic harmonic oscillator, ex-
cept that it represents not just one but a set of 3N linear second-order differential
equations for which we can write the general solution, in analogy to Eq. (2.9),
qi ¼ Ai cosðffiffiffilp
tþ jÞ ð2:20Þ
16 2 Theory of Infrared Absorption and Raman Spectroscopy

Inserting Eq. (2.20) into Eq. (2.19) yields
�AjlþX3Ni¼1
fijAi ¼ 0 ð2:21Þ
which corresponds to 3N linear equations for Aj. These equations only have a so-
lution different from zero if the 3N � 3N determinant vanishes (secular equation):
f11 � l f12 f13 � � � � � � � � f1; 3Nf21 f22 � l f23 � � � � � � � � f2; 3Nf31 f32 f33 � l � � � � � � � � f3; 3N
� � � � � � � � � � � � � � � � � � � � � � � � � � � � � � � � � � � � � � � � �f3N; 1 f3N; 2 f3N; 3 � � � � � � � � f3N; 3N � l
������������
������������¼ 0 ð2:22Þ
There are 3N solutions for l corresponding to 3N frequencies l1=2. As the sum-
mation has been made over all 3N degrees of freedom, 6 (5) of these solutions
refer to translational and rotational motions of the nonlinear (linear) molecules
and, therefore, must be zero. Thus, Eq. (2.22) yields only 3N � 6 ð3N � 5Þ non-zero values for l. The proof for this is lengthy and is not shown here (Wilson
et al. 1955). The non-zero solutions correspond to the so-called normal modes.
Once the individual lk values have been determined, the amplitudes Ai for
each normal mode have to be determined on the basis of in Eq. (2.21).
ð f11 � lkÞA1k þ f12A2k þ � � � � � � � � þ f1; 3NA3N; k ¼ 0
f21A1k þ ð f22 � lkÞA2k þ � � � � � � � � þ f2; 3NA3N; k ¼ 0
� � � � � � � � � � � � � � � � � � � � � � � � � � � � � � � � � � � � � � � � � � � � � � � � � � �
f3N; 1A1k þ f3N; 2 þ � � � � � � � � þ ð f3N; 3N � lkÞA3N; k ¼ 0
ð2:23Þ
As Eq. (2.23) represents a set of homogeneous equations, only relative amplitudes
can be obtained and a normalisation is required, as will be discussed below. The
amplitudes Aik describe the character of a normal mode as they quantify the dis-
placements of each atom i in each normal mode k. Eqs. (2.20 and 2.23) imply that
in a given normal mode k all atoms vibrate in-phase and with the same frequency
ðlkÞ1=2, but with different amplitudes. Thus, it is always an approximation, albeit
a useful one in many instances, to characterise normal modes of polyatomic mole-
cules in terms of specific group vibrations, i.e., if only one coordinate dominates
the normal mode.
Although the treatment of normal modes in the Cartesian coordinate system is
straightforward, it has the disadvantage of distributing all information for a given
normal mode among 3N equations. In particular, for describing probabilities of
vibrational transitions [see Eq. (2.2)] a more compact presentation is desirable.
For this purpose, the mass-weighted Cartesian coordinates qi are converted into
normal coordinates Qk via an orthogonal transformation according to
2.1 Molecular Vibrations 17
Qk ¼X3Ni¼1
l ikqi ð2:24Þ
The transformation coefficients l ik are chosen such that T and V, expressed as a
function of Qk, adopt the same form as Eqs. (2.15 and 2.16) and the potential en-
ergy does not depend on cross products Qk �Qk 0 (with k0 k 0). The solution of
Newton’s equation of motion thus leads to
Qk ¼ Kk cosðffiffiffiffiffilk
ptþ jkÞ ð2:25Þ
with arbitrary values of Kk and jk. The representation of molecular vibrations in
normal coordinates is particularly important for the quantum mechanical treat-
ment of the harmonic oscillator (Box 2A).
2.1.2
Internal Coordinates
The normal coordinate system is, mathematically, a very convenient system and,
moreover, is required for the quantum chemical treatment of vibrational transi-
tions. However, it is not a very illustrative system as molecular vibrations are usu-
ally imagined in terms of stretching or bending motions of molecules or parts of
molecules. Such motions cannot be intuitively deduced from a normal coordinate
or the array of mass-weighted Cartesian coordinates (Wilson et al. 1955). It is,
therefore, desirable to introduce a coordinate system that is based on ‘‘structural
elements’’ of molecules, such as bond lengths and angles, and torsional and out-
of-plane angles. These so-called internal coordinates are derived from Cartesian
displacement coordinates ðDxa;Dya;DzaÞ on the basis of the geometry of the mole-
cule.
The displacement of each atom a is defined by the vector ~rraðDxa;Dya;DzaÞ,which is related to the internal coordinate St according to
St ¼XNa¼1
~ssta �~rra ð2:26Þ
The vector~ssta is chosen such that it points in the direction of the largest displace-
ment of~rra corresponding to the greatest increase in St. This statement is best il-
lustrated on the basis of the most simple internal coordinate, the bond stretching
coordinate (Fig. 2.3). A stretching coordinate is defined by two atoms ða ¼ 1; 2Þ.Thus, for this coordinate the displacement of all other atoms is zero and the
sum in Eq. (2.26) only refers to two terms. The largest displacement from the
equilibrium positions occur along the axis of the bond assumed to be the x-axis
but in opposite directions for atom 1 and 2. Expressing ~sst1 and~sst2 in terms of
unit vectors we thus obtain
~sst1 ¼~ee21 ¼ �~ee12 and ~sst2 ¼~ee12 ð2:27Þ
18 2 Theory of Infrared Absorption and Raman Spectroscopy

According to Eq. (2.26), the bond stretching coordinate Ss is then given by
Ss ¼ Dx1 � Dx2 ð2:28Þ
For the valence angle bending coordinate Sb we have to consider three atoms
(Fig. 2.3). To achieve the largest contribution to Sb, the displacements of atoms 1
and 2 and thus~sst1 and~sst2 are perpendicular to the vectors defining the respective
bonds between the atoms 1 and 3 and 2 and 3. A unit (infinitesimal) displace-
ment of atom 1 along~sst1 increases f by the amount of 1=r31. Geometric consider-
ations then yield
~sst1 ¼~ee31 � cos f�~ee32
r31 � sin fð2:29Þ
and analogous expressions can be derived for~sst2 and~sst3.
~sst2 ¼~ee32 � cos f�~ee31
r32 � sin fð2:30Þ
~sst3 ¼½ðr31 � r32 cos fÞ~ee31 þ ðr32 � r31 cos fÞ~ee32�
r31r32 sin fð2:31Þ
Insertion of the Eqs. (2.29, 2.30, and 2.31) into Eq. (2.26) yields the internal coor-
dinate for the bending motion.
Further internal coordinates are the out-of-plane deformation and torsional co-
ordinates that refer to the angle between a bond and a plane and to a dihedral
angle, respectively. In both instances, four atoms are required to define these co-
ordinates (Wilson et al. 1955).
2.1.3
The FG-Matrix
For a molecule with 3N � 6 vibrational degrees of freedom, a complete set of in-
ternal coordinates includes 3N � 6 independent internal coordinates. The defini-
Fig. 2.3 Definition of internal coordinates: top, stretching
coordinate; and bottom, bending coordinate.
2.1 Molecular Vibrations 19

tion of this set is straightforward for small molecules such as the triatomic non-
linear molecule in Fig. 2.2, for which two bond stretching and one bond angle de-
formation coordinates are necessary and sufficient. However, with the increasing
size of the molecules, definition of the coordinate set becomes more and more
complicated. Thus, it is of particular importance to choose systematic strategies
for selection of the internal coordinates. Appropriate protocols have been pro-
posed in the literature, however, sorting out independent and dependent internal
coordinates may represent a challenge in many instances (Wilson et al. 1955; Fo-
garasi et al. 1992). Such redundancies appear in particular in ring systems and
have to be removed by appropriate boundary conditions a posteriori.The internal coordinates are independent of the masses of the atoms involved,
which are introduced by setting up the so-called G-matrix, which is derived in
Wilson et al. (1955). The elements of the G-matrix are given by
Gtt 0 ¼XNa¼1
ma~ssta �~sst 0a ð2:32Þ
where ma is the reciprocal mass of atom a.
The G-matrix now contains all the information on the chemical constitution
and the structure of the molecule. The elements Gtt 0 represent a t � t 0 matrix
with the number of internal coordinates t being equal to the number of vibra-
tional degrees of freedom. For a nonlinear three-atomic molecule (Fig. 2.2) the
G-matrix can be easily calculated using Eq. (2.32) on the basis of the~sst1 vectors
defined in Eqs. (2.27–2.31).
m1 þ m2 m3 cos f�m3 sin f
r32
m3 cos f m2 þ m3�m3 sin f
r31
�m3 sin f
r32
�m3 sin f
r31
m1
r 231þ m2
r 232� m3
1
r 231þ 1
r 232� 2 cos f
r31r32
!
��������������
��������������¼ G ð2:33Þ
In analogy to the treatment in the Cartesian and normal coordinate systems, the
next step is to derive expressions for the kinetic and potential energy in terms of
the internal coordinates (Wilson et al. 1955). The kinetic energy in terms of inter-
nal coordinates is given by
T ¼ 1
2
Xtt 0ðG�1Þtt 0 _SSt
_SSt 0 ð2:34Þ
where ðG�1Þtt 0 are the elements of the inverse G-matrix [Eq. (2.33)]. The expres-
sion for the potential energy is written as
V ¼ 1
2
Xtt 0
Ftt 0StSt 0 ð2:35Þ
20 2 Theory of Infrared Absorption and Raman Spectroscopy
The Newton equation of motion then adopts a form similar to Eq. (2.19), with the
solution for the differential equation given by
st ¼ At cosðffiffiffilp
tþ jÞ ð2:36Þ
in analogy to Eq. (2.20). Thus, one obtains the secular equation
F11 � ðG�1Þ11l F12 � ðG�1Þ12l F13 � ðG�1Þ13l � � � � � � � � F1n � ðG�1Þ1nlF21 � ðG�1Þ21l F22 � ðG�1Þ22l F23 � ðG�1Þ23l � � � � � � � � F2n � ðG�1Þ2nlF31 � ðG�1Þ31l F32 � ðG�1Þ32l F33 � ðG�1Þ33l � � � � � � � � F3n � ðG�1Þ3nl� � � � � � � � � � � � � � � � � � � � � � � � � � � � � � � � � � � � � � � � �
Fn1 � ðG�1Þn1l Fn2 � ðG�1Þn2l Fn3 � ðG�1Þn3l � � � � � � � � Fnn � ðG�1Þnnl
�����������
�����������¼ 0
ð2:37Þ
which can be expressed in a much simpler way through matrix formalism
jF �G�1lj ¼ 0 ð2:38Þ
Equation (2.38) is the so-called FG-matrix, which upon applying matrix algebra
can be re-written in various forms (Wilson et al. 1955).
The secular equations in Eq. (2.37) have t solutions for l from which the ‘‘fre-
quencies’’ (in wavenumbers) are obtained according to
~nn ¼ 1
2pc
ffiffiffilp
ð2:39Þ
Once the eigenvalues lk have been evaluated, the nature of the normal mode has
to be determined by evaluating the relative amplitudes Atk. Using Eq. (2.35),
these quantities can be normalised with respect to the potential energy such that
the relative contributions of each internal coordinate t to all normal modes and
the relative contributions of all internal coordinates in each normal mode sum
up to one. This procedure allows for an illustrative description of the character
of the normal modes in terms of the potential energy distribution (PED, given
in %), e.g., x% of the stretching coordinate t1, y% of the bending coordinate t2,etc.
Both the G- and the F-matrix are symmetric, that is Gtt 0 ¼ Gt 0t and Ftt 0 ¼ Ft 0 .
This corresponds to 1=2½vðvþ 1Þ� different Gtt 0 and Ftt 0 elements for a molecule
with v vibrational degrees of freedom. Whereas the Gtt 0 elements can be com-
puted readily when the structure of the molecule is known, the Ftt 0 elements are
not known a priori. Even for a simple three-atomic nonlinear molecule as de-
picted in Fig. 2.2, there are six different force constants: the stretching force con-
stants F11 and F22, referring to the bonds between the atoms 1 and 2 and the
atoms 2 and 3, respectively, the bending force constant F33, and the three interac-
tion force constants F12, F13, and F23, which are related to the interactions be-
tween the individual stretching and bending coordinates. On the other hand,
2.1 Molecular Vibrations 21
there are only three normal mode frequencies that can be determined experimen-
tally. This example illustrates the inherent problem of empirical vibrational anal-
ysis: the number of observables is always much smaller than the number of un-
known force constants.
In some instances, it is possible to utilise the symmetry properties of normal
modes (Box 2B) (Wilson et al. 1955; Cotton 1990). For symmetric molecules the
normal modes can be classified in terms of the symmetry species of the point
group to which the molecule belongs. Each point group is characterised by a set
of symmetry operations, such as the reflection in a mirror plane or an n-fold rota-
tion about an n-fold axis of symmetry. Now the individual normal modes are
either symmetric or antisymmetric to these operations. For instance, a normal
mode that is symmetric to all symmetry operations of the point group is denoted
as a totally symmetric mode and thus belongs to the totally symmetric species of
the point group. On the basis of group theory, it is possible to determine the
number of normal modes for each symmetry species of the point group. This
does not just facilitate computing the normal mode frequencies, because the sec-
ular determinant can be factorised. Moreover, one may predict IR and Raman
activity of the individual modes taking into account the symmetry properties of
the dipole moment and polarisability operator (vide infra) (Box 2C).In biological systems, however, many of the molecules to be studied by vibra-
tional spectroscopy lack any symmetry element, such that application of group
theory to the analysis of vibrational spectra is restricted to only a few examples.
Thus, this topic will not be covered comprehensively in this tutorial, but inter-
ested reader should consult specialised monographs (see Box 2B) (Wilson et al.
1955; Cotton 1990).
Essential support for the empirical vibrational analysis is based on isotopically
labelled derivatives. A variation of the masses only alters the G-matrix and leaves
the F-matrix unchanged. For the simplest case of a diatomic molecule, Eq. (2.11)
shows that the frequency varies with the square root of the reciprocal reduced
mass. However, for a three-atomic molecule the situation is even more compli-
cated as the individual modes include contributions from three internal coordi-
nates, albeit to different extents. Thus, force constants may be fitted to the exper-
imental data set constituted by the vibrational frequencies of all isotopomers.
Whereas for simple molecules with up to 10 atoms this approach has been ap-
plied with considerable success, it rapidly approaches practical limitations with
an increasing number of atoms, because the synthetic efforts to produce a suffi-
ciently large number of isotopically labelled compounds becomes enormous.
Thus, the vibrational problem is inherently underdertimined.
Nevertheless, until the beginning of the 1990s, the empirical vibrational analy-
sis was the only practicable way to extract structural information from the spectra
of biological molecules such as porphyrins or retinals (Li et al. 1989, 1990a,
1990b; Curry et al. 1985). The starting point for this approach is a set of empirical
force constants that have been found to be appropriate for specific internal coor-
dinates. These force constants are derived from molecules for which a spectro-
scopic determination of the force field is facilitated due to the smaller size, higher
22 2 Theory of Infrared Absorption and Raman Spectroscopy
symmetry, and the availability of appropriate isotopomers. Subsequently, the force
constant matrix of the molecule under consideration is simplified by appropriate
approximations, including the neglect of interaction force constants for internal
coordinates of widely separated parts of the molecule. Finally, the normal modes
are calculated for the presumed geometry (G-matrix) and adjustments of individ-
ual force constants are made to achieve the best possible agreement with the ex-
perimental data. This refinement represents the most critical step as it requires a
pre-assignment of the experimentally observed bands. Inconsistencies in the as-
signment and substantial deviations between calculated and experimental fre-
quencies that can only be removed by choosing unusual force constants may
then be taken as an indication that the presumed geometry was incorrect. The
procedure is then repeated on the basis of alternative molecular structures until
a satisfactory agreement between theory and experiment is achieved. It is fairly
obvious that the reliability of such a tedious procedure strongly depends on the
availability of a sufficiently large set of experimental data.
2.1.4
Quantum Chemical Calculations of the FG-Matrix
The alternative approach is to calculate the force constant matrix by quantum
chemical methods, which, due to progress in the development of the hardware
and efficient and user-friendly program packages, are nowadays applicable to
biological molecules, including molecules of more than 50 non-hydrogen atoms.
In these methods, an initial (‘‘guess’’) geometry of a molecule is set up and the
Schrodinger equation is solved in self-consistent field calculations, which lead
to the energy eigenvalues for this geometry. Systematic variations of internal co-
ordinates then eventually afford the geometry of lowest energy. This energy opti-
misation allows determination of the force constants by calculating the second
derivatives of the potential energy according to Eq. (2.17). Thus, all elements of
the F- and G-matrix can be computed and the normal modes are determined as
described above.
The most promising quantum chemical method is based on density functional
theory (DFT), which represents an excellent compromise between accuracy and
computational costs. Unlike Hartree–Fock procedures, DFT is directed to calcu-
lated electron densities rather than wavefunctions. Within this approach, the en-
ergy depends on the electron density and this dependency is included in a func-
tional. There are various functionals that have been suggested and tested for
calculating different observables. For calculations of vibrational frequencies, the
B3LYP functional is widely used and it was found to reproduce experimental
data in a satisfactory manner when using a standard 6-31G* basis set (Rauhut
and Pulay 1995). Nevertheless, the underlying approximations cause deviations
from the experimental frequencies that are approximately in the order of 4%, cor-
responding to a frequency uncertainty of ca.G60 cm�1 for modes between 1500
and 1700 cm�1. Considering a medium-sized molecule of 25 atoms, one may ex-
pect ca. 50 normal modes in the spectral region between 200 and 1700 cm�1 that
2.1 Molecular Vibrations 23

is usually studied by IR and Raman spectroscopy. This corresponds to an average
density of modes of ca. 1 mode per 30 cm�1, such that an accuracy of 4% for the
calculated frequencies would not allow an unambiguous assignment for all exper-
imentally observed bands.
The errors associated with the DFT calculations result from insufficient consid-
eration of the electron correlation, and, more severely, from the harmonic approx-
imation. The latter effect, illustrated in Fig. 2.4, causes an overestimation of the
force constants, as the harmonic potential function is too narrow compared with
an anharmonic potential function. These deficiencies of the DFT approach are
systematic in nature such that they may be compensated a posteriori.The simplest procedure is to correct the frequencies uniformly by multiplica-
tion with an empirical factor. This frequency scaling increases the accuracy of
the calculated frequencies to ca.G25 cm�1, which, however, is at the limit for an
unambiguous vibrational assignment for molecules that include up to 50 atoms.
The most reliable procedure to correct for the intrinsic deficiencies of the quan-
tum chemical calculations is to scale the force field directly. Using scaling factors
si that are specific for the various internal coordinates i, one obtains corrected
force constants ðFijÞs according to
ðFijÞs ¼ffiffiffiffisip ðFijÞ
ffiffiffiffisjp ð2:40Þ
These scaling factors can be determined for small example molecules for which a
sound assignment of the experimental bands is established, such that the specific
correction factors can be adjusted to yield the best agreement between calculated
and experimental data (Rauhut and Pulay 1995; Magdo et al. 1999). The scaling
factors are characteristic of specific internal coordinates but not unique for an in-
dividual molecule. Thus, they can be transferred to the target molecule and used
without any further fine tuning. This concept of global scaling factors has been
shown to provide an accuracy of ca. G10 cm�1 for the calculated frequencies,
Fig. 2.4 Potential curves for a diatomic oscillator as a function of the
inter-atomic distance r. The solid line is a schematic representation of a
Morse potential function for an anharmonic oscillator whereas the
dotted line refers to the harmonic potential function.
24 2 Theory of Infrared Absorption and Raman Spectroscopy
even for large molecules. Attention has to be paid in the case of hydrogen
bonded systems as here the 6-31G* basis set may not be sufficiently large (Mro-
ginski et al. 2005). Applying the global scaling approach, however, requires a co-
ordinate transformation of the force field from Cartesian to internal coordinates,
which is not a routine procedure in each case (vide supra).Even on the basis of scaled quantum chemical force fields, the comparison with
the calculated frequencies alone does not allow for an unambiguous assignment
for many biologically molecules as large as, for example, tetrapyrroles or retinals.
Therefore, calculated band intensities are often required as additional assignment
criteria. Calculation of IR and Raman intensities is straightforward within the
software packages for quantum chemical methods used for the force field calcu-
lations. For resonance Raman intensity calculations, tailor-made solutions have to
be designed (see Section 2.2.3).
2.2
Intensities of Vibrational Bands
Besides the frequencies of a normal mode, the intensity of the vibrational band is
the second observable parameter in the vibrational spectrum. The intensity is
simply proportional to the probability of the transition from a vibrational energy
level n to the vibrational level m, typically (but not necessarily) corresponding to
the vibrational ground and excited states, respectively. To understand the proba-
bilities of transitions between different states that are induced by the interaction
of the molecule with electromagnetic radiation, quantum mechanical treatments
are required.
Generally, the transition probability Pnm is given by the square of the integral
Pnm ¼ hc�mjWWjcni ð2:41Þ
where cn and cm are the wavefunctions for the vibrational states n and m, and WW
is the operator that describes the perturbation of the molecule by the electromag-
netic radiation. This operator is different for the physical processes in IR and
Raman spectroscopy and is obtained by first-order and second-order perturbation
theory, respectively.
2.2.1
Infrared Absorption
In IR spectroscopy, the transition n! m results from the absorption of a photon
and thus the process is controlled by the electrical dipole moment operator mmq,
which is defined by
mmq ¼Xa
ea � qa ð2:42Þ
2.2 Intensities of Vibrational Bands 25

where ea is the effective charge at the atom a and qa is the distance to the centre
of gravity of the molecule in Cartesian coordinates ðq ¼ x; y; zÞ (Wilson et al.
1955). The interaction with the radiation is given by the scalar product between
the vector of the electric field of the radiation and mmq. Averaging over all molecule
orientations, the IR intensity for this transition is expressed by
Inm; IR z ð½mx�2nm þ ½my�2nm þ ½mz�2nmÞ ð2:43Þ
where ½mq�nm is the integral
½mq�nm ¼ hc�mjmmqjcni ð2:44Þ
One can easily see that a vibrational transition n! m in the IR spectrum only
occurs if it is associated with a non-zero transition dipole moment ½mq�nm. To de-
cide whether or not, a normal mode is IR active, we expand mmq in a Taylor series
with respect to the normal coordinates Qk. Within the harmonic approximation,
the series is restricted to the linear terms
mmq ¼ m0q þ
X3N�6K¼1
mmkqQ k ð2:45Þ
with
mmkq ¼
qmq
qQk
� �0
ð2:46Þ
With Eq. (2.41) the transition probability is then given by
½ mmq� ¼ hc�mjmmqjcni ¼ m0qhc
�mcniþ
X3N�6k¼1
mmkqhc
�mjQkjcni ð2:47Þ
The first integral on the right-hand side of Eq. (2.47) is zero as the wavefunctions
cn and cm are orthogonal. Thus, a non-zero transition probability is only ob-
tained if two conditions are fulfilled. Firstly, the derivative of the dipole moment
with respect to the normal coordinate Qk in Eq. (2.47) must be non-zero, which
requires that the normal mode is associated with a change in the dipole moment.
Secondly, the integral hc�mjQkjcni must be non-zero, which is the situation when
the vibrational quantum numbers n and m differ by one. This implies that only
fundamentals are IR active within the harmonic approximation.
Equation (2.47) holds for all three Cartesian coordinates such that only one
non-zero transition dipole moment ½mq�nm ðq ¼ x; y; zÞ is sufficient to account for
the IR intensity of the normal mode Qk according to Eq. (2.43) (Box 2C). Using
unpolarised light and randomly oriented molecules, the experiment does not al-
low the conclusion to be made as to which of the components of the transition
26 2 Theory of Infrared Absorption and Raman Spectroscopy

dipole moment contributes to the IR intensity. If, however, the probe light is lin-
early polarised, it is possible to address the individual components of the transi-
tion dipole moments. Then IR measurements may provide additional informa-
tion for the vibrational assignment, the orientation of the molecules with respect
to the plane of polarisation of the incident light, or the orientation of a molecular
building block within a macromolecule if the macromolecule itself is oriented.
Consider, for example, a sample of ellipsoidal molecules that are all oriented
with the long axis in z-direction (Fig. 2.5). The incident light, propagating in the
y-direction, can be polarised in z- or x-direction, corresponding to a parallel and
perpendicular orientation of electric field vector, respectively. Parallel polarised
light will thus specifically probe those vibrational modes that exhibit a transition
dipole moment in the z-direction, and the absorbance Apara is given by
Apara z jmmnj2z ð2:48Þ
If the molecules do not exhibit a preferential orientation in the xy plane, IR ab-
sorption of perpendicular polarised light depends on both the x- and the y-component of transition dipole moment
Aperp z ðjmmnj2x þ jmmnj2yÞ ð2:49Þ
The quantities Apara and Aperp are combined in the dichroic ratio d which is de-
fined by
d ¼ Apara � Aperp
Apara þ Aperpð2:50Þ
and which may vary between 1 and �1 for the limiting cases of Aperp ¼ 0 and
Apara ¼ 0, respectively.
Fig. 2.5 IR dichroism of oriented molecules. The absorbance of light
polarised parallel to the long molecular axis Apara is given by the ratio
Ipara/I0; para whereas the perpendicular component is defined by
Iperp/I0; perp.
2.2 Intensities of Vibrational Bands 27
2.2.2
Raman Scattering
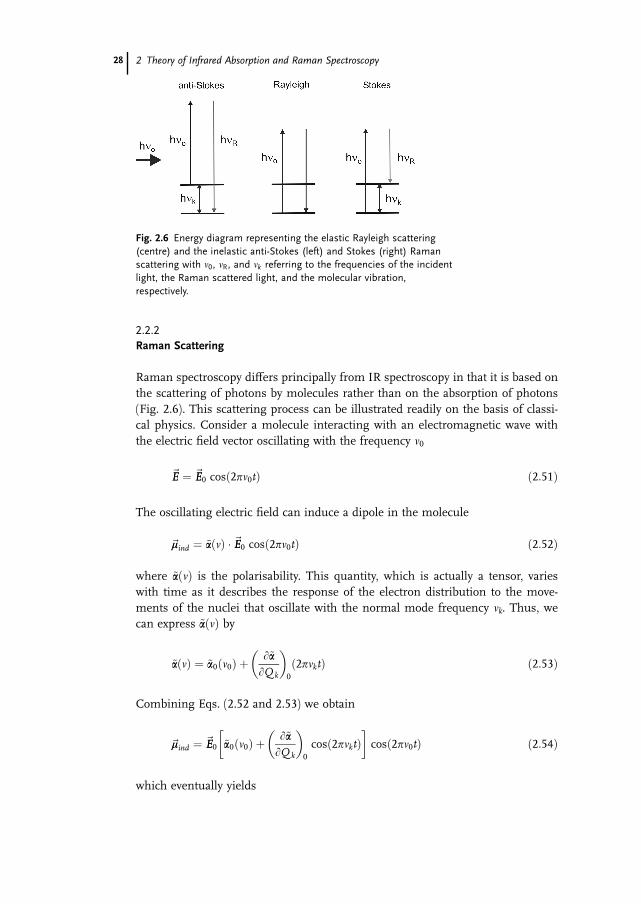
Raman spectroscopy differs principally from IR spectroscopy in that it is based on
the scattering of photons by molecules rather than on the absorption of photons
(Fig. 2.6). This scattering process can be illustrated readily on the basis of classi-
cal physics. Consider a molecule interacting with an electromagnetic wave with
the electric field vector oscillating with the frequency n0
~EE ¼ ~EE0 cosð2pn0tÞ ð2:51Þ
The oscillating electric field can induce a dipole in the molecule
~mmind ¼ ~aaðnÞ � ~EE0 cosð2pn0tÞ ð2:52Þ
where ~aaðnÞ is the polarisability. This quantity, which is actually a tensor, varies
with time as it describes the response of the electron distribution to the move-
ments of the nuclei that oscillate with the normal mode frequency nk. Thus, we
can express ~aaðnÞ by
~aaðnÞ ¼ ~aa0ðn0Þ þq~aa
qQk
� �0
ð2pnktÞ ð2:53Þ
Combining Eqs. (2.52 and 2.53) we obtain
~mmind ¼ ~EE0 ~aa0ðn0Þ þq~aa
qQk
� �0
cosð2pnktÞ� �
cosð2pn0tÞ ð2:54Þ
which eventually yields
Fig. 2.6 Energy diagram representing the elastic Rayleigh scattering
(centre) and the inelastic anti-Stokes (left) and Stokes (right) Raman
scattering with n0, nR, and nk referring to the frequencies of the incident
light, the Raman scattered light, and the molecular vibration,
respectively.
28 2 Theory of Infrared Absorption and Raman Spectroscopy
~mmind ¼ ~EE0
�~aa0 cosð2pn0tÞ þ
q~aa
qQk
� �0
Qk cos½2pðn0 þ nkÞt�
þ q~aa
dQk
� �0
Qk cos½2pðn0 � nkÞt��
ð2:55Þ
The sum on the right side of Eq. (2.55) includes three terms corresponding to po-
larisabilities that depend on different frequencies, which are the frequency of the
incident radiation n0 and the frequencies ðn0 � nkÞ and ðn0 þ nkÞ that differ fromn0 by the frequency of the normal mode. Scattering that leaves the frequency of
the incident light unchanged is referred to as elastic or Rayleigh scattering where-
as the frequency-shifted (inelastic) scattering is referred to as Raman scattering
(Fig. 2.6). When the frequency of the scattered light is lower than n0, the molecule
remains in a higher vibrationally excited state (m > n for the transition n! m).
This process is denoted as Stokes scattering whereas anti-Stokes scattering refers
to ðn0 þ nkÞ and thus to m < n. At ambient temperature, thermal energy is lower
than the energies of most of the normal modes, such that molecules predomi-
nantly exists in the vibrational ground state and Stokes scattering represents the
most important case of Raman scattering.
The energy conservation for Raman scattering is not contained in the classical
treatment. It requires the quantum mechanical description of vibrational quan-
tum states interacting with electromagnetic radiation (Placzek 1934). The opera-
tor, which according to Eq. (2.41) determines the probability of the Raman transi-
tion n! m, is the polarisability aa with components defined by the molecule-fixed
coordinates x, y, z.
mind; x
mind; ymind; z
24
35 ¼ axx axy axz
ayx ayy ayz
azx azy azz
264
375 � Ex
Ey
Ez
264
375 ð2:56Þ
It is useful to define the Raman scattering cross section for the vibrational n! mtransition sn!m by
In!m ¼ sn!mI0 ð2:57Þ
where I0 is the intensity of the incident radiation and In!m is the scattered inten-
sity integrated over all scattering angles and polarisation directions for a non-
oriented sample. The Raman cross section is correlated with the Raman polaris-
ability by
sn!m z ðn0 G nkÞ4 �Xr; s
jar;sj2 ð2:58Þ
taking into account that the intensity for electric dipole radiation scales with the
fourth power of the frequency. The indices r and s denote the molecule-fixed co-
ordinates.
2.2 Intensities of Vibrational Bands 29
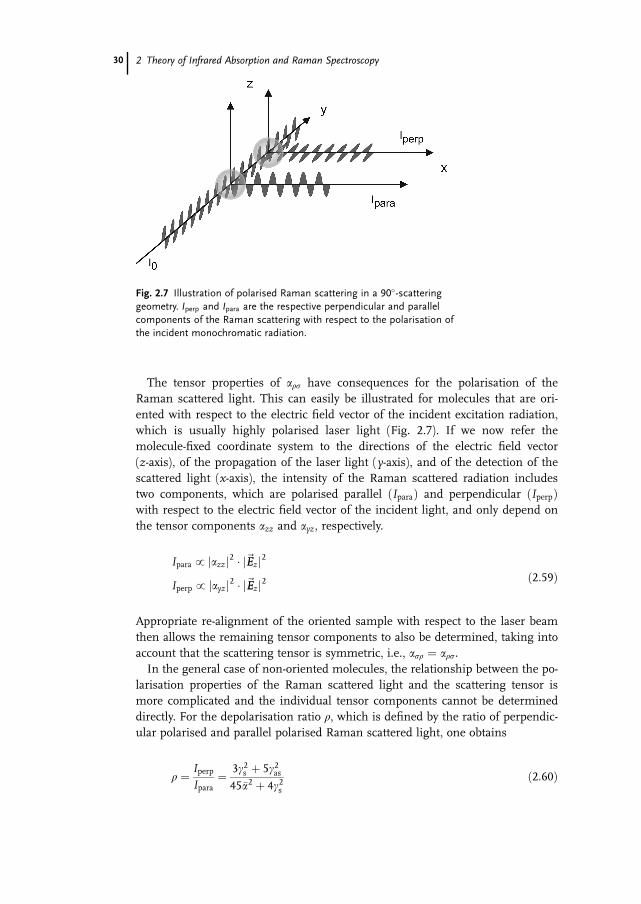
The tensor properties of ars have consequences for the polarisation of the
Raman scattered light. This can easily be illustrated for molecules that are ori-
ented with respect to the electric field vector of the incident excitation radiation,
which is usually highly polarised laser light (Fig. 2.7). If we now refer the
molecule-fixed coordinate system to the directions of the electric field vector
(z-axis), of the propagation of the laser light (y-axis), and of the detection of the
scattered light (x-axis), the intensity of the Raman scattered radiation includes
two components, which are polarised parallel ðIparaÞ and perpendicular ðIperpÞwith respect to the electric field vector of the incident light, and only depend on
the tensor components azz and ayz, respectively.
Ipara z jazzj2 � j~EEzj2
Iperp z jayzj2 � j~EEzj2ð2:59Þ
Appropriate re-alignment of the oriented sample with respect to the laser beam
then allows the remaining tensor components to also be determined, taking into
account that the scattering tensor is symmetric, i.e., asr ¼ ars.
In the general case of non-oriented molecules, the relationship between the po-
larisation properties of the Raman scattered light and the scattering tensor is
more complicated and the individual tensor components cannot be determined
directly. For the depolarisation ratio r, which is defined by the ratio of perpendic-
ular polarised and parallel polarised Raman scattered light, one obtains
r ¼ IperpIpara
¼ 3g2s þ 5g2as45a2 þ 4g2s
ð2:60Þ
Fig. 2.7 Illustration of polarised Raman scattering in a 90�-scatteringgeometry. Iperp and Ipara are the respective perpendicular and parallel
components of the Raman scattering with respect to the polarisation of
the incident monochromatic radiation.
30 2 Theory of Infrared Absorption and Raman Spectroscopy
with the mean polarisability a and the symmetric ðgsÞ and antisymmetric ðgasÞanisotropy given by
a ¼ 1
3
Xrr
arr
g2s ¼1
2
Xrs
ðarr � assÞ2 þ3
4
Xrs
ðars þ asrÞ2 ð2:61Þ
g2as ¼3
4
Xrs
ðars � asrÞ2
In the case of symmetric molecules, determination of polarisation ratios is a use-
ful tool for the vibrational assignment. For each symmetry species of a point
group, the character table indicates which of the individual tensor components
are zero and which are non-zero (Wilson et al. 1955; Czernuszewicz and Spiro
1999) (Box 2C). On this basis, it is not only possible to decide if the modes of
this species are Raman-active, but also to predict the polarisation ratio, which
can then be compared with the experimentally observed value.
As in IR absorption spectroscopy, a description of Raman intensities is only
possible on the basis of a quantum mechanical treatment (Placzek 1934). In
Raman scattering two photons are involved, hence second-order perturbation
theory is required. On the basis of Kramers–Heisenberg–Dirac’s dispersion
theory, the scattering tensor is expressed as
½anm�rs ¼1
h
XR; r
hnGjMrjRrihrRjMsjGmi
nRr � nk � n0 þ iGRþ hrRjMsjGmihnGjMrjRri
nRr � nk þ n0 þ iGR
� �ð2:62Þ
where MsðMrÞ is the electronic transition dipole moment in terms of a molecule-
fixed coordinate system (Albrecht 1961; Warshel and Dauber 1977). The symbols
n0 and nk denote the frequency of the excitation radiation and the normal mode
Qk, respectively (Fig. 2.6). The indices ‘‘R’’ and ‘‘r’’ refer to the respective elec-
tronic and vibrational (vibronic) states of the molecule and GR is a damping con-
stant that is related to the lifetime of the vibronic state Rr. Equation (2.62) repre-
sents a sum of integrals that describe the transitions nG! Rr and Rr ! Gm.
The sum indicates that for the Raman transition all vibronic states have to be con-
sidered. This implies that the scattering tensor and thus the Raman intensity is
controlled by the transition probabilities involving all vibronic states, even though
the initial and final states refer to the vibrational ground and excited states of the
electronic ground state.
In the general case, the energy of the exciting radiation hn0 is much lower than
the energy of any vibronic transition hnRr . Let us consider an example of a mole-
cule with the first four electronic transitions Ei at 300, 240, 200, and 180 nm.
Using an excitation line at 1064 nm and neglecting the damping terms, we can
determine the relative weights of the individual terms in the sum of Eq. (2.62),
2.2 Intensities of Vibrational Bands 31
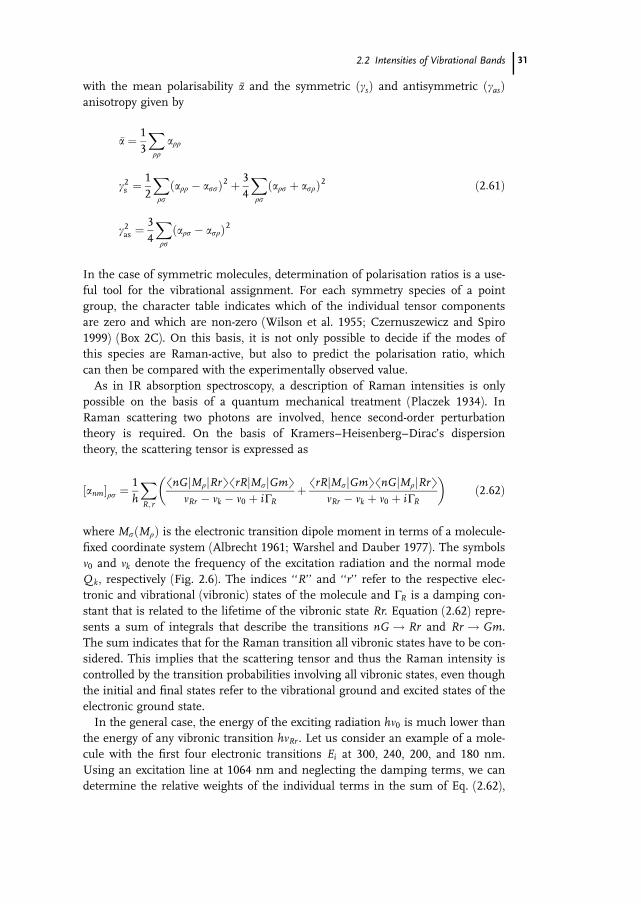
as given by the denominators, i.e., ðnRr � n0 � nkÞ�1 and ðnRr þ n0 � nkÞ�1 (Fig. 2.8).One can easily see that under these conditions the contributions of the four elec-
tronic states to the scattering tensor are comparable, as shown for the normal
mode nk at 1500 cm�1. The situation is different when the excitation energy ap-
proaches the energy of an electronic transition. Then, for this specific transition
the term ðnRr � n0 � nkÞ�1 dominates over all other terms in the sum of Eq. (2.62).
This is demonstrated for n0 ¼ 30 960 cm�1 (323 nm) for which the contribution
from the first electronic transition is more than 10 times larger than that from
the second transition.
2.2.3
Resonance Raman Effect
The conditions under which n0 is close to the frequency of an electronic transition
refer to the resonance Raman (RR) effect, for which Eq. (2.62) consequently can
be simplified to
½anm�rs G1
h
Xr
hnGjMrjRrihrRjMsjGmi
nRr � nk � n0 þ iGR
� �ð2:63Þ
where summation is now restricted to the vibrational states r of the resonant elec-tronically excited state (Albrecht 1961; Warshel and Dauber, 1977). In contrast to
Eq. (2.44), the wavefunctions of the integrals in Eq. (2.63) depend on the elec-
Fig. 2.8 Absorption spectrum of a molecule with four electronic
transitions (E1, E2, E3, and E4). The columns represent the frequency-
dependent weights of the electronic transitions to the scattering tensor
[Eq. (2.62)] for excitation lines at 1064 and 323 nm. The calculations
refer to a vibrational mode at 1500 cm�1.
32 2 Theory of Infrared Absorption and Raman Spectroscopy
tronic and nuclear coordinates, which can be separated within the Born–
Oppenheimer approximation according to
hnGjMrjRri ¼ hnrihGjMrjRi ¼ hnriMGR; r ð2:64Þ
Here, integrals of the type hnri represent the Franck–Condon factors that are the
integrals over the products of two vibrational wavefunctions. With this approxi-
mation, Eq. (2.63) leads to
½anm�rs G1
h
Xr
hnrihrmiMGR; rMGR;s
nRr � nk � n0 þ iGR
� �ð2:65Þ
The electronic transition dipole moment components MGR; r which refer to the
electronic transition from the ground state G to the (resonant) electronically ex-
cited state R, can now be expanded in a Taylor series with respect to the normal
coordinates Qk.
MGR; rðQkÞ ¼ MGR; rðQ ð0Þk Þ þXk
qMGR; r
qQk
� �0
Qk þ � � � � � � ð2:66Þ
Within the harmonic approximation we neglect higher order terms and combine
Eqs. (2.65 and 2.66) to obtain the scattering tensor as the sum of two terms, the
so-called Albrecht’s A- and B-terms.
½anm�rs GArs þ Brs ð2:67Þ
with
Ars G1
h
Xr
hnrihrmiM0GR; rM
0GR;s
nRr � nk � n0 þ iGR
!ð2:68Þ
where M0GR; r and M0
GR;s are the components of transition dipole moment of the
vertical electronic transition G! R. The B-term is given by
Brs G1
h
Xr
hnjQkjrihrmiqMGR; r
qQk
� �0
M0GR;s
nRr � nk � n0 þ iGRþhnrihrjQkjmi
qMGR; s
qQk
� �0
M0GR; r
nRr � nk � n0 þ iGR
0B@
1CA
ð2:69Þ
The A- and B-terms represent different scattering mechanisms; however, com-
mon to both terms is that the dominators rapidly decrease when the frequency
of the excitation line n0 approaches the frequency of an electronic transition.
Then both the A- and the B-terms and thus the RR intensity increase [Eqs. (2.57
2.2 Intensities of Vibrational Bands 33

and 2.58)], albeit to a different extent depending on the character of the electronic
transitions and normal modes involved.
When the resonant electronic transition exhibits a large oscillator strength, that
is a large transition dipole moment M0GR, the A-term, which scales with jM0
GRj2,
increases more significantly than the B-term and thus becomes the leading
term. Then the enhancement of a normal mode depends on the Franck–Condon
factor products hnrihrmi (Franck–Condon enhancement). Whether or not, a
normal mode is resonance enhanced via the Franck–Condon mechanism, de-
pends on the geometry of the resonant excited state.
Consider, for example, ethylene, which exhibits a strong electronic absorption
band at ca. 200 nm, originating from the (first) allowed p! p� transition of the
CbC double bond. Population of the p� orbital leads to the lowering of the bond
order from 2 to 1, implying that in this excited state the CaC bond length in-
creases. Hence, the potential energy curve for the CaC distance is displaced in
this electronically excited state with respect to the ground state, as shown in Fig.
2.9, i.e., along the main internal coordinate of this normal mode. Now we must
consider the Franck–Condon factors that couple the wavefunctions of the ground
and excited state. According to Eq. (2.68), we have to sum up over those integrals
that involve all vibrational states of the electronic excited state, with their relative
weight being determined by the match with the excitation energy. For the sake of
simplicity we will restrict the discussion to the RR transition n! m exclusively
Fig. 2.9 Harmonic potential curves for the electronic ground (G)
and excited state (R), illustrating the situation for an excited state
displacement of Ds ¼ 0 (left) and Ds0 0 (right) for RR transitions from
the vibrational ground state Gn to the first vibrationally excited state
Gm via coupling to the vibronic state Rr.
34 2 Theory of Infrared Absorption and Raman Spectroscopy

via the vibronic state Rr such that we only consider one term of the sum, i.e., the
integrals involving the vibronic state Rr (Fig. 2.9). The wavefunctions of the first
integral hnri have the same symmetry, but due to the potential curve displace-
ment in the direction of the internal coordinate of this mode the integral is non-
zero, albeit smaller than one. For the same reason, the wavefunctions of the inte-
gral hrmi that have different symmetries are not zero either. Similar considera-
tions hold for Franck–Condon factors involving other vibronic states. This im-
plies that a vibrational mode including the CbC stretching coordinate exhibits
non-zero Franck–Condon factor products and thus gains resonance Raman (RR)
intensity via the A-term scattering mechanism (Box 2C).
The situation is different for modes including the CaH stretching coordinate
(Fig. 2.9). As the CaH distance remains unaffected upon the p! p� electronic
transition, the origin of the corresponding potential curve is at the same position
in the electronic ground and excited states. In this instance the integral hnri will
be non-zero but the hrmi integral will vanish, implying that a pure CaH stretch-
ing mode will not be RR active. The fact that CaH stretching modes are Raman-
active instead just reflects the involvement of higher lying electronic transitions,
amongst which at least one is associated with a geometry change of the CaH
stretching coordinate.
The importance of excited-state displacements for the RR intensity can be gen-
eralised (Warshel and Dauber 1977). Only modes including at least one internal
coordinate that changes with the electronic transition can gain resonance enhanc-
ment via the A-term mechanism. The relationship between the excited state dis-
placement Ds and the A-term contribution to the scattering tensor can be approxi-
mated by
AzjM0
GRj2 � nk � Ds
ðnRr � n0 þ iGRÞðnRr � n0 þ nk þ iGRÞð2:70Þ
This expression assumes that the normal modes do not change in the electronic
excited state, both with respect to their composition and with respect to the fre-
quency. Although this appears to be a severe restriction, Eq. (2.70) has been
shown to provide a good basis for qualitative predictions of the RR activity of
modes that are dominated by one internal coordinate, given that the nature of
the resonant excited state is known. The situation is much more complicated for
modes involving many internal coordinates to comparable extents, and a prioripredictions are impossible. The contributions from different internal coordinates
to Ds may have positive or negative sign, such that they can be additive or cancel
each other (Mroginski et al. 2003).
Calculation of RR intensities still represents a challenge as both ground state
(structure, vibrational frequencies) and excited state properties (excitation ener-
gies, structure) have to be treated. In a particularly promising concept, quantum
mechanical calculations are combined with the use of experimental data. Within
the framework of the so-called Transform theory, the frequency dependence of
the A-term of the scattering tensor [Eq. (2.70)] may be obtained by the Kramers–
2.2 Intensities of Vibrational Bands 35

Kronig transformation of the absorption band (Peticolas and Rush 1995). The
electronic transition dipole moments M0GR and the excited state displacements
of a given normal mode Ds are calculated by quantum chemical methods such
as time-dependent DFT. At present, these approaches are still fairly time-
consuming and, specifically, the calculation of excited state geometries, required
for determining Ds, is not trivial, even for relatively small molecules.
The crucial parameter that controls resonance enhancement via the B-termscattering mechanism is the derivative of the electronic transition dipole moment
with respect to the normal mode (Albrecht 1961). This derivative is large for those
modes that can effectively couple to an electronic transition and thus may gain
RR intensity even when the resonant electronic transition is relatively weak. This
vibronic coupling enhancement may also be operative when the excitation fre-
quency is close to the frequencies of two electronic transitions.
An alternative approach to describe the Franck–Condon-type resonance en-
hancement (A-term scattering) has been developed by Heller who described the
scattering process in terms of wave-packet dynamics (Heller 1981). As the tempo-
ral evolution of the scattering process is much faster than the nuclear vibrations,
consideration of the summation over the multitude of vibronic eigenstates is def-
initely not necessary. The RR intensity is induced by the force qV=qQk exerted by
the excited state potential surface on the nuclear ground state configuration. This
force controls the temporal evolution of the ground state wavefunction jnðtÞiafter excitation to the excited state surface and before returning to the final state
jmi. The RR intensity for a given mode k is then given by
IRRðkÞzðy0
jM2GR � expðin0t� Gr tÞ � hmjnðtÞi dtj
� �2ð2:71Þ
This expression is analogous to the square of Eq. (2.68). Furthermore, the treat-
ments of the RR scattering in the time-domain by Heller (Heller 1981) and in
the frequency domain via the Kramers–Heisenberg–Dirac dispersion relation
are linked to each other through the Fourier transform. Also, in the time-domain
treatment further simplifications can be introduced using similar assumptions as
those used for Eq. (2.70). The advantage of Heller’s approach is particularly evi-
dent for those instances where only a few internal coordinates exhibit large ex-
cited state displacements Ds and thus the RR spectrum is dominated only by a
couple of normal modes. For these modes the RR intensities does not only de-
pend on Ds but also on the magnitude of qV=qQk. The intensity ratio of two nor-
mal modes k and l is then given by
IRRðkÞIRRðlÞ
¼ nl
nk� qV=qQk
qV=qQ l
� �2A
n3k � D2k
n3l � D2l
ð2:72Þ
This approach has been successfully employed to analyse the RR spectra of metal-
loproteins upon excitation in resonance with charge-transfer transitions (Blair
et al. 1985).
36 2 Theory of Infrared Absorption and Raman Spectroscopy

The expressions in Eqs. (2.67–2.72) represent approximations that can be
employed when the contributions from one or two electronic transitions to the
scattering tensor become dominant. Consequently, there is no sharp borderline
between non-resonance Raman and RR scattering. Resonance enhancement sim-
ply means that the vibrational modes of a chromophore within a molecule selec-
tively gain intensity when the excitation line is in resonance with an electronic
transition. Such an enhancement does not necessarily require an exact frequency
match of the excitation and the electronic transition. Indeed, a closer inspection
of the frequency dependence of the Raman intensity reveals that a specific en-
hancement of these modes already occurs for excitation lines relatively far away
from the maximum of the electronic transition. This is illustrated by comparing
the frequency dependence of the Raman intensity under strictly non-resonance
conditions [Eqs. (2.57 and 2.58)] and the RR intensity provided by the A-termscattering mechanism. In the latter, an approximate formula can be derived for
the Stokes scattering under pre-resonance conditions (Albrecht and Hutley
1971), i.e., when the damping constant [Eq. (2.68)] can be neglected
ðjnR � n0jg jGRjÞ,
Inm;RR z ðn0 � nkÞ4ðn0 � nkÞ2ðn20 þ n2RÞðn2R � n20Þ
2ð2:73Þ
To compare the RR and Raman intensities, Eq. (2.73) has to be corrected for the
‘‘normal’’ n4-dependence of the radiation intensity [Eqs. (2.57 and 2.58)]
Inm;RR
Inm;Razðn0 � nkÞ2ðn20 þ n2RÞðn2R � n20Þ
2ð2:74Þ
The ratio Inm;RR=Inm;Ra represents the resonance enhancement, which in Fig.
2.10 is plotted as a function of the frequency difference between the excitation
and the the electronic transition. It can be seen that the enhancement factor
solely associated with the frequency dependence of the scattering tensor strongly
increases for n0 ! nR and even for an energy gap of 5000 cm�1 it is nearly 500.
For more rigorous resonance conditions, for which Eq. (2.74) is no longer valid,
the resonance enhancement can reach 5–6 orders of magnitude, depending on
the other quantities that control the scattering tensor, i.e., the Franck–Condon
factor products, the square of the electronic transition dipole moment, and the
damping constant [Eq. (2.68)]. As a rule of thumb, the resonance enhancement
then scales with the square of the extinction coefficient of the electronic absorp-
tion band at the excitation line. Consequently, the sensitivity of Raman spectros-
copy increases greatly under resonance conditions and approaches that of UV–vis
absorption spectroscopy.
It should be emphasised at this point that the frequencies refer to the molecu-
lar structure in the initial electronic state, usually the electronic ground state, al-
though the RR intensities are sensitively controlled by the properties of the elec-
tronically excited state(s). Resonance enhancement represents the gain in Raman
2.2 Intensities of Vibrational Bands 37

intensity for the vibrational bands of a chromophore as compared with strictly
non-resonance conditions. It is restricted to that part of the molecule in which
the resonant electronic transition is localised. Such a selective enhancement has
enormous practical implications when we are interested in studying the vibra-
tional spectrum of the specific constituents of a macromolecule, such as a cofac-
tor within a protein. Choosing appropriate excitation lines will then allow probing
the vibrational bands solely of the cofactor such that the non-resonant Raman
bands of the apo-protein can be effectively discriminated in most instances.
2.3
Surface Enhanced Vibrational Spectroscopy
Thirty years ago it was discovered accidentally that molecules adsorbed on rough
surfaces of certain metals may experience a drastic enhancement of the Raman
scattering. This unexpected finding immediately prompted intensive research ac-
tivities in this field. Initially, these studies were directed at elucidating the nature
of this enormous enhancement, which could be of several orders of magnitude.
Later, it was also recognised that this technique had a high potential for studying
molecules at interfaces. Since that time, the surface enhanced Raman scattering
(SERS) effect has become largely understood and this technique has found a
place not only in surface and interfacial science but also in biophysics. Moreover,
it was also noticed that the enhancement of vibrational bands at metal surfaces is
not restricted to Raman scattering but may also take place, albeit to a smaller
extent, in IR absorption, i.e., surface enhanced infrared absorption (SEIRA).
SERS and SEIRA have been observed at metal interfaces with solid, liquid, or
Fig. 2.10 Resonance enhancement IRR/IRa via the A-term mechanism
[Eq. (2.74)] as a function of the difference between the frequency of the
incident light n0 and the electronic transition nR.
38 2 Theory of Infrared Absorption and Raman Spectroscopy
gas (vacuum) phases, but only the solid/solution interface is of relevance in bio-
logical applications. The enhancement is metal- and wavelength-specific, such
that for the typical spectral range of Raman and IR spectroscopy from 400 to
10000 nm, the metals that can be employed are Ag and Au.
2.3.1
Surface Enhanced Raman Effect
The SER effect can largely be understood on the basis of classical electromagnetic
theory (Kerker et al. 1980; Moskovits 1985). The starting point is the analysis of
light scattering and absorption by colloidal particles, which was considered about
a century ago by G. Mie (Mie 1908). In a first approximation, colloidal particles
can be represented as spheres. When the size of the particles is small with respect
to the wavelength of the incident light (Rayleigh limit), the electromagnetic field
can effectively couple with the collective vibrations of the ‘‘free electrons’’ of the
metal, which are denoted as surface plasmons (Kerker et al. 1980; Moskovits
1985). The incident electric field ~EE0ðn0Þ, oscillating with the frequency n0, induces
an electric dipole moment in the sphere and excites the surface plasmons, caus-
ing an additional electric field component ~EEindðn0Þ, normal to the surface in the
near-field of the sphere. Thus, the total electric field of the frequency n0 is then
expressed by
~EEtotðn0Þ ¼ ~EE0ðn0Þ þ ~EEindðn0Þ ð2:75Þ
Since ~EEindðn0Þ is a function of ~EE0ðn0Þ the enhancement of the electric field is given
by
FEðn0Þ ¼j~EE0ðn0Þ þ ~EEindðn0Þj
j~EE0ðn0Þj¼ j1þ 2g0j ð2:76Þ
The quantity g0 is related to the dielectric properties of the metal through
g0 ¼~eerðn0Þ � 1
~eerðn0Þ þ 2ð2:77Þ
Here ~eerðn0Þ is the frequency-dependent dielectric constant divided by the square
of the refractive index of the surrounding medium nsolv.
~eerðn0Þ ¼ereðn0Þ þ ieimðn0Þ
n2solv
ð2:78Þ
Equations (2.76–2.78) show that g0, and thus the field enhancement FEðn0Þ, be-comes large if the real part of the relative dielectric constant approaches �2 and
the imaginary part is small. These conditions depend on the wavelength and are,
2.3 Surface Enhanced Vibrational Spectroscopy 39
within the Rayleigh limit, particularly well matched for Ag and Au colloids at
ca. 400 and 560 nm, respectively.
A molecule that is located in close proximity to the sphere is excited by the elec-
tric field ~EEtotðn0Þ, which may induce all possible photophysical and photochemical
processes, including Raman scattering. If the resonance conditions are fulfilled
for the incident light with n0, this will also be approximately the case for the fre-
quency of the Raman scattered light n0 G nk. Then, the electric field of the Raman
scattered light, ~EERaðn0 G nkÞ, of the normal mode k that is proportional to ~EEtotðn0Þalso induces a secondary electric field component ~EERa; indðn0 G nkÞ in the metal
particle giving rise to a total electric field oscillating with n0 G nk in analogy to
Eq. (2.75). Thus, Eq. (2.76) holds for both the electric field of the exciting and
the Raman scattered light. As the intensity of the Raman scattered light in the
far field is proportional to j~EERa; totðn0 G nkÞj2, the total surface enhancement factor
of the Raman intensity is given by
FSERðn0 G nkÞ ¼ ½ð1þ 2g0Þð1þ 2gRaÞ�2 ð2:79Þ
Equation (2.79) indicates that even a field enhancement by a factor of 10 yields an
enhancement of the Raman intensity of more than 104.
These simple considerations hold for particles much smaller than the wave-
length and are thus independent of the shape and the size of the particles.
The enhancement at larger particles, however, is no longer shape- and size-
independent. One can show that, in general, larger spheres or ellipsoidal shapes
cause a red-shift of the wavelength of maximum enhancement. This is also true
for interacting particles, i.e., aggregated colloids.
A particularly large enhancement is predicted for tips of the type used in scan-
ning probe microscopy. These predictions have indeed been confirmed and uti-
lised in so-called tip-enhanced Raman spectroscopy (Kneipp et al. 2006). In this
technique, a sharp tip, as used for scanning tunnelling or atomic force micros-
copy, is brought into close proximity with that part of a molecular sample that is
in the focus of the incident laser beam. Only the molecules in the near-field of the
tip experience an enhancement of the Raman scattering.
For biological applications, metal electrodes represent more versatile SER-active
devices as they allow probing of potential-dependent processes by controlling
the electrode potential (Murgida and Hildebrandt 2004, 2005). The enhancement
mechanism on electrodes can be largely understood within the same theoreti-
cal framework as outlined above for the SER effect on metal colloids. A sub-
microscopic roughness of the electrode, typically generated by electrochemical
roughening (oxidation–reduction cycles), is a prerequisite for the SER effect on
metal electrodes. The scale of this roughness is comparable to the dimensions of
SER-active metal colloids, such that an SER-active electrode can be approximated
by an array of metal semispheres, for which a treatment of the field enhancement
similar to isolated metal spheres is possible. Taking into account that the scale of
roughness which is produced by electrochemical roughening of the electrode sur-
face is approximately the same as the dimension of SER-active colloids, one may
40 2 Theory of Infrared Absorption and Raman Spectroscopy

approximate the roughness on electrodes by semi-spherical particles, or more ap-
propriately, by connected semi-spheres (Fig. 2.11). In SER experiments, the sur-
face roughness of electrodes is not uniform, corresponding to approximate semi-
sphere structures with a wide distribution of particle radii a0 (Fig. 2.12). Thus,
the experimentally observed wavelength-dependent surface enhancement is very
broad and may cover the entire spectral region from the resonance frequency at
the Rayleigh limit ða0 f l0Þ up to the infrared spectral region.
Fig. 2.11 Simplified view of a sub-microscopically rough metal surface
(thick solid line) approximating the surface roughness for semi-spheres
of radius a0. Molecules contributing to the SER scattering (hollow
spheres) are separated from the surface via spacers of length d.
Fig. 2.12 Atomic force microscopic picture of an electrochemically roughened silver electrode.
2.3 Surface Enhanced Vibrational Spectroscopy 41

In the relatively few instances for which the enhancement factor has been de-
termined on the basis of the number of scattering molecules, values of 105–106
have been reported, which can be understood within the framework of the elec-
tromagnetic theory. Enhancement factors of this magnitude drastically increase
the sensitivity of the Raman effect, such that SER spectroscopy represents a sen-
sitive tool for studying molecules in the adsorbed state. The sensitivity, and,
moreover, the selectivity can be further increased for molecules that exhibit an
electronic absorption in the visible region. Then it is possible to tune the excita-
tion frequency to be in resonance with both the electronic transition of the ad-
sorbate and the surface plasmons of the metal. Under these conditions, the mo-
lecular RR and the SER effect combine (surface enhanced resonance Raman
scattering – SERRS), such that it is readily possible to measure high quality spec-
tra of molecules even if they are adsorbed at sub-monomolecular coverage. In
fact, it has been shown that the effective quantum yield for the SERR process
may approach unity (Hildebrandt and Stockburger 1984) and thus offers the pos-
sibility to probe even single molecules (Kneipp et al. 2006). If the chromophore
associated with the resonant electronic transition is a cofactor in a protein, SERR
spectroscopy displays a two-fold selectivity, as it probes selectively the vibrational
spectrum of the cofactor of only the adsorbed molecules.
The electromagnetic theory of the SER effect implies that the enhancement is
not restricted to molecules attached directly to the metal, although it decays ac-
cording to the distance-dependence of dipole–dipole interactions. For spherical
colloids of radius a0 the decrease in the enhancement factor FSER with the dis-
tance d from the surface is given by
FSERðdÞ ¼ FSERð0Þ �a0
a0 þ d
� �12ð2:80Þ
where FSERð0Þ is the enhancement factor for molecules directly adsorbed onto the
metal surface. For a particle radius of 20 nm, the enhancement is then estimated
to decrease by a factor of ca. 10 when the molecule is separated by ca. 3.5 nm from
the surface (Fig. 2.13). This prediction is in agreement with experimental find-
ings and has also been verified for molecules immobilised on metal films and
electrodes. Moreover, the consequences of this distance-dependence are impor-
tant when applying SER spectroscopy to biological molecules. As direct interac-
tions with the metal, specifically with Ag, may cause denaturation of biomole-
cules, it is advisable to cover the metal surfaces with biocompatible coatings that
provide less harmful immobilisation conditions (see Section 4.3.6). The thickness
of the coatings is typically between 1 and 5 nm, hence the surface enhancement
is still sufficiently strong for the SER effect to be utilised (Murgida and Hilde-
brandt 2004, 2005).
In general, the electromagnetic theory provides a satisfactory explanation for
the SER effect. However, there are a few documented cases that point to an addi-
tional contribution, which is commonly denoted as the ‘‘chemical effect’’ (Otto
42 2 Theory of Infrared Absorption and Raman Spectroscopy

2001). This effect is restricted to molecules chemisorbed on sites of atomic-scale
roughness, such as ad-atoms on a surface. Such surface complexes represent es-
sentially new compounds in which electronic transitions associated with the elec-
tronic states of the metal atom are involved. These transitions are analogous to
charge transfer transitions of transition metal complexes. Excitation in resonance
with such a transition leads to the enhancement of the Raman bands of the ad-
atom–molecule complex similar to the molecular RR mechanism. This chemical
effect has been demonstrated for small molecules under conditions where
atomic-scale roughness is preserved, such as on cold-deposited metal films in an
ultrahigh vacuum at low temperature. It may also play a role in so-called ‘‘hot
spots’’ generated with metal nanoparticles and assumed to be crucial for single-
molecule SER spectroscopy (Kneipp et al. 2006). The chemical effect can be ne-
glected for those devices in which the probe molecules are not in direct contact
with the metal surface, such as in SERR spectroscopy of protein-bound cofactors
or for devices including biocompatible coatings. For this reason and due to the
low magnitude of the enhancement (ca. 100), the importance of the chemical ef-
fect in SER (SERR) spectroscopy of biological systems is small.
2.3.2
Surface Enhanced Infrared Absorption
The electromagnetic theory also provides the conceptual framework for under-
standing enhanced absorption of radiation by molecules adsorbed on or in close
vicinity to Ag or Au surfaces. In this instance, the optically active metal surfaces
are created by electrodeless deposition of Ag or Au in the vacuum or in solution
(Osawa 1997). The thin metal films that are usually deposited on an optically in-
Fig. 2.13 Distance dependence of the surface enhancement for Raman
scattering [solid line – Eq. (2.80)] and IR absorption [dotted line –
Eq. (2.81)]. The surface roughness as defined in Fig. 2.11 is assumed
to be a0 ¼ 20 nm in each instance.
2.3 Surface Enhanced Vibrational Spectroscopy 43
ert support display a morphology of interconnected islands corresponding to a
roughness similar to that created on massive electrodes by electrochemical proce-
dures. The incident broad-band radiation induces an oscillating dipole in the
metal islands which, in analogy to Eq. (2.76), leads to an increase in the electric
field in the near-field, and thus to an enhanced absorption by molecules that are
located in close proximity to the film. As only the electric field component per-
pendicular to the metal surface is enhanced, SEIRA signals are not detectable
for vibrations associated with dipole moment changes parallel to the surface.
The enhancement is distinctly smaller than for SERS as only the field of the inci-
dent radiation is enhanced. However, for this reason the distance-dependence is
not as steep because it scales only with the sixth power of the distance with re-
spect to the centre of the island (Fig. 2.13).
FSEIRAðdÞ ¼ FSEIRAð0Þ �a0
a0 þ d
� �6ð2:81Þ
Even though enhancement factors are only between 102 and 103, the sensitivity
gain of the SEIRA is large enough to apply this technique to biological molecules
as the signals are detected in the difference mode (Ataka and Heberle 2003,
2004).
Box 2A
Quantum mechanical treatment of the harmonic oscillator
Transformation of the mass-weighted Cartesian coordinates qi into normal coordi-
nates Qk is carried out such that Qk �Qk 0 cross terms are avoided in the expression
for the kinetic and the potential energies [see Eq. (2.24)] (Wilson et al. 1995). Thus
the kinetic energy T and the potential energy V are given by
T ¼ 1
2
X3N�6k¼1
_QQ2k (2:A1)
and
V ¼ 1
2
X3N�6k¼1
lkQ2k (2:A2)
in analogy to Eqs. (2.15 and 2.17).
Hence, the Schr€oodinger equation
� h2
8p2m‘2cþ VVc ¼ Ec (2:A3)
44 2 Theory of Infrared Absorption and Raman Spectroscopy
Box 2A (continued)
adopts the form
� h2
8p2
X3N�6k¼1
q2cv
qQ2k
þ 1
2
X3N�6k¼1
lk �Q2kcv ¼ Evcv (2:A4)
Solving this differential equation leads to the eigenvalues of the vibrational states
given by
Ev ¼ vþ 1
2
� �hnk (2:A5)
with the vibrational quantum number v ¼ 0; 1; 2 . . . : The eigenfunctions of Eq. (2.A4)
are expressed by
cv; k ¼ Nv; k �Hv; kðQkÞ � exp �1
2gkQ
2k
� �(2:A6)
where Nv; k is the normalisation constant
Nv; k ¼ffiffiffiffigk
p
r� 1
2v � v!
� �1/2(2:A7)
The quantity gk is defined by
gk ¼4 � p2nk
h(2:A8)
Hv; k denotes the Hermitian polynom, which varies with the vibrational quantum num-
ber v. Only for v ¼ 0 is it equal to 1, whereas for v0 0 it becomes a function of Qk
(Atkins 2006). For v ¼ 1, Hv; k is equal to Hv; k ¼ffiffiffiffigkp �Qk and the order of the poly-
nom in terms of Qk increases with increasing v. This corresponds to the increasing
number of nodes of the wavefunction and thus affects its symmetry.
The vibrational wavefunctions actually have to be expressed as a product of the
wavefunctions of the individual normal coordinates. However, the less exact treatment
employed here for the sake of simplicity is appropriate to demonstrate the essential
consequences for the IR, Raman, and resonance Raman selection rules (see also Box
2C). For a more thorough treatment the reader is referred to the literature (Herzberg
1945; Wilson et al. 1955).
2.3 Surface Enhanced Vibrational Spectroscopy 45

Box 2B
Symmetry of molecules and vibrations
The symmetry of molecules is defined by a set of operations, which, when applied to
the molecule, produce an identical copy (Cotton 1990). To illustrate these transforma-
tions we will consider the water molecule as a simple example (Fig. 2.B1). The three
atoms of the molecule define a plane sxz, which is a symmetry plane; i.e., reflection at
this plane leaves the molecule unchanged. A second plane of reflection sxy is perpen-
dicular to sxz and bisects the bond angle. Furthermore, the intersection of both planes
defines a rotational axis C2. Upon rotation of the molecule around this axis by 2p/n
(n ¼ 2; two-fold axis). Other molecules may exhibit higher order rotational axes (e.g.,
a three-fold axis C3 in the carbonate ion), a centre of inversion i (e.g., SF6 with the
sulfur atom being the centre of inversion), or a rotation–reflection plane Sn corre-
sponding to the rotation around an n-fold axis and the subsequent reflection at the
plane perpendicular to the rotational axis. The reflections s, rotations Cn, rotation–
reflections Sn, and the inversion I, in addition to the identity operation E which, just
as a formal operation, leaves the molecule unchanged, constitute groups of symmetry
operations that allows classification of all molecules into so-called point groups.
The simplest situation, which holds for many biological molecules, is given if noth-
ing other than the identity operation applies. These molecules, which lack any sym-
metry, belong to the point group C1. Nevertheless, there are also molecular groups of
biological interest of higher symmetry, or whose geometry can be approximated by a
point group of higher symmetry. Our example H2O, which possesses two mirror
planes and a two-fold rotational axis, belongs to the point group C2v. The properties
Fig. 2.B1 Symmetry operations of the C2v point group, illustrated
for the example of the water molecule. The two-fold rotational axis
is denoted by C2, the two mirror planes are indicated by sxz and syz.
46 2 Theory of Infrared Absorption and Raman Spectroscopy

Box 2B (continued)
of these groups and the implications for (vibrational) spectroscopy become evident
within the framework of group theory (Cotton 1990). Group theory by itself is a subject
of pure mathematics, but it can be applied to many different fields of physics and
physical chemistry. Therefore, all theorems used in the applications are based on for-
mal derivations. Nevertheless, we consider it important to demonstrate the benefits of
group theory by a more intuitive approach. Many aspects are taken from the book by
Wilson, Decius and Cross, in which the application of group theory to vibrational spec-
troscopy is treated extensively (Wilson et al. 1955).
All elements (all symmetry operations) of a point group can be represented by
matrices according to
x 0
y 0
z 0
0B@
1CA ¼ R11 R12 R13
R21 R22 R23
R31 R32 R33
0B@
1CA x
y
z
0B@
1CA (2:B1)
where Rij constitute the elements of the transformation matrix that transform the co-
ordinates of the molecule x, y, z into the coordinates x 0, y 0, and z 0. These transforma-
tions can be illustrated by the reflection at the zy plane (Fig. 2.B2). Whereas the z- and
y-coordinates remain unchanged, the x-coordinates just changes the sign such that
x 0 ¼ x. The transformation matrix is then given by
Fig. 2.B2 Transformation of P (solid circle) into P 0 (open circle)
by rotation around the z-axis (top) and by reflection through the
xz-plane (bottom).
2.3 Surface Enhanced Vibrational Spectroscopy 47

Box 2B (continued)
Rðsv; zyÞ ¼�1 0 0
0 1 0
0 0 1
0B@
1CA (2:B2)
For an n-fold rotational axis perpendicular to the yx-plane (Fig. 2.B2) one obtains
z 0 ¼ z
x 0 ¼ x � cos(2p/n)� y � sin(2p/n) (2:B3)
y 0 ¼ x � sin(2p/n)þ y � cos(2p/n)
such that the transformation matrix yields
R(Cn) ¼cos(2p/n) �sin(2p/n) 0
sin(2p/n) cos(2p/n)
0 0 1
0B@
1CA (2:B4)
These matrices describe the physical symmetry operations of the molecule.
As molecular vibrations involve distortions of the geometry, it is interesting to ask
how such distortions transform under the symmetry operations of the molecule. We
will take as an example the nitrate molecule, consisting of three oxygen atoms and
one nitrogen atom. The symmetry is the D3h point group (one 3-fold rotational axis,
one horizontal mirror plane, three vertical mirror planes, three two-fold rotational
axes, and the alternating 3-fold rotational axis obtained from the combination of the
normal three-fold axis with the horizontal mirror plane). The deformation of the mole-
cule is denoted by qI with i running from 1 to 3N (for nitrate it runs from 1 to 12). The
transformed displacements q j0 can be obtained for each symmetry operation by the
linear equations
q j0 ¼
X3Ni¼1
Rjiqi (2:B5)
Of course, the matrices Rji defined here are different from the 3� 3 matrices (2.B1)
describing the physical symmetry operations of the corresponding point group, al-
though they are closely related. They are ‘‘isomorphic’’ to each other. The 3N� 3N
matrices Rji (2.B5) are known as a representation of the point group, and the displace-
ments qi are termed the basis of this representation.
It can be shown that the matrix (2.B5) can be greatly simplified by a particular trans-
formation of the coordinate system according to
hi ¼X3Nj
aijq j (2:B6)
48 2 Theory of Infrared Absorption and Raman Spectroscopy
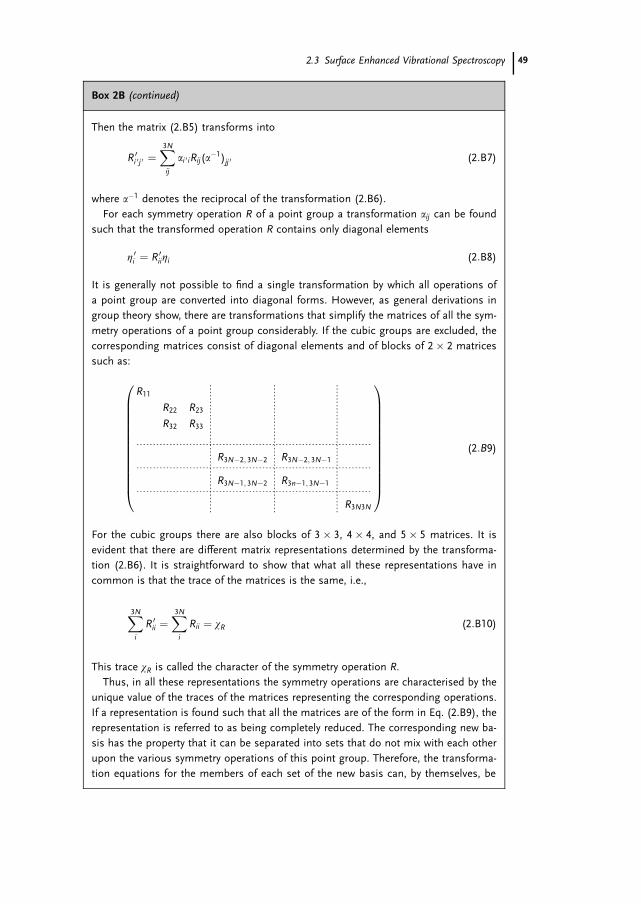
Box 2B (continued)
Then the matrix (2.B5) transforms into
R 0i 0 j 0 ¼X3Nij
ai 0 iRij(a�1)jj 0 (2:B7)
where a�1 denotes the reciprocal of the transformation (2.B6).
For each symmetry operation R of a point group a transformation aij can be found
such that the transformed operation R contains only diagonal elements
h 0i ¼ R 0iihi (2:B8)
It is generally not possible to find a single transformation by which all operations of
a point group are converted into diagonal forms. However, as general derivations in
group theory show, there are transformations that simplify the matrices of all the sym-
metry operations of a point group considerably. If the cubic groups are excluded, the
corresponding matrices consist of diagonal elements and of blocks of 2� 2 matrices
such as:
R11
R22 R23
R32 R33
R3N�2; 3N�2 R3N�2; 3N�1
R3N�1; 3N�2 R3n�1; 3N�1
R3N3N
0BBBBBBBBBBBBB@
1CCCCCCCCCCCCCA
(2:B9)
For the cubic groups there are also blocks of 3� 3, 4� 4, and 5� 5 matrices. It is
evident that there are different matrix representations determined by the transforma-
tion (2.B6). It is straightforward to show that what all these representations have in
common is that the trace of the matrices is the same, i.e.,
X3Ni
R 0ii ¼X3Ni
Rii ¼ wR (2:B10)
This trace wR is called the character of the symmetry operation R.
Thus, in all these representations the symmetry operations are characterised by the
unique value of the traces of the matrices representing the corresponding operations.
If a representation is found such that all the matrices are of the form in Eq. (2.B9), the
representation is referred to as being completely reduced. The corresponding new ba-
sis has the property that it can be separated into sets that do not mix with each other
upon the various symmetry operations of this point group. Therefore, the transforma-
tion equations for the members of each set of the new basis can, by themselves, be
2.3 Surface Enhanced Vibrational Spectroscopy 49
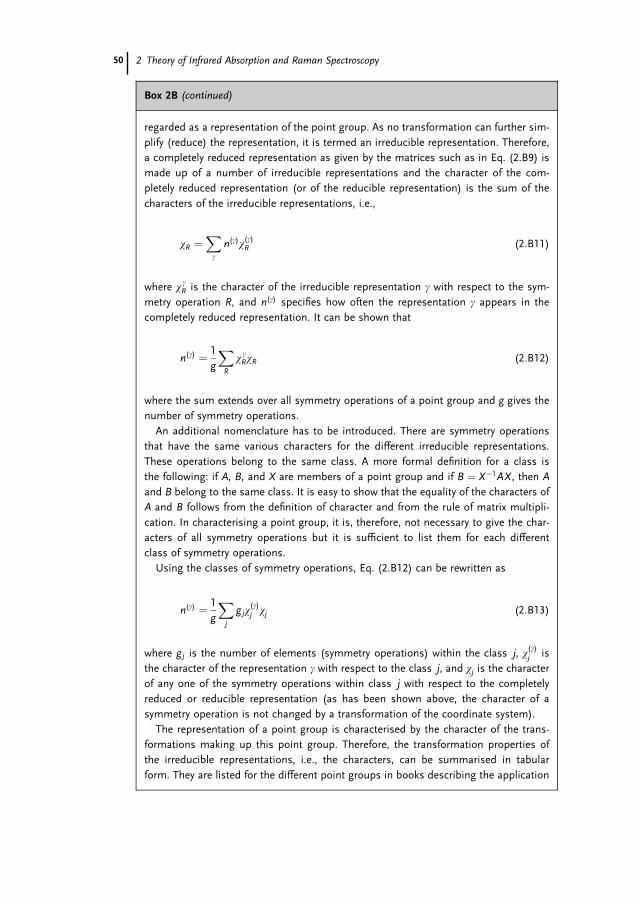
Box 2B (continued)
regarded as a representation of the point group. As no transformation can further sim-
plify (reduce) the representation, it is termed an irreducible representation. Therefore,
a completely reduced representation as given by the matrices such as in Eq. (2.B9) is
made up of a number of irreducible representations and the character of the com-
pletely reduced representation (or of the reducible representation) is the sum of the
characters of the irreducible representations, i.e.,
wR ¼Xg
n(g)w(g)R (2:B11)
where wgR is the character of the irreducible representation g with respect to the sym-
metry operation R, and n(g) specifies how often the representation g appears in the
completely reduced representation. It can be shown that
n(g) ¼ 1
g
XR
wgRwR (2:B12)
where the sum extends over all symmetry operations of a point group and g gives the
number of symmetry operations.
An additional nomenclature has to be introduced. There are symmetry operations
that have the same various characters for the different irreducible representations.
These operations belong to the same class. A more formal definition for a class is
the following: if A, B, and X are members of a point group and if B ¼ X�1AX , then A
and B belong to the same class. It is easy to show that the equality of the characters of
A and B follows from the definition of character and from the rule of matrix multipli-
cation. In characterising a point group, it is, therefore, not necessary to give the char-
acters of all symmetry operations but it is sufficient to list them for each different
class of symmetry operations.
Using the classes of symmetry operations, Eq. (2.B12) can be rewritten as
n(g) ¼ 1
g
Xj
g jw(g)j wj (2:B13)
where g j is the number of elements (symmetry operations) within the class j, w(g)j is
the character of the representation g with respect to the class j, and wj is the character
of any one of the symmetry operations within class j with respect to the completely
reduced or reducible representation (as has been shown above, the character of a
symmetry operation is not changed by a transformation of the coordinate system).
The representation of a point group is characterised by the character of the trans-
formations making up this point group. Therefore, the transformation properties of
the irreducible representations, i.e., the characters, can be summarised in tabular
form. They are listed for the different point groups in books describing the application
50 2 Theory of Infrared Absorption and Raman Spectroscopy

Box 2B (continued)
of group theory (e.g., Wilson et al. 1955). For the D3h point group, the character table
is
D3h E 2C3 3C2 sh 2S3 3sv
A01 1 1 1 1 1 1
A02 1 1 �1 1 1 �1E 0 2 �1 0 2 �1 0
A001 1 1 1 �1 �1 �1A002 1 1 �1 �1 �1 1
E 00 2 �1 0 �2 1 0
ð2:B14)
The symbol in the upper left corner denotes the point group. The first column contains
the various irreducible representations, in this case 6. The first row lists the various
symmetry operations (unity operation E, two rotations about the 3-fold axis, one hori-
zontal mirror plane sh, two alternating rotations about the 3-fold axis, and three verti-
cal mirror planes sv). The second column, describing the characters of the unity oper-
ation E for the various irreducible representations, gives the dimensionality of the
representation, i.e., the number of coordinates that may mix upon application of the
symmetry operations. The notation for the different representations is complex (Mulli-
can notation) and basically describes the symmetry properties upon certain basic sym-
metry operations of the different point groups. Here, it is sufficient to note that the
letters A and B refer to one-dimensional representations, the letters E and F to two-
dimensional and three-dimensional representations. Typically not all symmetry opera-
tions are listed, rather the classes together with the number of operations within the
particular class.
It is easy to see that for the D3h symmetry we obtain n(A01) ¼ 1; n(A002) ¼ 2;
n(E 0) ¼ 3; n(E 00) ¼ 1; n(A02) ¼ 1. It is important to mention that the D3h representation
of the displacements as the basis does not contain the A001 irreducible representation.
What is the connection for these symmetry considerations with vibrational spectros-
copy? It has been shown in Section 2.1.1 that the normal coordinates Qi involve a lin-
ear transformation such as (2.B6)
Qk ¼X
l ikqi (2:B15)
It is straightforward to show that these normal coordinates form part of the irreduci-
ble representations making up the basis set of the displacements (see Wilson et al.
1955). In general, there are 6 additional representations, 3 for the translational and 3
for the rotational movements of the molecule as a whole. Thus, the normal coordi-
nates Qi just transform as irreducible representations, and their symmetry properties
are given by the character table.
2.3 Surface Enhanced Vibrational Spectroscopy 51

Box 2B (continued)
We now can further specify the Mullican notation as given in the character tables,
for the C2v geometry of water [Eq. (2.B16)] or for the D3h symmetry of nitrate [Eq.
(2.B14)]. As already mentioned the letters A and B refer to one-dimensional, E to
two-dimensional, and F to three-dimensional representations. Totally symmetric repre-
sentations for which all characters are 1 are denoted by A, A1, or A1g. The subscript
‘‘g’’ is the abbreviation for ‘‘gerade’’ indicating the symmetry with respect to inversion
whereas ‘‘ungerade’’ representations (denoted by the subscript ‘‘u’’) are antisymmet-
ric toward this symmetry operation.
C2v E C2 sv(xz) sv(yz)
A1 1 1 1 1
A2 1 1 �1 �1B1 1 �1 1 �1B2 1 �1 �1 1
ð2:B16)
As an example, we can now discuss the symmetry properties for the normal modes of
H2O. The three normal modes are schematically represented in Fig. 2.B3. The stretch-
ing and bending modes n1 and n2 are symmetric (character þ1) with respect to all
symmetry operations, i.e., the rotation and the two reflections, and thus belong to the
(totally symmetric) representation A1 [Eq. (2.B16)]. The stretching mode n3, however,
is anti-symmetric (character �1) to the rotation and the reflection with respect to the
yz-plane, such that it is grouped into the B1 representation.
Such a classification of the normal modes according to the symmetry properties can
also be obtained by transforming internal coordinates into symmetry coordinates. For
the water molecule, this transformation is relatively simple assuming an approximate
expression for the potential energy
2V ¼ Fr(r21 þ r 22 )þ Faa
2 (2:B17)
where r1ðr2) and a are the stretching and bending coordinates, respectively. Fr and Fadenote the corresponding stretching and bending force constants, whereas interaction
force constants are neglected. If we now define symmetry coordinates according to
Fig. 2.B3 Illustration of the three normal modes of water. The arrows
qualitatively indicate the directions of displacements of the individual
atoms in the normal modes.
52 2 Theory of Infrared Absorption and Raman Spectroscopy

Box 2B (continued)
S1 ¼ a
S2 ¼1ffiffiffi2p (r1 þ r2) (2:B18)
S2 ¼1ffiffiffi2p (r1 � r2)
the potential energy [Eq. (2.B6)] is then expressed by
2V ¼ FaS21 þ FrS
22 þ FrS
23 (2:B19)
Correspondingly, the kinetic energy is given in terms of these symmetry coordinates
2T ¼ Ma_SS21 þ 2
ffiffiffi2p
Mar_SS1 _SS2 þ (Mrr þMr) _SS
22 þ (Mr �Mrr) _SS
23 (2:B20)
where Mi are the reduced masses which constitute the inverse G-matrix.
With Eqs. (2.B19 and 2.B20) one obtains the secular equation
Fa �Mal �ffiffiffi2p
Marl 0
�ffiffiffi2p
Marl Fr � (Mr þMrr)l 0
0 0 Fr � (Mr �Mrr)l
�������������� ¼ 0 (2:B21)
which factorises into two blocks, a 2� 2 matrix referring to the normal modes of the
A1 representation, and a 1� 1 matrix corresponding to the B1 mode.
An important goal of group theory applied to molecular vibrations is to determine
the number of normal modes n belonging to each irreducible representation g of the
point group. This procedure, which substantially facilitates the assignment of Raman
and infrared bands (vide infra), can be applied on the basis of Cartesian (displace-
ment) coordinates or internal (symmetry) coordinates. We have mentioned above
that the number of given irreducible representations appears in the completely re-
duced representation according to Eq. (2.B13), i.e.,
n(g) ¼ 1
g
Xj
g jw(g)j wj (2:B13)
This expression can be used to determine the number of normal modes in a certain
irreducible representation g, taking into account that expressions (2.B13) also contain
the 6 coordinates for translation and rotation. g j and w(g)j are obtained from the char-
acter tables such as Eqs. (2.B14 and 2.B16). wj has to be determined independently,
either by inspection of the effects of the symmetry operations on the displacement co-
ordinates, or by more efficient methods described in books on the application of
group theory.
2.3 Surface Enhanced Vibrational Spectroscopy 53

Box 2B (continued)
Let us consider the situation when the molecular vibrations are described in terms
of Cartesian displacement coordinates. It is clear that for a 3-atomic molecule wEequals 9 ð3N). For a three-atomic molecule such as H2O, the values of wj are deter-
mined to be �1, 3, and 1 for the symmetry operations C2, sv; xz, and sv; yz, respectively.
With Eq. (2.B13) we obtain
nðA1Þ ¼1
4(1 � 1 � 9� 1 � 1 � 1þ 1 � 1 � 3þ 1 � 1 � 1) ¼ 3
nðA2Þ ¼1
4(1 � 1 � 9� 1 � 1 � 1� 1 � 1 � 3� 1 � 1 � 1) ¼ 1
nðB1Þ ¼1
4(1 � 1 � 9þ 1 � 1 � 1þ 1 � 1 � 3� 1 � 1 � 1) ¼ 3
(2:B22)
nðB2Þ ¼1
4(1 � 1 � 9þ 1 � 1 � 1� 1 � 1 � 3þ 1 � 1 � 1) ¼ 2
which can be summarised by
G ¼ 3A1 þ A2 þ 3B1 þ 2B2 (2:B23)
Thus, altogether we have 9 modes corresponding to the 3N ¼ 9 degrees of freedom.
To sort out the ‘‘modes’’ of zero frequency, we have to consider the symmetry proper-
ties of the translational and rotational degrees of freedom. Translation of the molecule
in z-direction (Tz) is symmetric with respect to all symmetry operations such that Tz is
assigned to the A1 symmetry species. Translation in the x- and y-directions is symmet-
ric with respect to sv; xz and sv; yz, respectively, but both are antisymmetric with respect
to C2. Thus, Tx and Ty belong to the symmetry species B1 and B2, respectively. Corre-
spondingly, one can show that rotation around the z-axis Rz is symmetric with respect
to C2 but antisymmetric with respect to both reflections. Likewise, we find that Rx and
Ry are antisymmetric to C2 but symmetric to sv; zx and sv; zy, respectively, such that for
these molecular motions the assignment to the symmetry species is also straightfor-
ward. Thus, we subtract the translations and rotations from the respective symmetry
species to obtain the true number of vibrational normal modes. This approach is
readily applicable to larger molecules and, moreover, it also holds for the internal co-
ordinate system. In this way, it is possible to factorise the FG-matrix into blocks corre-
sponding to the various symmetry species involved. The translational (Tx ; Ty; Tz) and
rotational (Rx ;Ry;Rz) coordinates are usually included into the character table, so one
obtains for the C2v symmetry.
54 2 Theory of Infrared Absorption and Raman Spectroscopy

Box 2B (continued)
C2v E C2 s(xz) s(yz)
A1 1 1 1 1 TzA2 1 1 �1 �1 Rz
B1 1 �1 1 �1 Tx ; Ry
B2 1 �1 �1 1 Ty; Rx
ð2:B24)
For the real normal modes we obtain G(normal modes) ¼ 2A1 þ B1, as intuitively de-
rived for this simple molecule.
Box 2C
Symmetry-based selection rules
Symmetry considerations allow the determination of whether a normal mode Qk of
a molecule belonging to a certain point group ð0C1) is IR- or Raman-active. This es-
tablishes if the expressions for the transition dipole moment [Eq. (2.44)] and the scat-
tering tensor [Eq. (2.62)] are zero or non-zero. In symmetry terms this means: the
product, in which WW is the dipole moment or polarisability operator, must lead to a
symmetric function otherwise the integrals in Eqs. (2.44 and 2.62) vanish. Within the
framework of group theory (Cotton 1990; Wilson et al. 1955), the symmetry properties
of this product are expressed by the ‘‘direct product’’ of the irreducible representations
G ¼ Gn � GW � Gm (2:C1)
where Gn, Gm, and GW are the irreducible representations of the wavefunctions of the
initial, and the final states, and of the operator, respectively. The condition that the in-
tegral over the products in Eqs. (2.44 and 2.62) is non-zero requires that the direct
product has the totally symmetric irreducible representation.
Let us first consider the wavefunction of the vibrational ground state cn; k (v ¼ 0),
which we can express by the symmetric eigenfunction of the harmonic oscillator (see
Box 2A)
cn; k ¼ N0; k � exp �1
2gkQ
2k
� �(2:C2)
which is always totally symmetric. The actual ground state is the product of such func-
tions belonging to the various normal modes. However, because in a fundamental vi-
brational transition only one normal mode is involved, it is sufficient to consider only
the expression Eq. (2.C2). The situation is different if a transition to a combination
state has to be treated.
For the first vibrational excited state cm (v ¼ 1), however, the eigenfunction is given
by
2.3 Surface Enhanced Vibrational Spectroscopy 55
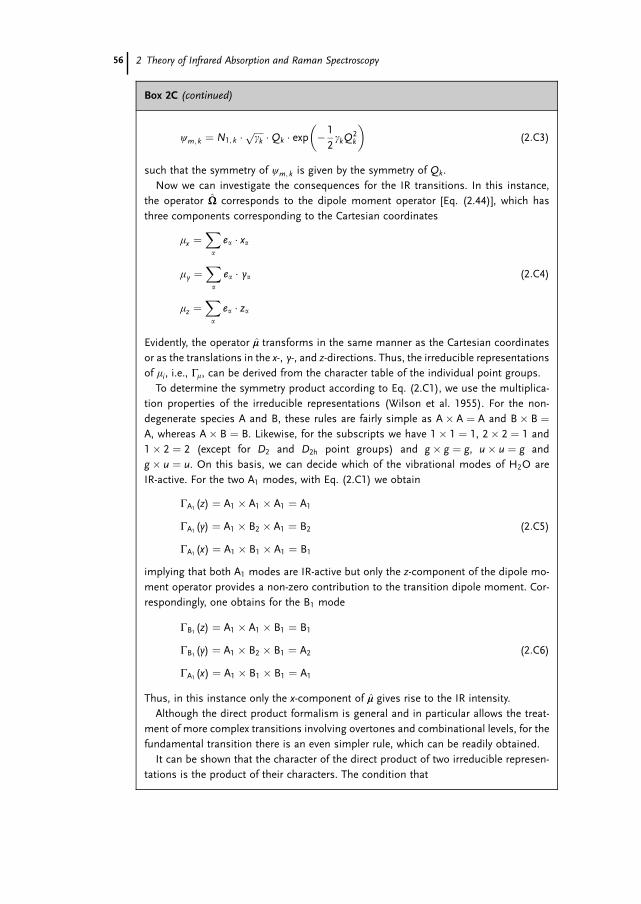
Box 2C (continued)
cm; k ¼ N1; k �ffiffiffiffigkp �Qk � exp �
1
2gkQ
2k
� �(2:C3)
such that the symmetry of cm; k is given by the symmetry of Qk.
Now we can investigate the consequences for the IR transitions. In this instance,
the operator WW corresponds to the dipole moment operator [Eq. (2.44)], which has
three components corresponding to the Cartesian coordinates
mx ¼Xa
ea � xa
my ¼Xa
ea � ya (2:C4)
mz ¼Xa
ea � za
Evidently, the operator mm transforms in the same manner as the Cartesian coordinates
or as the translations in the x-, y-, and z-directions. Thus, the irreducible representations
of mi, i.e., Gm, can be derived from the character table of the individual point groups.
To determine the symmetry product according to Eq. (2.C1), we use the multiplica-
tion properties of the irreducible representations (Wilson et al. 1955). For the non-
degenerate species A and B, these rules are fairly simple as A� A ¼ A and B� B ¼A, whereas A� B ¼ B. Likewise, for the subscripts we have 1� 1 ¼ 1, 2� 2 ¼ 1 and
1� 2 ¼ 2 (except for D2 and D2h point groups) and g � g ¼ g, u� u ¼ g and
g � u ¼ u. On this basis, we can decide which of the vibrational modes of H2O are
IR-active. For the two A1 modes, with Eq. (2.C1) we obtain
GA1(z) ¼ A1 � A1 � A1 ¼ A1
GA1(y) ¼ A1 � B2 � A1 ¼ B2 (2:C5)
GA1(x) ¼ A1 � B1 � A1 ¼ B1
implying that both A1 modes are IR-active but only the z-component of the dipole mo-
ment operator provides a non-zero contribution to the transition dipole moment. Cor-
respondingly, one obtains for the B1 mode
GB1(z) ¼ A1 � A1 � B1 ¼ B1
GB1(y) ¼ A1 � B2 � B1 ¼ A2 (2:C6)
GA1(x) ¼ A1 � B1 � B1 ¼ A1
Thus, in this instance only the x-component of mm gives rise to the IR intensity.
Although the direct product formalism is general and in particular allows the treat-
ment of more complex transitions involving overtones and combinational levels, for the
fundamental transition there is an even simpler rule, which can be readily obtained.
It can be shown that the character of the direct product of two irreducible represen-
tations is the product of their characters. The condition that
56 2 Theory of Infrared Absorption and Raman Spectroscopy
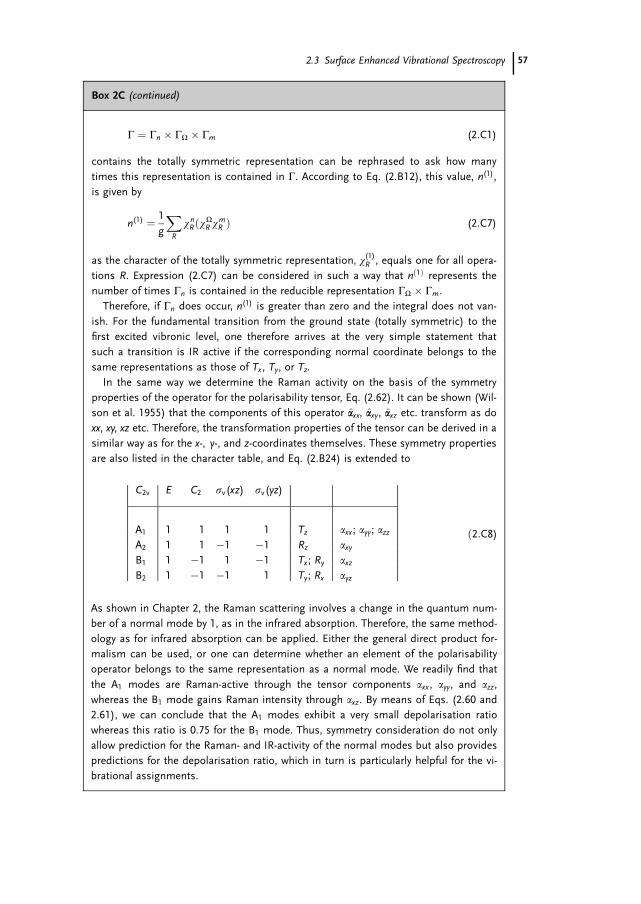
Box 2C (continued)
G ¼ Gn � GW � Gm (2:C1)
contains the totally symmetric representation can be rephrased to ask how many
times this representation is contained in G. According to Eq. (2.B12), this value, n(1),
is given by
n(1) ¼ 1
g
XR
wnRðwWR wmR Þ (2:C7)
as the character of the totally symmetric representation, w(1)R , equals one for all opera-
tions R. Expression (2.C7) can be considered in such a way that nð1Þ represents the
number of times Gn is contained in the reducible representation GW � Gm.
Therefore, if Gn does occur, n(1) is greater than zero and the integral does not van-
ish. For the fundamental transition from the ground state (totally symmetric) to the
first excited vibronic level, one therefore arrives at the very simple statement that
such a transition is IR active if the corresponding normal coordinate belongs to the
same representations as those of Tx , Ty, or Tz.
In the same way we determine the Raman activity on the basis of the symmetry
properties of the operator for the polarisability tensor, Eq. (2.62). It can be shown (Wil-
son et al. 1955) that the components of this operator aaxx, aaxy, aaxz etc. transform as do
xx, xy, xz etc. Therefore, the transformation properties of the tensor can be derived in a
similar way as for the x-, y-, and z-coordinates themselves. These symmetry properties
are also listed in the character table, and Eq. (2.B24) is extended to
C2v E C2 sv(xz) sv(yz)
A1 1 1 1 1 Tz axx ; ayy; azzA2 1 1 �1 �1 Rz axy
B1 1 �1 1 �1 Tx ; Ry axz
B2 1 �1 �1 1 Ty; Rx ayz
ð2:C8)
As shown in Chapter 2, the Raman scattering involves a change in the quantum num-
ber of a normal mode by 1, as in the infrared absorption. Therefore, the same method-
ology as for infrared absorption can be applied. Either the general direct product for-
malism can be used, or one can determine whether an element of the polarisability
operator belongs to the same representation as a normal mode. We readily find that
the A1 modes are Raman-active through the tensor components axx , ayy, and azz,
whereas the B1 mode gains Raman intensity through axz. By means of Eqs. (2.60 and
2.61), we can conclude that the A1 modes exhibit a very small depolarisation ratio
whereas this ratio is 0.75 for the B1 mode. Thus, symmetry consideration do not only
allow prediction for the Raman- and IR-activity of the normal modes but also provides
predictions for the depolarisation ratio, which in turn is particularly helpful for the vi-
brational assignments.
2.3 Surface Enhanced Vibrational Spectroscopy 57

Box 2C (continued)
Now we consider the RR activity. For the A-term [Eq. (2.68)], the RR intensity de-
pends on the electronic transition dipole moments M0GR and the Franck–Condon fac-
tor products hnrihrmi. As the vibrational quantum number for the initial and final
wavefunctions differs by one, either the left or the right integral would vanish for
non-totally symmetric modes. Thus, only totally-symmetric modes gain intensity via
the A-term, given that the origins of the potential curves in the ground and electronic
excited state are displaced with respect to each other. The second prerequisite for A-
term RR intensity is defined by the symmetry properties of M0GR
G ¼ GG � GW � GR (2:C9)
where the irreducible representation of the dipole moment operator GW corresponds
to that of the transition dipole moment as in the case of IR absorption [Eq. (2.C4)].
The electronic transition moment is non-zero if there is a component (in the x-, y-, or
z-direction) for which the direct product Eq. (2.C9) is totally symmetric.
As an example, we will discuss the p! p� electronic transitions of benzene, which
belongs to the D6h point group. The electronic configuration can be illustrated within
the H€uuckel approximation of molecular orbital theory (Fig. 2.C1). In the electronic
ground state, the three occupied p-orbitals are of a2u and e1g symmetry, leading to
the (a2u)2(e1g)
4 configuration. As all occupied orbitals are completely filled, the
Fig. 2.C1 Electronic structure (left) and energy diagram for the
electronic transitions (right) of benzene (Straughan and Walker
1976). The electronic structure is qualitatively described in terms of
the H€uuckel molecular orbital approximation.
58 2 Theory of Infrared Absorption and Raman Spectroscopy

Box 2C (continued)
ground state belongs to the totally symmetric species 1A1g where the superscript ‘‘1’’
indicates the singlet state. The lowest electronic excitation promotes an electron to
the e2u orbital resulting in the (a2u)2(e1g)
3(e2u)1 configuration (Fig. 2.C1). The direct
product of (e1g) and (e2u) then leads to symmetry properties of the three lowest ex-
cited states, i.e., 1B1u,1B2u, and
1E1u (considering only the singlet transitions). Thus,
the irreducible representation of the corresponding electronic transition dipole mo-
ments are evaluated according to Eq. (2.C9) using the irreducible representations of
the dipole moment operator that are A2u (z) and E1u (x; y) within the D6h point group.
It can be verified that only the product A1g � E1u � E1u leads to a totally symmetric
species implying that only the 1E1u 1A1g transition, which is localised in the x,y-
plane, is symmetry-allowed. This transition in fact gives rise to a strong absorption
band at ca. 180 nm and excitation in resonance with this transitions provides a strong
enhancement of the Raman bands originating from totally-symmetric A1g modes.
Now we will consider the symmetry-based selection rules for the B-term scattering
mechanism. When the excitation is in resonance with a weak electronically excited
state R, the Herzberg–Teller approximation (Albrecht 1961) applies and Eq. (2.69) is
transformed into
BG1
h
M0GSM
0GRHRS
nS � nR
Xr
hnjQkjrihrmiþ hnjrihrjQkjmi
nRr � nk � n0 þ iGR
� �(2:C10)
where HRS is the vibronic coupling integral describing the mixing between the reso-
nant excited state R and a second (allowed) excited state S, and nS and nR are the fre-
quencies of the corresponding 0! 0 excitations.
Again, we restrict the discussion to the transition from the vibrational ground state
n (with v ¼ 0) to the first vibrational excited state m (with v ¼ 1), and inspect the in-
dividual terms in Eq. (2.C10) separately. The vibrational integrals that include the nor-
mal coordinate Qk , i.e., hnjQkjri and hrjQkjmi, are only non-zero if the symmetry
product of Qk with cm; k or cr; k is totally-symmetric. In addition, the integrals hnjriand hrjmi must be non-zero, which is only fulfilled for cr; k having the same vibra-
tional quantum number as cn; k or cm; k. Finally, the integral HRS has to be large, which
is true for modes that can effectively couple the electronically excited states R and S.
Combining these three conditions, maximum enhancement via the B-term mechanism
is expected:
(i) for modes of the symmetry species given by the direct product of
the two electronic transitions that are involved
(ii) when the excitation line is in resonance with the weak 0! 0 or
0! 1 vibronic transition Rr
(iii) when the energy difference with respect to a second electronically
excited state S is small.
2.3 Surface Enhanced Vibrational Spectroscopy 59

References
Albrecht, A. C., 1961, ‘‘On the theory of
Raman intensities’’, J. Chem. Phys. 34,1476–1484.
Albrecht, A. C., Hutley, M. C., 1971, ‘‘On the
dependence of vibrational Raman intensity
on the wavelength of incident light’’,
J. Chem. Phys. 55, 4438–4443.Ataka, K., Heberle, J., 2003,
‘‘Electrochemically induced surface-
enhanced infrared difference absorption
(SEIDA) spectroscopy of a protein mono-
layer’’, J. Am. Chem. Soc. 125, 4986–4987.Ataka, K., Heberle, J., 2004, ‘‘Functional
vibrational spectroscopy of a cytochrome cmonolayer: SEIDAS probes the interaction
with different surface-modified electrodes’’,
J. Am. Chem. Soc. 126, 9445–9457.Atkins, P., 2006, ‘‘Physical Chemistry’’, Oxford
University Press, Oxford.
Blair, D. F., Campbell, G. W., Schoonover,
J. R., Chan, S. I., Gray, H. B., Malmstrom,
B. G., Pecht, I., Swanson, B. I., Woodruff,
W. H., Ch., W. K., English, A. M., Fry,
H. A., Lunn, V., Norton, K. A., 1985,
‘‘Resonance Raman studies of blue copper
proteins: Effect of temperature and isotope
substitutions. Structural and thermo-
dynamic implications’’, J. Am. Chem. Soc.107, 5755–5766.
Cotton, F. A., 1990, ‘‘Chemical Applications ofGroup Theory’’, Wiley, New York.
Curry, B., Palings, I., Broek, A. D., Pardoen,
J. A., Lugtenburg, J., Mathies, R., 1985,
‘‘Vibrational analysis of the retinal
isomers’’, in Adv. Infrared and RamanSpectrosc. 12, Clark, R. J. H., Hester, R. E.
(Eds.), chap. 3, Wiley, Heyden, New York.
Czernuszewicz, R. S., Spiro, T. G., 1999,
‘‘IR, Raman, and resonance Raman
spectroscopy’’, in Inorganic ElectronicStructure and Spectroscopy, Solomon, E. I.,
Lever, A. B. P. (Eds.), Vol. 1, Wiley, New
York, pp. 353–441.
Fogarasi, G., Zhou, X., Taylor, P. W., Pulay,
P., 1992, ‘‘The calculation of ab-initiomolecular geometries: Efficient optimiza-
tion by natural internal coordinates and
empirical corrections of offset forces’’,
J. Am. Chem. Soc. 114, 8191–8201.Heller, E. J., 1981, ‘‘The semi-classical way to
molecular spectroscopy’’, Acc. Chem. Res.14, 368–375.
Herzberg, G., 1945, ‘‘Molecular Spectra andMolecular Structure: II, Infrared and RamanSpectra of Polyatomic Molecules’’, VanNostrand Reinhold, New York.
Hildebrandt, P., Stockburger, M., 1984,
‘‘Surface enhanced resonance Raman
spectroscopy of Rhodamine 6G adsorbed
on colloidal silver’’, J. Phys. Chem. 88,5935–5944.
Kerker, M., Wang, D. S., Chew, S., 1980,
‘‘Surface enhanced Raman scattering
(SERS) by molecules adsorbed on spherical
particles’’, Appl. Opt. 19, 4159–4273.Kneipp, K., Moskovits, M., Kneipp, H. (Eds.),
2006, ‘‘Surface-enhanced Raman scattering:
Physics and applications’’, Topics Appl.Phys. 103, Springer, Berlin.
Li, X.-Y., Czernuszewicz, R. S., Kincaid, J. R.,
Spiro, T. G., 1989, ‘‘Consistent porphyrin
force field. 3. Out-of-plane modes in the
resonance Raman spectra of planar and
ruffled nickel octaethylporphyrin’’, J. Am.Chem. Soc. 111, 7012–7023.
Li, X.-Y., Czernuszewicz, R. S., Kincaid, J. R.,
Su, Y. O., Spiro, T. G., 1990a, ‘‘Consistent
porphyrin force field. 1. Normal mode
analysis for nickel porphine and nickel
tetraphenylporphine from resonance
Raman and infrared spectra and isotope
shifts’’, J. Phys. Chem. 94, 31–47.Li, X.-Y., Czernuszewicz, R. S., Kincaid, J. R.,
Stein, P., Spiro, T. G., 1990b, ‘‘Consistent
porphyrin force field. 2. Nickel octaethyl-
porphyrin skeletal and substituent mode
assignments from 15N, meso-d4, and
methylene-d16 Raman and infrared isotope
shifts’’, J. Phys. Chem. 94, 47–61.Magdo, I., Nemeth, K., Mark, F., Hildebrandt,
P., Schaffner, K., 1999, ‘‘Calculation of
vibrational spectra of linear tetrapyrroles.
Global sets of scaling factors for force fields
derived by ab-initio and density functional
theory methods’’, J. Phys. Chem. A 103,
289–303.
Mie, G., 1908, ‘‘Beitrage zur Optik truber
Medien, speziell kolloidaler Metallosun-
gen’’, Ann. Physik 25, 377–445.Moskovits, M., 1985, ‘‘Surface-enhanced
spectroscopy’’, Rev. Mod. Phys. 57, 783–826.Mroginski, M. A., Hildebrandt, P., Kneip, C.,
Mark, F., 2003, ‘‘Excited state geometry
calculations and the resonance Raman
60 2 Theory of Infrared Absorption and Raman Spectroscopy
spectrum of hexamethylpyrromethene’’,
J. Mol. Struct. 661–662, 611–624.Mroginski, M. A., Nemeth, K., Bauschlicher,
T., Klotzbucher, W., Goddard, R.,
Heinemann, O., Hildebrandt, P., Mark, F.,
2005, ‘‘Calculation of vibrational spectra of
linear tetrapyrroles. 3. Hydrogen bonded
hexamethylpyrromethene dimers’’, J. Phys.Chem. A 109, 2139–2150.
Murgida, D. H., Hildebrandt, P., 2004,
‘‘Electron transfer processes of cytochrome
c at interfaces. New insights by surface-
enhanced resonance Raman spectroscopy’’,
Acc. Chem. Res. 37, 854–861.Murgida, D. H., Hildebrandt, P., 2005,
‘‘Redox and redox-coupled processes
of heme proteins and enzymes at
electrochemical interfaces’’, Phys. Chem.Chem. Phys. 7, 3773–3784.
Osawa, M., 1997, ‘‘Dynamic processes in
electrochemical reactions studied by
surface-enhanced infrared absorption
spectroscopy (SEIRAS)’’, Bull. Chem. Soc.Jpn. 70, 2861–2880.
Otto, A., 2001, ‘‘Theory of first layer and
single molecule surface enhanced Raman
scattering (SERS)’’, Phys. Stat. Sol. A 188,
1455–1470.
Peticolas, W. L., Rush, T., 1995, ‘‘Ab-initiocalculation of the ultraviolet resonance
Raman spectra of Uracile’’, J. Comp. Chem.16, 1261–1270.
Placzek, G., 1934, ‘‘Rayleigh-Streuung
und Raman-Effekt’’, in Handbuch derRadiologie, Vol. VI, Marx, E. (Ed.),
chap. 3, Akademische Verlagsanstalt,
Leipzig.
Rauhut, G., Pulay, P., 1995, ‘‘Transferable
scaling factors for density functional
derived vibrational force fields’’ J. Phys.Chem. 99, 3093–3100.
Straughan, B. P., Walker, S. (Eds.), 1976,
‘‘Spectroscopy’’, Chapman and Hall,
London.
Warshel, A., Dauber, P., 1977, ‘‘Calculations
of resonance Raman spectra of conjugated
molecules’’, J. Chem. Phys. 66, 5477–5488.
Wilson, E. B., Decius, J. C., Cross, P. C.,
1955, ‘‘Molecular Vibrations: The Theory ofInfrared and Raman Vibrational Spectra’’,McGraw-Hill, New York.
References 61
