surface-enhanced infrared...
TRANSCRIPT

Surface-Enhanced Infrared Absorption
Masatoshi Osawa
Catalysis Research Center, Hokkaido UniversitySapporo 060-0811, [email protected]
Abstract. Molecules adsorbed on metal island films or particles exhibit 10–1000times more intense infrared absorption than would be expected from conventionalmeasurements without the metal. This effect is referred to as surface-enhancedinfrared absorption (SEIRA) to emphasize the similarities with surface-enhancedRaman scattering (SERS). The electromagnetic interactions of the incident photonfield with the metal and molecules play predominant roles in this effect. The chem-ical interactions of the molecules with the surface can give additional enhancement.The enhancement mechanisms and some applications of SEIRA.
1 Introduction
The optical properties of molecules are dramatically changed when they areadsorbed on rough metal surfaces, metal island films, or metal particles. Thebest-known example is surface-enhanced Raman scattering (SERS), in whichthe Raman scattering of molecules is enhanced by millions of times comparedwith free molecules [1,2,3,4]. A quite similar effect occurs in the mid-infraredregion: molecules on metal surfaces show infrared absorption 10–1000 timesmore intense than would be expected from conventional measurements with-out the metal [5,6,7,8]. This effect is referred to as surface-enhanced infraredabsorption (SEIRA) to emphasize the analogy to SERS.
Since the discovery of this effect in 1980 [5], a number of SEIRA spectrahave been observed on various metals. The SEIRA effect is characterized asfollows:
1. Enhanced spectra can be observed in the transmission [9,10], attenuated-total-reflection (ATR) [5,6,7], external-reflection [11], and diffuse-reflectionmodes [12]. In ATR and external-reflection measurements, the observedband intensities depend on the polarization and angle of incidence of theinfrared radiation [11,13,14].
2. The enhancement depends greatly on the morphology of the metalsurface [15]. Vacuum-evaporated [5,6,7] and electrochemically deposited[16,17,18,19] metal island films, and metal colloids [20,21] are good en-hancers. In the case of island films, the largest enhancement is observedwhen the islands are densely crowded but not touching each other.
3. Both physisorbed and chemisorbed molecules exhibit enhancement. Ingeneral, chemisorbed molecules show a larger enhancement than ph-ysisorbed molecules.
S. Kawata (Ed.): Near-Field Optics and Surface Plasmon Polaritons,Topics Appl. Phys. 81, 163–187 (2001)c© Springer-Verlag Berlin Heidelberg 2001

164 Masatoshi Osawa
4. The enhancement is significant for the first monolayer directly attachedto the surface and decays sharply within about 5 nm from the sur-face [10,22,23,24,25].
5. Vibrational modes that have dipole moment derivative components per-pendicular to the surface are preferentially enhanced [26]. This surfaceselection rule is the same as that in the so-called infrared reflection ab-sorption spectroscopy [27]. The molecular orientation can be determinedby using the surface selection rule [28,29,30].
6. Metal island films that exhibit SEIRA have a very broad absorption ex-tending from the visible to the mid-infrared, on which the enhanced ab-sorption bands of the adsorbed molecules are superposed [10]. There existsa linear relationship between the absorption of the metal and the enhance-ment [10,15].
At least two different mechanisms, the electromagnetic (EM) and chemicalmechanisms, are supposed to contribute to the total enhancement [10,31,32]as in the case of SERS [1,2,3,4]. The infrared absorption (A) may be writtenas
A ∝ |∂µ/∂Q · E|2 = |∂µ/∂Q|2|E|2 cos2 θ (1)
where ∂µ/∂Q is the derivative of the dipole moment with respect to a normalcoordinate Q, E is the electric field that excites the molecule, and θ is theangle between ∂µ/∂Q and E. It should be noted that the intensity of theelectric field |E|2 at the surface is not the same as that of the incident photonfield: a coupling of the incident photon field to the metal surface can enhancethe field [1,2,3,4,33,34]. The EM mechanism assumes an increase of the localelectric field at the surface [8,26,35]. The experimental evidence that theenhancement extends to several monolayers away from the surface providesa strong argument that a relatively short-ranged enhanced EM field (i.e. thenear field) contributes to the SEIRA effect. On the other hand, the chemicalmechanism assumes an increase of |∂µ/∂Q|2 (i.e. the absorption coefficient)due to chemical interactions between the molecule and the metal surface. Forexample, CO chemisorbed on metal surfaces has an absorption coefficient2–6 times larger than condensed CO (i.e. overlayers) [36,37,38]. Adsorbedmolecules are often oriented in a specific direction with respect to the surface.Since the space average of cos2 θ is 1/3 for randomly oriented molecules, theorientation effect gives an additional enhancement by a factor of three atmaximum for vibrational modes that have dipole changes parallel to E.
SEIRA spectroscopy (SEIRAS) is now appearing with a wide range of ap-plications. Infrared spectroscopy has been established as a routine molecule-specific technique for qualitative and quantitative purposes. However, therelatively low absorption coefficients of molecules in the infrared region limitits use in many applications. Therefore, SEIRAS techniques that lower thedetection limit of infrared spectroscopy are of great interest. Trace amountof molecules, ranging from picograms to nanograms [9,39,40], and very

Surface-Enhanced Infrared Absorption 165
thin organic and bioorganic films, including Langmuir–Blodgett films andself-assembled monolayers (SAMs) [22,41,42,43,44,45] have been analyzed.SEIRAS can also be used for chemical sensing [18,45,46,47,48]. Since finemetal particles have high catalytic activity in many reactions, SEIRAS is verypromising for catalysis research [16,17,19,49,50,51]. Surfaces of nonmetallicmaterials, such as polymers, semiconductors, glass, human skin, and agri-cultural products, can also be analyzed by this technique [11,52,53]. Amongseveral applications, great success has been achieved in its application todynamic studies of electrochemical interfaces [8,25,54,55,56,57,58].
2 Enhancement Mechanisms
2.1 Electromagnetic Mechanism
Vacuum-evaporated thin metal films are used most frequently for SEIRA ex-periments. Thin metal films that show strong SEIRA are not continuous butconsist of metal islands smaller than the wavelength of light, as shown inFig. 1. The sample shown here is a 10 nm thick (in mass thickness) Ag filmon Si. The average dimension of the islands is about 30 nm. If the islands aremodeled by ellipsoids of rotation, the aspect ratio of the islands (the ratioof the major to the minor diameter) ranges from 3 to 5. The density, shape,and size of the islands depend on the mass thickness, the evaporation condi-tions, and the chemical nature of the substrate [15]. As the mass thicknessincreases, the islands grow in size, contact each other, and eventually form acontinuous film. Connection of the islands significantly reduces the enhance-ment, suggesting that the small metal islands play an important role in theenhancement.
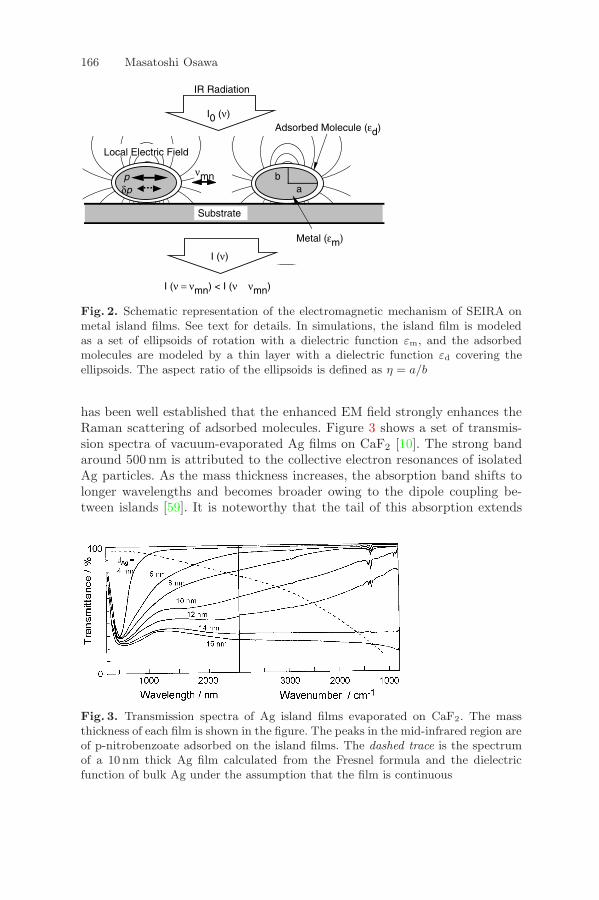
The metal islands are polarized by the incident photon field through theexcitation of collective electron resonance, or localized plasmon, modes, andthe dipole p induced in an island generates a local EM field stronger than theincident photon field around the island [2,3,33,34], as illustrated in Fig. 2. Adetailed theoretical treatment of the local EM field has been given in [33]. It
Fig. 1. SEM image of a 10 nm thick Ag film vacuum-evaporated on Si
166 Masatoshi Osawa
p b a
Local Electric Field
Substrate
δp
I0 (ν)
Metal (εm)
Adsorbed Molecule (εd)
IR Radiation
I (ν)
νmn
I (ν = νmn) < I (ν νmn)
Fig. 2. Schematic representation of the electromagnetic mechanism of SEIRA onmetal island films. See text for details. In simulations, the island film is modeledas a set of ellipsoids of rotation with a dielectric function εm, and the adsorbedmolecules are modeled by a thin layer with a dielectric function εd covering theellipsoids. The aspect ratio of the ellipsoids is defined as η = a/b
has been well established that the enhanced EM field strongly enhances theRaman scattering of adsorbed molecules. Figure 3 shows a set of transmis-sion spectra of vacuum-evaporated Ag films on CaF2 [10]. The strong bandaround 500 nm is attributed to the collective electron resonances of isolatedAg particles. As the mass thickness increases, the absorption band shifts tolonger wavelengths and becomes broader owing to the dipole coupling be-tween islands [59]. It is noteworthy that the tail of this absorption extends
Fig. 3. Transmission spectra of Ag island films evaporated on CaF2. The massthickness of each film is shown in the figure. The peaks in the mid-infrared region areof p-nitrobenzoate adsorbed on the island films. The dashed trace is the spectrumof a 10 nm thick Ag film calculated from the Fresnel formula and the dielectricfunction of bulk Ag under the assumption that the film is continuous

Surface-Enhanced Infrared Absorption 167
well into the mid-infrared region. The observed spectra are very differentfrom the spectrum shown by the dashed line, which was calculated usingthe dielectric function of bulk Ag and the Fresnel formula [60] under the as-sumption that the film is continuous. This result suggests that the collectiveelectron resonance is excited even in the mid-infrared region and that theenhanced EM field enhances the infrared absorption of adsorbed molecules.A contribution of such EM effect to SEIRA was suggested also by the linearrelationship between the enhanced band intensity and the average EM fieldintensity within the metal film [13,14].
The intensity of the enhanced EM field decays sharply as the distance fromthe surface (d) increases, as represented by the following equation [33,61]:
|Elocal|2 ∝(
a
a+ b
)6
, (2)
where a is the local radius of curvature of the island. In addition, the localEM field is essentially polarized along the surface normal at every point onthe surface of the islands [34] (Fig. 2). Therefore, this model is quite conve-nient for explaining the relatively short-ranged enhancement and the surfaceselection rule. However, the EM field enhancement theoretically estimatedis only ten-fold or less in the mid-infrared region [10,43] owing to the largeimaginary part of the dielectric constants of metals (i.e. the strong dampingof localized plasmon modes). Therefore, the total enhancement of up to 1000cannot be explained by this field enhancement only.
In the case of SERS on island films, the Raman-scattered light polar-izes the metal islands and strong Raman scattered light is emitted from thedipoles induced in the metal islands [1,2,3,4,33]. A similar situation may beconsidered in SEIRA; that is, adsorbed molecules induce additional dipolesδP in the metal islands and perturbe the optical properties of the metal.Since the perturbation is larger at vibrational frequencies of the moleculethan at other frequencies, the spectrum of the metal island film should benearly identical to the spectrum of the molecule. The absorption coefficientsof metal islands are smaller than those of the corresponding bulk metals inthe infrared region, as revealed by infrared spectroscopic ellipsometric mea-surements [62], but are still larger than those of molecules. In addition, thevolume of the metal in the island film is much larger than that of a monolayeradsorbate. Consequently, the vibrational spectrum of the adsorbate will beobserved much more strongly than would be expected from conventional mea-surements without the metal. That is, a metal island is believed to functionas an amplifier in SEIRA. The linear relationship between the band intensityof the adsorbed molecule and the background absorption of the metal can beunderstood with this assumption.
If the system is assumed to be a continuous composite film consisting ofmetal particles, adsorbed molecules, and voids (or host medium), the trans-mittance or reflectance of the composite film can be calculated easily by

168 Masatoshi Osawa
using the Fresnel equations [60]. The effective (i.e. space-averaged) dielectricfunction of the composite film can be connected with the polarization suscep-tibility (α) of the metal islands by using an effective-medium approximation(EMA) [63]. For the sake of simplicity, a metal island film is modeled as a setof ellipsoids of rotation with a uniform size, as shown in Fig. 2. The rotationaxis is perpendicular to the surface. The molecules are assumed to cover theellipsoid surfaces uniformly.
Among several models, the EMAs proposed by Maxwell-Garnett (MG)[64] and Bruggemann (BR) [65] are the best known. In the MG model, theeffective dielectric function, εMG, is connected with α by the following equa-tion [63].
εMG = εh
(3 + 2Fα
3− Fα
), (3)
where F is the filling factor of the metal within the composite layer and εh
is the dielectric constant of the surrounding host medium. The value of αfor an ellipsoid coated with molecules can be expressed as a function of thedielectric functions of the bulk metal (εm), the adsorbed molecule (εd), andthe host as follows [66]:
α‖,⊥ ={
x
y
}‖,⊥
, (4)
x = (εd − εh)[εmL1 + εd(1 − L1)] +Q(εm − εd)[εd(1− L2) + εhL2] ,y = [εdL2 + εh(1−L2)][εmL1 + εd(1−L1)]+Q(εm − εd)(εd − εh)L2(1−L2),
where Q is the ratio of the volume of the core to the volume of the coatedparticle (= V1/V2), through which the size of the particle and the thicknessof the adsorbed layer can be incorporated into the calculation. The depolar-ization factors of the core and the coated ellipsoid (L1 and L2, respectively)are solely a function of the aspect ratio of the ellipsoid η (= a/b; a and b arethe radius along the major and minor axes of the ellipsoid, respectively) [67].The subscripts ‖ and ⊥ refer to the cases where the applied electric field ofthe incident light is parallel (‖) and perpendicular (⊥), respectively, to thesubstrate surface.
The MG model includes weak interactions between the islands onlythrough the Lorentz field and thus provides a good description for very thinisland films in which the metal islands are well separated from each other.When the islands are densely packed (i.e. for thicker island films), dipole in-teractions between islands cannot be neglected. In such a case, the BR modelprovides a better approximation. In the BR model, the effective dielectricfunction is represented as [63]
εBR = εh3(1− F ) + Fα′
3(1− F )− 2Fα′ , (5)

Surface-Enhanced Infrared Absorption 169
This model assumes that the metal islands are embedded in the effectivemedium [65]. Thus, α and εh in (5) must be replaced by α′ and εBR, respec-tively, in this case.
Transmission spectra of a model molecule layer on 5 and 8 nm thick Agisland films simulated with both the MG and the BR models, are shown bythe solid curves in Fig. 4 [26]. The thickness of the adsorbed molecular layerand the particle size (2a) were assumed to be 1 and 25 nm, respectively. Thefilling factors were taken from experimental data [68]. The dielectric functionof Ag was calculated from the Drude model,
εm(ω) = 1− ω2p
ω(ω + i/τ), (6)
where the plasma frequency ωp equals 1.15 × 10¹⁶ s−1 and the relaxationtime τ is 1 × 10⁻¹⁵ s for Ag [69]. The dielectric function of the adsorbedmolecule was approximated by a damped harmonic dipole given by
εd(ν) = ε′(ν) + ε′′(ν) ,
ε′(ν) = n2∞ +
B(ν20 − ν2)
(ν20 − ν2)2 + γ2ν2
,
ε′′(ν) =Bγν
(ν20 − ν2)2 + γ2ν2
, (7)
where ν is the frequency in wavenumbers (cm−1), n∞ is the refractive indexat a frequency far from the band center ν0, and γ is the bandwidth. B isa constant related to the band intensity. These parameters were tentatively
Fig. 4. SEIRA spectra of a model molecule adsorbed on Ag island films simulatedby using the Maxwell-Garnett (a) and Bruggemann (b) effective-medium models.The mass thickness of the Ag film is 5 nm for (a) and 8 nm for (b). The dashedtrace is the spectrum of a molecular layer on the substrate (CaF2) without a metalfilm. η represents the aspect ratio of the metal ellipsoid (Fig. 2). See text for details

170 Masatoshi Osawa
assumed to be n∞ = 1.77, B = 30000 cm−2, ν0 = 1700 cm−1, and γ =20 cm−1.
The dashed spectra in the figure correspond to a molecular layer formeddirectly on the substrate (CaF2) without a metal film. The simulations clearlydemonstrate that the molecular vibrations are observable very strongly in thepresence of metal islands and that the enhancement depends on the shape ofthe islands (i.e. on η). For the 5 nm thick Ag film (Fig. 4a), the intensity forη = 1 (sphere) is as small as that without metal islands, but increases with η.For η = 3 (a typical value for vacuum-evaporated 5 nm thick Ag films), theenhancement factor, defined by the ratio of band intensities with and withouta metal, is about 15. Larger enhancement factors are calculated with the BRmodel for the 8 nm thick Ag film (Fig. 4b). This factor reaches about 150for η = 3. Such a large enhancement cannot be calculated if the MG modelis used instead of the BR model, implying that interactions between metalislands play an important role in SEIRA. This result may be consistent withthe fact that the tail of the collective electron resonance extends well into themid-infrared region for thicker films owing to the dipole interactions betweenthe islands (Fig. 3).
The enhancement factors calculated here are slightly smaller than the ex-perimental values for the symmetric NO2 stretching mode of p-nitrobenzoateadsorbed on Ag island films (about 50 and 500 at Ag thickness of 5 and 8 nm,respectively) [10]. Since this molecule is known to be oriented with the C2
axis perpendicular to the surface, an enhancement factor of (15–150) × 3 =45–450 can be calculated for this mode by taking the orientation effect intoaccount. This value is in reasonable agreement with the experiments.
The EM model can also simulate well some SEIRA spectra measured withthe ATR and external-reflection geometries [11,70].
Despite the large simplification, the EM model explains well several char-acters intrinsic to SEIRA. The solid curve in Fig. 5 shows the band intensityof a model molecular layer calculated with the MG EMA as a functionofits thickness (dmol) [35]. The intensity rises sharply as dmol increases andthen decreases slightly, whereas it increases linearly with dmol on a metal-free substrate, as shown by the dashed line (the Lambert–Beer law). Theresult clearly demonstrates that the enhancement is a short-range effect lim-ited to a few nanometers away from the surface. It should be noted that theEM simulation can be applied only to small dmol values, because the voidsbetween metal islands are completely filled with molecules at a certain dmol
and further deposited molecules form an overlayer on the composite layer.Hence, the experimentally observable curve of intensity versus dmol shouldbe the sum of the solid curve and the dashed line. The simulation is in goodagreement with several experiments [10,22,23,24,25].
SERS, which is observed in the visible and near-infrared regions, is sig-nificant on free-electron metals (Au, Ag, and Cu) but is hardly observableon transition metals owing to the strong damping of plasmon modes (i.e. the

Surface-Enhanced Infrared Absorption 171
Fig. 5. Simulated peak intensity of a model molecule on a 5 nm thick Au island filmplotted as a function of the thickness of the molecular layer, dmol. The dashed lineis the result without the metal film. The experimentally observable dependence ofthe band intensity on dmol represented by the sum of the two components shown
large imaginary part of the dielectric constant) [1,2,3]. In contrast, the EMcalculations predict an enhancement of infrared absorption on transition met-als as strong as that on coinage metals [26]. In fact, several recent experimentshave demonstrated the SEIRA effect on many other metals such as Pt, Pd,Rh, Ru, Ir, Sn, Fe, In, Pb, and Pt–Fe alloys [16,17,19,32,49,50,70,71,72,73].Since the dielectric constants of these metals do not differ greatly from thoseof coinage metals in the infrared region, these results may be a reasonableconsequence.
Asymmetric and bipolar (i.e. derivative-like) band shapes are often ob-served in SEIRA spectra [19,32,49]. In some cases, molecular vibrations areobserved as negative absorption peaks, i.e. as reflectance maxima [16,17,19].Very recently, it has been demonstrated that such spectral features can besimulated with the an EM calculation using the Bergman EMA [19].
2.2 Chemical Mechanisms
Molecules chemisorbed on a metal surface show a larger enhancement than dophysisorbed molecules, suggesting some chemical effect between the moleculeand the surface. It is known that the absorption coefficients of chemisorbedmolecules are larger than those of condensed overlayers [38]. Interactionsbetween adsorbed molecules also affect the intensity [36,37]. Some theoriespredict that charge oscillations between molecular orbitals and the metal sur-face enlarge the absorption coefficients of adsorbates by ‘intensity borrowing’from the charge-oscillations [36,37,74]. There exist some experimental resultsthat seem to support such chemical mechanism [32,75,76]. For example, COadsorbed on Fe island films evaporated on MgO(001) shows a very asymmet-ric SEIRA band [32]. An enhancement factor of about 100 was estimated forthis system. The band shape and enhancement were theoretically explainedby assuming a Fano-type resonance of the molecular vibration with electronictransitions between the metal and the adsorbate [32]. The simulation agrees

172 Masatoshi Osawa
quite well with the observed spectra and the enhancement factor of 100 wasascribed to the chemical origin. Nevertheless, it should be noted that theasymmetric band shape can be explained also by an EM mechanism [19] asdescribed previously. In addition, the chemical enhancement factor of 100is one order of magnitude larger than that observed for CO on bulk metalsurfaces (where the factor is less than 10). Although the difference in the elec-tronic conditions between the island metal surface and the bulk metal surfacemight have a strong effect on the enhancement, the details are still unclear.Further theoretical and experimental studies of the chemical mechanism arenecessary.
3 Electrochemical Dynamics Monitored by SEIRAS
Recent research in electrochemistry has increasingly involved the use of sur-face-sensitive analytical techniques in combination with conventional electro-chemical techniques. The chief reason for this development is that electro-chemical techniques inevitably measure the sum of all surface processes. Theresults primarily provide kinetic information, and no direct molecular infor-mation on the species involved in the reactions can be obtained. SEIRAS hasbeen applied very successfully to examine molecular events occurring at theelectrochemical interface. The achievements before 1997 have been reviewedin [8]. In this section, the basic aspects of this technique are summarized firstand then some recent developments are described.
3.1 Experimental Technique
So far, the so-called infrared reflection absorption spectroscopy (IR-RAS)technique (Fig. 6a) has been used for in situ infrared studies of the electro-chemical interface [77]. P-polarized infrared radiation passing through thesolution phase is reflected at the electrode surface at a high incidence angle.The working electrode is pushed against an infrared-transparent cell windowto reduce the strong absorption of the electrolyte solution. The thickness ofthe solution layer between the electrode and the window is typically 1–10µm. An advantage of this technique is that well-defined single-crystals canbe used as working electrodes, as well as poly-crystals. However, this tech-nique has two serious problems when it is used for dynamic studies. One isthat the thin-layer structure of the cell prevents mass transportation betweenthe thin-layer and the reservoir, and the system does not respond quickly tochanges of the externally applied potential owing to the large solution re-sistance. Hence, this technique can be used only under static or quasi-staticconditions. The other is the interference from the bulk solution. Althoughthe solution layer is very thin, it is still much thicker than a monolayer onthe electrode. Thus the signal from the adsorbate is superposed on the so-lution background, which is about three orders of magnitude stronger. The

Surface-Enhanced Infrared Absorption 173
Fig. 6. In situ monitoring of the electrochemical interface with IR-RAS (a) andATR-SEIRAS (b)
solution background can be removed to a large extent by measuring potentialdifference spectra [77], but its complete subtraction is very difficult.
These problems intrinsic to IR-RAS can be removed by using the ATRconfiguration illustrated in Fig. 6b. A thin metal film deposited on a prism (Si,Ge, or ZnSe) is used as the working electrode. The infrared radiation passedthrough the prism is totally reflected at the electrode/electrolyte interface.Since the evanescent wave penetrates only a few hundred nanometers intothe solution phase [78], it is not necessary for the solution phase to be thinand further the solution background can be significantly reduced comparedwith that in IR-RAS. On the contrary, the absorption of species adsorbedon the electrode surface is enhanced by the SEIRA effect. Consequently, thesignals from the adsorbate and solution are comparable in this configuration,which facilitates the complete subtraction of the solution background [70].
The details of the experimental setup and procedures have been describedin [70,79]. Although the electrodes used in ATR-SEIRAS must be island films,relatively thick (15–20 nm) island films prepared by vacuum evaporation havea conductivity good enough for electrochemistry. It should be noted thatslow deposition of the metal is crucial in preparing SEIRA-active thin-filmelectrodes by vacuum evaporation [15]. Evaporated metal films are generallypolycrystalline, except for Au. The Au surface has a tendency such that facetswith (111) crystallographic orientation preferentially appear on the surfacewhen it is evaporated very slowly. A short (about 10 s) annealing of the film

174 Masatoshi Osawa
with a hydrogen–oxygen flame accelerates the recrystallization of the surfacetoward the (111) orientation [80]. A prolonged annealing of the film generallyreduces the enhancement. The electrodes are used after cleaning their surfacein the solution by repeated potential sweeps between the surface oxidationand hydrogen evolution potentials. Oxidation–reduction cycles in solutionscontaining halogen ions, which are very often used for observing SERS [1,3],are not recommended, to avoid complex electrochemistry. The surface can bekept clean for several hours if ultrapure water and chemicals are used.
3.2 Comparison of ATR-SEIRAS and IR-RAS
The ATR-SEIRAS technique has been applied very successfully to severalelectrochemical systems [8,28,29,30,49,50,56,57,58,80,81,82,83]. To highlightthe difference between IR-RAS and ATR-SEIRAS, infrared spectra of pyri-dine adsorbed on Au electrodes measured with the two techniques [28,84] arecompared in Fig. 8. The electrode used in the IR-RAS measurements wasan Au(111) single-crystal, whereas in the ATR-SEIRAS measurement it wasa vacuum-evaporated preferentially (111)-oriented 20 nm thick Au film. Theinfrared reflection absorption (IR-RA) spectra are represented by the relativereflectance change, defined as ∆R/R = (Rsample −Rref)/Rref , where Rsample
and Rref are the reflectivities of the electrode at the sample and referencepotentials, respectively. On the other hand, the ATR spectra are representedin absorbance units, defined by A = −log(Rsample/Rref). In both measure-ments, the reference potential was –0.75 V versus a saturated calomel elec-trode (SCE), at which potential the molecule is totally desorbed from thesurface. Therefore, the adsorbate on the electrodes gives down-going bandsin the IR-RA spectra and up-going bands in the SEIRA spectra.
Several adsorbate bands are clearly identifiable in both sets of spectra,but the band intensities in the ATR spectra are about 20 times greater thanthose in the IR-RA spectra. Note that ∆R/R = 0.0005 corresponds to 0.0002absorbance units. Of course, the difference in surface area between the single-crystal and island film electrodes contributes to the different intensities. How-ever, the roughness factor of the island film, estimated by electrochemicaltechniques, was only about 2.5. Considering that IR-RAS has a sensitivityover 10 times higher than transmission spectroscopy [27], an enhancementfactor of about 100 or more is estimated for the evaporated Au electrode.
The IR-RA spectrum is characterized by a strong up-going band at 1445cm−1. Since the adsorption of the molecule onto the electrode surface reducesits concentration in the thin solution layer, the up-going band is ascribed topyridine in the solution. Pyridine in the solution has another strong bandat 1594 cm−1, which deforms the spectral features around 1600 cm−1. Thedown-going band at 1601 cm−1 is a ghost produced by the superposition ofthe up-going solution band at 1594 cm−1 and down-going band of adsorbedpyridine at 1593 cm−1.

Surface-Enhanced Infrared Absorption 175
Fig. 7. IR-RA and ATR-SEIRA spectra of pyridine adsorbed on an Au(111) single-crystal electrode (a) [84] and on a vacuum-evaporated (111)-oriented 20 nm thickAu film electrode (b) [29], respectively. Solutions: (a) 0.1 M KClO4 + 3 mM pyri-dine, (b) 0.1 M NaClO4 + 1 mM pyridine. The Reference potential was 0.75 Vversus SCE in both measurements
The ATR-SEIRAS technique is free from this problem and only the vibra-tional modes of adsorbed pyridine are observed owing to its higher surface-sensitivity. Even the very weak band at 1448 cm−1 located very close tothe solution band can be identified. In the SEIRA spectrum, a very broadnegative-going band, assignable to the bending mode of water, is observed at1620 cm−1, which is not seen in the IR-RA spectrum because D2O was usedas the solvent to avoid strong interference from the solution. This band de-creases in intensity with increasing potential, concomitantly with the growthof the pyridine bands. Thus, this band can be ascribed to water moleculesthat were removed from the interface by pyridine adsorption. This explana-tion is supported by the considerably lower frequency of this band than thatof bulk water (1645 cm−1) [79,81]. The observation of water molecules at theinterface also demonstrates the high surface-sensitivity of this technique.
In summary, the ATR-SEIRAS technique is useful for observing only theinterface without interference from the solution. On the other hand, IR-RAScan provides information on molecules both at the interface and in the bulksolution, although the superposition of the bands of both species often makesthe spectral analysis difficult except in cases where the spectrum of the ad-sorbate is greatly changed by adsorption.
When solution bands are well separated from adsorbate bands, they canbe used for semi-quantitative estimation of the amount of molecules adsorbedon the surface [84]. The intensity of the 1445 cm−1 band in Fig. 7a was shown

176 Masatoshi Osawa
to be proportional to the Gibbs surface excess (Γ ) of pyridine determined bychronocoulometry.
On the other hand, the intensities of adsorbate bands are usually not pro-portional to the surface coverage, as shown in Fig. 8. The intensity of the1597 cm−1 band in Fig. 7b (circles in Fig. 8) does not track the Γ versuspotential curve (solid line) [85]. Although pyridine adsorption occurs at po-tentials more positive than –0.7 V, this band is observed at potentials morepositive than –0.4 V, where Γ reaches a plateau. On the basis of the sur-face selection rule, the result is interpreted as showing that the pyridine ringis parallel to the surface at negative potentials and rises up as the poten-tial increases. This potential-dependent reorientation of pyridine deduced bySEIRAS has been confirmed by in situ scanning tunneling microscopy [28].
Fig. 8. The intensity of the 1599 cm−1 band in Fig. 7b plotted as a function of thepotential (circles). The solid line represents the Gibbs surface excess (Γ ) of pyridinemeasured as a function of the applied potential, which was taken from [85]
3.3 Time-Resolved Monitoring of Electrode Dynamics
Since the signal-to-noise ratio of a spectrum is proportional to the squareroot of the number of interferograms added together (in the case of FT-IRspectroscopy), one will recognize immediately that the high sensitivity ofATR-SEIRAS facilitates real-time or time-resolved monitoring of dynamicprocesses at the interface. The quick response of the electrochemical cell inthe ATR configuration is also quite convenient for such measurements. Ingeneral, a signal-to-noise ratio good enough for detailed analysis of mono-layer adsorbates can be obtained by adding fewer than 50 interferograms,which requires acquisition times of less than 10 s for most FT-IR spectrome-ters. For strongly absorbing molecules, high-quality spectra can be obtained

Surface-Enhanced Infrared Absorption 177
without addition of interferograms. The short acquisition time enables usto accumulate a series of spectra successively under potential-sweep condi-tions together with electrochemical data. If the reactions to be investigatedare reversible or repeatable, they can be monitored with microsecond time-resolution by using a step–scan FT-IR technique [54,56,58]. By applying two-dimensional correlation analysis (i.e. the so-called 2D-IR analysis) to a seriesof time-resolved spectra, detailed information on the reactions and dynamicsthat is not readily accessible with conventional one-dimensional spectra canbe extracted [55,81].
A comparison of spectral and electrochemical data is quite importantfor obtaining deeper insights into electrochemistry [25,28,29,56,58,82]. As anexample, a time-resolved SEIRA study of underpotential deposition of Cuon an Au(111) surface is shown in Fig. 9 [58]. Underpotential deposition is aphenomenon in which a monolayer or submonolayer amount of metal atomsis adsorbed on the surfaces of a different metal at a potential more positivethan the equilibrium potentials. The inset in Fig. 9a shows a typical cyclicvoltammogram for an Au(111) electrode in 0.1 M H2SO4 containing 1 mM
Fig. 9. (a) Current transient for a potential step from 0.45 to 0.6V at an Au(111)electrode in 0.1 M H2SO4 containing 1 mM CuSO4, and (b) the simultaneouslymeasured transient of the band intensity of sulfate adsorbed on the electrode. Theinfrared data were taken from a series of ATR-SEIRA spectra measured with a 1mstime-resolution. The inset shows a cyclic voltammogram recorded at a scan rate of2mVs−1

178 Masatoshi Osawa
CuSO4. Adsorption and desorption of Cu adatoms and sulfate ions providesthe current flow. The sharp cathodic peaks at 0.5 and 0.33V correspond tothe formation of well-ordered phases. The two anodic peaks correspond to thereverse processes. The ordered phase formed in the potential range between0.4 and 0.5V is called the honeycomb (
√3×√
3) phase, in which two-thirdsof a monolayer (ML) amount of Cu adatoms are arranged in a honeycombstructure and one-third of a monolayer ML amount of sulfate anions arecoadsorbed in the center of the honeycomb (see Fig. 10).
Figure 9a shows the current transient for the dissolution of the honeycomb(√3×√
3) phase triggered by a potential step from 0.45 to 0.6V. The transientcurve can be simulated by a combination of two kinetic terms as follows:
j(t) = k1 exp(−k2t) + k3t exp(−k4t2) . (8)
The first term (curve I) corresponds to a Langmuir (i.e. random) process,and the second term (curve II) to a nucleation-and-growth process. The timeconstants k2 and k4 are 49 s−1 and 193 s−2, respectively. This simulation in-dicates that the dissolution of the honeycomb (
√3×√
3) phase takes place viatwo different successive processes, but conventional electrochemical measure-ments do not provide any detailed molecular information on these processes.Figure 9b represents the corresponding transient of the band intensity ofcoadsorbing sulfate, which was taken from a series of SEIRA spectra mea-sured with a time-resolution of 1 ms. This transient can be simulated with a
Fig. 10. Schematic representation of the dissolution dynamics of the honeycomb(√3×√
3) phase on an Au(111) electrode surface deduced from the data shown inFig. 9. One half of the Cu adatoms and all sulfate ions are desorbed in step 1 withLangmuir kinetics. The remaining half of the Cu adatoms are desorbed in step 2with nucleation-and-growth kinetics

Surface-Enhanced Infrared Absorption 179
single Langmuir term with a rate constant of 35 s−1, which is nearly identicalto that of the first process found in the current transient. The results indicatethat sulfate ions are totally desorbed from the surface in the initial processand that the subsequent process involves desorption of Cu adatoms only. Byintegrating curves I and II in Fig. 9a, the charge densities passing during thefirst and second processes have been measured to be 85 and 125 µC cm−2,respectively. A charge density of 125 µC cm−2 corresponds to that requiredfor desorption of 1/3 ML of Cu adatoms (one-half of the Cu adatoms in thehoneycomb phase). Accordingly, it is concluded that 1/3 ML of Cu and allsulfate ions are desorbed in the initial process, and then the remaining 1/3ML of Cu adatoms is desorbed in the subsequent process. The smaller chargedensity of 85 µC cm−2 for the initial process is accounted by the superposi-tion of a negative charge of 40 µC cm−2 required for desorption of the sulfate.The processes are schematically represented in Fig. 10.
3.4 A New Approach to Electrode Dynamics
When the electrode potential is changed, current flows across the interface tocharge-up the double-layer. The time-constant for the double-layer charging istypically a few milliseconds for electrodes of ordinary size (millimeter to cen-timeter in diameter). Owing to the interference from the double-layer charg-ing current, reactions that have time-constants equivalent to or smaller thanthat of the double-layer charging cannot be examined by conventional elec-trochemical techniques. Fortunately, spectroscopic measurements are not in-terfered with by the double-layer charging. Molecular absorption/desorptionat electrodes within the time-region of the double-layer charging has been in-vestigated by ATR-SEIRAS with a 100 µs time-resolution [56]. The change ofthe actual potential across the interface during the double-layer charging hasalso been measured from spectral changes of a SAM of 4-mercaptopyridineon Au [57].
Since electrochemical reactions are limited by double-layer charging, dif-fusion, and several other slow processes, it is impossible to determine rateconstants of faster processes by any time-domain approaches. To overcomethis limitation, measurements in the frequency domain are often used in elec-trochemistry. In ac impedance spectroscopy, for example, the potential ismodulated and the phase shift of the corresponding current flow with respectto the modulation is measured, from which kinetic parameters can be ob-tained. However, reactions with rate constants larger than ∼ 103s−1 cannotbe measured even with this method, owing to the double-layer charging. Sincespectroscopic measurements are not interfered with by the double-layer charg-ing, very fast processes should be accessible if electrochemical measurementsare replaced by spectroscopic measurements. This idea has been realized inthe UV–visible region [86]. Unfortunately, the molecular specificity of UV–visible spectroscopy is not high enough. The use of FT-IR spectroscopy has
180 Masatoshi Osawa
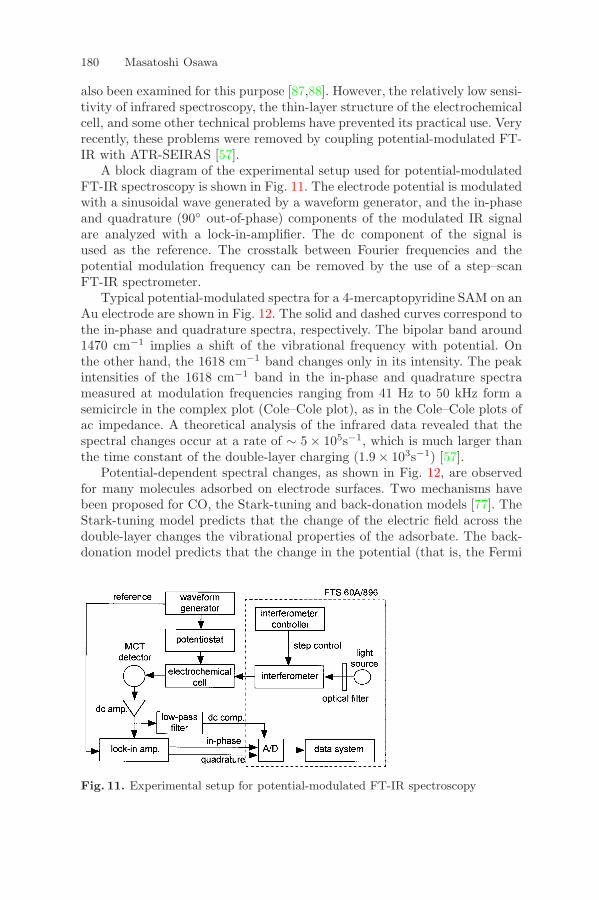
also been examined for this purpose [87,88]. However, the relatively low sensi-tivity of infrared spectroscopy, the thin-layer structure of the electrochemicalcell, and some other technical problems have prevented its practical use. Veryrecently, these problems were removed by coupling potential-modulated FT-IR with ATR-SEIRAS [57].
A block diagram of the experimental setup used for potential-modulatedFT-IR spectroscopy is shown in Fig. 11. The electrode potential is modulatedwith a sinusoidal wave generated by a waveform generator, and the in-phaseand quadrature (90◦ out-of-phase) components of the modulated IR signalare analyzed with a lock-in-amplifier. The dc component of the signal isused as the reference. The crosstalk between Fourier frequencies and thepotential modulation frequency can be removed by the use of a step–scanFT-IR spectrometer.
Typical potential-modulated spectra for a 4-mercaptopyridine SAM on anAu electrode are shown in Fig. 12. The solid and dashed curves correspond tothe in-phase and quadrature spectra, respectively. The bipolar band around1470 cm−1 implies a shift of the vibrational frequency with potential. Onthe other hand, the 1618 cm−1 band changes only in its intensity. The peakintensities of the 1618 cm−1 band in the in-phase and quadrature spectrameasured at modulation frequencies ranging from 41 Hz to 50 kHz form asemicircle in the complex plot (Cole–Cole plot), as in the Cole–Cole plots ofac impedance. A theoretical analysis of the infrared data revealed that thespectral changes occur at a rate of ∼ 5× 10⁵s−1, which is much larger thanthe time constant of the double-layer charging (1.9× 10³s−1) [57].
Potential-dependent spectral changes, as shown in Fig. 12, are observedfor many molecules adsorbed on electrode surfaces. Two mechanisms havebeen proposed for CO, the Stark-tuning and back-donation models [77]. TheStark-tuning model predicts that the change of the electric field across thedouble-layer changes the vibrational properties of the adsorbate. The back-donation model predicts that the change in the potential (that is, the Fermi
Fig. 11. Experimental setup for potential-modulated FT-IR spectroscopy

Surface-Enhanced Infrared Absorption 181
Fig. 12. In-phase (solid lines) and quadrature (dashed lines) spectra of a 4-mercaptopyridine self-assembled monolayer on an Au thin-film electrode in 0.1 MHClO4 measured by potential-modulated FT-IR spectroscopy at the modulationfrequencies indicated in the figure
level of the electrode surface) changes the amount of charge back-donatedfrom the metal to the 2π∗ orbital of CO, resulting in the spectral changes. Ifthe Stark-tuning effect is dominant, the rate of the spectral changes shouldbe the same as that of the double-layer charging (i.e. of the actual potentialchange at the interface). If this is not the case, the rate may be different(presumably, much faster). In the case of 4-mercaptopyridine, the rate ofthe spectral changes is much faster than that of the double-layer charging,indicating that the charge-transfer mechanism rather than the Stark-tuningmechanism contributes to the spectral changes.
4 Summary and Remarks
In summary, SEIRA is a phenomenon similar to SERS and is characterizedby a 10–1000 times enhancement of the infrared absorption of molecules ad-sorbed on metal island films or small metal particles. The local electric fieldaround the metal islands produced by the coupling of the incident photonfield with the metal excites an adsorbed molecule. The excited molecule per-turbs the optical properties of the metal, and the molecular vibrations areobserved through a change of the transmittance or reflectance of the islandfilm. Since the absorption coefficient and volume fraction of the metal arelarger than those of the molecules, the molecular vibrations can be observedmore strongly than would be expected from conventional measurements with-

182 Masatoshi Osawa
out the metal. Molecular vibrations that change the dipole moment alongthe surface normal are selectively enhanced. Preferential orientation of themolecules on the surface provides an additional enhancement by a factor ofthree at maximum. Chemical interactions of molecules with the surface cangive additional enhancement, but the details are still unclear. Among severalapplications, SEIRAS has been applied most successfully to electrochemicalsystems. Thanks to developments in FT-IR instrumentation and data anal-ysis techniques such as 2D-IR, SEIRAS has enabled us to study electrodedynamics that is not readily accessible by conventional electrochemical tech-niques.
Despite twenty years of history, SEIRA has received less attention thanSERS. This is probably due to the smaller enhancement factor of SEIRA.However, infrared spectroscopy basically has a higher sensitivity than Ramanspectroscopy, and hence the sensitivities of SEIRAS and SERS are compa-rable. It is emphasized that SEIRAS and SERS are not competitive but aresupplementary to one other, as in the case of normal infrared and Ramanspectroscopy. A comparison of SEIRA and SERS spectra is very helpful fordetailed analysis of both spectra [42,44,72]. The use of SEIRAS in tandemwith other analytical techniques will also be very fruitful for surface chemistryand surface electrochemistry, as described in Sect. 3.2. In electrochemistry,the combined use of SEIRAS and STM is becoming popular [28,29,30,83,89].
References
1. R. K. Chang , T. E. Furtak, Surface Enhanced Raman Scattering (Plenum, NewYork 1982) 163, 164, 167, 171, 174
2. H. Metiu, Surface Enhanced Spectroscopy, Prog. Surf. Sci. 17, 153-320 (1984)163, 164, 165, 167, 171
3. M. Moskovits, Surface-enhanced spectroscopy, Rev. Mod. Phys. 57, 783–826(1985) 163, 164, 165, 167, 171, 174
4. A. Otto, I. Mrozeck, H. Grabhorn, W. Akemann, Surface-enhanced Ramanscattering, J. Phys. Condens. Matter 4, 1143–1212 (1992) 163, 164, 167
5. A. Hartstein, J. R. Kirtley, J. C. Tsang, Enhancement in the infrared absorptionfrom molecular monolayers with thin metal overlayers, Phys. Rev. Lett. 45,201–204 (1980) 163
6. A. Hatta, T. Ohshima, W. Suetaka, Observation of the enhanced infrared ab-sorption of p-nitrobenzoate on Ag island films with an ATR technique, J. Appl.Phys. A 29, 71–75 (1982) 163
7. A. Hatta, Y. Suzuki, W. Suetaka, Infrared absorption enhancement of mono-layer species on thin evaporated Ag films by use of a Kretschmann configura-tion, Evidence for two types of enhanced surface electric fields, Appl. Phys. A35, 135–140 (1984) 163
8. M. Osawa, Dynamic processes in electrochemical reactions studied by surface-enhanced infrared absorption spectroscopy (SEIRAS), Bull. Chem. Soc. Jpn.70, 2861–2880 (1997) 163, 164, 165, 172, 174

Surface-Enhanced Infrared Absorption 183
9. Y. Nishikawa, K. Fujiwara, T. Shima, A Study of the qualitative and quantita-tive analysis of nanogram samples by transmission infrared spectroscopy withthe use of silver island films, Appl. Spectrosc. 45, 747–751 (1991) 163, 164
10. M. Osawa, M. Ikeda, Surface-enhanced infrared absorption of p-nitrobenzoicacid deposited on silver island films: contribution of electromagnetic and chem-ical mechanisms, J. Phys. Chem. 95, 9914–9919 (1991) 163, 164, 166, 167,170
11. Y. Nishikawa, K. Fujiwara, K. Ataka, M. Osawa, Surface-enhanced externalreflection spectroscopy at low reflective surfaces and its application to surfaceanalysis of semiconductors, glasses, and polymers, Anal. Chem. 65, 556–562(1993) 163, 165, 170
12. S. J. Lee, K. Kim, Diffuse reflectance infrared spectra of stearic acid self–assembled on fine silver particles, Vib. Spectrosc. 18, 187–201 (1998) 163
13. M. Osawa, M. Kuramitsu, A. Hatta, W. Suetaka, H. Seki, Electromagneticeffect in enhanced infrared absorption of adsorbed molecules on thin metalfilms, Surf. Sci. Lett. 175, L787–L793 (1986) 163, 167
14. Y. Suzuki, M. Osawa, A. Hatta, W. Suetaka, Mechanism of absorption en-hancement in infrared ATR spectra observed in the Kretschmann configuration,Appl. Surf. Sci. 33/34, 875–881 (1988) 163, 167
15. Y. Nishikawa, T. Nagasawa, K. Fujiwara, M. Osawa, Silver island films forsurface-enhanced infrared absorption spectroscopy: effect of island morphologyon the absorption enhancement, Vib. Spectrosc. 6, 43–53 (1993) 163, 164, 165,173
16. G.-Q. Lu, S.-G. Sun, S. P. Chen, L.-R. Cai, Novel properties of dispersed Pt andPd thin layers supported on GC for CO adsorption studied using in situ MS–FTIR reflection spectroscopy, J. Electroanal. Chem. 421, 19–23 (1997) 163,165, 171
17. G.-Q. Lu, S.-G. Sun, L.-R. Cai, S.-P. Chen, Z.-W. Tian, In situ FTIR spectro-scopic studies of adsorption of CO, SCN–, and poly(o–phenylenediamine) onelectrodes of nanometer thin films of Pt, Pd, and Rh: Abnormal infrared effects(AIREs), Langmuir 16, 778–786 (2000) 163, 165, 171
18. H. D. Wanzenbock, B. Mizaikoff, N. Weissenbacher, R. Kellner, Surface en-hanced infrared absorption spectroscopy (SEIRA) using external reflection onlow-cost substrates, Fresenius J. Anal. Chem. 362, 15–20 (1998) 163, 165
19. A. E. Bjerke, P. R. Griffiths, W. Theiss, Surface-enhanced infrared absorptionof CO on platinized platinum, Anal. Chem. 71, 1967–1974 (1999) 163, 165,171, 172
20. S. Y. Kang, I. C. Jeon, K. Kim, Infrared absorption enhancement at silvercolloidal particles, Appl. Spectrosc. 52, 278–283 (1998) 163
21. J. A. Seelenbinder, C. W. Brown, P. Pivarnik, A. G. Rand, Colloidal goldfiltrates as a metal substrates for surface-enhanced infrared absorption spec-troscopy, Anal. Chem. 71, 1963–1966 (1999) 163
22. T. Kamata, A. Kato, J. Umemura, T. Takenaka, Intensity enhancement ofinfrared attenuated total reflection spectra of stearic acid Langmuir–Blodgettmonolayers with evaporated silver island films, Langmuir 3, 1150–1154 (1987)164, 165, 170
23. A. Hatta, N. Suzuki, Y. Suzuki, W. Suetaka, Infrared absorption of poly-cyanoacrylate enhanced by Ag island films in the Kretschmann’s ATR geome-try, The coverage dependence, Appl. Surf. Sci. 37, 299–305 (1989) 164, 170

184 Masatoshi Osawa
24. E. Johnson, R. Aroca, Surface-enhanced infrared spectroscopy of monolayers,J. Phys. Chem. 99, 9325–9330 (1995) 164, 170
25. M. Osawa, K. Yoshii, In situ and real–time surface-enhanced infrared study ofelectrochemical reactions, Appl. Spectrosc. 51, 512–518 (1997) 164, 165, 170,177
26. M. Osawa, K. Ataka, K. Yoshii, Y. Nishikawa, Surface-enhanced infrared spec-troscopy: the origin of the absorption enhancement and band selection rulein the infrared spectra of molecules adsorbed on fine metal particles, Appl.Spectrosc. 47, 1497–1502 (1993) 164, 169, 171
27. F. M. Hoffmann, Infrared reflection-absorption spectroscopy of adsorbedmolecules, Surf. Sci. Rep. 3, 107-192 (1983) 164, 174
28. W.-B. Cai, L.-J. Wan, H. Noda, Y. Hibino, K. Ataka, M. Osawa, Orientationalphase transition in a pyridine adlayer on gold(111), Langmuir 14, 6992–6998(1998) 164, 174, 176, 177, 182
29. H. Noda, T. Minoha, L.-J. Wan, M. Osawa, Adsorption and ordered phaseformation of 2,2’-bypyridine on Au(111): a combined surface-enhanced infraredand STM study, J. Electroanal. Chem. 481, 62–68 (2000) 164, 174, 175, 177,182
30. L.-J. Wan, M. Terashima, H. Noda, M. Osawa, Molecular orientation and or-dered structure of benzenethiol adsorbed on gold(111), J. Phys. Chem. B 104,3563–3569 (2000) 164, 174, 182
31. G. T. Merklin, P. R. Griffith, Influence of chemical interactions on the surface-enhanced infrared absorption spectrometry of nitrophenols on copper and silverfilms, Langmuir 13, 6159–6163 (1997) 164
32. O. Krauth, G. Fahsold, A. Pucci, Asymmetric line shapes and surface enhancedinfrared absorption of CO adsorbed on thin Fe films on MgO(001), J. Chem.Phys. 110, 3113–3117 (1999) 164, 171
33. A. Wakaun, Surface-enhanced electromagnetic processes, in Solid State Physics,H. Ehrenreich, D. Turnbull (Eds.) (Academic, New York, 1984) 38, pp. 223–294164, 165, 167
34. J. I. Gersten, A. Nitzan, Photophysics and photochemistry near surfaces andsmall particles, Surf. Sci. 158, 165–189 (1985) 164, 165, 167
35. M. Osawa, K. Ataka, Electromagnetic mechanism of enhanced infrared absorp-tion of molecules adsorbed on metal island films, Surf. Sci. Lett. 262, L118–L122 (1992) 164, 170
36. B. N. J. Persson, R. Ryberg, Vibrational interaction between molecules ad-sorbed on a metal surface: the dipole–dipole interactions, Phys. Rev. B 24,6954–6970 (1981) 164, 171
37. B. N. J. Persson, A. Liebsch, Collective vibrational models of isotope mixtureof CO on Cu(111) and Cu(001), Surf. Sci. 110, 356–368 (1981) 164, 171
38. P. Dumas, R. G. Tobin, P. Richards, Study of adsorption states and interactionsof CO on evaporated noble metal surfaces by infrared absorption spectroscopy.1. Silver, Surf. Sci. 171, 555–578 (1986) 164, 171
39. Y. Nishikawa, K. Fujiwara, T. Shima, Quantitative analysis of nanogram sam-ples with Fourier transform infrared transmission surface electromagnetic wavespectroscopy, Appl. Spectrosc. 44, 691–694 (1990) 164
40. S. A. Johnson, N.-H. Pham, V. J. Novick, V. A. Maroni, Application of surface-enhanced infrared absorption spectroscopy as a sensor for volatile organic com-pounds, Appl. Spectrosc. 51, 1423–1426 (1997) 164

Surface-Enhanced Infrared Absorption 185
41. K. Ito, K. Hayashi, Y. Hamanaka, M. Yamamoto, T. Araki, K. Iriyama, Infraredand Raman scattering spectroscopic study on the structures of Langmuir–Blodgett monolayers contacting a merocyanine dye, Langmuir 8, 140–147(1992) 165
42. M. Osawa, N. Matsuda, K. Yoshii, I. Uchida, Charge transfer resonance Ra-man process in surface-enhanced Raman scattering from p-aminothiophenoladsorbed on silver: Herzberg-Teller contribution, J. Phys. Chem. 98, 12702–12707 (1994) 165, 182
43. C. Kuhne, G. Steiner, W. B. Fischer, R. Salze, Surface-enhanced FTIR spec-troscopy on membranes, Fresenius J. Anal. Chem. 360, 750–754 (1998) 165,167
44. R. Aroca, R. Bujalski, Surface-enhanced vibrational spectra of thymine, Vib.Spectrosc. 19, 11–12 (1999) 165, 182
45. G. T. Merklin, L.-T. He, P. R. Griffiths, Surface-enhanced infrared absorptionspectrometry of p-nitorothiophenol and its disulfide, Appl. Spectrosc. 53, 1448–1453 (1999) 165
46. R. Kellner, B. Mizaikoff, M. Jakusch, H. D. Wanzenbock, N. Weissenbacher,Surface-enhanced vibrational spectroscopy: A new tool in chemical IR sensing?,Appl. Spectrosc. 51, 495–503 (1997) 165
47. H. D. Wanzenbock, B. Mizaikoff, N. Weissenbacher, R. Kellner, Multiple in-ternal reflection in surface enhanced infrared absorption spectroscopy (SEIRA)and its significance for various analyte groups, J. Mol. Struct. 410-411, 535–538 (1997) 165
48. C. W. Brown, Y. Li, J. A. Seelenbinder, P. Pivarnik, A. G. Rand, S. V. Letcher,O. J. Gregory, and M. J. Platek, Immunoassays based on surface-enhancedinfrared absorption spectroscopy, Anal. Chem. 70, 2991–2996 (1998) 165
49. Y. Zhu, H. Uchida, M. Watanabe, Oxidation of carbon monoxide at a platinumfilm electrodes studied by Fourier transform infrared spectroscopy with atten-uated total reflection technique, Langmuir 15, 8757–8764 (1999) 165, 171,174
50. M. Watanabe, Y. Zhu, H. Uchida, Oxidation of CO on a Pt–Fe alloy elec-trode studied by surface-enhanced infrared reflection-absorption spectroscopy,J. Phys. Chem. 104, 1762–1768 (2000) 165, 171, 174
51. S. Sato, K. Kamada, M. Osawa, Surface-enhanced IR absorption (SEIRA) onsmall Pt particles deposited on an island Au film, Chem. Lett., 15–16 (1999)165
52. Y. Nishikawa, K. Fujiwara, M. Osawa, K. Takamura, Trace analysis of humanskin secretions by surface-enhanced infrared spectroscopy: Detection of Lactate,Anal. Sci. 9, 811–815 (1993) 165
53. Y. Nishikawa, K. Fujiwara, K. Takamura, Trace analysis of residual additiveson the surface of cultivated fruits by surface-enhanced infrared spectroscopy,Bunseki Kagaku 43, 425–429 (1994) 165
54. M. Osawa, K. Yoshii, K. Ataka, T. Yotsuyanagi, Real-time monitoring of elec-trochemical dynamics by submillisecond time-resolved surface-enhanced in-frared attenuated-total-reflection spectroscopy, Langmuir 10, 640–642 (1994)165, 177
55. M. Osawa, K. Yoshii, Y. Hibino, T. Nakano, I. Noda, Two-dimensional infraredcorrelation analysis of electrochemical reactions, J. Electroanal. Chem. 426,11–16 (1997) 165, 177

186 Masatoshi Osawa
56. H. Noda, K. Ataka, L.-J. Wan, M. Osawa, Time-resolved surface-enhancedinfrared study of molecular adsorption at the electrochemical interface, Surf.Sci. 427–428, 190-194 (1999) 165, 174, 177, 179
57. K. Ataka, Y. Hara, M. Osawa, A new approach to electrode kinetics and dynam-ics by potential–modulated Fourier transform infrared spectroscopy, J. Elec-troanal. Chem. 473, 34–42 (1999) 165, 174, 179, 180
58. K. Ataka, G. Nishina, W.-B. Cai, S.-G. Sun, M. Osawa, Dynamics of the disso-lution of an underpotentially deposited Cu layer on Au(111): A combined time-resolved surface-enhanced infrared and chronocoulometric study, Electrochem.Commun. 2, 417-421 (2000) 165, 174, 177
59. S. Yoshida, T. Yamaguchi, A. Kimbara, Optical properties of aggregated silverfilms, J. Opt. Soc. Am. 61, 62 (1971) 166
60. W. N. Hansen, J. Opt. Soc. Am. 58, 380 (1968) 167, 16861. P. N. Sanda, J. E. Demuth, J. C. Tsang, J. M. Warlaumont, Coverage de-
pendence, in Surface Enhanced Raman Scattering, R. K. Chang, T. E. Furtak(Eds.) (Plenum, New York 1982), pp. 189–221 167
62. A. Roseler, E.-H. Korte, The optical constant of metallic island films as usedfor surface enhanced infrared absorption, Thin Solid Films 313-314, 732–736(1998) 167
63. G. A. Niklasson, C. G. Granqvist, Optical properties and solar selectivity ofcoevaporated Co–Al2O3 composite films, J. Appl. Phys. 55, 3382–3410 (1984)168
64. B. A. Maxwell–Garnett, Philos. Trans. Royal. Soc. A 203, 385–420 (1904) 16865. D. A. G. Bruggemann, Berechnung verschiedener physikalischer Konstanten
von heterogenen Substanzen, Ann. Phys. (Leipzig) 24, 636–664 (1935) 168,169
66. C. F. Eagen, Nature of the enhanced optical absorption of dye-coated Ag islandfilms, Appl. Opt. 20, 3035–3042 (1981) 168
67. E. C. Stoner, The demagneitizing factors for ellipsoids, Philos. Mag. 7, 803–820(1945) 168
68. T. Yamaguchi, S. Yoshida, A. Kimbara, Continuous ellipsometric determinationof optical constants and thickness of a silver film during deposition, Jpn. J.Appl. Phys. 8, 559–567 (1969) 169
69. M. R. Johnson, W. W. Christy, Optical constants of the noble metals, Phys.Rev. B 6, 4370 (1972) 169
70. M. Osawa, K. Ataka, K. Yoshii, T. Yotsuyanagi, Surface-enhanced infraredATR spectroscopy for in situ studies of electrode/electrolyte interfaces, J. Elec-tron Spectrosc. Relat. Phenom. 64/65, 371–379 (1993) 170, 171, 173
71. M. Osawa, K. Ataka, M. Ikeda, H. Uchihara, R. Nanba, Surface-enhanced in-frared absorption spectroscopy: Mechanism and application to trace analysis,Anal. Sci. 7 (Suppl.), 503–506 (1991) 171
72. R. Aroca, B. Price, A New Surface for surface-enhanced infrared spectroscopy:Tin island films, J. Phys. Chem. B 101, 6537–6540 (1997) 171, 182
73. T. Yoshidome, T. Inoue, S. Kamata, Intensity enhancement of the infraredtransmission spectra of p-nitrobenzoic acid by the presence of the Pb films,Chem. Lett. 6, 533–534 (1997) 171
74. J. P. Devlin, K. Consani, Metal surface spectroscopy, Charge transfer and to-tally symmetric mode activity, J. Phys. Chem. 85, 2597–2598 (1981) 171

Surface-Enhanced Infrared Absorption 187
75. T. Wadayama, T. Sakurai, S. Ichikawa, W. Suetaka, Charge-transfer enhance-ment in the infrared absorption of thiocyanate ions adsorbed on a gold electrodein the Kretschmann configuration, Surf. Sci. 198, L359–L364 (1988) 171
76. T. Wadayama, Y. Momota, A. Hatta, W. Suetaka, Polarization modulationIR spectroscopic study of electrochemically generated species from TCNQ at agold electrode in the Kretschmann ATR geometry, J. Electroanal. Chem. 289,29–36 (1990) 171
77. R. J. Nichols, IR spectroscopy of molecules at the solid–solution interface, inAdsorption of molecules at metal electrodes, J. Lipkowski, P. N. Ross (Eds.)(VCH, New York 1992) Chap. 7 172, 173, 180
78. K. P. Ishida, P. R. Griffiths, Theoretical and experimental investigation ofinternal reflection at thin copper films exposed to aqueous solutions, Anal.Chem. 66, 522-530 (1994) 173
79. K. Ataka, T. Yotsuyanagi, M. Osawa, Potential–dependent reorientation of wa-ter molecules at an electrode/electrolyte interface studied by surface-enhancedinfrared absorption spectroscopy, J. Phys. Chem. 100, 10664–10672 (1996) 173,175
80. S.-G. Sun, W.-B. Cai, L.-J. Wan, M. Osawa, Infrared absorption enhancementfor CO adsorbed on Au films in perchloric acid solutions and effects of surfacestructure studied by cyclic voltammetry, scanning tunneling microscopy, andsurface-enhanced IR spectroscopy, J. Phys. Chem. 103, 2460–2466 (1999) 174
81. K. Ataka, M. Osawa, In situ infrared study of water–sulfate coadsorption ongold(111) in sulfuric acid solution, Langmuir 14, 951–959 (1998) 174, 175, 177
82. K. Ataka, M. Osawa, In situ infrared study of cytosine adsorption on goldelectrodes, J. Electroanal. Chem. 460, 188–196 (1999) 174, 177
83. I. Taniguchi, S. Yoshimoto, Y. Sunatani, K. Nishiyama, Potential and pH de-pendencies of adsorbed species of 2,4–pyridinethiol and 2–pyrimidinethiol onAu(111) electrode, Electrochem. 67, 1197–1199 (1999) 174, 182
84. M. Hoon–Khosla, W. R. Fawcett, A. Chen, J. Lipkowski, B. Pettinger, ASNIFTIR study of the adsorption of pyridine at the Au(111) electrode–solutioninterface, Electrochim. Acta 45, 611–621 (1999) 174, 175
85. L. Stolberg, S. Morin, J. Lipkowski, D. E. Irish, Adsorption of pyridine at theAu(111)–solution interface, J. Electroanal. Chem. 307, 241–262 (1991) 176
86. Z. Q. Feng, T. Sagara, K. Niki, Application of potential-modulated UV–visiblereflectance spectroscopy to electron transfer rate measurements for adsorbedspecies on electrode surfaces, Anal. Chem. 67, 3564–3570 (1995) 179
87. J.-N. Chazalviel, V. M. Dubin, K. C. Mandel, F. Ozanam, Modulated infraredspectroscopy at the electrochemical interface, Appl. Spectrosc. 64/65, 1411–1416 (1993) 180
88. C. M. Pharr, P. R. Griffiths, Step–scan FT–IR spectroelectrochemical analysisof surface and solution species in the ferricyanide/ferocyanide redox couple,Anal. Chem. 69, 4665–4672 (1997) 180
89. L.-J. Wan, H. Noda, Y. Hara, M. Osawa, Effect of solution pH of a 4–mercaptopyridine monolayer self–assembled on Au(111), J. Electroanal. Chem.(2000) (in press) 182