1ceneo1_cameroon coffee supply chain risk assessment
TRANSCRIPT

CAMEROON COFFEE SUPPLY CHAIN RISK ASSESSMENT
DRAFT REPORT
September, 2010
EUROPEAN COMMISSION ACP GROUP OF STATES
ALL ACP AGRICULTURAL COMMODITIES PROGRAMME

1
Table of Contents: Cameroon Coffee Supply Chain Risk Assessment
Executive Summary ……………………………………………………………………… 3
1. Background ……………………………………………………………………….. 5
2. An overview of the Cameroon coffee industry …………………………………… 6
3. Supply Chain Structure ………………………………………………………….. 10
4. Supply Chain Constraints……………………………………… ………………. 14
5. Major risks and capacity to manage ………………………………. ……. …….. 16
5.1 Production Risks ………………………………………………………………… 17
Pest and disease ………………………………………………………………… 17
Delayed flowering ……………………………………………….. …………… 18
5.2 Market Risks ……………………………………………………………………… 19
Coffee price risk ………………………………………………………………… 19
Volatility of fertilizer prices …………………………………………………….. 21
Default risk …………………………………………………………………… 22
Crop substitution …………………………………………………………….. 23
5.3 Other Risks ……………………………………………………………………. 23
Policy/regulation risk …………………………………………………………. 23
Security of cash in transit..……………………………………………………… 24
6. Vulnerability to Risk ……………………………………………………………….. 25
7. Priority Measures for Risk Management ……………………………………………. 26
8. Final Remarks ……………………………………………………………………… 27
Reference ……………………………………………………………………………. 28
Annex 1. Coffee Supply Chain Risk Assessment Agenda ……………………………. 29
Annex 2. List of Participants at the stakeholders‟ meeting (6th May,2010)……………. 31
Annex 3. Farmer‟s Risk Perception and Prioritization…………………………. …. 32
Disclaimer:
This volume is a product of the staff of the International Bank for Reconstruction and Development / The
World Bank. The findings, interpretations, and conclusions expressed in this paper do not necessarily reflect
the views of the Executive Directors of The World Bank or the governments they represent.
The World Bank does not guarantee the accuracy of the data included in this work. The boundaries, colors,
denominations, and other information shown on any map in this work do not imply any judgement on the
part of The World Bank concerning the legal status of any territory or the endorsement or acceptance of such
boundaries.

2
Glossary
English French
Forwarding Agents Transitaires
Export Markets Marchés d‟exportation /Destinations
Roasters Torréfacteurs
Hullers or Millers Usiniers
Buyers Acheteurs
Supplier Fournisseur
Coffee cherry Cerise
Parchment coffee Café parche (process : déparcharge)
De-pulping Dépulpage
Fermentation Fermentation
De-mucilaging Démuculagination (Arabica only)
Hulling Decorticage
Drying Séchage
Bean Fève
Green coffee Café vert/Café marchand
Grading Calibrage
Sorting/cleaning (after grading) Triage
3
Executive Summary
Coffee is currently the fourth largest agricultural export commodity (by volume) for Cameroon. Nearly all
coffee (more than 98%) is exported and less than 2% is consumed domestically. In 2008-09, Cameroon
exported 34,166 tons of coffee (3,611 tons of Arabica and 30,555 tons of Robusta) and earned foreign
exchange worth CFAF23,147 million (approximately US$ 46.75 million). Coffee is the primary source of cash
income for thousands of households in the rural areas and provides livelihoods to many others across the
supply chain.
The coffee sector‟s significance and importance has declined drastically from its 1980s heyday when it was the
largest agricultural export commodity (by volume); main source of cash income for 400,000 rural households;
exported 110,000 tons of coffee annually; and was the world‟s twelfth largest coffee exporter. Currently, it is
the nineteenth largest exporter.
The liberalization of the coffee sector, the steep and prolonged decline in international coffee prices, the collapse of Cameroon‟s coffee cooperative system, and the rapid entry and exodus of private operators were some of the major shocks experienced by the Cameroon coffee industry over the past 20 years. As a result, coffee production declined from a peak of 146,848 tons in 1987/88 to 31,524 tons in 2007/08. Currently average coffee yields are quite low (300-350 kg/ha of coffee cherries) due to ageing plantations, high cost of inputs (fertilizers), limited access to on-farm extension services, and limited management and investment in the coffee plantations. In addition, limited access to finance, ageing farmers and limited engagement of young farmers, fragmented supply chain, poor road infrastructure, and poor buyers‟ perception of Cameroonian coffee are some of the constraints that hamper the performance of the industry. Coffee production in Cameroon has limited exposure to weather/climatic risks. Most of the shocks that the sector has experienced have been man-made. The following major risks account for the decline in coffee production and exports:
· Coffee price risk: Approximately 98 % of Cameroonian coffee production is exported, exposing the sector to international coffee price volatility. The majority of exporters, being a part of international trading enterprises, are hedging against price risk in commodity exchanges and are secured, to some extent, against seasonal price volatility. Most traders mitigate price risk by undertaking back to back trading. Farmers, on the other hand, have no protection against seasonal or long term decline in the prices.
· Volatility of fertilizer prices: Fertilizer application in coffee plantations is very limited, largely due
to the high cost of fertilizers, and farmers cite this as a main cause for low coffee yields. Further rises in fertilizer prices might have a negative impact on coffee production.
· Crop substitution: In the past, crop substitution resulted in significant loss of coffee acreage.
Improvements in communication, infrastructure, and access to markets are providing more lucrative options to farmers. These, coupled with increased pressure on land, increase the risk of continued large scale replacement of coffee plantations with other crops.
· Policy/ Regulation: Despite liberalization, the coffee sector is still heavily regulated and politicized.
Drastic changes in the policy regime and regulation are serious threats that could potentially have far reaching implications for the industry.
4
· Default risk: The entire supply chain is exposed to this risk and different stakeholders have experienced financial losses due to counterparty (eg.farmer, agent, huller, or exporter) defaulting on the money advanced as well as on the quantity and quality supplied.
· Pest and disease: Coffee berry disease (CBD), coffee rust, and coffee borer are three significant
pests and diseases which are causing significant quantity and quality losses. CBD is a major risk for Arabica coffee plantations, with infestation rates between 40-60 % and resultant production losses ranging from 30 to 50 %.
Revival of the coffee sector will require a large scale coordinated effort to boost coffee production through:
improved access and affordability of farm inputs (planting material, fertilizers, chemicals, etc);
training farmers, especially young farmers, in good coffee cultivation practices and pest and disease management;
developing a system of on-farm extension services/advice;
greater coordination between exporters and farmers and investment in improving trust and transparency; v) building a conducive regulatory environment.
Besides boosting coffee production, the industry needs to undertake proactive measures to manage the risks of long term decline in international coffee prices, steep rises in fertilizer/input prices, crop substitution, and changes in regulation. To manage these risks, a Cameroon coffee revival strategy needs to be implemented to address the structural impediments in the supply chain, focus on developing win-win relationships among the various stakeholders, and develop mechanisms to improve the resilience of the supply chain to manage future shocks.

5
1. Background
The World Bank, in collaboration with the National Coffee and Cocoa Board (ONCC) and the Cocoa and
Coffee Inter-Professional Board (CICC), conducted a coffee supply chain risk assessment in Cameroon in
May, 2010. This report is the outcome of that assessment and is intended as an advisory note to the Ministry
of Commerce, Ministry of Agriculture and Rural Development, ONCC and CICC to enable them to identify
strategies and potential public investments to improve current risk management practices in the coffee supply
chain.
This report identifies the major risks facing the coffee supply chain, ranks them in terms of their potential
impact and frequency, and offers a framework for improving current risk management practices. The
recommendations and findings will provide a basis for follow-up planning work by the Government of
Cameroon (GoC), the World Bank and other development partners.
The findings and analysis of this initial assessment are based on a methodology designed by the Agricultural
Risk Management Team (ARMT) of the World Bank for assessing risks in agricultural supply chains. The
assessment team followed the following sequences of activities (Figure 1) while conducting the assessment.
Figure 1: Overall Sequence of Analysis and Consultative Steps
In-depth interviews were conducted with key coffee supply chain stakeholders in Douala, Bafoussam,
Mbouda, Kekem, Melong, Nkongsamba, Yaoundé & Abong-Mbang districts (i.e. farmers, input suppliers,
traders, banks and microfinance institutions, hullers, cooperatives, federations, exporters, research institutes,
government departments, etc.). A full list of all the stakeholders interviewed is provided in Annex 1.
This activity was financed by the European Union All ACP Agricultural Commodities Programme (AAACP)
for the Central Africa region. AAACP has been financing interventions in the coffee sector through
international organizations (World Bank, ITC, UNCTAD & FAO) and this assessment will feed into the
existing and planned activities of these international organizations in the coffee sector. AAACP has financed
the development of a coffee strategy (led by ITC) and this assessment will complement that work and add the
risk dimension to the Cameroon Coffee Sector Development Strategy. The World Bank team wishes to
acknowledge the invaluable support provided by the Ministry of Agriculture and Rural Development, the
Ministry of Commerce, ONCC, and CICC as a partner in this activity.
Pre Field Assessment
Preparation
- Baseline data preparation
- Supply chain & spatial
mapping
- Consultation scheduling
- Initial meetings
Preliminary Field
Exercises &
Consultations
- Arrival of team / team planning
- Completion of baseline data
gaps - Identification of tentative risks
- Initial stakeholder plenary
meeting
-
Field Visits &
Stakeholder Interviews
- Field trips, government
consultations
- Stakeholder interviews
- Risk identification,
characterization
(Interviews also cover risk
management and vulnerability)
Final Stakeholder
Meetings & Wrap Ups
- Identification of capacities, gaps.
- Prioritization of risks,
vulnerabilities
- Risk recommendations, follow ups
Assessment Wrap Up &
Recommendations - Diagnostics follow up
recommendations
- Identification of gaps
Communication of
Results
- Completion of reports
Dissemination of results
- Operational follow ups
6
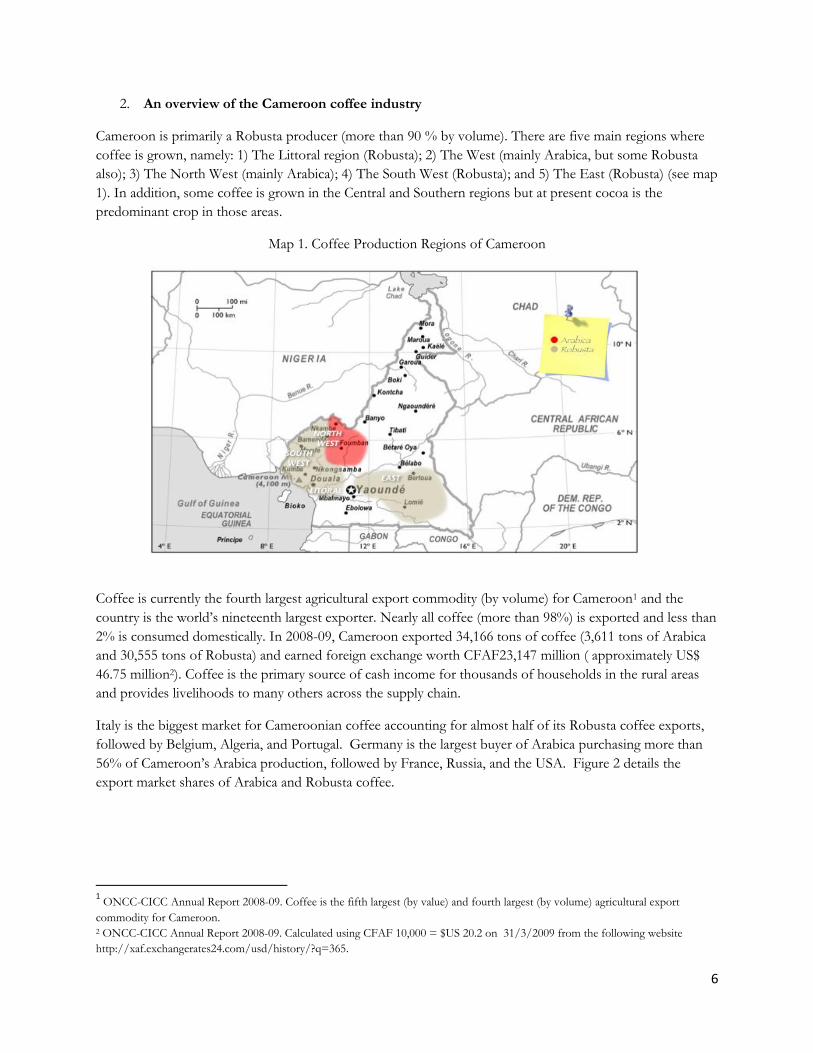
2. An overview of the Cameroon coffee industry
Cameroon is primarily a Robusta producer (more than 90 % by volume). There are five main regions where
coffee is grown, namely: 1) The Littoral region (Robusta); 2) The West (mainly Arabica, but some Robusta
also); 3) The North West (mainly Arabica); 4) The South West (Robusta); and 5) The East (Robusta) (see map
1). In addition, some coffee is grown in the Central and Southern regions but at present cocoa is the
predominant crop in those areas.
Map 1. Coffee Production Regions of Cameroon
Coffee is currently the fourth largest agricultural export commodity (by volume) for Cameroon1 and the
country is the world‟s nineteenth largest exporter. Nearly all coffee (more than 98%) is exported and less than
2% is consumed domestically. In 2008-09, Cameroon exported 34,166 tons of coffee (3,611 tons of Arabica
and 30,555 tons of Robusta) and earned foreign exchange worth CFAF23,147 million ( approximately US$
46.75 million2). Coffee is the primary source of cash income for thousands of households in the rural areas
and provides livelihoods to many others across the supply chain.
Italy is the biggest market for Cameroonian coffee accounting for almost half of its Robusta coffee exports,
followed by Belgium, Algeria, and Portugal. Germany is the largest buyer of Arabica purchasing more than
56% of Cameroon‟s Arabica production, followed by France, Russia, and the USA. Figure 2 details the
export market shares of Arabica and Robusta coffee.
1 ONCC-CICC Annual Report 2008-09. Coffee is the fifth largest (by value) and fourth largest (by volume) agricultural export
commodity for Cameroon. 2 ONCC-CICC Annual Report 2008-09. Calculated using CFAF 10,000 = $US 20.2 on 31/3/2009 from the following website
http://xaf.exchangerates24.com/usd/history/?q=365.

7
Figure 2: Robusta Export (Market Share: Volume %) Arabica Exports (Market Share: Volume %)
(Source: ONCC Annual report 2008/09)
Although coffee is an important crop for the country, its significance and importance has declined drastically
from its 1980s heyday when it was the main source of cash income for 400,000 rural households (184,402
(Arabica) and 215,164 (Robusta)3; exported 110,000 tons of coffee annually; and was the world‟s twelfth
largest coffee exporter. Over the past thirty years Cameroon has seen a rapid decline in coffee production.
Cameroon exported around 1,500,000 bags (60 kg each) during the 1980s, around 1,000,000 bags during the
latter half of 1990s and around 700,000 bags for the past 5-6 years (figure 3). Arabica production in
Cameroon has declined from a peak of 31,663 tons (1973-74) to 3,474 tons (2007-08), while Robusta
production has declined from a peak of 123,988 tons (1986-87) to 28,050 tons (2007-08) (figure 4).
Figure 3. Coffee production and exports (000 Bags)
(Source: ICO)
3 This survey was done between 1985-1990. There has been no agricultural census since then. Coffee acreage has drastically reduced in
the past twenty years and number of household currently engaged in coffee cultivation is much smaller.
0
500
1000
1500
2000
2500
19
80
/81
19
81
/82
19
82
/83
19
83
/84
19
84
/85
19
85
/86
19
86
/87
19
87
/88
19
88
/89
19
89
/90
19
90
/91
19
91
/92
19
92
/93
19
93
/94
19
94
/95
19
95
/96
19
96
/97
19
97
/98
19
98
/99
19
99
/00
20
00
/01
20
01
/02
20
02
/03
20
03
/04
20
04
/05
20
05
/06
20
06
/07
20
07
/08
20
08
/09
Production (000 Bags) Exports (000 Bags)

8
Figure 4. Coffee production* (Tons)
(Source: ONCC)
*These figures represent the amount of coffee exported and roasted locally and not the actual coffee production.
During the 1980s, due to price stabilization policies and the support provided by the Government, coffee
production reached its all time high. The coffee sector was under the state control up to 1991 and the
National Board for marketing of Basic Commodities (ONCPB) was responsible for the commercialization of
coffee. ONCPB played the role of stabilization fund, determined coffee prices, acted as the sole buyer and
seller of coffee and provided directives and investments for the commercialization of coffee. A tripartite
cooperative structure, consisting of primary cooperatives, secondary cooperatives, and seven big „parastatal‟
Unions of Agricultural Cooperatives (UCO), was responsible for providing inputs (fertilizers and planting
material), credit, and extension services to the farmers. The cooperative system was responsible for the
procurement of coffee, quality control, delivery of coffee to ONCPB, and disbursement of payments to the
farmers. While cooperatives were the main structure in Anglophone coffee growing areas, a mixed structure
consisting of private licensed buying agents (LBA) and cooperatives were prevalent in the Francophone
region. This structure was dismantled by the Government between 1990-1994 and since then, the coffee
sector has gone through three distinct phases:
1) Liberalization (1990-1994): Development agencies, including the World Bank, USAID and other donors,
supported the Government of Cameroon to liberalize the coffee sector. The Government withdrew from its
direct roles within the coffee sector including price support, buying and selling of coffee, supply of inputs
(including fertilizers etc), and providing subsidies to the coffee cooperatives. Lack of government support,
coupled with direct exposure to international price volatility and the collapse of the national cooperative
structure resulted in a substantial drop in the volume of coffee produced.
2) Proliferation of the private sector (1994-2003): Liberalization of the coffee sector led to the rapid
proliferation of private sector actors at all stages of the coffee supply chain (exporters, hullers, agents etc.)
between 1993 and 2003. The absence of entry barriers led to a surge of new, mostly inexperienced, operators
and the majority of them lost money and subsequently went bankrupt. Commercial banks, which extended
finance to private sector coffee enterprises following liberalization, experienced significant defaults on coffee
sector lending and suffered substantial losses during this period. One exporter indicated that more than 100
0
20,000
40,000
60,000
80,000
100,000
120,000
140,000
160,000
Robusta Arabica Total
9
exporters entered and exited the sector during this period. The international coffee crisis (2000-2003)
prompted a large number of farmers to exit from coffee production or abandon their coffee plantation.
3) Consolidation (2003- present): The period from 2003 to present is marked by market consolidation by a
few operators and a slight recovery from the lowest production levels of 2003. Currently, five exporters
account for more than 84% of the Robusta coffee exported while two federations (UCCAO and NWCA)
account for 60% of the Arabica exports. GoC has started many new initiatives to revive coffee production,
and production, although still volatile, has attained a level of 40,000 tons.
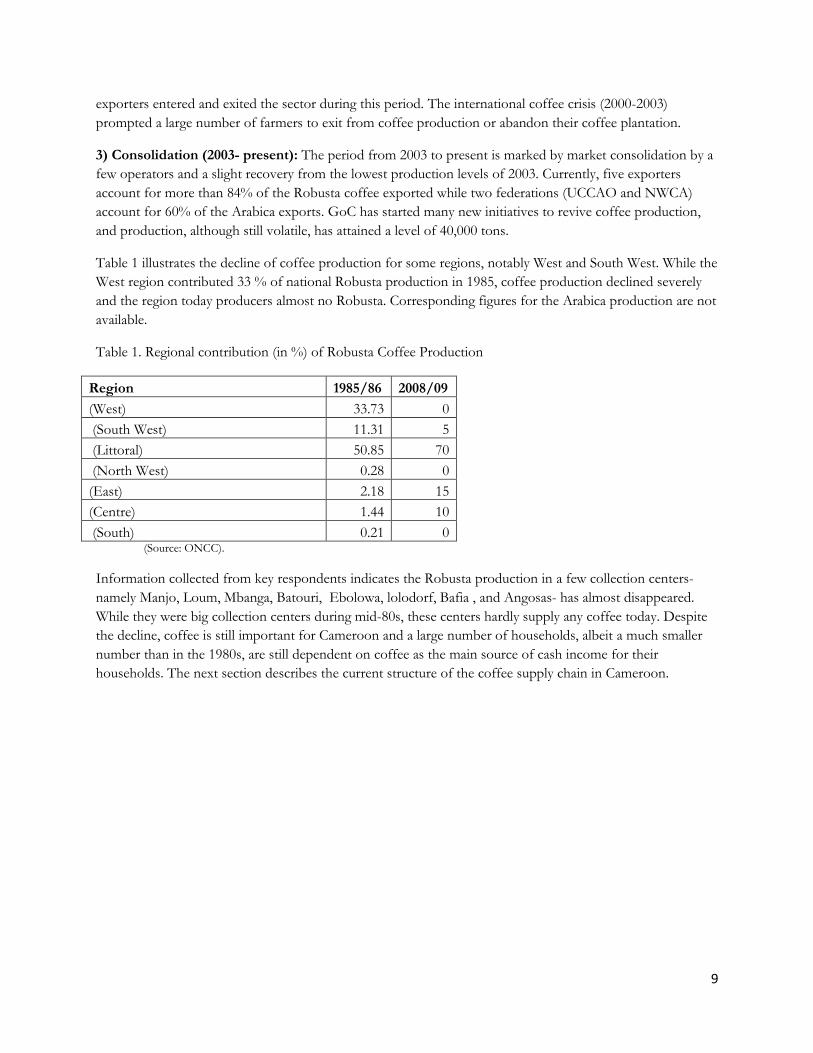
Table 1 illustrates the decline of coffee production for some regions, notably West and South West. While the
West region contributed 33 % of national Robusta production in 1985, coffee production declined severely
and the region today producers almost no Robusta. Corresponding figures for the Arabica production are not
available.
Table 1. Regional contribution (in %) of Robusta Coffee Production
Region 1985/86 2008/09
(West) 33.73 0
(South West) 11.31 5
(Littoral) 50.85 70
(North West) 0.28 0
(East) 2.18 15
(Centre) 1.44 10
(South) 0.21 0 (Source: ONCC).
Information collected from key respondents indicates the Robusta production in a few collection centers-
namely Manjo, Loum, Mbanga, Batouri, Ebolowa, lolodorf, Bafia , and Angosas- has almost disappeared.
While they were big collection centers during mid-80s, these centers hardly supply any coffee today. Despite
the decline, coffee is still important for Cameroon and a large number of households, albeit a much smaller
number than in the 1980s, are still dependent on coffee as the main source of cash income for their
households. The next section describes the current structure of the coffee supply chain in Cameroon.

10
3. Supply chain structure
The coffee supply chain (figure 5) constitutes of farmers, agents, cooperatives and farmers‟ union, hullers and
graders, exporters, forwarding agents, and roasters. The following section provides a brief description of its
major stakeholders:
Figure 5: Cameroon Coffee Supply Chain Map
(Source: Authors)
Industry Apex Organizations: After the liberalization, ONCPB was dismantled and two new apex
organizations were created to support the coffee and cocoa sectors. The National Cocoa and Coffee Board
(ONCC) is a public sector organization, under the Ministry of Commerce, responsible for supervising the
coffee and cocoa supply chain in Cameroon. The role of ONCC is to assist in coffee marketing, collate
statistics, ensure regulatory compliance, supervise exports‟ quality control, represent the interprofessional
groups, and provide information and advice on international coffee prices to the domestic stakeholders.
The other apex organization is the Interprofessional Council for Cocoa and Coffee (CICC) represents the
private sector and it is organized through four groupings: producers, processors organizations, conditioning
factories, and exporters and agents. 4 It provides a range of services including studies, quality and origin
promotion, information collection and dissemination, and representation of private sector interests, amongst
others.
4 Inter-reseaux developpement rural (2008): An interprofessional Organisation for Coffee and Cocoa in Cameroon: for which services and for whom?

11
Besides these two organizations, the Government has recently created a separate Cocoa and Coffee sub-
sector Development Fund (FODECC) that supports projects for the development of coffee and cocoa
sectors. All three organizations are financed from an industry wide export levy of CFAF 29,000/ton (table 2)
on coffee and cocoa exports.
Table 2: Share of different organizations in export levy
Organization Share of export levy (in CFAF / MT)
ONCC 8500
CICC 4000
FODECC 15000
International coffee/cocoa organisations 1500
Total 29,000 (Source: ONCC)
Farmers: According to the last census conducted by the Ministry of Agriculture in 1984, coffee was the main
source of income for some 400,000 households. Currently, the number of households engaged in coffee
production is much smaller, as indicated by the significant decline in production and coffee acreage, although
there is no data/statistics to validate this5. There were a few large commercial estates prior to liberalization,
however, nearly all the coffee production is currently being done by smallholder farmers.
Farmers generally grow a diversified portfolio of crops, notably food crops (maize, plantains) for household
consumption and sale, and cash crops including cocoa, coffee, fruits and vegetables, and palm oil for
commercial sale. The food crops are generally grown and marketed by women and cash crops by men. While
coffee was the most profitable cash crop during the 80s, its significance to the farm economy has declined
drastically. In areas where farmers can grow cocoa and palm oil, coffee production is now a less important
source of cash. Coffee remains the primary cash crop in regions where production of alternative cash crops
such as cocoa, fruits and vegetables, and palm oil is not talking place.
Coffee Cooperatives and Unions: The cooperative structure for coffee and cocoa was formed during the
colonial times. After independence, cooperatives became the primary organizational structures for coffee and
cocoa farmers and invested in all aspects of the industry (delivery, storage, hulling, grading, extension services,
and financing). Cooperatives were grouped into Unions and they were responsible for liaison with the former
national marketing board. After the liberalization, many cooperatives collapsed because of withdrawal of the
government support, falling turnover, mismanagement, and increased competition from the private sector.
There is still a large residual infrastructure, a high level of debt, and a lack of trust between farmers and
cooperatives.
Currently, the cooperatives‟ role in Robusta marketing is marginal, however they remain the main players
(UCCAO and NWCA) in the Arabica market. During the 2008-09 season UCCAO (operating with an
international partner) exported 41% of Cameroon‟s Arabica production while NWCA exported 22% .
Currently, the functional cooperatives are engaged in procurement of coffee, largely from the members;
however, deliveries are now also accepted from non-members.
GICs : After the liberalization, the Government promoted GICs (Groupement d’Interets Communs) as a
mechanism to organize farmers into smaller, independent Producer Organizations (OP‟s). GICs consist
5 Prior to liberalization, data on coffee production, farmgate prices and coffee acreage was regularly collected. However such data is
no longer collected and self reporting by the exporters/roasters/cooperatives form the basis of coffee sector statistics.

12
typically of 30-50 farmers and though they are informal structures, most are registered at the regional level
and can be further grouped into unions. Besides farmer‟s GIC, in some instances farm laborers and hullers
have also created GICs. Information on the number of GICs engaged in coffee production is not available;
however, they have a sizable presence in few coffee growing areas. GICs interact directly with hullers and are
often able to negotiate a better price for coffee.
Agents: During the state control period, the Government used to provide licenses to the agents and only a
few Licensed Buying Agents (LBA) could procure coffee directly from the farmers. Liberalization led to a
proliferation of agents since the licensing requirement was abolished. Currently, the active agents could be
broadly divided in the following three categories: i) commission agents who work on behalf of hullers and
receive commission, based on the amount of coffee purchased; ii) farmers who perform the agent function
and aggregate coffee from their fellow farmers and sell it to hullers or exporters directly; and, iii) independent
agents/speculators (“coxeurs”) who are individual entrepreneurs with some capital base and act as traders. In
some instances agents have long standing relationships with farmers and provide pre-harvest credit. Such
relationships, however, are limited and on-the-spot cash transactions is the norm in the industry.
Hullers and graders: After the coffee is sun-dried on-farm (and de-pulped in the case of Arabica) it needs to
be further dried and hulled (decorticated), to produce clean coffee. The output of the hulling process is, at its
simplest, ungraded, decorticated, green coffee (also known as café marchand). Some hullers also perform the
grading and sorting function. Currently, many independent hullers, some with new plants and many with old
plants, are located in the main towns of the coffee production areas. These hullers sign formal contracts with
exporters which are normally re-negotiated at the beginning of the each season. There are some hullers who
only procure exclusively for their exporters, while many hullers supply coffee to multiple exporters either on
the spot or through seasonal contracts.
Exporters: The number of export licenses issued immediately post liberalization in 1994, approached 700,
because of low entry barriers. A very small percent of those license holders were engaged in actual exporting
and the majority of them withdrew from the sector. Banks extended credit to many new exporters and their
subsequent failures led to bad debts for the banks. Today the export sector has consolidated and the top five
exporters account for more than 90 % (table 3) of the total coffee exported form Cameroon. Only one firm
(UTI) is an independent Cameroonian owned major exporter and rest of the major exporters are either under
foreign ownership, or closely affiliated with coffee importing companies.
Table 3. List of exporters and 2008/09 export volumes and percentage of volume.
Exporter (Robusta)
Volume of Robusta exported (Kg)
% of total Robusta exports
Exporter (Arabica)
Volume of Arabica exported (Kg)
% of total Arabica exports
Olam 9,868,800 32.30 UCCAO 1.474,500 40.82
Nealiko 6,715,000 21.98 NWCA 786,780 21.78
ED &F Man Cacoa 3,667,200 12.00 Olam 733,760 21.42
Crete 3,081,600 10.09 CCAF-CAM SARL
273,600 7.57
UTI 2,934,000 9.60 ETS GRA-CACOA-CAFE
78,660 2.17
Remaining 15 exporters
4,289,342 14.03 Remaining 9 exporters
264,540 6.24
Total 30,555,942 100 Total 3,611,840 100 (Source: ONCC-CICC Coffee Campaign 2008-09, December 2009)
13
After their post-liberalization experience, the majority of banks became reluctant to lend to the coffee sector.
To meet the credit requirement of the sector, exporters extend credit to hullers or intermediaries, typically for
a period of between two and six weeks, to allow them to procure coffee from farmers. In addition, trusted
hullers or intermediaries are provided with lines of credit (long term seasonal credit) which is extended to
farmers during the course of the growing season.
Forwarding agents: There are two major forwarding agents (UTRAC and SDV) who undertake the task of
handling all port functions on behalf of exporters. This involves customs documentation, warehousing,
loading and filling of the containers, ensuring inspection and certification, and dockside functions leading to
shipping. In the case of UTRAC, the forwarding agent is also operating an independent warehousing and
grading factory in Douala.
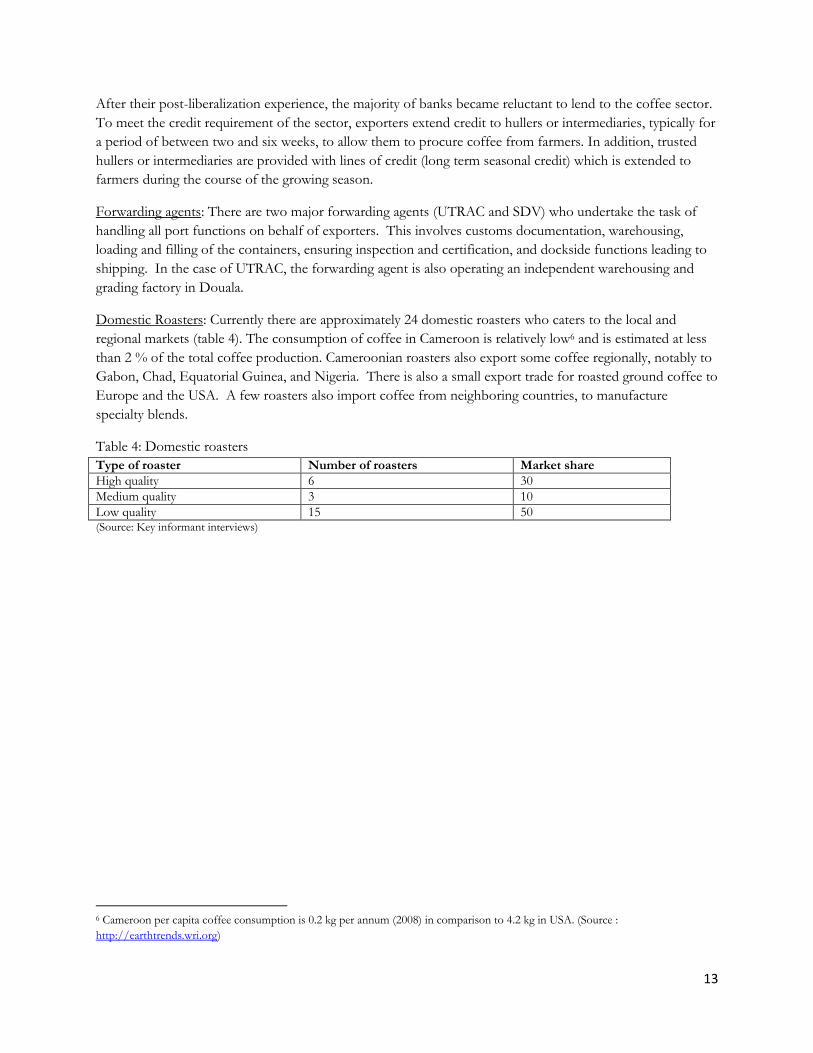
Domestic Roasters: Currently there are approximately 24 domestic roasters who caters to the local and
regional markets (table 4). The consumption of coffee in Cameroon is relatively low6 and is estimated at less
than 2 % of the total coffee production. Cameroonian roasters also export some coffee regionally, notably to
Gabon, Chad, Equatorial Guinea, and Nigeria. There is also a small export trade for roasted ground coffee to
Europe and the USA. A few roasters also import coffee from neighboring countries, to manufacture
specialty blends.
Table 4: Domestic roasters
Type of roaster Number of roasters Market share
High quality 6 30
Medium quality 3 10
Low quality 15 50 (Source: Key informant interviews)
6 Cameroon per capita coffee consumption is 0.2 kg per annum (2008) in comparison to 4.2 kg in USA. (Source :
http://earthtrends.wri.org)

14
4.0 Constraints in the coffee supply chain
Although this assessment is geared to analyze risks in the coffee supply chain, it is important to also look at
the major constraints. Effective risk management often requires resolving the underlying constraints because
the presence of constraints increases the likelihood of occurrence of risk and intensity of losses. A distinction
between risks and constraints helps in better categorization and development of strategies to manage them.
Risks are unforeseeable events which cause losses (e.g. weather events, market events, pest and disease
outbreak, foreign exchange volatility etc), while constraints are conditions that leads to sub-optimal
performance of different stakeholders in the supply chain (e,g. lack of credit, limited access to extension
services, poor infrastructure etc).
Major constraints hampering the performance of the coffee supply chain are as follows:
Access to finance: With the exception of the coffee exporters, who receive their financing from their
international parent companies, restricted access to finance was highlighted by all the other stakeholders as
their primary constraint. Interviews with small independent hullers showed that lines of credit from local
banks were either unavailable or insufficient and when provided were at prohibitively high rates of interest.
Hullers either use their own funds to extend credit to suppliers, or have lines of credit extended from
exporters. Farmers rely on informal credit largely extended through retail input suppliers, but this lending is
limited by the merchant‟s own availability of funds. Similarly, hullers extend informal credit to trusted
farmers. Credit is normally made to individual farmers and not collectively to GIC‟s. Cooperative sector was
well financed by banks prior to the liberalization; however, due to political interference, bureaucratic apathy,
and years of bad management, majority of the cooperatives defaulted on their loans. The bad debt situation
worsened after the liberalization when majority of the cooperatives could not sustain their commercial
operations and become defunct. Most of the cooperatives currently own huge debts to the bank, often
running in few billion CFAF, and unless the bad debt situation can be resolved, banks are unwilling to lend to
the cooperative sector.
Abandonment / limited management of coffee farms: As a result of the multiple shocks experienced by the
coffee sector since 1990, farmers have adopted several management strategies, which are detailed in Table 5.
The main strategies adopted appears to have been option 1(crop substitution), 3 (partial abandonment) and 4
(marginalization of coffee plantation) in the main coffee growing areas, where population density is high and
land is scarce. In the eastern region, option 2, full abandonment, is also found, as land is more widely
available. Option 5, conhtinuing full management of the coffee plantation, has not been pursued widely. Since
the majority of coffee plantations are intercropped, it is relatively easy for farmers to retain their coffee trees,
but not to prune or tend them, whilst concentrating their cultivation efforts on other crops.
Table 5. Farmer‟s management strategies
Strategy Details
Option 1 . Crop substitution Cutting down of coffee tree/plantation and their replacement with other food or commercial crop
Option 2. Full abandonment Full abandonment of the coffee plantation not even picking up coffee cherry
Option3. Partial abandonment Abandonment of the coffee tree but picking up coffee cherry at the time of ripening
Option4. Marginalization of coffee plantation
Intercropping coffee plantation with other food/commercial crop and paying little or no attention to coffee trees
Option 5. Management of coffee plantation
Effective management of coffee trees/plantation .
(Source: Authors)

15
Low Yields at farm level: Lack of extension services , scarcity and high costs of inputs, coupled with low
coffee prices, have resulted in a vicious cycle of reduced yields, declining farmer income and further reduction
in investments in husbandry (eg. reduced pruning, maintenance, pest and disease control). Typical yields have
reduced from 800-1,000 kg/ha in the 1980‟s, to 300-350 kg/ha today. Majority of the existing plantations are
now 20-30 years old. Old age of tree further contributes to reduced yields and makes coffee plantations more
susceptible to pest and disease attack. Furthermore, low yields contribute to low profitability across the
industry since it leads to under utilization at mills and exports facilities.
Ageing farmers and limited engagement of young farmers : The Cameroon Coffee Sector Development
Strategy indicates this as a significant constraint for the industry. This was validated in the field. The majority
of the farmers, with whom the assessment team interacted were more than fifty years of age. However, in
some areas (Mbafam and Ndjibe), majority of farmers were young (20-30 years) who had taken up coffee
cultivation in the past 2-3 years due to the recent promotion activities undertaken by the Government.
Despite the promotion, it is difficult to attract new farmers to coffee cultivation owing to the issues of land
inheritance, urban emigration, and engagement in more productive rural enterprises.
Poor road infrastructure: The road infrastructure is relatively less developed in Cameroon and almost all
feeder roads from farms and villages are dirt roads. These roads become impassable during the rainy season,
which is also the time for coffee transportation from farms to hullers. At times, in some remote locations,
farmers don‟t harvest their coffee cherries because of their inability to transport the harvest to markets.
Current structure of the coffee supply chain: The cooperative structure in the pre-liberalisation period
provided farmers with a highly supportive framework for growing and marketing coffee. The current coffee
production and marketing structure, however, is highly fragmented and there is a limited direct engagement
of the private sector actors (exporters and hullers) with the coffee farmers. The support structure for farmers
with regard to access to information, input supply, finance, and markets, is not very robust. This does not
creative positive incentives for the farmers to continue coffee production.
Access to inputs- Availability of inputs (chemicals, pesticides, planting material, and tools) has been cited as a
major problem by the farmers in the focus group discussions (annex 3). Most of these inputs were provided
by the cooperatives, either free or at subsidized rates, before the liberalization, and the current availability of
these inputs is limited. This serves as a constraint for the farmers who wish to engage in proper management
or renewal of their coffee plantations.
16
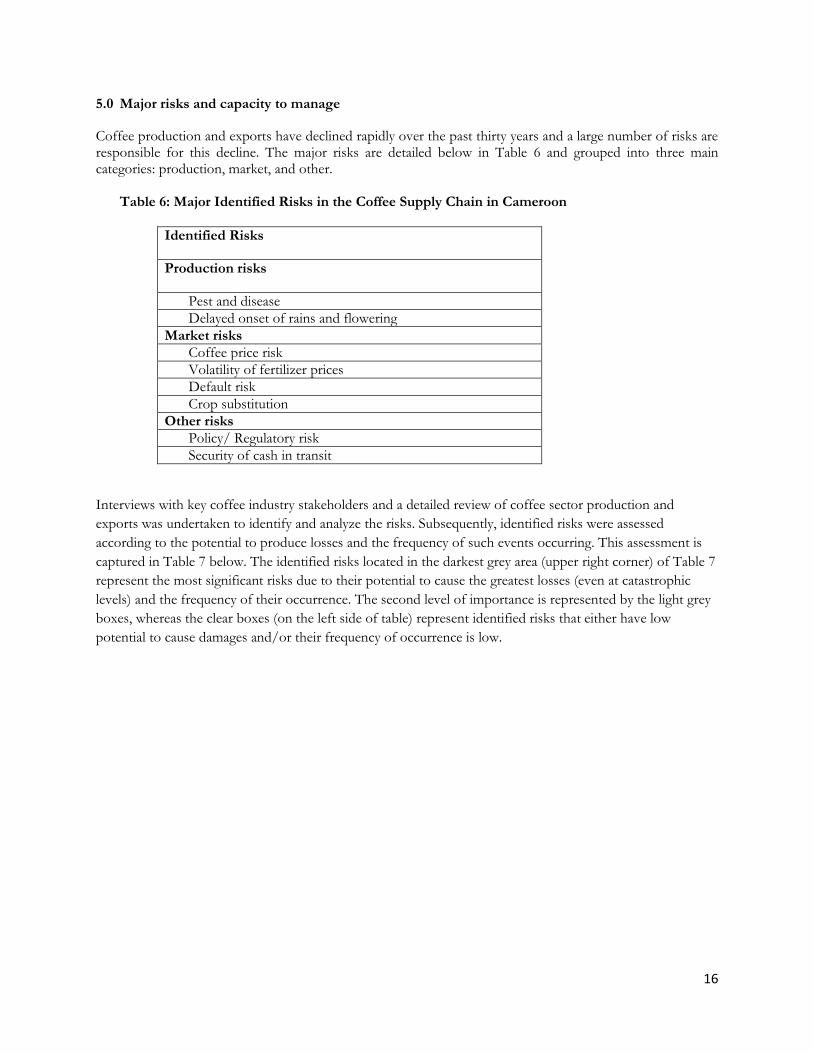
5.0 Major risks and capacity to manage
Coffee production and exports have declined rapidly over the past thirty years and a large number of risks are responsible for this decline. The major risks are detailed below in Table 6 and grouped into three main categories: production, market, and other.
Table 6: Major Identified Risks in the Coffee Supply Chain in Cameroon
Identified Risks
Production risks
Pest and disease
Delayed onset of rains and flowering
Market risks
Coffee price risk
Volatility of fertilizer prices
Default risk
Crop substitution
Other risks
Policy/ Regulatory risk
Security of cash in transit
Interviews with key coffee industry stakeholders and a detailed review of coffee sector production and
exports was undertaken to identify and analyze the risks. Subsequently, identified risks were assessed
according to the potential to produce losses and the frequency of such events occurring. This assessment is
captured in Table 7 below. The identified risks located in the darkest grey area (upper right corner) of Table 7
represent the most significant risks due to their potential to cause the greatest losses (even at catastrophic
levels) and the frequency of their occurrence. The second level of importance is represented by the light grey
boxes, whereas the clear boxes (on the left side of table) represent identified risks that either have low
potential to cause damages and/or their frequency of occurrence is low.

17
Table 7. Summary of risks: Severity vs. probability
Pro
bab
ilit
y o
f E
ven
t
Potential Severity of Impact
Negligible Moderate Considerable Critical Catastrophic
Highly
probable
Pest and
disease
Probable Coffee price
risk
Occasional Security of cash
in transit
Crop substitution
Volatility of
fertilizer prices
Default risk
Policy/
regulation risk
Remote Delayed
onset of
rains and
flowering
Improbable
5.1 Production risk: Pest and disease (coffee berry disease (CBD), coffee borer and coffee leaf rust) and
delayed onset of rains and flowering are the two major production risks to the Cameroon coffee supply chain.
Pest and disease
Severity: Moderate
Probability: Highly probable
Inability to manage pest and disease incidences has been one of the major reasons for the decline of Arabica
production from 30,000 MT in mid 1980s to 3,000 MT in 2009. Coffee berry disease, coffee rust, and coffee
borer are causing significant quantity and quality losses. Lack of plant protection material, advice and
understanding of pests and diseases control, coupled with lack of incentives to manage plantations, are the
major limitations in confronting this risk. This risk is classed as moderate as it impacts mainly Arabica coffee
production, which is currently a relatively small part of Cameroonian coffee industry.
Coffee Berry Disease (CBD): This is caused by the virulent strain of Colletotrichum coffeanum a
fungus that lives in the bark of the coffee tree and produces spores which attack the coffee cherries.
It is one of the most severe diseases for Arabica coffee and, in many cases, causes losses of almost

18
30-50 % of the production7. CBD has infected the Arabica production region for the past 15-20
years and infestation rates vary from 40-60%. It has destroyed significant acreage of Arabica
plantations and, despite higher prices of Arabica coffee, many farmers have switched over to other
crops because of their inability to manage this risk. The Government is now promoting CBD
resistant coffee varieties which will help reduce the losses from this disease.
Coffee Borer: The insect bores into the coffee cherries damaging the coffee bean, affecting the
quality of the coffee and consequently lowering the production and efficiency yields. It can cause
coffee farmers to lose up to 20 % of a crop and reduce the price by 30-40 %. Professional
management of the coffee plantations is essential for the prevention and eradication of the coffee
borer disease. This is a relatively minor disease and largely affects the Robusta plantations.
Coffee Leaf Rust: There is a high prevalence of this disease and it largely affects the Arabica
plantations. Coffee leaf rust is spread by wind and rain from the lesions on the underside of the
plant. It causes defoliation and can lead to 10-15 % yield reduction. This disease is closely linked to
the habits of the cultivation and management of the plantation.
These pest and disease outbreaks and the resulting losses to the farmers are generally manageable through a
coordinated effort focusing on integrated management approach. This approach requires a combination of 1)
legislative control, 2) cultural control, 3) biological control, and 4) chemical control. If all these approaches
are adopted consistently and implemented by coffee supply chain stakeholders, losses from pest and disease
outbreak can be greatly reduced.
Delayed flowering
Severity: Moderate
Probability: Remote
A few farmers indicated that flowering will be delayed during the current 2009/10 season due to the delayed
onset of rains, and this will reduce coffee yields. This, however, is an anomaly. In general, weather conditions
are quite conducive for coffee production. The last known occurrence of delayed flowering was in the 1983-
84 season when drought condition led to a 50-70 %8 decline in production in the affected regions. Although
the uncertainty associated with climatic and weather patterns makes it difficult to predict future occurrences
of this event, however, based on historical patterns, the probability of its large scale occurrence is remote.
7 Although Olam Cam estimates that 50 – 60% of the production is lost to Coffee Berry Disease (CBD) each year.
(Source: World Bank 2010)
8 Source : Annual report by National Produce Marketing Board 1983-84 Season
19
5.2 Market Risk: Volatility in international coffee prices, steep rises in fertilizer prices, crop substitution, and
default risks (credit, volume, and quality default) are the main market risks facing the industry.
Coffee price risk
Potential Severity of Impact: Critical
Probability of Event: Probable
Prior to liberalization, the Government managed a price stabilization program with the objective of
guaranteeing a stable price and shielding coffee farmers from the volatility in international coffee prices.
While this offered some protection to the farmers against the fall in international prices, farmers did not
benefit from any price rise. In 1989-90 season, the international prices fell drastically and ONCPB was forced
to reduce the farm gate prices of Robusta by 60% from CFAF 440 to CFAF 175. Over the next 3 years, the
prices continued to fall and Government could not afford to maintain its price stabilization program. This
price decline, coupled with advice from international donors, promoted the Government of Cameroon to
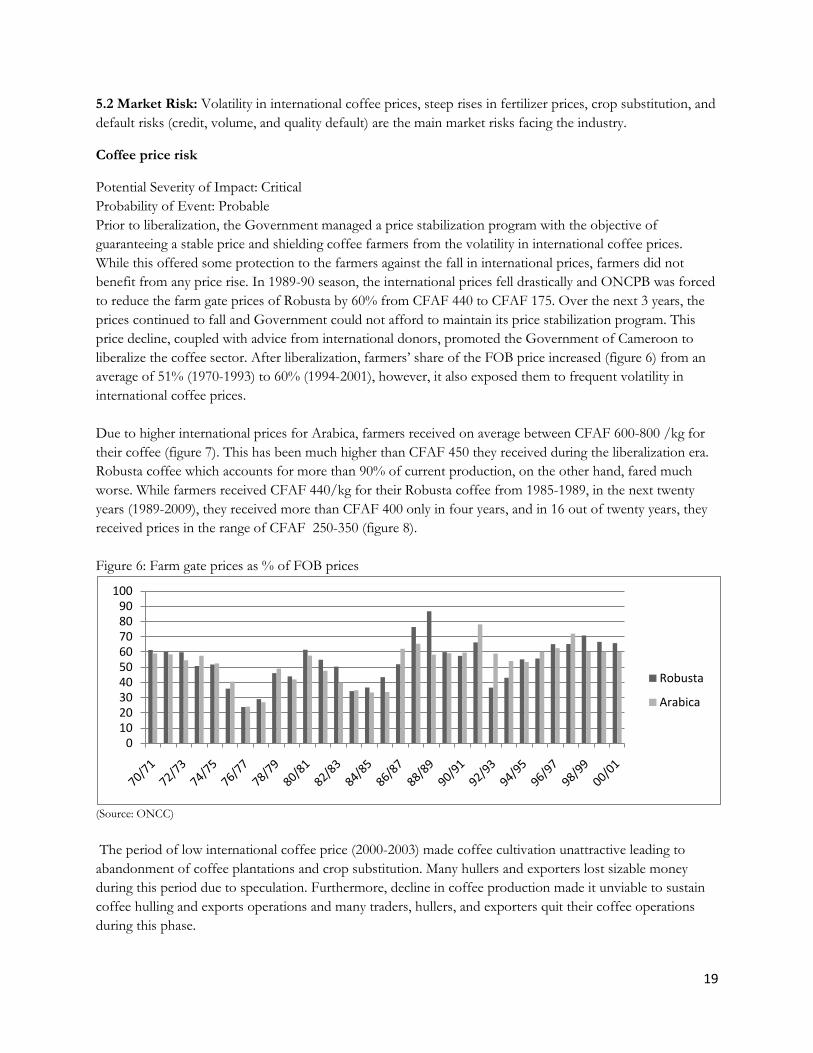
liberalize the coffee sector. After liberalization, farmers‟ share of the FOB price increased (figure 6) from an
average of 51% (1970-1993) to 60% (1994-2001), however, it also exposed them to frequent volatility in
international coffee prices.
Due to higher international prices for Arabica, farmers received on average between CFAF 600-800 /kg for
their coffee (figure 7). This has been much higher than CFAF 450 they received during the liberalization era.
Robusta coffee which accounts for more than 90% of current production, on the other hand, fared much
worse. While farmers received CFAF 440/kg for their Robusta coffee from 1985-1989, in the next twenty
years (1989-2009), they received more than CFAF 400 only in four years, and in 16 out of twenty years, they
received prices in the range of CFAF 250-350 (figure 8).
Figure 6: Farm gate prices as % of FOB prices
(Source: ONCC)
The period of low international coffee price (2000-2003) made coffee cultivation unattractive leading to
abandonment of coffee plantations and crop substitution. Many hullers and exporters lost sizable money
during this period due to speculation. Furthermore, decline in coffee production made it unviable to sustain
coffee hulling and exports operations and many traders, hullers, and exporters quit their coffee operations
during this phase.
0102030405060708090
100
Robusta
Arabica

20
Figure 7: FOB, Farm-gate Prices and International prices for Arabica coffee (1970-2007)
(Source : ONCC and authors‟ elaboration. Missing Data 2001-2005 and 2008-10)
Figure 8: FOB, Farm-gate Prices and International prices for Robusta coffee (1970-2007)
(Source: ONCC and authors‟ elaboration. Missing Data 2001-2005 and 2008-109)
9 ONCC was unable to provide data on domestic farm gate prices from 2001/02-2004/05 seasons) but it is reasonable to expect the
prices to have been below CFAF200 during this period.

21
Since 2004, international coffee prices have increased substantially and this has led to a resurgence of interest
in the coffee sector. While the farm gate coffee prices have risen, however, general inflation and input prices
have risen much faster and coffee farmers‟ net income is far less than what it used to be during the mid 80s.
At the same time, prices of cocoa, palm oil, fruits and vegetables and other alternative crops have been rising,
serving as a big disincentive for the coffee farmers to continue coffee cultivation.
Intra-seasonal price volatility, as well as possibility of long term decline in coffee prices, continues to be a
significant risk for the Cameroon coffee industry. Farmers are aware of the price movements, through
newspapers and social networks, but they have limited mechanisms to manage the price risk. The option of
storing and selling coffee later when prices are higher is not feasible for majority of the cash constrained
farmers. In some cases, farmers pool their coffee, formally through GICs or through informal networks, to
bargain with traders for higher prices. Cooperatives, because of their ability of manage greater volumes of
coffee could engage in price hedging on behalf of their member farmers, however, most of the cooperatives
are dysfunctional and not in a condition to hedge against price risk. Under such conditions, improving
productivity and lowering cost of cultivation, might be more proactive strategies for the farmers to provide
some protection against the fall in coffee prices.
The practice of entering into short duration contracts (10-14 days), offers some protection to hullers, traders
and exporters against short term adverse price movements. The majority of exporters, being part of
international trading enterprises, are hedging against price risk in commodity exchanges and are secured, to
some extent, against seasonal price volatility. Domestic exporters with no international affiliation, on the
other hand, have limited understanding of such tools and/or access to commodity exchanges and are not
using such mechanisms to protect themselves against adverse price movements
Volatility of fertilizer prices
Potential Severity of Impact: Considerable
Probability of Event: Occasional
Fertilizer prices and availability has been cited as the biggest problem in the farmers‟ focus group discussion
(annexure 3), and a result, current usage of fertilizers in very limited. While Urea prices were in the range of
CFAF 10,000 /bag in 2003-04, it jumped up to CFAF 25,000 in 2009 due to international fertilizer price hike
(figure 9). While the international price dropped significantly in June 2009 and reverted back to 2007 levels,
prices of fertilizer in Cameroon continue to be high.

22
Figure 9: Fertilizer prices in Cameroon and US
(Source: Agricultural Delegation office, Northwest Region, Cameroon (Missing data 2006-2007) and National Agricultural Statistics
Service, USDA)
Farmers at times respond to fertilizer price rise by reducing the fertilizer usage leading to lower yields and
incomes. There is little scope for farmers to mitigate against this risk as they purchase their inputs at specific
times as and when required and are unlikely to have the financing or facilities for pre-ordering or pre-
purchasing fertilizers to lock-in prices. There is likely to be continued volatility in input prices, however,
promotion of efficient usage of fertilizers (better cropping practices) and promotion of manure/compost
could help in partial mitigation of risk.
Default Risk
Potential Severity of Impact: Considerable
Probability of Event: Occasional
The entire supply chain is exposed to this risk and different stakeholders have experienced financial losses
due to counterparty (either farmer, agent, huller, or exporter) defaulting on the money advanced as well as on
the quantity and quality supplied. Exporters attempt to manage default risk by relying on a few committed
suppliers and advancing only part of the total finance required by the hullers/traders. Despite careful scrutiny
there are incidences of default by hullers/traders, especially during the period of intense price volatility where
upward movement in prices encourages them to default on their contracts.
Farmers, at times, also take advantage of competing traders and default on their commitments. This leads to
considerable financial losses to various actors, mostly exporters; it also creates an environment of mistrust in
the supply chain which hampers long term competitiveness. Supply chain integration, greater transparency in
transactions, and access to finance for different stakeholders, could lead to reduced occurrence of default risk.
0
100
200
300
400
500
600
0
5000
10000
15000
20000
25000
30000
2003 2004 2005 2006 2007 2008 2009 2010
US$ per tonCFAF per Bag(60 Kg bag)
International Urea Prices ($US per ton) Urea (Low)
Urea (High) 20:10:10 (Low)
20:10:10(High)

23
Crop substitution
Potential Severity of Impact: Considerable Probability of Event: Occasional In the past, lower coffee prices have prompted farmers to uproot their coffee trees and replace them with
alternate crops. The coffee crisis of 2000-2003 led to large scale crop substitution as farmers migrated from
coffee to cocoa, as evidenced by figure 10. Currently, cocoa, palm oil, peppers, fruits and vegetables are
providing higher income than coffee and are becoming more attractive options for the farmers. Returns from
coffee cultivation as well as returns from other crops (over which the coffee industry has little control) are
major factors that determine farmers‟ cropping decision and crop substitution. Better supply chain integration
and increasing farmers‟ incomes by improving yields could be some risk mitigation measures to manage this
risk.
Figure 10: Coffee and Cocoa Area Harvested HA 1975-2008
(Source: FAOSTAT)
5.3 Other risks
Regulatory/ Policy risk
Potential Severity of Impact: Critical
Probability of Event: Occasional
Coffee is a politicized commodity and despite liberalization, the Government still plays an influential role in
the coffee sector. Ministry of Commerce stipulates, through its reglementation10, the conditions under which
coffee cherries can be harvested and sold. The post-liberalization period (1994-2005) did not see proactive
Government involvement in the coffee sector. In the past four years, however, the Government has started
10 Ministry of commerce does this through its annual circulars called “Reglementant le conditionnement et la commercialization des
cafes verts” (Regulating the packacing and commercialization of Green coffee”

24
to pay closer attention to the sector, and has developed programs aimed at increasing production through the
distribution of subsidized planting materials and fertilizers. While this has led to a resurgence in interest
among many farmers, it has also raised expectations of increased Government intervention in the sector.
Many stakeholders in the supply chain have a somewhat nostalgic image of the pre-liberalization era and it is
associated with „good times‟ in the industry. There is a belief, among many stakeholders, that re-instatement
of the former system would lead to prosperity. This legacy of the past might create political incentives for
greater state regulation and repeal of some of the earlier policies which could create significant risks for the
industry. The risk of sudden changes in the regulation of the sector is real and could have significant
ramifications for the industry. Proactive lobbying by the coffee industry stakeholders and greater engagement
in policy formulation, and clarifying expectation, could help in managing this risk.
Security of cash in Transit
Potential Severity of Impact: Negligible
Probability of Event: Occasional
The rural areas in Cameroon have limited banking facilities and exporters and their agents need to travel with
cash to make payments for coffee procurement. The majority of exporters indicated that security of cash in
transit is a big risk for them and all of them have suffered some losses in the past due to cash being stolen or
robbed from their agents. The volume of such losses, however, is negligible for the industry.
25
6. Vulnerability to risk
Based on the risk assessment and capacity to manage risks described in the previous sections, this section
offers an additional step to classify the risks according to different levels of vulnerability. For the purpose of
this exercise we can define vulnerability as a function of the expected losses from an adverse event and the
capacity to respond to this risk. This last step in the analysis of risks not only allows a more comprehensive
assessment of the level of risk, but also helps to identify priorities to improve current risk management
approaches. At this stage, the analysis seeks to pinpoint clear gaps in the prevailing approach(es) to risk
management and/or circumstances where prevailing practices are unlikely to be sufficient given the potential
severity of loss.
Even though at this stage the analysis is more qualitative than quantitative, the results shown here are useful
for contrasting these findings with current risk management practices by stakeholders in the supply chain.
Based on the information that was collected during the mission and background information, the
effectiveness and current capacity for managing pertinent risks has been reviewed and rated utilizing the 1-5
scale outlined in Table 8 below.
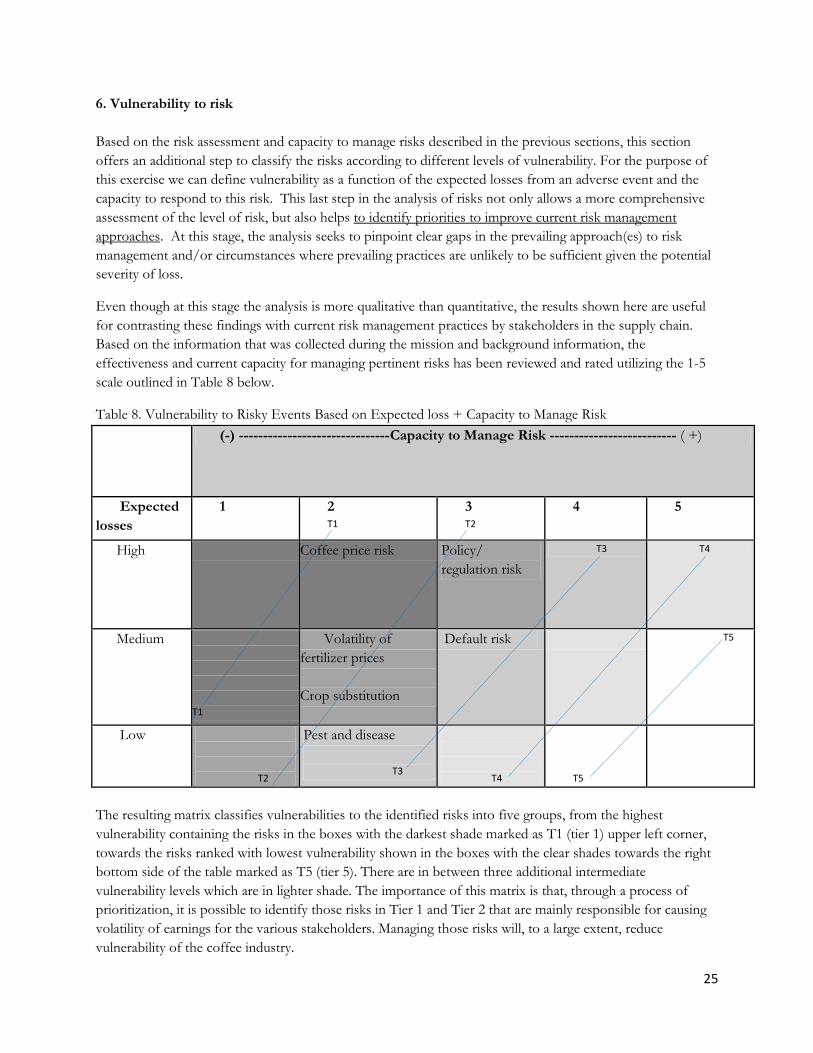
Table 8. Vulnerability to Risky Events Based on Expected loss + Capacity to Manage Risk
(-) -------------------------------Capacity to Manage Risk -------------------------- ( +)
Expected
losses
1 2 T1
3 T2
4 5
High Coffee price risk Policy/
regulation risk
T3 T4
Medium
T1
Volatility of
fertilizer prices
Crop substitution
Default risk T5
Low
T2
Pest and disease
T3
T4
T5
The resulting matrix classifies vulnerabilities to the identified risks into five groups, from the highest
vulnerability containing the risks in the boxes with the darkest shade marked as T1 (tier 1) upper left corner,
towards the risks ranked with lowest vulnerability shown in the boxes with the clear shades towards the right
bottom side of the table marked as T5 (tier 5). There are in between three additional intermediate
vulnerability levels which are in lighter shade. The importance of this matrix is that, through a process of
prioritization, it is possible to identify those risks in Tier 1 and Tier 2 that are mainly responsible for causing
volatility of earnings for the various stakeholders. Managing those risks will, to a large extent, reduce
vulnerability of the coffee industry.

26
7.0 Priority Measures for Risk Management
Though it is beyond the scope of this Risk Assessment exercise to come up with a comprehensive framework
with detailed measures on how to manage the identified risks, an illustration on how this next step can be
approached is presented in Table 9. For illustration purpose, this table only deals with the major risks
grouped under Tier 1 & 2 in the previous section.
For a comprehensive risk management framework it is useful to classify the measures or tools for risk
management in terms of three main groups:
Risk Mitigation. Actions taken to eliminate or reduce events from occurring, or reduce the severity of losses
(e.g. pest and disease management, crop diversification, extension, etc).
Risk Transfer . Actions that will transfer the risk to a willing third party, at a cost. Financial transfer
mechanisms will trigger compensation or reduce the losses in the case of a risk generated loss (e.g., insurance,
re-insurance, financial hedging tools, etc.).
Risk Coping. Actions that will help cope with the losses caused by a risk event (e.g. government assistance to
farmers, debt re-structuring, etc.). It could also be managed by shifting a country‟s focus from a post-disaster
response to a proactive (ex-ante) risk management (e.g. through financial provisioning).
Table 9: Illustration of Measures for a Risk Management Framework
Identified Risks Proposed Mitigation Proposed Risk
Transfer Tools
Proposed Risk
Coping
Coffee price risk Long term forward contracts
Specialty/ Niche markets
(decommoditization)
Yield improvements
Hedging in
commodity
exchange
Savings
Policy/
regulation risk Lobbying
Active engagement in the
process
Adjustment
of business
practice
Volatility of
fertilizer prices Long term forward
contracts
Promotion of efficient
usage of fertilizer ( better
cropping practices)
Promotion of manure/
compost
Crop substitution Supply chain integration
Improvement of coffee
yield
Improved farm level
income
27
Table 9 above is merely an illustrative, and not an exhaustive, set of activities that could be undertaken for
managing the risks in the coffee supply chain. Risk transfer solutions, owning to the nature of the risk and
specific structures in the Cameroon coffee supply chain, might have limited applicability. Risk mitigation and
coping solutions, on the other hand, might provide a better return on investments. In-depth evaluation of the
individual solutions was beyond the scope of this exercise, however, exhaustive listing and an assessment of
cost/benefit of different solutions needs to be undertaken by the coffee sector stakeholders.
8.0 Final remarks
The coffee industry has experienced multiple shocks (liberalization, the international coffee price crisis, pest
and disease) and the cumulative impact of all these shocks has been a rapid decline in national coffee
production. Despite the decline, coffee is still an important source of income for certain farming households
and the fourth largest agricultural export commodity for Cameroon. Realizing its significance for the country,
the Government and international donors have focused their attention on reviving the industry and
Cameroon‟s coffee strategy has been developed as a blueprint for that revival.
Besides overcoming the large number of constraints, any successful reinvigoration of the sector requires
attention on the effective management of key risks facing the industry. Long term price decline and intra
seasonal price volatility continue to be the biggest risk for the country and any sudden drop in prices might
lead to another round of acreage and production losses for the country. The „legacy‟ of the past and
expectations, by many stakeholders, of increased state intervention and changes in regulation in the coffee
industry pose another serious risk for the industry.
Input markets are poorly developed in Cameroon and fertilizer usage is very low. Steep rises in fertilizer
prices will further reduce its application leading to adverse impact on coffee productivity and farmers‟
income. Crops like cocoa, fruits and vegetables, and palm oil are providing greater incomes to farmers and
this poses the risk of crop substitution for the coffee industry. Effective management of these risks will
require a strategy combining elements of risk mitigation, transfer, and coping.
Cameroon‟s coffee revival strategy needs to address the structural impediments in the supply chain, focus on
developing win-win relationships among various stakeholders, and develop mechanisms to improve the
resilience of the supply chain to manage future shocks. This document highlights and prioritizes risks in the
Cameroonian coffee supply chain and should be used to stimulate discussion and inform the implementation
of the national coffee strategy.

28
References:
World Bank (2009) Production of Washed Coffee – Arabica and Robusta: Feasibility Study, December, 2009
World Bank (2008) Cameroon Agricultural Value Chain Competitiveness Study, June 2008
ITC (2009) Cameroon Coffee Sector Development Strategy 2010-2015
CTA (2008) An Interprofessional Organization for Coffee and Cocoa in Cameroon, for which services and
for whom? September 2008
African Economic Research Consortium (2002) Determinants of Agricultural exports: The case of Cameroon
by Daniel Gbetnkom and Sunday A Khan. AERC Research Paper 120. African Economic research
Consortium, Nairobi August 2002
29
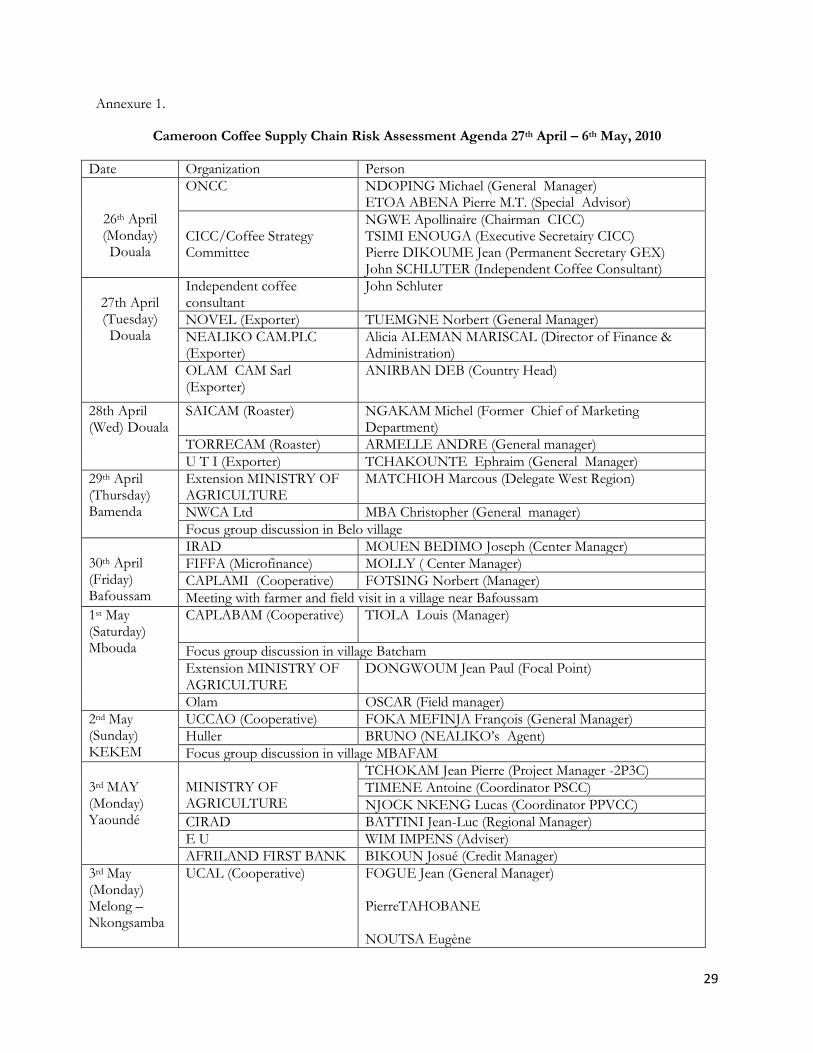
Annexure 1.
Cameroon Coffee Supply Chain Risk Assessment Agenda 27th April – 6th May, 2010
Date Organization Person
26th April (Monday) Douala
ONCC NDOPING Michael (General Manager) ETOA ABENA Pierre M.T. (Special Advisor)
CICC/Coffee Strategy Committee
NGWE Apollinaire (Chairman CICC) TSIMI ENOUGA (Executive Secretairy CICC) Pierre DIKOUME Jean (Permanent Secretary GEX) John SCHLUTER (Independent Coffee Consultant)
27th April (Tuesday) Douala
Independent coffee consultant
John Schluter
NOVEL (Exporter) TUEMGNE Norbert (General Manager)
NEALIKO CAM.PLC (Exporter)
Alicia ALEMAN MARISCAL (Director of Finance & Administration)
OLAM CAM Sarl (Exporter)
ANIRBAN DEB (Country Head)
28th April (Wed) Douala
SAICAM (Roaster) NGAKAM Michel (Former Chief of Marketing Department)
TORRECAM (Roaster) ARMELLE ANDRE (General manager)
U T I (Exporter) TCHAKOUNTE Ephraim (General Manager)
29th April (Thursday) Bamenda
Extension MINISTRY OF AGRICULTURE
MATCHIOH Marcous (Delegate West Region)
NWCA Ltd MBA Christopher (General manager)
Focus group discussion in Belo village
30th April (Friday) Bafoussam
IRAD MOUEN BEDIMO Joseph (Center Manager)
FIFFA (Microfinance) MOLLY ( Center Manager)
CAPLAMI (Cooperative) FOTSING Norbert (Manager)
Meeting with farmer and field visit in a village near Bafoussam
1st May (Saturday) Mbouda
CAPLABAM (Cooperative) TIOLA Louis (Manager)
Focus group discussion in village Batcham
Extension MINISTRY OF AGRICULTURE
DONGWOUM Jean Paul (Focal Point)
Olam OSCAR (Field manager)
2nd May (Sunday) KEKEM
UCCAO (Cooperative) FOKA MEFINJA François (General Manager)
Huller BRUNO (NEALIKO‟s Agent)
Focus group discussion in village MBAFAM
3rd MAY (Monday) Yaoundé
MINISTRY OF AGRICULTURE
TCHOKAM Jean Pierre (Project Manager -2P3C)
TIMENE Antoine (Coordinator PSCC)
NJOCK NKENG Lucas (Coordinator PPVCC)
CIRAD BATTINI Jean-Luc (Regional Manager)
E U WIM IMPENS (Adviser)
AFRILAND FIRST BANK BIKOUN Josué (Credit Manager)
3rd May (Monday) Melong – Nkongsamba
UCAL (Cooperative) FOGUE Jean (General Manager) PierreTAHOBANE NOUTSA Eugène

30
Independent Huller EFFOWAKEU François NKWEJA Patrice TETINOU Rigobert
Meeting with large Farmer (16 ha)
TEMKENG
4th May (Tuesday) Abong-Mbang
Extension MINISTRY OF AGRICULTURE
NZIE Emmanuel (Focal Point)
Huller TOKAM FOTSO Jean Claude
Focus group discussion in village NDJIBE
Farmers meeting in ANKOAMBOMB village (village)
MINISTRY OF AGRICULTURE
NGONG Christopher Fertilizer sub-sector reform programme
4TH May (Tuesday) Melong-Nkongsamba
Large Farmer and Wife NDIKI Guy and NDIKI Sidonie
JACO Representative, Agence de Paysan
KENGNI Sylvestre
Retailer, Maison des Planteurs
TCHAPTCHET Philippe
Independent Huller TANETCHOP Norbert
5th May (Wed) Douala
ADER (Fertilizer company) NDENGUE MOLE (Logistic Manager)
ONCC MALEDY Omer (Special Advisor)
GIC PROBA (exporter)
KONLACK Raymond (Administrator)
AFRILAND FIRST BANK NGUEGANG Cyrille (Credit Manager)
UTRAC (Logistics) LOVET Laurent NKWADA Justin EPO Serge Regnault
METEOROLOGICAL DEPARTMENT
SAAH Michel Legrand (National Director)
6th May (Thursday) Douala
Stakeholder Workshop to share the assessment findings with selected coffee stakeholders
31
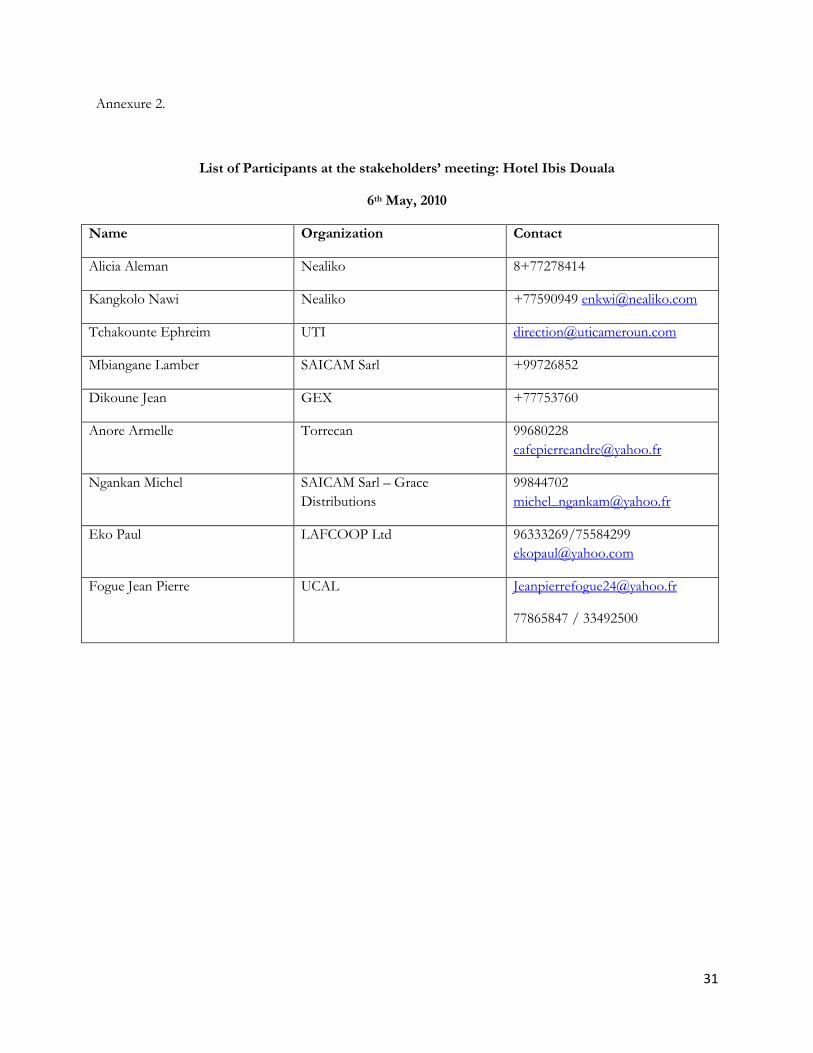
Annexure 2.
List of Participants at the stakeholders’ meeting: Hotel Ibis Douala
6th May, 2010
Name Organization Contact
Alicia Aleman Nealiko 8+77278414
Kangkolo Nawi Nealiko +77590949 [email protected]
Tchakounte Ephreim UTI [email protected]
Mbiangane Lamber SAICAM Sarl +99726852
Dikoune Jean GEX +77753760
Anore Armelle Torrecan 99680228
Ngankan Michel SAICAM Sarl – Grace
Distributions
99844702
Eko Paul LAFCOOP Ltd 96333269/75584299
Fogue Jean Pierre UCAL [email protected]
77865847 / 33492500
32
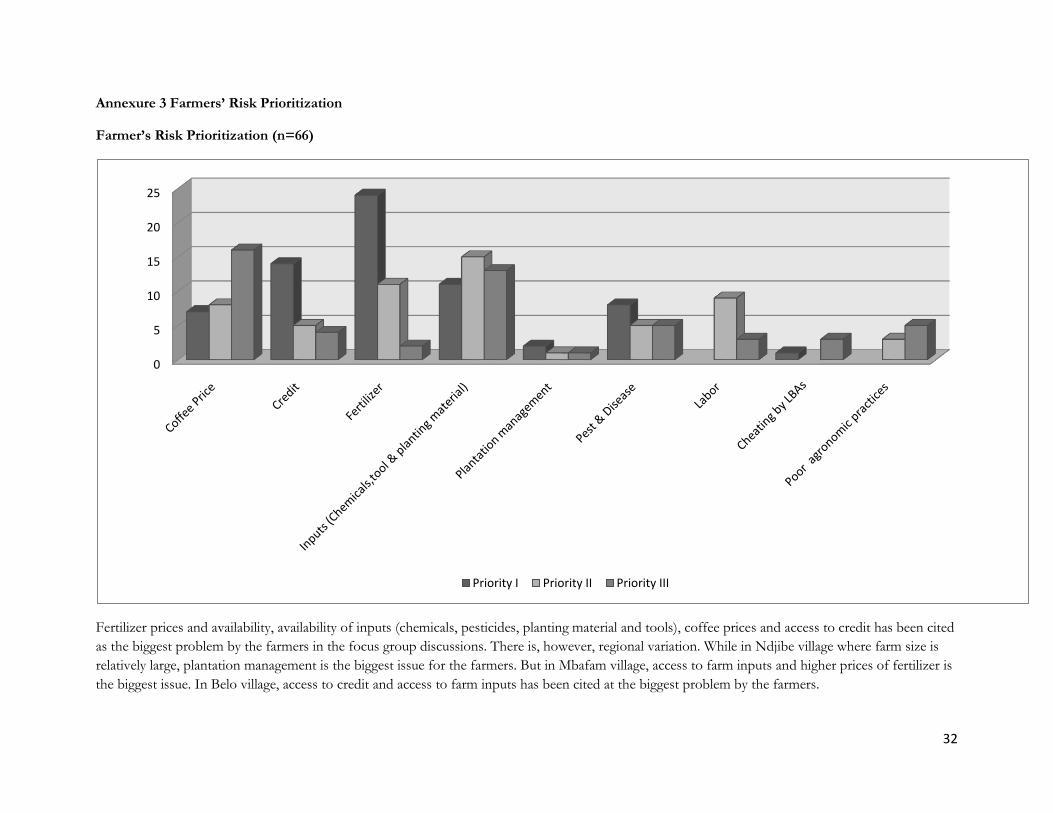
Annexure 3 Farmers’ Risk Prioritization
Farmer’s Risk Prioritization (n=66)
Fertilizer prices and availability, availability of inputs (chemicals, pesticides, planting material and tools), coffee prices and access to credit has been cited
as the biggest problem by the farmers in the focus group discussions. There is, however, regional variation. While in Ndjibe village where farm size is
relatively large, plantation management is the biggest issue for the farmers. But in Mbafam village, access to farm inputs and higher prices of fertilizer is
the biggest issue. In Belo village, access to credit and access to farm inputs has been cited at the biggest problem by the farmers.
0
5
10
15
20
25
Priority I Priority II Priority III

33
0
2
4
6
8
10
12
Finance Fertilizer Pest & Disease Prices Inputs (Tools, pesticide and
planting material)
Farmers' Risk Prioritization Mbafam Village (n= 18)
Priority I Priority II Priority III
0
2
4
6
8
Plantation Mgmt
Fertilizer Disease Prices Input Cheating by LBAs
Risk Prioritization in Ndjibe Village (n= 14)
Priority I Priority II Priority III
02468
1012
Finance Fertilizer Pest & Disease Prices Inputs (Tools, pesticide and
planting material)
Farmers' Risk Prioritization Belo Village (n= 16)
Priority I Priority II Priority III