1998 physical separation and acid leaching a demonstration
TRANSCRIPT

Approved for public release; distribution is unlimited.
Contract ReportCR 98.011-ENV
NAVAL FACILITIES ENGINEERING SERVICE CENTERPort Hueneme, California 93043-4370
TECHNOLOGY APPLICATION ANALYSIS
Physical Separation and Acid Leaching
A Demonstration of Small-Arms Range Remediationat Fort Polk, Louisana
Printed on recycled paper
NA
VA L F A C I L I T I ES
EN
GI
NE
E
RI N G S E R V I C
EC
EN
TE
R
An Investigation Conducted by
BattelleColumbus, Ohio
February 1998

TECHNOLOGY APPLICATION ANALYSIS
Physical Separation and Acid Leaching
A Demonstration of Small-Arms Range Remediationat Fort Polk, Louisiana
Prepared for
Naval Facilities Engineering Service Center (NFESC)Port Hueneme, California
and
U.S. Army Environmental Center (USAEC)Aberdeen Proving Grounds, Maryland
by
BattelleColumbus, Ohio
September 18, 1997

ii NFESC and USAEC September 18, 1997
This report is a work prepared for the United States Government by Battelle. Inno event shall either the United States Government or Battelle have any respon-sibility or liability for any consequences of any use, misuse, inability to use, orreliance on the information contained herein, nor does either warrant orotherwise represent in any way the accuracy, adequacy, efficacy, or applicabilityof the contents hereof.

September 18, 1997 NFESC and USAEC iii
Contents
Technology ........................................................................................................................................................... 1Site........................................................................................................................................................................ 1Site History ........................................................................................................................................................... 1Demonstration Background.................................................................................................................................. 1Heavy Metals of Concern ..................................................................................................................................... 2Performance Objectives........................................................................................................................................ 3Technology Principles .......................................................................................................................................... 3
Physical Separation .................................................................................................................................... 3Acid Leaching ............................................................................................................................................ 5
Range Characterization......................................................................................................................................... 5Bench Scale Testing ............................................................................................................................................. 7Additional Soil and Target Metals Characteristics ............................................................................................... 8Site Preparation .................................................................................................................................................. 10Vendor 1 and the Acetic Acid Plant ................................................................................................................... 12
Physical Separation Module..................................................................................................................... 13Acid Leaching Module............................................................................................................................. 13
Vendor 2 and the Hydrochloric Acid Plant ........................................................................................................ 13Physical Separation Module..................................................................................................................... 14Acid Leaching Module............................................................................................................................. 15
Evaluation Methodology .................................................................................................................................... 17Collecting and Preparing Representative Samples................................................................................... 17Analytical Methods .................................................................................................................................. 19On-Site XRF Analysis.............................................................................................................................. 22
Quality Assurance (QA) ..................................................................................................................................... 22Vendor 1 Performance........................................................................................................................................ 25
Process Efficiency .................................................................................................................................... 25Process Residuals ..................................................................................................................................... 25Plant Reliability ........................................................................................................................................ 28
Vendor 2 Performance........................................................................................................................................ 29Process Efficiency .................................................................................................................................... 29Process Residuals ..................................................................................................................................... 33Plant Reliability ........................................................................................................................................ 34
Cost of Application............................................................................................................................................. 35Fixed Costs ............................................................................................................................................... 35Variable Costs .......................................................................................................................................... 35Total and Unit Costs................................................................................................................................. 36
Acetic Acid versus Hydrochloric Acid............................................................................................................... 38Technical and Cost Comparison with Other Technologies ................................................................................ 38Regulatory/Institutional Issues............................................................................................................................ 40Application at Other Sites................................................................................................................................... 41
Technical and Economic Feasibility......................................................................................................... 41Regulatory Perspective............................................................................................................................. 43Vendor Selection and Contracting ........................................................................................................... 43Process Verification ................................................................................................................................. 44
Schedule ............................................................................................................................................................. 45Lessons Learned ................................................................................................................................................. 45Sources ............................................................................................................................................................... 46Additional References ........................................................................................................................................ 46Analysis Preparation........................................................................................................................................... 47Certification ........................................................................................................................................................ 47

September 18, 1997 NFESC and USAEC 1
Physical Separation and Acid Leaching
A Demonstration of Small-Arms Range Remediationat Fort Polk, Louisiana
Technology
The technology demonstrated in this project was a combination of physical separation and acid leachingthat can be used to remove lead and other heavy metals from small-arms range soils. Physical separationis used to remove particulate metals and acid leaching is used to remove the metals that are present asvery fine particulates or molecular/ionic species bound to the soil matrix. These techniques were com-monly used for many years in the mining industry for separating metals from ores and, more recently, inthe remediation industry for removing target metals by soil washing.
Site
The technology was demonstrated on soils from Range 5 at Fort Polk, an Army Base near Leesville,Louisiana as shown in Figure 1. The demonstration was conducted in an old parking lot approximately2 miles away from the range by road, in an area called Block 4700. The demonstration site was locatedsome distance from the range to avoid temporarily closing adjacent ranges, whose cones of lethal fireextend into Range 5. Also, the demonstration site was located near an available power supply.
Site History
Range 5 is an active 300-meter small-arms range that has been mainly used for M-16 rifle training. Therange has three berms, the last of which runs along the edge of a wetland. Fort Polk was selected for thedemonstration because it is environmentally proactive and has active ranges that contain soil and targetmetals of the type and quantity typically found at several DoD ranges.
Demonstration Background
The separation/leaching technology demonstration at Range 5, Fort Polk was a joint effort between theNaval Facilities Engineering Service Center (NFESC) and U.S. Army Environmental Center (USAEC).Funding for the demonstration was provided by the Environmental Security Technology CertificationProgram (ESTCP). In anticipation of the demonstration, BDM Engineering Services, Inc. (BDM), themission support contractor for Fort Polk, prepared the required National Environmental Policy Act(NEPA) documentation that examined potential impacts from the demonstration activities. A Record ofEnvironmental Consideration was approved in April 1996. The field activities related to the demonstra-tion were conducted between August and December 1996. During this period, two vendors demonstratedtheir variations of the technology. The two vendors were selected after a worldwide search conducted byUSAEC and BDM for commercial vendors with the required capabilities. Vendor 1 was requested to useacetic acid leaching and Vendor 2 was requested to use hydrochloric acid leaching. Battelle, undercontract to NFESC, conducted the independent evaluation of the technology and its application at FortPolk, as documented in this report.


September 18, 1997 NFESC and USAEC 3
Performance Objectives
The goal of the demonstration was to evaluate a promising new alternative, physical separation and acidleaching, for small-arms range soil processing. This goal was attained by contracting two vendors toconduct a demonstration with the following objectives:
q Design and mobilize their respective plants at Fort Polk and process up to 1,000 tons of Range 5soil at an average continuous rate of 5 tons/hr. Each vendor was expected to keep the plantoperational for a period of 15 days.
q Evaluate the efficiencies of two potentially effective acids for leaching. Vendor 1 was asked touse acetic acid leaching and Vendor 2 was asked to use hydrochloric acid leaching.
q Make a good faith attempt to process the range soil to meet the TCLP criterion of 5 mg/L or lessof lead. No criteria were set for other metals, but the removal of copper, zinc, and antimony bythe process was also tracked.
q Achieve the TCLP criterion through metals removal, without the use of stabilization agents. Thetwo vendors were therefore given total metals targets for the processed soil. Vendor 1’s target was1,000 mg/kg. The target was reduced to 500 mg/kg for Vendor 2 to better meet the TCLPcriterion.
q Ensure that the processed soil is physically and chemically suitable for reuse in an active berm.
Technology Principles
The heavy metals removal technology used at Fort Polk had two components — physical separation ofparticulate metals (bullets and bullet fragments) and acid leaching of metal fines and molecular/ionicmetal species.
Physical Separation
Physical separation involves the separation of particles based on their physical properties, such as size,shape, density, or magnetism. Table 1 shows the key attributes of common separation technologies.Other than froth flotation, all the other techniques described in this table were used at Fort Polk in someform or other. Many of these separations are wet processes, that is, the soil and target metals are dis-persed in a water medium. Figure 2 shows the jig, a common gravity separation unit, in which waterpulsation makes denser particles (metals) settle into the underflow or concentrate, whereas the lighter(soil) particles are carried away in the overflow or tailings. At Fort Polk, the metals recovered byclassification and gravity separation were sent to an off-site smelter for recycling of their lead content.
Attrition scrubbers are another commonly used separation element. Some attrition scrubbers are similarto mechanical classifiers (see Figure 3) in that they consist of a basin containing single or multiple shaftswith paddles. These units are used to break up soil agglomerates into individual particles, and thusfacilitate subsequent classification by particle size. Without this deagglomeration, particles of clay in theFort Polk soil would stick to each other and accumulate in the oversize fraction during screening orclassification. In addition to deagglomeration, attrition scrubbers “scrub” oxide or other coatings fromindividual particles. Soil scrubbing is accomplished mostly by particle-to-particle attrition, but also bythe interaction between the paddles and the particles. Log washers and blade mills are two variations ofconventional attrition scrubbers that were used at Fort Polk.
At Fort Polk, physical separation was used to remove as much particulate metal as possible before acidleaching. This allowed the recovery of the majority of the heavy metals through mechanical means andconserved expensive chemical reagents and equipment for the remaining fraction. At some sites, physicalseparation alone may be enough to meet target criteria. At most sites, especially if the TCLP lead criterionhas to be met, leaching will be required to further remove heavy metal fines and molecular/ionic species.

4 NFESC and USAEC September 18, 1997
Table 1. Key Attributes of Common Physical Separation Techniques
TechniqueSize
Separation(Screening)
HydrodynamicSeparation
(Classification)
Density(Gravity)
SeparationFroth
FlotationMagnetic
SeparationBasic Principle Various diameter
openings allowpassage of parti-cles with differ-ent effective size
Different settlingrates due toparticle density,size, or shape
Separation due todensitydifferences
Particles areattracted tobubbles due totheir surfaceproperties
Magneticsusceptibility
MajorAdvantage
High-throughputcontinuousprocessing withsimple, inexpen-sive equipment
High-throughputcontinuousprocessing withsimple, inexpen-sive equipment
High-throughputcontinuousprocessing withsimple, inexpen-sive equipment
Very effectivefor fine particles
Can recover awide variety ofmaterials whenhigh gradientfields are used
Limitations Screens can plug;fine screens arefragile; dryscreeningproduces dust
Difficult whenhigh proportionsof clay, silt, andhumic materialsare present
Difficult whenhigh proportionsof clay, silt, andhumic materialsare present
Particulate mustbe present at lowconcentration
High capital andoperating cost
TypicalImplementation
Screens, sieves,or trommels (wetor dry)
Clarifier,elutriator,hydrocyclone
Shaking table,spiral concen-trator, jig
Air flotationcolumns or cells
Electromagnets,magnetic filters
Sources: U.S. EPA, 1995, EPA/540/R-95/512.
Figure 2. A jig separates out denser metals from soil at Fort Polk.

September 18, 1997 NFESC and USAEC 5
Acid Leaching
Acid leaching belongs to a group of techniques called soil washing, which tries to mobilize the targetmetals from the soil into a solution. The solution is then treated to recover the metals in a concentratedform for off-site disposal or recycling. Acid leaching aims to solubilize metals from the soil by changingthe pH. Adding acid lowers the pH and increases the supply of H+ ions. The H+ ions generated areconsumed in a multitude of reactions that increase soluble metal concentrations.
Acid leaching was conducted at Fort Polk as a continuous process involving the following steps:
q Bringing acid and soil into contact in a leaching tankq Separating the leached soil from the spent leachantq Regenerating the spent leachant by precipitating the heavy metals.
The precipitated metals were dewatered and the resulting sludge was sent to an off-site smelter forrecycling of its lead content. Whereas physical separation is a fast operation in which relatively smallequipment is used to obtain high throughput, leaching is relatively slow and requires larger equipment.
Figure 2. A jig separates out denser metals from soil at Fort Polk.
Figure 3. A classifier carries coarse material up the incline during the demonstration.

6 NFESC and USAEC September 18, 1997
Range Characterization
During their history, small-arms range berms often receive fresh additions of soil from various sources.Therefore, berms tend to be very heterogeneous in terms of soil types (gravel, sand, silt, or clay) andmetals distribution. Obtaining representative samples of the berm material is important to ensure thatbench-scale tests and plant design reflect the material that will be encountered during the field operation.Because of the berm’s heterogeneity, several grab samples should be collected from different locations inthe berm. These samples can be analyzed separately, or composited, mixed, and split into multiplealiquots suitable for analysis.
Two important range material characteristics for designing an appropriate separation/leaching scheme arethe particle sizes of the material and the heavy metal distribution in each size fraction. For example, ahigher clay (fines) content will affect the throughput of both the acid leaching process and the solid-liquid separation operations. Other than such mechanical aspects, fine soils tend to bind lead better thancoarse soils, thus necessitating more aggressive leaching conditions. Both vendors conducted this type ofcharacterization as part of their bench-scale testing.
Because of the uncertainties involved in analyzing smaller samples of soil, Battelle conducted a detailedcharacterization on a representative 30-gallon composite sample of berm soil collected from Range 5.Table 2 contains the particle size analysis results obtained from wet screening of the sample. Wetscreening is advisable for soil characterization. At Fort Polk, dry screening tended to underestimate thefines content of the soil because balls of fine clay were retained on the coarse screens. Figure 4 showsthe results of additional characterization conducted by Battelle to determine the particle size and leaddistribution in various fractions and the amenability of the lead in these fractions to physical separation:
q The raw soil from the berm (feed) had a lead assay of almost 0.5%.
q The +10-mesh coarse fraction constituted 2.3% of the berm material, but contained almost 80%of the original lead. Therefore, the majority of the lead in the range soil is recoverable byrelatively simple size or gravity separation equipment, such as screens or jigs. About 3% of thelead was amenable to magnetic separation, by virtue of its association with the ferromagneticfraction.
Table 2. Particle Size Analysis of the Raw Range Soil (30-gallon sample)
Raw Soil (Total Weight = 142.5 kg) Fraction Weight %
Mesh size
Micron
size
Fraction Weight
(kg)
Retained
(%)
Cumulative Passing
(%)
Cumulative Retained
(%) Organics N/A 0.08 0.1 99.9 0.1
+10 1,680 3.13 2.2 97.7 2.3 +14 1,190 0.22 0.2 97.6 2.4 +20 841 0.33 0.2 97.4 2.6 +28 595 0.94 0.7 96.7 3.3 +35 425 2.23 1.6 95.1 4.9 +48 297 6.54 4.6 90.6 9.4 +65 210 22.1 15.5 75.0 25.0
+100 149 26.9 18.9 56.2 43.8 +150 105 22.3 15.6 40.5 59.5 +200 74 10.8 7.6 32.9 67.1 !200 -74 46.9 32.9 N/A N/A
N/A = Not applicable.

September 18, 1997 NFESC and USAEC 7
q When the coarse fraction was further separated into metals (magnetic and nonmagnetic) andgravel (float), the gravel was found to contain enough leachable lead to fail the TCLP test. Thisindicates that the coarse fraction also needs to be subjected to some leaching.
q The -10 mesh fraction constituted 98% of the berm material, but contained only 20% of the lead.The -10-mesh fraction was processed on a shaking table to see if this material was amenable togravity separation. Although gravity separation isolated a concentrate stream that had an assayof 0.5% lead, this constituted less than 3% of the lead in the original range material. Themiddling and tailing (predominantly soil) fractions retained most of the lead and both streamsfailed the TCLP test. The -10-mesh fraction did not appear to contain much lead amenable togravity separation.
Physical separation alone was not sufficient to meet target criteria. The -10-mesh material containedsufficient fine particulate and/or ionic lead that would require removal by leaching.
Bench Scale Testing
The two selected vendors were given samples of the raw soil from Range 5 to use in bench-scale testingand to aid in plant design. Vendor 1, faced with a somewhat aggressive schedule, performed batch testsusing acetic acid as the leachant with the following results: q Attrition washing and screening of the raw range soil removed approximately 87% of the lead,
mostly in the form of whole bullets and fragments.
q Organic matter separated during the process had a high lead content and needed to besegregated.
Figure 4. Characterization of a 30-gallon sample of Range 5 soil to evaluate leaddistribution and amenability to physical separation (conducted by Hazen Research forBattelle)

8 NFESC and USAEC September 18, 1997
q Gravity separation of the coarse (+100 mesh) soil fraction and acetic acid leaching of the fines (-100 mesh) resulted in additional lead removal that brought the total lead level in the processedsoil below the targeted 1,000 mg/kg.
q The individual coarse and fine processed soil fractions, as well as the recombined finalprocessed soil, failed to meet the TCLP lead criterion. This indicated that (a) the coarse fractionwould have to be subjected to some mild leaching to remove adsorbed lead, and (b) the finefraction would need additional leaching or other treatment to address the residual lead.
q Vendor 1 determined that to achieve the TCLP criterion of 5 mg/L lead, the soil would have tobe treated to 200 mg/kg total lead or lower. The vendor projected that this would require eithera lowering of the pH from 3.5 to 2.5 or an increase in leaching time from 175 to 300 minutes.Both measures would increase processing cost significantly. Because acetic acid is a weak acid,ten times more acid would be required to lower the operating pH from 3.5 to 2.5. On the otherhand, it was speculated that the full-scale plant equipment would be able to achieve higherefficiencies of separation and leaching than the simulated equipment used in the bench-scaletesting.
q Proprietary precipitants and flocculants were used to precipitate out the heavy metals andregenerate the spent leachant, but this aspect of the process was not adequately evaluated.
Vendor 2 conducted bench-scale tests on a sample of soil from Range 5 using hydrochloric acid as theleachant. Vendor 2 had the benefit of longer preparation time and conducted a more thorough bench-scale testing effort with the following results: q Screening separated out the gravel (+4 mesh) which contained mostly bullets and fragments.
Some rock present in this fraction showed only 100 mg/kg of lead.
q The entire sands fraction (-4+200 mesh) contained over 700 mg/kg of total lead. About 23% ofthis lead could be removed by gravity separation. However, the resulting soil fraction stillrequired some leaching to remove leachable lead. A higher percentage of the total lead in thecoarse fraction appeared to be leachable compared with the percentage in the fines fraction.
q The fines fraction (-200 mesh) contained 2,000 to 2,800 mg/kg of lead. Leaching at a pH of 1.5enabled this fraction, when combined with the coarse fraction, to pass the TCLP criterion. Thetotal lead in the final recombined processed soil had to be around 250 mg/kg to pass TCLP.
q The spent leachant was regenerated by precipitation with sodium hydroxide. A pH range of 7 to9.5 was found to be effective. Flocculation, separation, and dewatering of the precipitate werealso tested and the results were used to design the full-scale process.
Additional Soil and Target Metals Characteristics
With a strong acid, such as hydrochloric, knowledge of the particle size distribution and heavy metalconcentrations in the various size fractions was found to be sufficient to determine suitable separationand leaching operating parameters for the performance targets to be met. However, if performancetargets are significantly more stringent (as may be the case in certain states, such as California) or when aweak acid, such as acetic, is used there may be some benefit in analyzing additional soil and target metalsproperties, with the goal of improving leaching efficiency. Some soil properties that are important to know and that were measured relatively inexpensively for theFort Polk soil are listed in Table 3:

September 18, 1997 NFESC and USAEC 9
Table 3. Other Range 5 Raw Soil Characteristics
Parameter Measured Value Soil description Silt-sand Moisture content 8% pH 4.0 to 5.5 Total organic carbon 7,710 mg/kg Iron 12,115 mg/kg Manganese 50.7 mg/kg Cation exchange capacity (CEC) 4.5 meq/100 g
q The raw soil pH determines how much acid is required to reach the desired leaching pH.
q The cation exchange capacity (CEC) indicates the capability of the soil to bind lead in anexchangeable form. Generally, clayey soils tend to have higher CEC than sandy soils. This isone reason why clayey soils are more difficult to leach.
q The total organic carbon indicates the amount of organic matter present in the soil. Leadcomplexed with organic matter is difficult to remove by leaching.
q The iron and manganese levels indicate the presence of iron and manganese oxides that canadsorb lead. These soil minerals tend to bind lead very strongly. Also, iron may leach out alongwith the other heavy metals, thus consuming additional chemicals in the leaching andprecipitation steps.
These parameters provide some indication of difficulties that may be encountered during leaching. Theleachant selection and optimization process can be further focused, if required, by determining heavymetal speciation and binding mechanisms in the soil. These are expensive analyses and may not berequired at most sites.
Heavy metals speciation indicates the types of chemical compounds the metals are present as. In manysmall-arms range soils that contain native alkalinity, lead is present predominantly as elemental lead andcarbonate minerals (cerussite, hydrocerrusite). Lead carbonate is easier to leach, whereas elemental leadis leached only very slowly. Both vendors concluded during their bench tests that to improve leachingefficiency, they had to first get as much of the elemental lead out as possible by physical separation.Lead oxide and lead sulfate are other lead compounds that may occur under certain conditions and aredifficult to leach. Determining heavy metal speciation requires the use of relatively expensive analysis,such as x-ray diffraction (XRD) and scanning electron microscopy (SEM). At Fort Polk, preliminary sitecharacterization efforts by the site indicated that lead occurred mainly in the form of carbonate minerals.The soil was therefore considered to be amenable to leaching with a weak acid, namely acetic.
Another aspect of the soil-metal matrix that is useful to know is the metal-soil binding mechanisms. Asequential extraction procedure was developed and tested in a separate study on soils from seven indus-trial sites by Van Benschoten et al. (1997). Depending on the amount of lead recovered by a series ofleachants, the lead species can be classified by this procedure as follows:
q Water solubleq Ion exchangeableq Silver displaceableq Carbonateq Easily reducible (bound to manganese oxides)q Organically complexedq Adsorbed on iron oxides

10 NFESC and USAEC September 18, 1997
q Sulfideq Residual.
Generally, the further down the list the metal occurs, the harder it is to remove by leaching. Based onthis classification, appropriate leachants can be selected and optimized to achieve desired targets for thesite. This sequential extraction procedure is somewhat expensive and generally used only if initialbench-scale tests with common leachants, such as acetic acid and hydrochloric acid, do not provide therequired heavy metals removal. The sequential extraction procedure was not conducted on Fort Polksoils, but it could be a useful tool at some sites.
Site Preparation
Site preparation for the demonstration was conducted by BDM Engineering Services, Inc., the sitesupport contractor for Fort Polk. Before the start of the demonstration, BDM built an asphalt pad (seeFigures 5 and 6) on which each vendor’s plant was installed in turn. Because most of the plant incor-porates wet processes, spills and leaks are inevitable. To provide secondary containment and facilitatedrainage, the pad was built with bermed sides and graded so that rainwater or process water overflowwould run off to the far end into a containment pond. Both vendors were asked to reuse this water asmuch as possible. The water in this pond was periodically discharged after testing to either a sewerleading to the local water treatment plant or to off-site disposal, depending on the level of dissolvedmetals in the water.
Figure 5. Asphalt pad with bermed sides built to house the vendors' plants. The pad was gradedinto a containment pond at the far end. Processed soil storage bins are on the left, andpole transformers are on the right.


12 NFESC and USAEC September 18, 1997
Arrangements were made to supply power for each vendor’s plant through three transformers, each with300 kVA capacity. However, more power was required for the demonstration than planned. The vendorsand Battelle rented diesel generators to make up the deficit. Process water was provided by channelingthe base water supply through a backflow prevention tank.
A locked office/laboratory trailer was set up to house sample preparation equipment, an on-site x-rayfluorescence (XRF) analyzer, laptop computers, telephones, restroom, and other office support. A smallcovered area outside the trailer was prepared to house large sample preparation equipment, such as theovens, crusher, etc. The entire demonstration site was enclosed by a 6-foot-high chain link fence.
Before field operations commenced, BDM prepared a Health and Safety Plan that covered the demonstra-tion activities. During the demonstration, BDM conducted air monitoring for lead dust and the vendormonitored acid fumes. No significant hazards were encountered during the demonstration, and on-sitepersonnel wore level D personal protective equipment (PPE). There was one brief period when samplingpersonnel had to wear respirators when excess acetic acid fumes were temporarily generated from thetreated soil.
Vendor 1 and the Acetic Acid Plant
Figure 7 shows an overview of Vendor 1’s plant for implementing physical separation and acetic acidleaching.
Figure 7. Vendor 1's plant and the acetic acid process.
September 18, 1997 NFESC and USAEC 13
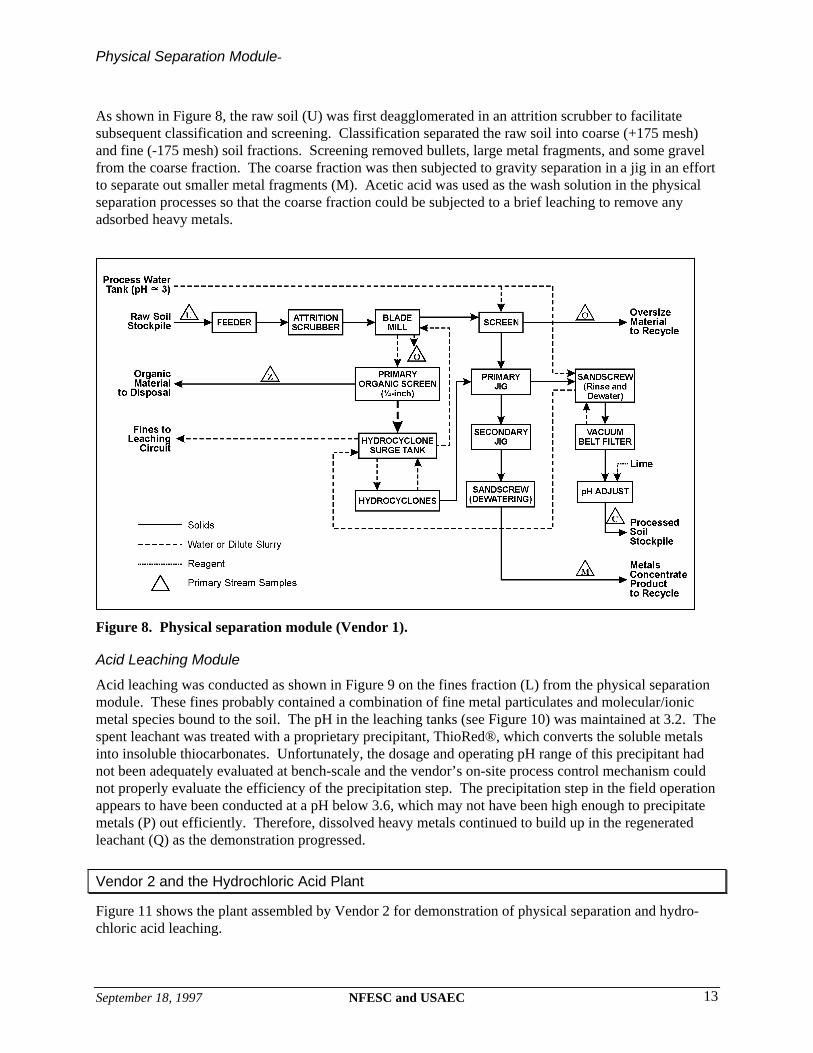
Physical Separation Module-
As shown in Figure 8, the raw soil (U) was first deagglomerated in an attrition scrubber to facilitatesubsequent classification and screening. Classification separated the raw soil into coarse (+175 mesh)and fine (-175 mesh) soil fractions. Screening removed bullets, large metal fragments, and some gravelfrom the coarse fraction. The coarse fraction was then subjected to gravity separation in a jig in an effortto separate out smaller metal fragments (M). Acetic acid was used as the wash solution in the physicalseparation processes so that the coarse fraction could be subjected to a brief leaching to remove anyadsorbed heavy metals.
Acid Leaching Module
Acid leaching was conducted as shown in Figure 9 on the fines fraction (L) from the physical separationmodule. These fines probably contained a combination of fine metal particulates and molecular/ionicmetal species bound to the soil. The pH in the leaching tanks (see Figure 10) was maintained at 3.2. Thespent leachant was treated with a proprietary precipitant, ThioRed®, which converts the soluble metalsinto insoluble thiocarbonates. Unfortunately, the dosage and operating pH range of this precipitant hadnot been adequately evaluated at bench-scale and the vendor’s on-site process control mechanism couldnot properly evaluate the efficiency of the precipitation step. The precipitation step in the field operationappears to have been conducted at a pH below 3.6, which may not have been high enough to precipitatemetals (P) out efficiently. Therefore, dissolved heavy metals continued to build up in the regeneratedleachant (Q) as the demonstration progressed.
Vendor 2 and the Hydrochloric Acid Plant
Figure 11 shows the plant assembled by Vendor 2 for demonstration of physical separation and hydro-chloric acid leaching.
Figure 8. Physical separation module (Vendor 1).

14 NFESC and USAEC September 18, 1997
Figure 9. Leaching module (Vendor 1)
Figure 10. Leaching and precipitation tanks and clarifiers that were part of Vendor 1's plant.

September 18, 1997 NFESC and USAEC 15
Physical Separation Module
Physical Separation ModuleAs seen in Figure 12, the physical separation module in Vendor 2’s plant had many of the same elementsas Vendor 1’s plant. The raw soil (U) was first classified into coarse (+200 mesh) and fine (!200 mesh)fractions. The coarse fraction (K) was processed by gravity separation in a jig in an effort to removesmaller metal fragments (M). Hydrochloric acid was used as the wash solution in these processes so thatthe coarse fraction could be subjected to a brief leaching to remove any adsorbed lead.
Acid Leaching Module
The classified fines (L) were sent to the leaching module (see Figure 13) where they were brought intocontact with hydrochloric acid at a pH of 1.5. The leached fine fraction (F) was dewatered in a centri-fuge and recombined with the processed coarse fraction (C) to obtain the final processed soil (T). Theprocessed soil was returned to the range following neutralization with lime to a pH of about 5.5. Thespent leachant was regenerated successfully by adding sodium hydroxide and raising the pH above 7 in
Figure 11. Vendor 2's plant and the hydrochloric acid process.

16 NFESC and USAEC September 18, 1997
Figure 13. Leaching circuit (Vendor 2).
Figure 12. Physical separation module (Vendor 2).
Figure 12. Physical separation module (Vendor 2).

September 18, 1997 NFESC and USAEC 17
the precipitation tank shown in Figure 14. The metals recovered in the oversize (O) and precipitate (P)were sent to an off-site smelter to recycle the lead content.
Evaluation Methodology
Evaluation of the separation/leaching technology and its application at Fort Polk was conducted byBattelle through field observations, sampling and analysis of process streams, and discussions with thetwo vendors and site support personnel. Figure 15 shows the key input and output process streamssampled during the demonstration. At the outset of the demonstration, Battelle prepared a technologydemonstration plan (Battelle, 1996) that outlined the evaluation methodology.
Collecting and Preparing Representative Samples
The main challenge during the evaluation was collecting and analyzing representative samples of the rawand processed soil, as well as other process streams. The presence of particulate metals in the soil pre-cludes the use of standard EPA sampling and analysis methods that involve the collection and analysis ofa few grams of soil. The difficulty is due to what is known in the mining industry as the “nugget” effect.Depending on whether a particle of metal is collected or left out of the sample, the metal concentrationmeasured in the sample could vary considerably. The larger the size of the metal particle encountered inthe matrix, the greater is its ability to bias the analytical result. Previous studies and field demonstrationshave been hampered by high variability in the results that made evaluation of removal efficiency difficult(Fristad et al., 1996).
Figure 14. Baffled precipitation and settling tank on left forms part of Vendor 2's plant.

18 NFESC and USAEC September 18, 1997
Battelle considered two ways to overcome the matrix variability and obtain representative samples andanalyses. One way was to collect a large number of replicates so that the variability between individualsamples could be averaged out. In this approach, although metal concentrations in small individualsamples collected from a process stream or pile of soil vary considerably, the average is still expected tobe relatively close to the true concentration. The other approach considered was the one used by themining industry to analyze metal concentrations in ores. Table 4 shows the mass of mineral ore or soilcontaining metals that is required for a given size of metal particle. Thus if 0.375-inch fragments ofmetal are expected in the soil (as might be expected in small-arms ranges), then between 75 to 3,200 lbsof sample needs to be collected, depending on the metal distribution in the material, to obtain a 99%confidence in the analysis result. The implication is that at this sample size, the analytical result is notsignificantly affected by whether a 0.375-inch metal particle is collected in or stays out of a sample.
After considerable method development, the sample collection and preparation procedure outlined inFigure 16 was implemented. What this procedure accomplishes is that, once a representative compositesample (of a size determined by Table 4) is collected, the particle size of the material is successivelyreduced so that representative subsamples of appropriate size are collected at each step. Initially, asmuch as 300 lbs of material per composite sample was collected for some of the process streams (seeFigure 17). Subsequent sample preparation steps successively reduced the large composite torepresentative 8-gram aliquots that could be conveniently analyzed by digestion and inductively coupledplasma (ICP). At several steps, duplicate or triplicate subsamples were collected and analyzed toincrease the level of confidence in the analysis.
The composite usually consisted of multiple grab samples that encompassed 1 day of processing or onepile of soil delivered from the range. Large sample processing equipment was assembled to handle thelarge sample volumes on site, as shown in Figure 18. These included a 7-foot oven for drying the wetsample, a vibrating screen for size separation, a rolls crusher for size reduction, a sample splitter for
Figure 15. General schematic of process showing input andoutput streams.

September 18, 1997 NFESC and USAEC 19
Table 4. Mass (in Pounds) of Composite Required to Obtain Representative Samples
Diameter of Largest Piece Mass (lb) of Composite for Different Soil Grades
Inches mm Mesh
Very-low-grade or veryuniform ores
Low-grade oruniform ores Medium ores
Rich orspotty ores
8654
332.521.51.25
---------
---------
19,20010,800
7,5004,8002,7001,8751,200
675496
64,0036,00025,00016,000
9,0006,2504,0002,2501,536
-80,00055,55035,55620,00013,8888,8895,0003,472
---
80,00045,00031,25020,00044,5807,813
-----
80,00051,20028,80020,000
10.750.6250.5000.3750.31250.2500.18750.131
--------
3.327
--------6
300169117
7542291910.5
5.15
1,000536391250141
98633517.2
2,2221,250
868556313217139
7838.1
5,0002,8131,9531,25070448831317686
12,8007,2005,0003,2001,8001,250
800450220
0.0930.0650.0460.03280.02320.01650.01160.00820.00580.00410.0029
2.3621.6511.1680.8330.5890.4170.2950.2080.1470.1040.074
810142028354865
100150200
2.61.290.650.3220.1620.0810.0410.0200.0100.0050.0025
8.654.32.161.0750.5390.2690.1350.0670.0340.0170.009
19.29.54.82.371.200.590.300.150.0750.0380.019
4321.510.75
5.382.691.3450.6730.3360.1680.0840.042
111552813.76
6.903.441.730.860.430.2150.107
Adapted from Taggart, 1945.
collecting representative subsamples. Because of the limited storage space available on the operationspad for the processed soil and the need for process verification before returning the soil to the range,reliability was built into the sample collection and preparation chain by duplicating every piece ofmechanical equipment. Including the final analysis at the off-site Battelle laboratory, analytical resultsfor the processed soil were always reported to the site in three days.
Analytical Methods
The off-site analytical laboratory at Battelle had to develop special procedures to handle the unusualmatrix. EPA Standard Method 3051 calls for the microwave digestion of 2-gram aliquots of the finalprepared sample. The aliquot size was increased to 8 grams, which is the maximum that method develop-ment efforts showed the digester cups would handle. In addition to nitric acid, hydrochloric acid wasused for digestion to improve the recovery of antimony. The digestates were analyzed by ICP accordingto EPA Standard Method 6010.

20 NFESC and USAEC September 18, 1997
Figure 16. Collecting and preparing representative samples of raw and processed soil forprocess verification.

September 18, 1997 NFESC and USAEC 21
Figure 18. Covered sample preparation area with ovens, crusher, vibrating screen, and samplesplitter.
Figure 17. Collecting a 150- to 300-lb sample of processed soil (T) for verifying processefficiency.

22 NFESC and USAEC September 18, 1997
The final total metals concentration reported for each composite sample consisted of a weighted averageof the concentrations in the following fractions (see Figure 16):
q The +10-mesh oversize material. This fraction consisted mostly of whole bullets, casings, andsome gravel. The metals content of this fraction was determined by splitting and sending threealiquots of material to an off-site metallurgical laboratory, where the metals were identified andmeasured by a combination of special pyrometallurgical and analytical techniques.
q The +30-mesh fraction. This size fraction resulted from the fact that the contents of the 1-litersample bottle could not be completely ground to –200 mesh in any reasonable amount of time.A small fraction of the material (mostly malleable lead and copper metal fragments) flattens outand refuses to be ground below 30 mesh. This fraction was therefore isolated during samplepreparation and analyzed separately by digesting multiple 8-gram aliquots.
q The –200-mesh fraction. This represents the final ground material that was split, digested inmultiple 8-gram aliquots, and analyzed by ICP.
TCLP metals analysis was done strictly by EPA Method 1311. For the TCLP analysis, the sample wasground no further than 3/8-inch as required by the standard method. The standard method calls forextraction, digestion, and analysis of a 100-gram aliquot of the sample material. As seen in Table 4, at3/8-(0.375)-inch particle size, at least 42-lb subsamples would need to be analyzed to obtain a representativeanalysis. This was not practical for the study. Therefore, the standard TCLP test as it is designed is inher-ently nonrepresentative for this matrix. To overcome this limitation while still adhering to the standardmethod, multiple (two or three) 1-liter subsamples of the -3/8-inch material were collected by passing theentire composite sample through a sample splitter in the field. Each 1-liter subsample was further split bythe off-site laboratory until two 100-gram aliquots were obtained. These aliquots were then subjected to theTCLP test. The final TCLP result reported for the composite sample was an average of four or six replicateanalyses. Any expected variability between the subsamples was averaged out by this method. On-Site XRF Analysis
An attempt was made during the demonstration to use an on-site XRF analyzer (see Figure 19) to screensoil samples for heavy metals content so that some initial indication of process performance could beobtained in the field. Samples were analyzed wet or dry depending on how fast the analysis was requiredon site. Dry samples were ground in a small grinder before analysis. As may be expected, XRF analysishad a better correlation with the full-fledged sample preparation and ICP analysis procedures when thesample was collected from relatively homogeneous streams with no coarse metals particles, such asprocessed soil (T), soil fines (F), and precipitate (P). When samples were collected from streams thatwere heterogeneous and had coarse metal particulates, such as the raw soil (U), XRF data had a poorcorrelation with the regular analysis. This is because metal particles tend to shield each other and theconcentration is underestimated. As a screening tool, the XRF did provide some early indications ofexpected total metals levels in the processed soil. But, not enough confidence was generated during thesporadic use of this instrument at Fort Polk for the XRF unit to perform as an on-site decision-makingtool. The on-site AA analyzer brought to the site by the vendors appeared to be a better tool for processverification and control.
Quality Assurance (QA)
Most of the special sample collection and analysis procedures described above relate to QA issues suchas representativeness, metal recovery (accuracy), and reproducibility (precision). Additional QAmeasures to ensure field sampling and analysis validity involved field blanks, calibrations, methodblanks, matrix spikes, and duplicates. The QA results are summarized as follows:

September 18, 1997 NFESC and USAEC 23
q Field blanks were collected by running clean sand through the sample collection and preparationequipment during each vendor’s operation. As seen in Table 5, the level of metals in the blankswere insignificant compared with the levels in the raw and processed soils, indicating that therewas no cross-contamination. The sampling team routinely ran clean sand through all thesampling equipment between samples.
Table 5. Field Blanks Processed During the Demonstration
Field Blank Sampling Date
Blank Matrix
Lead Result (mg/kg)
Copper Result (mg/kg)
Zinc Result (mg/kg)
Antimony Result (mg/kg)
October 5 Sand 2.70 11.60 7.29 0.31
December 3 Sand 6.58 6.19 6.25 1.09
q The precision of the sample preparation procedures for total metals concentrations, as measured
by the variability between replicate 1-liter subsamples of soil (see Figure 16) was well withinthe predetermined target of 25% relative standard deviation (RSD) as shown in Figure 20. Onlyone sample had a slightly higher RSD.
q The precision of the total metals analytical procedures, as measured by the variability betweenmultiple 8-gram aliquots (see Figure 16) was consistently within the 25% target as shown inFigure 20.
Figure 19. On-site XRF analyzer in use at Fort Polk.


September 18, 1997 NFESC and USAEC 25
q The precision of the TCLP analysis was within limits for most of the processed soil analysis (asseen in Figure 21). Three of the samples during Vendor 2’s operation showed somewhat highervariability between replicates, possibly due to isolated metal fragments in one of the aliquots.The RSD for the raw soil was outside the target range for many samples because of the unrepre-sentative aliquot size required by the standard method. Multiple aliquots were analyzed for eachcomposite sample to average out this variability.
q The accuracy evaluation of the total and TCLP lead analysis for soil is shown in Figure 22.Except for two samples in which lead was over-recovered, the matrix spike recoveries werewithin the target limits of 75 to 125%.
q Several method blanks were routinely analyzed to ensure that the background and any otheranalytical interferences were minimal. In all cases, method blank results were below methoddetection limits, except one blank which contained about 1 mg/L of lead, which is well belowany measured value in the raw or processed streams.
q Instruments were calibrated daily by running initial and continuing calibration check standards,for which recoveries were within 85 to 115%.
Vendor 1 Performance
Vendor 1 assembled an on-site plant and processed 263 tons of Range 5 soil by physical separation andacetic acid leaching. Process Efficiency
Table 6 shows the results of Vendor 1’s processing. On the first day of processing the processed soil metthe total and TCLP lead targets. Approximately 93% of the total lead, 93% of the total copper, 77% ofthe total zinc, and 70% of the total antimony were removed during this initial processing effort, indi-cating that acetic acid has the potential to remove heavy metals to target levels. Subsequently however,both total and leachable lead levels rose incrementally. This decline was due to a buildup of lead in theregenerated leachant caused by inadequate precipitation. Table 7 shows the lead assays and pH ranges of various process streams in the plant. Most of theoversize material (O) accumulated in the basin of the blade mill rather than on the screen and wascollected at the end of the demonstration. The jig concentrate (M) did not contain much lead, indicatingthat the coarse soil fraction may not have contained a size fraction of lead amenable to jigging. Organicmatter (Z) collected in the process contained high levels of lead, but this stream was very small involume. Both coarse (C) and fine (F) processed fractions individually failed the TCLP test. This wasbecause inadequate precipitation caused dissolved lead to build up in the regenerated leachant (Q), attimes reaching levels as high as 627 mg/L. The pH levels of the regenerated leachant (Q) and precipitate(P) indicate that the precipitation step was being implemented at a very low pH, at which mostprecipitants may be expected to be inefficient. One reason the vendor did not raise the pH in theprecipitation tank was the cost concern about the large amount of acetic acid that would be required inthe next step to return the regenerated leachant to a lower pH. Process Residuals
Table 8 shows the residuals generated from the processing and their ultimate disposition. The first batchof processed soil that passed TCLP was returned to the range. The processed soil that did not pass TCLPwas sent to a landfill. In addition to its inability to meet the TCLP target, the processed soil appeared tobe unsuitable for return to the range because of inadequate dewatering and neutralization of the leachedsoil. At times, there was so much excess acid in the processed soil pile that field personnel had to wear


28 NFESC and USAEC September 18, 1997
Table 6. Overall Removal of Total and Leachable Lead with the Acetic Acid Process
Total Lead TCLP Lead
Date Raw Soil(mg/kg)
Processed Soil(mg/kg)
Removal (%)
Raw Soil(mg/L)
Processed Soil(mg/L)
15-Sep 1,854 122 93 34.6 3.07 21-Sep 1,407 208 85 21.0 5.99 25-Sep 3,347 330 90 22.0 10.3 2-Oct 2,741 404 85 40.5 11.2
4-Oct(a) 208 - 330 269(b) None 5.99 - 10.3 7.80(b)
10-Oct 4,789 839 82 106 21.7 12-Oct 4,789 1,443 70 106 48.0
Statistics n 5 N/A N/A 5 N/A
Avg. 2,828 N/A N/A 45 N/A Std. Dev. 1,331 N/A N/A 35 N/A 80% C.I. 2,828"792 N/A N/A 45"21 N/A
(a) This sample is a combination of the processed samples from September 21 and 25 that failed TCLP testing. (b) These sampling data are the results of reprocessing of soil that failed TCLP on September 21 and 25. N/A = Not applicable. The process did not reach steady state and the distribution is not normal. C. I. = confidence interval. n = Number of independent measurements.
Table 7. Distribution of Lead in Acetic Acid Process
Total Lead Result (mg/kg)
TCLP Lead Result (mg/L)
Avg. Total
ProcessStream
Stream Description
PH Range
Sep. 15
Oct. 1-3
Oct. 7-11
Sep. 15
Oct. 1-3
Oct. 7-11
Lead Conc. (mg/kg)
U raw soil 4.0-4.8 1,854 2,741 4,789 34.6 40.5 106 2,828 T processed soil 4.1-4.9 122 404 839 3.07 11.2 21.7 722 M jig concentrate 4.8 N/A 484 N/A N/A 17.6 N/A 484 O oversize fraction 5.2 N/A N/A 239,000 N/A N/A N/A 239,000 P precipitate sludge 3.2-3.6 N/A N/A 11,990 N/A N/A 321 11,990 Z organic matter N/A 6,457 N/A N/A 11.1 N/A N/A 6,457 C coarse processed fraction 4.9-5.5 N/A 252 N/A N/A 6.49 N/A 252 F fine processed fraction 4.0-4.3 N/A 947 N/A N/A 15.1 N/A 947 L leach circuit feed 4.4 832 5,347 N/A 21.3 49.9 N/A 3,090
Q(a) regenerated leachant 2.9-3.3 N/A 627 29.3 N/A N/A N/A 328 (a) Leachant concentration measured in units of mg/L.
N/A = Not applicable/available. respirators (PPE upgrade from Level D to Level C) during sampling of the processed soil. The processsolution circulating in the plant, the jig concentrate, and the organic matter separated in the process werealso hauled to a landfill. The particulate metals recovered in the attrition scrubber basin were sent to anoff-site smelter for recycling. Plant Reliability
In general, plant reliability was relatively low. Mobilization took 14 days, not including transportation tothe site. During the next 24 working days, the plant was operational for a total of 139.5 hrs (or 65% ofthe time). The plant was considered operational whenever it was receiving raw soil feed, regardless ofany difficulties or intermediate material accumulation encountered downstream. A total of 263 tons of

September 18, 1997 NFESC and USAEC 29
Table 8. Residuals Disposal for the Vendor 1 Demonstration
Process
Stream
Average LeadConcentration
Hazardous/
Disposal
Mass of Stream
Unit Cost
Total Cost
Stream Description (mg/Kg) Nonhazardous Method (kg)(a) ($) ($) T Processed soil 722(b) Hazardous Landfill 146,058 $0.30 $43,496 T Processed soil 122 Nonhazardous Returned to range 29,937 $0.00 $0
P(c) Precipitate sludge 11,990 Hazardous Landfill 19,731 $1.41 $27,782
Q(1) Process solution 328 mg/L Hazardous Landfill 39,000 gal $1.25 $48,750
Q(2) Pad runoff < 5 mg/L Nonhazardous Discharged toPOTW
60,000 gal $0.00 $0
Z Organic matter 6,457 Hazardous Landfill 1,240(d) $0.77 $958 M Jig concentrate 484(b) Hazardous Landfill 4,082 $1.53 $6,260
MN Metals from screenand blade mill
239,000 Hazardous Recycled 4,715(e) $0.53 $2,495
(a) Total mass of process streams is on a wet weight basis. (b) This material was classified as hazardous waste because the TCLP analyses for lead were greater than 5.0 mg/L. (c) Mass of material in this stream includes the spent bag filters. (d) Mass of material in this stream was estimated to be 1% of the total raw soil processed; moisture content was
approximately 85%. (e) Mass of material in this stream was estimated from the weights of the drums reported by the off-site recycling facility.
raw soil were processed by Vendor 1 at an average rate of 2.8 tons/hr. Demobilization was completed onsite in 10 days. The following factors contributed to the low plant reliability and inability to meet processing targets: q Inadequate bench-scale testing. At bench-scale itself, Vendor 1 was unable to optimize the
separation/leaching processes to attain the TCLP lead target. Precipitation efficiency was notoptimized during the bench-scale tests and key operating parameters, such as precipitant dosageand effective pH range, were not adequately evaluated.
q Inadequate process control. The problem with the buildup of lead in the leachant could not beidentified and corrected in time during the demonstration because there was insufficientinstrumentation to provide reliable on-site process verification. Vendor 1 also appeared to beshort handed, perhaps due to budget constraints. Additional operators (including an on-siteprocess chemist) would have speeded up plant operation and provided better process control.
q Problems with material handling and equipment sizing. Various material handling problems wereencountered in the feed hopper, plate feeder, soil deagglomerator, sand screw, vacuum belt filter,and plate-and-frame filter press. These difficulties caused frequent bottlenecks and downtime.
Vendor 2 Performance
Vendor 2 assembled an on-site plant and processed 835 tons of Range 5 soil by physical separation andhydrochloric acid leaching. Process Efficiency
As seen in Table 9, the processed soil from Vendor 2’s plant consistently met total and TCLP leadtargets. Total lead was reduced from an average of 4,117 mg/kg in the raw soil to an average of165 mg/kg in the processed soil. Leachable lead levels as measured by TCLP were reduced to an averageof 2 mg/L. Figure 23 shows the daily total metals removal performance of the process.

30 NFESC and USAEC September 18, 1997
Table 9. Overall Removal of Total and Leachable Lead with Vendor 2’sHydrochloric Acid Process
Total Lead TCLP Lead
Date Raw Soil (mg/kg)
Processed Soil (mg/kg)
Removal (%)
Raw Soil (mg/L)
Processed Soil (mg/L)
15-Nov 4,819 143 97 18.4 3.07 16-Nov 4,819 178 96 18.4 1.83 20-Nov 4,152 125 97 20.7 0.958 21-Nov 3,567 134 96 37.3 1.32 22-Nov 4,068 115 97 33.5 0.56 23-Nov 5,194 232 96 31.9 1.75 25-Nov 5,194 235 95 31.9 2.15 26-Nov 5,040 181 96 36.3 1.97 27-Nov 5,040 165 97 36.3 2.84 29-Nov 5,040 230 95 36.3 3.44 30-Nov 3,351 233 93 40.4 2.53 2-Dec 3,351 177 95 40.4 1.85 3-Dec 3,351 132 96 40.4 1.36 4-Dec 2,743 113 96 13.7 2.35 5-Dec 2,743 127 95 13.7 3.06 6-Dec 2,743 123 96 13.7 0.757
Statistics n 8 16 16 8 16
Avg. 4,117 165 96 29 2.0 Std. Dev. 869 46 1.0 10 0.86 80% C.I. 4,117"435 165"15 96"0.34 29"5.0 2.0"0.29
C.I. = confidence interval. n = number of independent measurements.
Processing removed an average of 96% total lead, 97% total copper, 89% total zinc, and 60% totalantimony from the range soil. Figure 24 shows the daily TCLP metals removal performance of theprocess. Figure 25 shows the lead assays of the various process streams. Most of the metals that were removed bythe process were collected in the jig bed (MN) and in the precipitate sludge (P). The organic matter sepa-rated from the classifier overflow showed high concentrations of lead. This organic matter was blendedwith the final processed soil, although in the future, this stream may be best blended with the precipitatefor off-site disposal. The metals collected in the jig bed (MN) were an unexpected process stream that resulted from on-sitemodifications made to the plant by the vendor. Because of difficulties encountered in screening the rawsoil, Vendor 2 eliminated the screening unit and the coarse material jig from the planned plant configura-tion. Instead, the raw soil was sent directly to the attrition scrubber and classifier. The coarse fractionfrom the classifier was sent to the fine material jig. In this jig, the metal fragments, instead of sinkinginto the jig concentrate, were retained on the 1/8-inch slotted punch plate. These metal fragments werehand-sorted and removed by an operator at the end of each day. As seen in Figure 25, both coarse (C) and fine (F) processed fractions contained low levels of lead.These two fractions were combined to form the final processed soil (T) that was neutralized and returnedto the range. The processed soil had a loose texture and appeared to be suitable for reuse in the activeberm at Range 5. Precipitation was conducted efficiently at a pH of around 7.7 by adding sodiumhydroxide. Precipitation reduced the lead content from 96 mg/L in the spent leachant (Qf) to 11.5 mg/Lin the regenerated leachant (Qc).


September 18, 1997 NFESC and USAEC 33
The mass distribution of lead in the input and output streams in the plant is summarized in Table 10.Most of the lead was collected in the jig bed rather than in the jig concentrate, and this suggests someform of size separation. About 7% of the lead was collected in the precipitate sludge. The organicmatter isolated from the soil contained a high concentration of lead but its mass was not significant.About 4% of the lead in the raw soil was residual in the processed soil. The mass balance is skewedmainly by the high variability of the lead concentration in the jig bed metals (MN). The lead content ofthis stream was estimated by analyzing three grab samples of the oversize material, which containedwhole bullets, bullet fragments, bullet casing, and gravel. These three grab samples were analyzed byspecial pyrometallurgical techniques to obtain average lead, copper, zinc, and antimony contents thatwere used as an estimate of the metals in this fraction for all the samples during the demonstration. Process Residuals
The residuals from Vendor 2’s processing are shown in Table 11. Both the jig bed metals (MN) and theprecipitate (P) were sent to an off-site smelter for recycling of their lead content. The smelter did chargea recycling fee for accepting the material. The processed soil was loose textured and suitable for absorbing bullet impacts. This soil was returnedto the active berm. The site support contractor applied three types of grass seeds to this soil. Indicationsare that revegetation is progressing as desired.
Figure 25. Distribution of lead in various process streams in Vendor 2's plantusing hydrochloric acid leaching.


September 18, 1997 NFESC and USAEC 35
parameters for the process such as pH, contact time, solid-liquid ratios, precipitant dosage, etc.,were tested and established in advance of the field operation.
q Material handling considerations in the design. Scale-up was done with attention to materialhandling aspects in anticipation of a feed material (range soil) that varied in fines content andmetals concentrations. Much of the equipment was oversized and this prevented bottlenecks andprovided flexibility to increase residence times if required to handle higher fines or metal content.
q Adequate field process control. An on-site process chemist with an AA analyzer provided con-stant verification and feedback to other plant operators, thus facilitating on-site decision makingand plant adjustments. The plant appeared to be adequately staffed to enable efficient operation.
Cost of Application
The cost of processing small-arms range soil with the physical separation and leaching technology wasdetermined by estimating fixed and variable cost elements: q Fixed or capital cost is the cost incurred independent of the amount of soil processed, and
includes items such as permitting, site preparation, bench-scale testing, engineering and admin-istration, plant lease (vendor), transportation, mobilization, and demobilization. Fixed costsmay be expected to remain approximately the same at most sites for any berm size. Forestimation purposes, equipment (depreciation) cost is assumed to be fixed, because both vendorsindicated that they plan to depreciate the plant by a fixed amount at each site.
q Variable or operating cost depends on the amount of soil processed, and includes items such aschemicals, utilities (power and water), plant labor, sampling and analysis, soil excavation andhauling, and residuals disposal. Variable costs will vary from site to site based on the amount ofsoil available for processing.
Tables 12 and 13 show the fixed and variable costs incurred by each vendor during the demonstration. Fixed Costs
The major items of fixed cost for either plant appeared to be equipment leasing, transportation of theplant to the site, site preparation, and vendor selection/contracting. Some items, such as permitting andtransportation, may cost less or more at other sites. Variable Costs
Variable costs for Vendor 1 should be interpreted with caution because difficulties during processingresulted in inefficient use of chemicals (acid, precipitant, and flocculant), utilities (power and water),plant labor, sampling and analysis support, and residuals disposal. Also, most of the processed soil didnot meet the desired targets for total and TCLP lead. In spite of this inefficiency, it appears that usingacetic acid is likely to be more expensive than using hydrochloric acid. First, the unit price of acetic acid(over $5/gal) is significantly higher than that of hydrochloric acid ($0.60/gal). Second, the quantity ofacetic acid required to attain a comparable pH is significantly higher than that for hydrochloric acid. Variable costs incurred by Vendor 2 are probably more representative of the operational costs in this typeof processing. The “Normal Processing Costs” column in Table 13 reflects some adjustments to accountfor the differences between the costs incurred in a demonstration versus the normally expected costs for atypical full-scale operation.


September 18, 1997 NFESC and USAEC 37
Table 13. Demonstration-Incurred and Routine Maintenance Costs of the Hydrochloric Acid Processing
Item
Basis
Demonstration
Costs
NormalProcessing
Costs
835 tons 835 tons
Fixed Costs
Permitting and Regulatory (Site) NEPA, HASP, & other permitting $73,199 $73,199
Site Characterization (Site) Planning, sampling, and analyses $56,171 $56,171
Vendor Selection (Site) Selection and contracting, plan preparation $135,686 $135,686
Bench-Scale Testing (Vendor) 1 representative sample $17,739 $17,739
Site Preparation & Support (Site) Pad construction and accessory rentals $150,839 $150,839
Engineering & Administrative(Vendor)
Administrative and assessment $41,571 $41,571
Transportation (Vendor) Plant and personnel mobilization $173,692 $173,692
On-site Mobilization (Vendor) Equipment procurement and shakedown $23,825 $23,825
Equipment (Vendor) 25% depreciation over 4 cleanups $233,075 $233,075
Decontamination and Demobilization(Vendor)
Disassembly, decontamination, anddemobilization
$20,000 $20,000
Total - Fixed Costs $925,797 $925,797
Variable Costs
Soil Excavation/Hauling (Vendor) Backhoe equipment, excavation/hauling $12,419 $12,419
Labor (Site) 1 site superintendent for 300 hours $18,000 $18,000
1 health and safety officer for 300 hours $15,000 $15,000
Utilities (Site) Electricity, 5,000 kWh/month @ $0.075/kWh $750 $750
Water, 49,300 gal @ $8.07/kgal $398 $398
Phone, $220/month $440 $440
Labor (Vendor) 1 supervisor for 300 hours $51,845 $34,563
2 engineers for 300 hours each(a)
1 chemist for 300 hours
5 technicians for 300 hours each(a)
Chemicals (Vendor) HCl acid, 5,200 gal @ $0.60/gal $3,141 $3,141
NaOH, 5,850 gal @ $0.60/gal $3,517 $3,517
Diatomaceous earth, 11,300 lb @$0.53/lb $6,044 $6,044
Flocculant, 1,000 gal @ $3.31/gal $3,311 $3,311
Hydrated lime, 1,275 lb @ $0.40/lb $510 $510
Consumables / Supplies (Vendor) PPE, gloves, tarps, accessories $8,235 $8,235
Sampling & Analyses (Site) Accessories, other equipment rentals $19,983 $16,383
- Labor (Site) 1 supervisor for 300 hours $18,000 $18,000
2 technicians for 300 hours each(a) $18,000 $9,000
- Analyses (Site) 240, sample prep & TCLP analyses $57,000 $14,280
529, sample prep & total metals analysis
Residuals, Waste Shipping/Handling(Vendor)
Bulk solid waste & recovered metals credit $9,008 $9,200
Effluent Treatment (Site) Wastewater, 0 gal @ $1.25/gal(a) $0 $27,500
Total - Variable Costs $245,601 $200,693
Total - Project Costs $1,171,398 $1,126,490
Total - Cost/ton of soil $1,402 $1,349
(a) These costs have been changed for the normal processing estimate.

38 NFESC and USAEC September 18, 1997
Vendor 2’s costs are a better indicator of the cost of applying this type of technology. In Table 13, thesecond column of costs represents slight adjustments made to the flagged cost items to adjust for thehigher cost of these items during a demonstration rather than a routine range maintenance operation. Forexample, routine range maintenance may not require as extensive a sampling and analysis effort asduring the demonstration. The total cost is driven mainly by the high fixed cost of preparing the site andobtaining the plant. This is typical of many on-site technologies. The high fixed cost component impliesthat, on a pure monetary basis, the cost effectiveness of this technology will be greater at larger ranges orat sites with multiple ranges. Table 14 shows the projected costs for processing a larger, 10,000-ton site. Implicit in the projection isthe assumption that the same plant will be used at a maximum speed of 10 tons/hr, which is the quotedcapacity of the plant. Also implicit is the assumption that the processing targets are the same (less than500 mg/kg total lead and 5 mg/l TCLP lead). The unit cost for the 10,000-ton site is approximately$170/ton compared with about $1,400/ton for the 835-ton site. The technology becomes more costeffective for larger sites because the fixed costs are spread over a larger volume of soil.
Acetic Acid versus Hydrochloric Acid
Acetic acid and hydrochloric acid have been commonly used to address lead contamination because bothacids produce water-soluble salts with lead. Given the importance of low pH in enhancing solubilization,a strong acid, such as hydrochloric, can be expected to be a more efficient leachant compared with aceticacid. This was the case at Fort Polk, where much more acetic acid was required to maintain a low pHcompared with hydrochloric acid. As shown in Table 15, more acetic acid is required to reach a certainlow pH than hydrochloric acid. The reason for this is that acetic acid is a weak acid that dissociates onlypartially, whereas hydrochloric acid is a strong acid that is almost fully dissociated at any molarity. Acetic acid is expected to be effective at sites where lead is mostly in the form of carbonate minerals, andwhere processing targets can be achieved at moderately low pH (around 3.0). At small-arms range sites,lead carbonates are formed from the weathering of elemental lead in the presence of native soil alkalinity.Other forms of lead, such as lead dioxide and lead sulfate, are more recalcitrant to solubilization byacetic acid. A strong acid, such as hydrochloric, may be better able to address these species by achievinglower pH (below 2.0). Hydrochloric acid is a more aggressive leachant compared with acetic acid, and hence may be expectedto be more efficient. However, hydrochloric acid is also more aggressive on the soil structure andprocess equipment. During Vendor 2’s demonstration, very high concentrations of iron were noticed inthe precipitate sludge. Although part of this iron originated in the soil, some of it could have beendissolved from the equipment itself. Hydrochloric acid is likely to wear out the plant faster, unlessexpensive stainless steel equipment is used.
Technical and Cost Comparison with Other Technologies
Off-site landfilling and on-site stabilization are the two technologies most commonly considered foraddressing elevated metal levels in active and inactive small-arms ranges. From a short-term perspectiveboth these technologies have demonstrated effectiveness in reducing the hazard associated with themetals. Landfilling achieves hazard reduction by removing the hazard (metals-bearing soil) from the site.Stabilization achieves it by immobilizing the metals in the soil. In the long term, however, the heavymetals stay with the soil and the potential for liability remains. With separation/leaching on the otherhand, heavy metals are removed from the soil and recycled in an off-site smelter. From a long-termperspective, therefore, separation/leaching is the preferred option.

September 18, 1997 NFESC and USAEC 39
Table 14. Costs of the Hydrochloric Acid Process at a Larger Site (10,000 tons of soil)
Item Basis Costs 10,000-ton site
Fixed Costs Permitting and Regulatory (Site) NEPA, HASP, other permitting $73,199 Site Characterization (Site) Planning, sampling, and analyses $56,171 Vendor Selection (Site) Selection and contracting $135,686 Bench-Scale Treatability Tests (Vendor) 1 representative sample $17,739 Site Preparation and Support (Site) Pad construction and accessory rentals $150,839 Engineering and Administrative (Vendor) Administrative and assessment $41,571 Transportation (Vendor) Plant and personnel mobilization $173,692 On-site Mobilization (Vendor) Equipment procurement and shakedown $23,825 Equipment (Vendor) 25% depreciation over 4 cleanups $233,075 Decontamination and Demobilization (Vendor) Disassembly, decontamination and
demobilization $20,000
Total - Fixed Costs $925,797 Variable Costs Site Excavation / Hauling (Vendor) Backhoe equipment, excavation & hauling $124,190 Labor (Site) 1 Superintendent/HSO for 480 hours $28,800 Utilities (Site) Electricity, 5,000 kWh/month @ $0.075/kWh $1,125
Water, 80,000 gal @ $8.07/kgal $646 Phone, $220/month $660
Labor (Vendor) 1 supervisor for 480 hours $134,400 1 engineer for 480 hours each 1 chemist for 480 hours 3 technicians for 480 hours each
Chemicals (Vendor) HCl acid, 62,275 gal @ $0.35/lb $21,796 NaOH, 70,060 gal @ $0.44/lb $30,826 Diatomaceous earth, 50 tons @ $800/ton $40,000 Flocculant, 7,200 gal @ $2.20/gal $26,347 Hydrated lime, 8 tons @ $89/ton $712
Consumables / Supplies (Vendor) PPE, gloves, tarps, accessories $50,994 Sampling & Analyses (Site) Accessories, other equipment rentals $34,873 - Labor (Site) 1 supervisor for 480 hours $28,800
1 technician for 480 hours $14,400 - Analyses (Site) 360, sample prep & TCLP analysis $86,040
800, sample prep & total metals analysis Residuals, Waste Shipping / Handling (Vendor) Bulk solid waste & recovered metals credit $110,180 Effluent Treatment (Site) Wastewater, 22,000 gal @ $1.25/gal $27,500 Total - Variable Costs $762,289 Total - Project Costs $1,688,086 Total - Cost/ton of soil processed $168
Table 15. Strengths of Various Molar Concentrations of Acetic and Hydrochloric Acid
HCl Solution pH Acetic Acid Solution pH 0.100M 1.00 0.100M 2.87
0.0100M 2.00 0.0100M 3.37 0.00100M 3.00 0.00100M 3.90

40 NFESC and USAEC September 18, 1997
Figure 26 provides a cost comparison of the three technologies for different size sites. The costs used forlandfilling and stabilization were adapted from R.S. Means Environmental Restoration Unit Cost Books(Means, 1996) for the same quantity of soil. The costs for separation/leaching were projected on thebasis of the Fort Polk experience with Vendor 2, as described in Tables 13 and 14. Fixed (capital) costswere assumed to remain fixed over the range of soil volumes (500 to 15,000 tons) covered. Implicit inthese costs is the assumption that the soil will be processed to meet the same targets as at Fort Polk (500mg/kg total and 5 mg/L TCLP lead in the processed soil). At smaller sites (with less than about 2,600 tons of soil), landfilling is always cheaper than stabilizationor separation/leaching. The reason for this is that for smaller soil volumes, an off-site option that doesnot generate the high fixed costs associated with on-site technologies is always cheaper. When the site isbigger than about 2,600 tons, on-site technologies, such as stabilization and separation/leaching, arecheaper. Stabilization is always cheaper than separation/leaching because it involves relatively simpleequipment (lower fixed cost) and faster processing (lower operating cost). If a true cost-benefit analysisis conducted, however, the physical separation and acid leaching option provides the following benefitsthat would merit serious consideration at most small-arms range sites, regardless of the soil volume: q Unlike stabilization, separation/leaching removes the heavy metal hazard from the soil. The
restored range can then be put to many more beneficial uses than would be possible withstabilized soil which still contains the metals.
q Unlike landfilling or stabilization, separation/leaching reduces the potential for long-termliability by removing and recycling the heavy metals.
q Several commercial vendors are available who can be contracted to assemble and operate therequired separation/leaching plant with off-the-shelf equipment. Processing is relatively fastand an active range need not be shut down for long. With a 10-ton/hr plant, a 10,000-ton sitecould be processed in around two months, assuming two shifts per day, seven days per week ofoperation.
Figure 26. Cost comparison of competitive technologies.

September 18, 1997 NFESC and USAEC 41
Regulatory/Institutional Issues
A number of regulatory issues apply to range maintenance or remediation operations: q National Environmental Policy Act (NEPA). NEPA applies to any maintenance or remediation
activity associated with active or inactive small-arms ranges. However, because of the limitedscope of many range maintenance or remediation projects, it may be possible (as at Fort Polk) tofulfill NEPA requirements by applying a Categorical Exclusion (CATEX) with a Record ofEnvironmental Consideration (REC), as described in Chapter 4 of Army Regulation (AR) 200-2.
q Resource Conservation and Recovery Act (RCRA). Both the final US EPA Military Munitionsrule and the DoD Military Range Rule indicate that if range maintenance activities occur on siteat an active range, the soil is not considered a RCRA hazardous waste. For such maintenanceactivities, regulatory-driven processing targets may not apply. Some concern still remainswhether all the states will recognize this. Remediation of inactive ranges may fall under RCRA.In either case, some RCRA waste may be generated during processing for either type of range.Examples of such wastes during the Fort Polk demonstration include PPE, metal-bearing organicmatter, and process solutions remaining at the end of processing.
q Emergency Planning and Community Right-to-Know Act (EPCRA). EPCRA requires thereporting of hazardous materials that exceed threshold planning quantities (TPQs). At FortPolk, the acids used required reporting under EPCRA.
q Clean Water Act (CWA). BDM, the site support contractor, prepared a Solid Waste PollutionPrevention (SWPP) Plan and a Spill Prevention, Control, and Countermeasures (SPCC) Plan,which were in effect during the demonstration. The vendors’ plants incorporated secondarycontainment for spills. The bermed asphalt pad and containment pond provided additional backup. The water from the containment pond was discharged to the sanitary sewer leading to thelocal wastewater treatment plant after being tested to ensure that it met the treatment plant’srequirements.
q Clean Air Act (CAA) and Occupational Health and Safety Act (OSHA). BDM prepared a Healthand Safety Plan for the maintenance activity and conducted air sampling and monitoring to evalu-ate lead dust. No lead dust hazard was noticed, but occasionally during Vendor 1’s operation,acetic acid fumes were observed near the processed soil pile. Field personnel, who generally woreLevel D PPE, switched to Level C, when sampling the processed soil on these occasions.
The Fort Polk installation commander, through his Environmental Management staff, was the authorizedline of communication to all environmental regulatory agencies. The installation had an active Environ-mental Quality Control Committtee (EQCC) that met monthly. In addition, the installation held Remedi-ation Advisory Board (RAB) meetings in which the local community and regulatory officialsparticipated. As part of the demonstration, Battelle organized the following activities designed to facilitate technologytransfer: q A Visitors’ Day was held on December 12, 1996, while Vendor 2 was operating, to allow
potential users in the DoD community a chance to see the plant in operation.
q Two brochures outlining the demonstration activities and results were prepared and distributedwidely.
q Two video films showing the plants in operation and the results of the processing were preparedfor use in training seminars.

42 NFESC and USAEC September 18, 1997
q This report and a more detailed Technology Evaluation Report describing the technicalperformance and cost effectiveness of the technology were prepared for distribution.
Application at Other Sites
Technical and Economic Feasibility
The physical separation and acid leaching technology is potentially applicable at most small-arms rangesites, both active and inactive. Different types of soil and heavy metal species encountered at differentsites may not be a significant limitation in meeting the TCLP lead criterion, if a strong acid, such ashydrochloric, is used at a sufficiently low pH (less than 2.0). At Fort Polk, the suspected lead specieswere mostly carbonates, which are relatively easy to leach. However, in a separate bench-scale studyreported by Van Benschoten et al. (1997), hydrochloric acid leaching (at a pH of 1.0) was successfullyapplied to seven different soils with various lead species (carbonates, oxides, sulfates) and soil-metalbinding mechanisms (exchangeable, adsorbed on iron and manganese oxides, etc.). All seven leachedsoils in this study met the TCLP lead criterion. In terms of soil texture too, Fort Polk, with its relativelyhigh clay content, probably represented one of the more difficult small-arms range sites that could beencountered. If the use of a weak acid, such as acetic, is desired, there may be limitations based on the speciation ofthe heavy metals and the soil-metal binding mechanisms. At Fort Polk, where the lead was suspected tooccur mostly as carbonates, acetic acid leaching succeeded in meeting the TCLP lead target, at least onthe first day, before the processing was hampered by plant problems. However, in separate bench-scalestudies by Igwe et al. (1994) and Krishnamurthy (1992), acetic acid was found to be effective only on themore easily leachable forms of lead. Given the large amounts of acetic acid required to reach moderatelylow pH (around 3.0) and the high unit price of acetic acid, the use of acetic acid is likely to incur higherprocessing costs. Bench-scale treatability studies should be conducted on a site-specific basis to select anappropriate leachant and to determine the ability of the technology to achieve the required processingtargets. The processing targets set for the maintenance or remediation are an important consideration whenevaluating the technical and economic feasibility of the technology. At Fort Polk, the total and leachablelead targets (500 mg/kg and 5 mg/L TCLP) were easily met by the hydrochloric acid process. However,some states may have more stringent requirements, especially for remediation of inactive ranges. Forexample, in California, the processed soil may be evaluated by the Waste Extraction Test (WET), whichis more aggressive than the TCLP. Although not a requirement for this demonstration, two samples ofthe processed soil from Vendor 2’s demonstration were subjected to the WET. As seen in Table 16, bothsamples easily met the TCLP criterion but did not meet the WET criterion for lead. In California,copper, zinc, and antimony are regulated metals.
Table 16. Leachable Lead Concentrations
U.S. EPA TCLP (mg/L) California WET (STLC) (mg/L) Sample No. Lead Copper Zinc Antimony Lead Copper Zinc Antimony
Nov. 22, processed soil 0.47 0.022 0.15 0.68 9.4 2.5 <1 5.1 Nov. 30, processed soil replicate 3.6 0.38 0.30 0.036 19 3.1 <1 2.1 California Limit 5.0 N/A N/A N/A 5.0 25 250 15

September 18, 1997 NFESC and USAEC 43
Meeting more demanding targets may be possible with separation/leaching, but will probably incurhigher processing costs. One option would be to remove as much of the heavy metals from the soil byseparation/leaching as is possible and economically viable, and then add a suitable stabilization agent tothe processed soil to reach the desired leachability target. Phosphate would be a good option as a stabili-zation agent that is effective over a wide range of pH and is relatively benign from an environmentalperspective. At the other end of the spectrum, there may be sites where physical separation alone may besufficient to meet a processing target such as TCLP. Again, comprehensive bench-scale testing would bethe best tool to evaluate and optimize a suitable processing scheme. Regulatory Perspective
At most active ranges, maintenance is not expected to come under RCRA, and the site may be able tochoose economically viable processing targets. At inactive ranges, remediation may have to beconducted under RCRA, in which case, at a minimum, the TCLP criterion for lead will have to be met.Some states may require more stringent processing targets, and these may engender the technical and costeffects discussed above. In any case, prospective sites should initiate regulatory involvement as early inthe decision-making process as possible. Vendor Selection and Contracting
Because several commercial vendors have the equipment and capability to implement separation/leachingprocesses, prospective sites need not build or operate their own plant. Based on the Fort Polk experience,the following guidance is suggested for vendor selection and contracting: q Vendors should have prior mining or remediation experience with separation/leaching type
technologies.
q Candidate vendors should be given a representative sample of the range soil for characterizationand bench-scale testing. A 30-gallon drum of soil composited from several grab samplescollected strategically from the berm should provide a representative quantity.
q Bench-scale testing should simulate all elements of the proposed process, including separation,leaching, precipitation, leachant regeneration, dewatering, and neutralization.
q The selected vendor should be asked to provide a complete process flow diagram indicating allinput, output, and intermediate streams. This diagram should include both solid and liquidflows. Supporting information should include estimated material flow and particle sizecomposition for each stream.
q The design should demonstrate the plant’s capability to handle variability in feed soil textureand metals concentration. Generally, some excess capacity in the process equipment isdesirable to provide the flexibility to increase residence times and avoid bottlenecks. Anyanticipated material handling difficulties should be identified and addressed.
q The vendor should provide information on site preparation needs and utilities support requiredfrom the site. On its part, it may be advisable for the site to overdesign site support facilities(such as power, water, pad size, etc.) to some extent to allow the vendor some flexibility inadding or changing equipment during the operation.
q The vendor should demonstrate that provisions have been made for adequate and appropriateoperator support in terms of number of operators and qualifications. At least one of the opera-tors should have enough knowledge of process chemistry to be able to make on-site adjustments.
q The vendor should demonstrate that adequate process control has been built into the plant toallow verification and adjustment of key operating parameters, such as pH, contact time, metals

44 NFESC and USAEC September 18, 1997
concentrations, etc. An on-site AA analyzer proved especially useful at Fort Polk in verifyinglead levels in key process streams.
Process Verification
To obtain reliable verification of the process efficiency and effectiveness of individual process elements,extensive sampling and analysis involving special methods were conducted during the demonstration.Routine range maintenance or remediation projects may need to conduct less frequent sampling. Withthe general goal of collecting, preparing, and analyzing representative samples, sites may be able toimplement less expensive adaptations of the sampling and analysis methods described in this report (Fig-ure 16). Towards this end, Battelle evaluated an alternative sampling scheme during the demonstration. In both schemes, a large composite sample (150 to 300 lbs) was initially collected from the processed soilpile in a 30-gal drum. In the first method the entire contents of the drum were processed by the regularscheme described in Figure 16. This involved the use of special large on-site equipment for drying,grinding, and splitting the large volume of material. In the alternative method, 1-liter (or 3- to 4-lb) grabsubsamples were collected directly from the drum containing the wet composite sample without priorpreparation. These grab subsamples were taken with a soil corer, so that an entire column of material wasobtained in each grab subsample. These grab subsamples were placed in 1-liter bottles and sent to theoff-site laboratory. Beyond this point, these grab subsamples were treated in the same fashion as theother 1-liter subsamples obtained from the regular method (see Figure 16), except that the 1-liter samplesfrom the alternative method had to be dried in the off-site laboratory. In both sampling methods, the1-liter subsamples were further processed at the off-site laboratory until representative 100-gram or8-gram aliquots could be collected for TCLP or total metals analyses, respectively. A comparison of the results of the two sampling schemes is shown in Table 17. The average total andTCLP lead concentrations by either method were almost exactly the same, although the alternativemethod of collecting grab samples from the composite drum showed a much higher variability betweenreplicates, as measured by the relative standard deviation (RSD).
Table 17. Comparison of the Analytical Data from Regular and Alternative SamplePreparation Methods
Sample
ID
Sampling Method
Total Lead Result
(mg/kg)
TCLP Lead Result (mg/L)
September 15, A Regular (Figure 16) N/A 3.11 September 15, B Regular N/A 2.98 September 15, C Regular N/A 3.10 September 15, D Regular 123.3 N/A September 15, E Regular 120.3 N/A
Average Regular 121.8 3.06 Percent RSD Regular 1.74% 2.36 %
September 15, X Alternative 114.2 3.18 September 15, Y Alternative 116.9 3.04 September 15, Z Alternative 125.6 3.01
Average Alternative 118.9 3.08 Percent RSD Alternative 2.95% 5.01 %
N/A = Not applicable/available.

September 18, 1997 NFESC and USAEC 45
In both methods, once the intital composite is collected by combining several grabs from the processed soilpile or from the processed soil conveyor, the problem of accurately sampling an 80-ton soil pile is reducedto one of sampling 150 to 300 lbs of soil from a drum that is a reasonably good representation of the originalpile. In the regular method used at Fort Polk, the variability in the drum is blended away by drying andgrinding the entire contents. In the alternative method, the variability in the drum is averaged out bycollecting a sufficient number of small replicates (three in this case). The alternative method providesreasonably good estimates without the need for expensive on-site equipment and preparation. If desired, theoriginal large composite can be mixed in a small cement mixer before the 1-liter grabs are collected.
Schedule
Table 18 shows the schedule of activities conducted as part of this demonstration.
Table 18. Schedule of Activities for the Demonstration at Fort Polk
Activity Start Date End Date Project Start/End 9/29/94 9/30/97 Vendor Selection/Contracting (BDM) 10/20/94 5/31/95 Permitting/Safety Plans (BDM) 2/12/95 5/15/95 Site Characterization (BDM) 11/15/95 12/14/95 Technology Demonstration Plan (Battelle) 6/21/96 8/21/96 Bench-Scale Testing (Vendors) 6/3/96 10/2/96 Site Preparation (BDM) 5/30/96 8/9/96 Vendor 1 Mobilization 7/22/96 8/30/96 Vendor 1 Processing 9/2/96 10/21/96 Vendor 1 Demobilization 10/21/96 10/25/96 Vendor 2 Mobilization 10/3/96 11/8/96 Vendor 2 Processing 11/11/96 12/10/96 Vendor 2 Demobilization 1/8/97 1/28/97 Visitors’ Day 12/12/96 12/12/96 Site Demobilization (BDM) 1/30/97 2/26/97 Draft-Final Technology Evaluation Report (Battelle) 2/15/97 6/15/97 Final Technology Evaluation Report (Battelle) 9/1/97 9/30/97
Lessons Learned
All the interpretations, conclusions, and recommendations arising from the demonstration were discussedin the appropriate sections of this report so that each topic could be fully addressed in one place. In sum-mary, the following lessons were learned from the demonstration: q The physical separation and acid leaching technology is a viable alternative for processing
small-arms range soils at most sites.
With a strong acid such as hydrochloric acid, different heavy metal speciation and soil-metalbinding mechanisms at different sites may not be a significant limitation in achieving the TCLPlead target. With a weak acid, such as acetic, metal speciation and soil-metal binding mech-anisms at some sites may impose limitations in meeting the TCLP lead target. This conclusionwas based partly on the Fort Polk experience and partly on the results of other studies (VanBenschoten et al., 1997; Igwe et al., 1994; and Krishnamurthy, 1992).

46 NFESC and USAEC September 18, 1997
q Acetic acid leaching is costlier than hydrochloric acid leaching because of the higher unit priceand higher concentration requirements of acetic acid. However, acetic acid is expected to berelatively more benign on the soil structure and process equipment.
q Technical and economic feasibility of the technology at a given site will depend on the process-ing targets assigned for the project. For inactive ranges, some states may require more stringentprocessing criteria than meeting TCLP. The feasibility of the technology at such sites should beevaluated through bench-scale tests.
q Bench-scale studies are the most important tool for assessing technical feasibility and costeffectiveness of the technology on a site-specific basis. A comprehensive bench-scale study thattests every element of the process, including physical separation, leaching, precipitation, anddewatering is a major contributor to success in the field.
q Plant design should be flexible enough to handle the expected variability in the texture and metalscontent of the soil. Adequate process control should be built into the plant to enable personnel toverify that operating parameters established during bench-scale testing are being met in the field.
Sources
Battelle. 1996. Technology Demonstration Plan for Joint Small-Arms Range Remediation at Fort Polk,Louisiana. Prepared by Battelle Columbus Operations for Naval Facilities Engineering Service Centerand U.S. Army Environmental Center, October 14.
Fristad, W.E., D.K. Elliott, and M.D. Royer. 1996. “EPA Site Emerging Technology Program: CognisTerramet® Lead Extraction Process.” Air & Waste Manage Assoc., 46:470-480.
Igwe, G.J., P.D. Walling, Jr., and D. Johnson. 1994. “Physical and Chemical Characterization of Lead-Contaminated Soil.” 1994 Innovative Solutions for Contaminated Site Management. The WaterEnvironment Federation conference, Miami, FL. March 6.
Krishnamurthy, S. 1992. “Extraction and Recovery of Lead Species from Soil.” Environmental Progress,11(4):256-260.
Means, R.S. 1996. Softbooks – Environmental Restoration Cost Books. ECHOS, LLC.
Taggart, A.F. 1945. Handbook of Mineral Dressing, Ores and Industrial Minerals. John Wiley & Sons,New York, NY.
U.S. Environmental Protection Agency. 1995. Contaminants and Remedial Options at Selected Metal-Contaminated Sites. EPA/540/R-95/512. Office of Research and Development, Washington, DC.
Van Benschoten, J.E., M.R. Matsumoto, and W.H. Young. 1997. “Evaluation and Analysis of SoilWashing for Seven Lead-Contaminated Soils.” Journal of Environmental Engineering, 123(3):217-224.
Additional References
Battelle. 1997a. Physical Separation and Acid Leaching: A Demonstration of Small-Arms Range Reme-diation at Fort Polk, Louisiana. Final report prepared for Naval Facilities Engineering Service Centerand U.S. Army Environmental Center. July.
Battelle. 1997b. Physical Separation and Acid Leaching: A Demonstration of Small-Arms Range Reme-diation at Fort Polk, Louisiana, Implementation Guidance Handbook. Prepared for Naval FacilitiesEngineering Service Center and U.S. Army Environmental Center. August.

September 18, 1997 NFESC and USAEC 47
BDM. 1997. Demonstration of Physical Separation/Leaching Methods for the Remediation of HeavyMetals-Contaminated Soils at Small-Arms Ranges. Prepared for U.S. Army Environmental Center andNaval Facilities Engineering Service Center. June.
BDM. 1996. Worldwide Search Report. Prepared for U.S. Army Environmental Center. February 7.
Lead Industries Association. 1992. Lead Recycling – 1992 Directory. Lead Industries Association,New York, NY.
U.S. Environmental Protection Agency. 1991. Superfund Engineering Issue – Treatment of Lead-Contaminated Soils. EPA/540/2-91/009. Office of Solid Waste and Emergency and Remedial Response,Washington, DC; and Office of Research and Development, Risk Reduction Engineering Laboratory,Cincinnati, OH.
U.S. Environmental Protection Agency. 1992. Engineering Bulletin: Selection of Control Technologiesfor Remediation of Lead Battery Recycling Sites. EPA/540-S-02/011. Office of Emergency andRemedial Response, Washington, DC.
U.S. Environmental Protection Agency. 1994. VISITT C Vendor Information System for InnovativeTreatment Technologies. EPA/542/R-94/003 (with update to Version 4.0). Office of Solid Waste andEmergency Response, Washington, DC.
Analysis Preparation
The on-site evaluation and this analysis of the demonstration was conducted by:
Battelle505 King AvenueColumbus, Ohio 43201
Project Leader: Arun Gavaskar (614) 424-3403
Certification
This analysis was reviewed by:
Naval Facilities Engineering Service Center U.S. Army Environmental Center1100 23rd Street Building E-4430Port Hueneme, California Aberdeen Proving Ground, Maryland 21010
Project Officer: Barbara Nelson Project Officers: Richard O’DonnellPhone: (805) 982-1668 Phone: (410) 612-6850
Lisa MillerPhone: (410) 612-6843