1975 - university of wisconsin–stevens point
TRANSCRIPT
THE WALLEYE POPULATION AND FISHERY IN THE
RED CEDAR RIVER, WISCONSIN
by
Michael A. Colvin
A Thesis
Submitted to
University of Wisconsin - Stevens Point
in partial fulfillment
of the requirements for
the degree of
MASTER of SCIENCE
September 1975
THE WALLEYE POPULATION AND FISHERY IN THE
RED CEDAR RIVER, WISCONSIN
ABSTRACT
Walleye, Stizostedion vitreum (Mitchill), were tagged
and a partial creel survey conducted in a 12.5 ha segment
of the Red Cedar River, Wisconsin, between the impoundments
of Tainter Lake and Lake Menomin. Tag returns and electrofish
ing catches indicated a high concentration of walleye in the
river during April and early May. Walleye migrated down
stream into Lake Menomin during summer and upstream in fall.
Fish was the most important food item and comprised 84 percent
of the total food volume of walleye less than 200 mm long
and 97 percent of the total for those larger than 200 mm.
Total lengths at annulus formation based on the sum of mean
annual increments for each year class were 162, 264, 328, 373,
419, 452, 474, 490, 514, 537, 562, and 618 mm for ages I
through XII, respectively. Total annual mortality rate determined
from catch curves and angler recapture of tagged fish was
estimated to be 50 percent for ages II through IX. Exploitation
rate, estimated from angler tag returns corrected for nonre
sponse and tag shedding, was 31 percent for 1973 and 1974.
Anglers fished an estimated 273 and 278 hrs/ha, caught 22 and
12 walleye/ha (9.1 and 4.7 kg/ha) at rates of 7 and 4 fish/100 hrs
in 1973 and 1974. Mean length of walleye creeled was 362 and
351 mm in 1973 and 1974, and 82 percent of the catch was made

up of ages II through V. Males and females appeared to be
equally vulnerable to anglers. Population estimates, cal
culated from creel survey data, ranged from 7.6 to 9.7
walleye/ha and 3.0 to 3.2 kg/ha with a mean of 8.5 walleye/ha
(3.1 kg/ha) for walleye 250 mm and longer. Critical size,
the size at which a year class reaches its maximum biomass,
was estimated to be between 419 and 452 mm total length, weights
of 663 and 845 grams, or ages V and VI. Calculation of equil
ibrium yield per un~t recruitment indicated that weight harvested
could be increased by 27, 38, and 35 percent with 328, 373,
and 419 mm length limits.

ACKNOWLEDGEMENTS
I would like to thank the Wisconsin Cooperative Fishery
Unit and Graduate College at the University of Wisconsin -
Stevens Point for the fellowship and assistantship that made
this study possible.
I express my sincere thanks to my advisor and committee
chairman, Dr. Daniel W. Coble, for his assistance in designing
the study, his help in the field, and the preparation of the
manuscript. I also thank my graduate committee for their review
of the manuscript: Dr. Ed Pentecost, Dr. Gerald Z. Jacobi,
Dr. Henry Booke, and Dr. Fred Copes. I thank Mr. Bert Apelgren
of the Wisconsin Department of Natural Resources for his input
and guidance during the study.
I am very grateful to Jim Heckenkamp who conducted most
of the 1974 creel survey and helped with field work. I would
also like to thank the following students who tolerated adverse
weather conditions to help me in my field work: Vaughn Paragamian,
Bruce Taubert, Al Buchanan, Don Hausle, Mike Headrick, Dave
Braatz, Gene Vaughan, Don Degan, Tom Joy, Patricia Marinac,
Gary Lutterbie, Dave Sanders, Jerry Kaster, Chuck Prentice,
Barry Johnson, Willie Booker, Larry Nelson, and Greg Miller.
I would like to thank Christine Perszyk for drafting the
figures and Dr. Fred Hilpert for his computer programming and
help with the statistical analyses. Thanks is also given to
the local merchants who collected tags and to the Red Cedar

River anglers who cooperated with the tag return program and
creel survey.
I also give a very special thanks to my wife, Carolyn,
for her devoted help with the field and laboratory work,
typing, and her patience throughout the study.
TABLE OF CONTENTS
INTRODUCTION . .......................................... .
MATERIAI..S AND METHODS .................................. .
RESULTS AND DISCUSSION ................................. .
Annulus Formation, Morphological Measures, Growth, and Maturity .............................. .
Page
1
2
8
8
Food Habit s . . . . . . . . . . . . . . . . . . . . . . . . . . . . . . . . . . . . . . . . 18
Mortality Rates .................................... 23
Exploitation Rate ............................. 23
Total Annual Mortality and Natural Mortality Rates ....................... 28
Summer Creel Survey and Fishing Pressure ........... 33
Harvest and Age Class Composition .................. 45
Winter Creel Survey ................................ 48
Movement. . . . . . . . . . . . . . . . . . . . . . . . . . . . . . . . . . . . . . . . . . . 50
Population Estimates and Estimated Total Harvest ............................ 54
Critical Size and Equilibrium Yield ................ 57
LITERATURE CITED ........................................ 60
APPENDICES. . • . . . . . . . . . . . . . . . . . . . . . . . . . . . . . . . . . . . . . . . . . . . 66
LIST OF TABIES
Page
Table 1. - Physical dimensions of the Red Cedar River study areas................................ 2
Table 2. - Number of walleye tagged in Area B of the Red Cedar River With Swedish smolt, Streamer, and Floy dart tags in spring, 1973 and 1974 . ............ ·. . . . . . . . . . . . . . . . . . . . . . . . . . . . . . . . . . 4
Table 3. - Mean total lengths (mm) of age classes captured in 1974, sum of mean annual increments for each year class from the 1973 sample, and the difference. Numbers in paren-theses indicate sample size ............................ 10
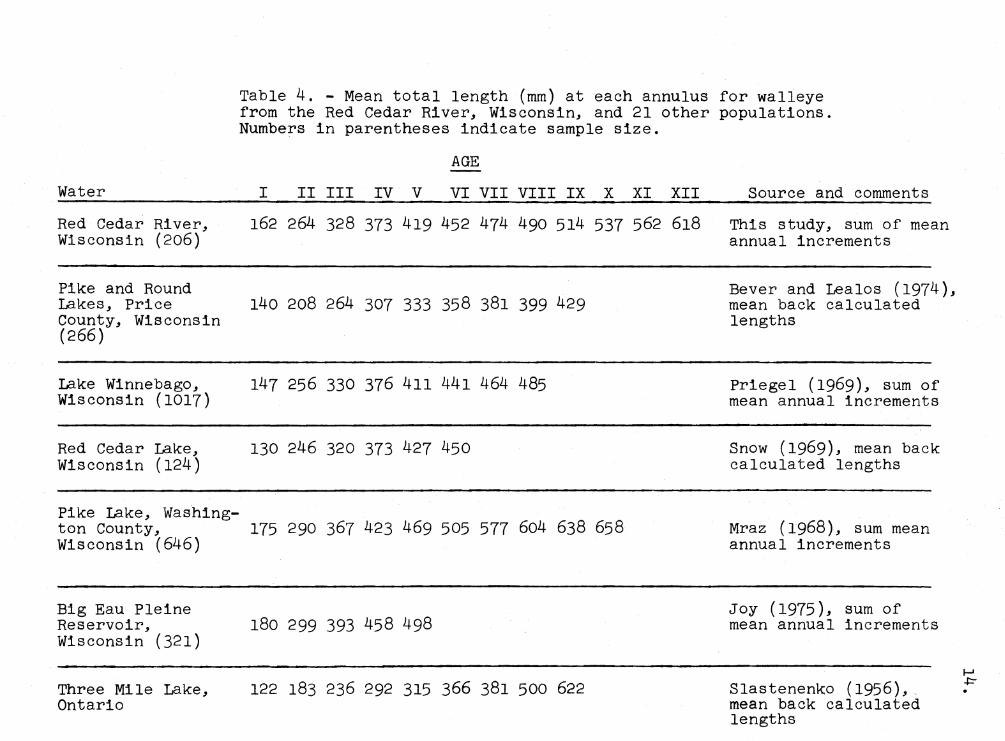
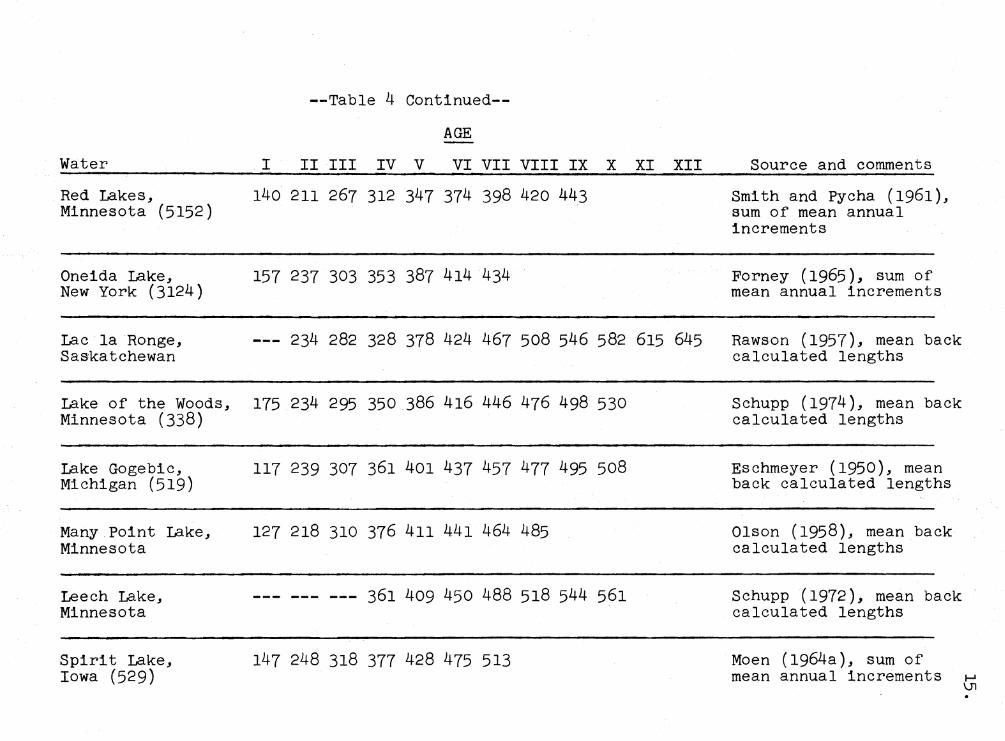
Table 4. - Mean total length (mm) at each annulus for walleye from the Red Cedar River, Wisconsin, and 21 other populations. Numbers in parentheses indicate sample size................................... 14
Table 5. - Food items from 35 young-of-the year and yearling walleye, 117 through 196 mm long, captured by electrofishing in the Red Cedar River, August 1973 through September 1974 .............. 19
Table 6. - Food items from 77 Red Cedar River walleye, 233 through 505 mm long; 66 captured by electrofishing and 11 by anglers, August 1973, through October, 1974... . . . . . . . . . . . . . . . . . . . . . . . . . 22
Table 7. - Number of walleye tagged in the Red Cedar River before the fishing season, area tagged, estimated number captured by anglers, and estimated exploitation rates, 1973 and 1974. . . . . . . . . . . . . . . . . . . . . . . . . . . . . . . . . . . . . . . . . . . . . . . 26
Table 8. - Estimates of annual mortality rates (percent) from several walleye populations; a is total annual mortality, u is exploitation rate, and vis annual expectation of death by natural causes..... . . . . . . . . . . . . . . . . . . . . . . . . . . . . . . . . . 34
Page
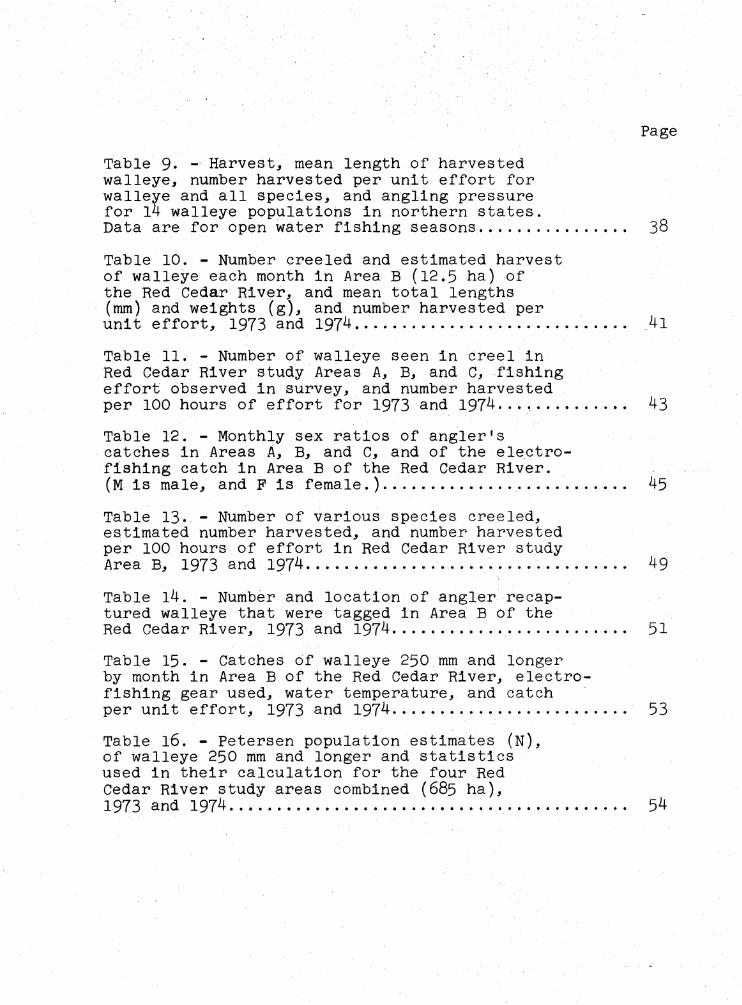
Table 9. - Harvest, mean length of harvested walleye, number harvested per unit effort for walleye and all species, and angling pressure for 14 walleye populations in northern states. Data are for open water fishing seasons ................ 38
Table 10. - Number creeled and estimated harvest of walleye each month in Area B (12.5 ha) of the Red Cedar River, and mean total lengths (mm) and weights (g), and number harvested per unit effort, 1973 and 1974 ............................. 41
Table 11. - Number of walleye seen in creel in Red Cedar River study Areas A, B, and C, fishing effort observed in survey, and number harvested per 100 hours of effort for 1973 and 1974 ... , .......... 43
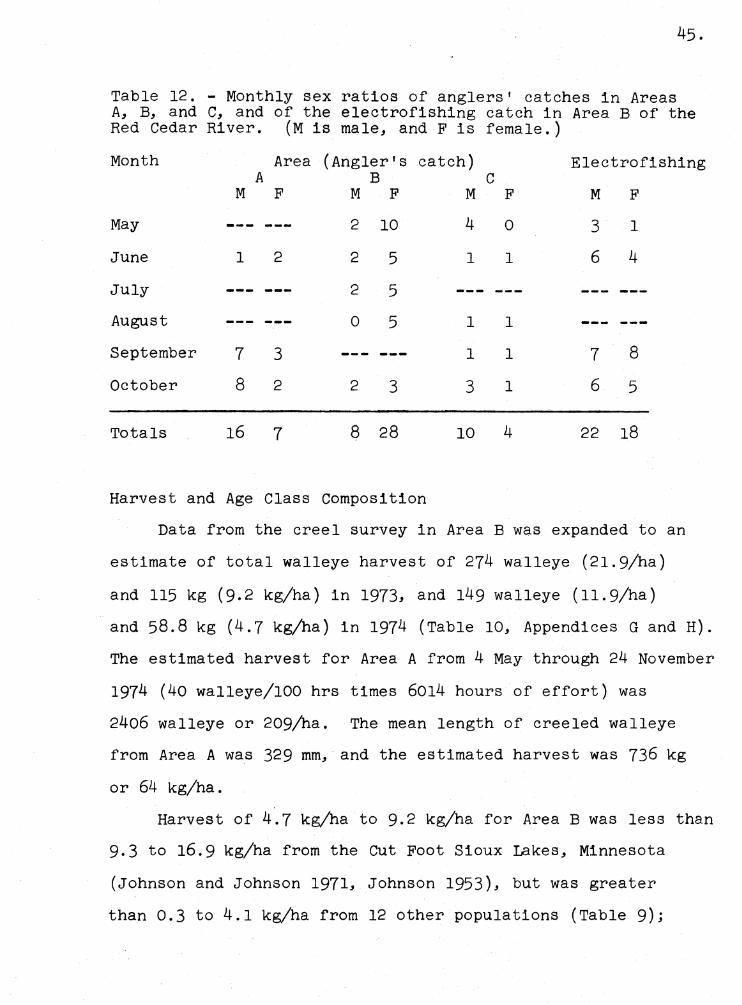
Table 12. - Monthly sex ratios of angler's catches in Areas A, B, and C, and of the electro-fishing catch in Area B of the Red Cedar River. (Mis male, and Fis female.) .......................... 45
Table 13. - Number of various species creeled, estimated number harvested, and number harvested per 100 hours of effort in Red Cedar River study Area B, 1973 and 1974 .................................. 49
Table 14. - Number and location of angler recap-tured walleye that were tagged in Area B of the Red Cedar River, 1973 and 1974......................... 51
Table 15. - catches of walleye 250 mm and longer by month in Area B of the Red Cedar River, electrofishing gear used, water temperature, and catch per unit effort, 1973 and 1974 ......................... 53
Table 16. - Petersen population estimates (N), of walleye 250 mm and longer and statistics used in their calculation for the four Red Cedar River study areas combined (685 ha), 1.973 and 1974. . . . . . . . . . . . . . . . . . . . . . . . . . . . . . . . . . . . . . . . . . 54
Page
Table 17. - Population estimates and standing stocks of eight walleye populations in the United States.......................................... 56
Table 18. - Back calculated lengths and weights, instantaneous growth (G) and natural mortality rates (M) of Red Cedar River walleye. G = loge (Wt/Wo). . . . . . . . . . . . . . . . . . . . . . . . . . . . . . . . . . . . . . . . . . . 58

LIST OF FIGURES
Page
Figure 1. - Length and ages of 406 walleye captured by electrofishing in Area B of the Red Cedar River, April through June, 1973, 1974 ......... 9
Figure 2. - Relationships between total length (mm) and anterior scale radius for walleye from the Red Cedar River, Wisconsin. (r is correla-tion coefficient.)..... . . . . . . . . . . . . . . . . . . . . . . . . . . • . . . . . . 11
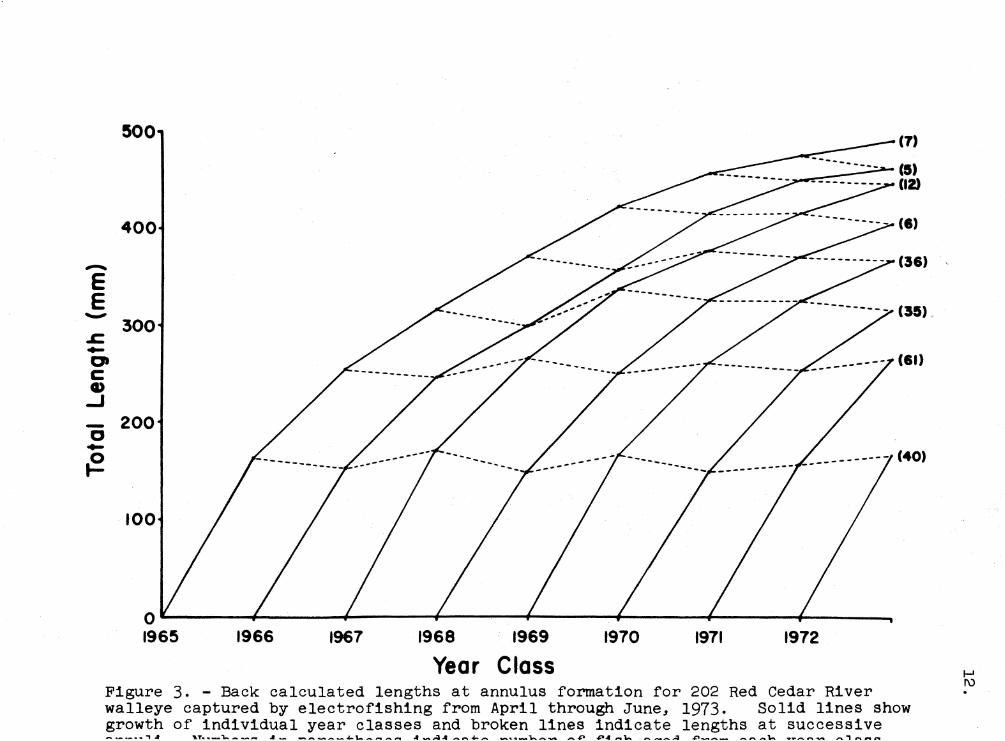
Figure 3. - Back calculated lengths at annulus formation for 202 Red Cedar River walleye captured by electrofishing from April through June, 1973. Solid lines show growth of individual year classes and broken lines indi~ cate lengths at successive annuli. Numbers in parenthesis indicate number of fish aged from each year class .................................... 12
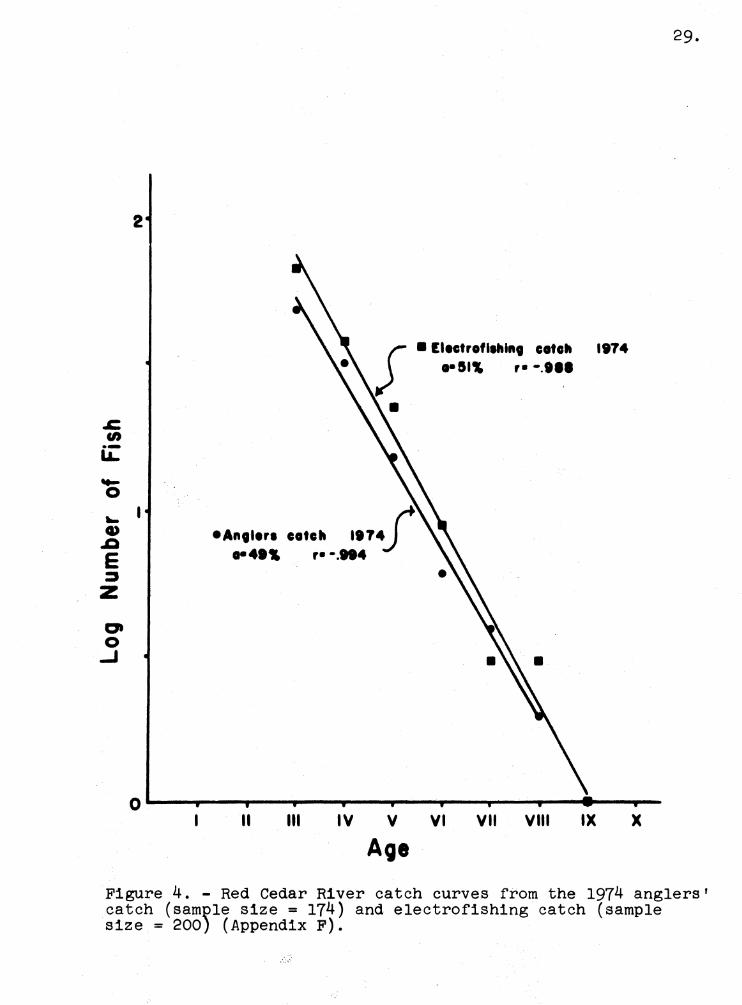
Figure 4. - Red Cedar River catch curves from the 1974 anglers' catch (sample size= 174) and electrofishing catch (sample size= 200} ( Appendix F) . . . . . . . . . . . . . . . . . . . . . . . . . . . . . . . . . . . . . . . . . . . . 29
INTRODUCTION
Walleye, Stizostedion vitreum (Mitchill), one of the most
popular game fish in Wisconsin, occurs in most of the larger
lakes and rivers in the state (Niemuth, Churchill, and Wirth
1972). Objectives of this study were to describe the charac
teristics of the walleye population and fishery in the Red
Cedar River, Wisconsin, and to use the vital statistics to
obtain information that might be useful in managing the species.
In 1973 and 1974, walleye and other species were captured
with electroshockers, measured, weighed, and fin clipped.
Scale samples were taken and some walleye were tagged and released.
A partial creel survey was conducted. Information pertaining
to growth, food habits, movement, population size, angler
harvest, and exploitation and mortality rates was obtained.
Results of this study complement those of Paragamian (1973),
on smallmouth bass (Micropterus dolomieui) in the same river.
2.
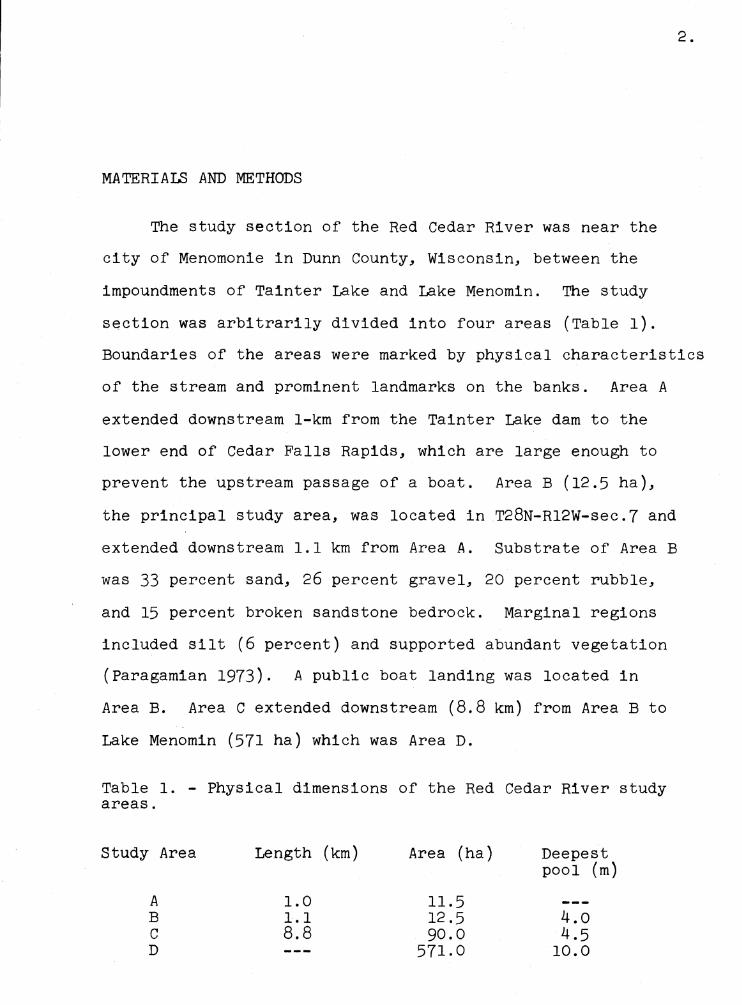
MATERIALS AND METHODS
The study section of the Red Cedar River was near the
city of Menomonie in Dunn County, Wisconsin, between the
impoundments of Tainter Lake and Lake Menomin. The study
section was arbitrarily divided into four areas (Table 1).
Boundaries of the areas were marked by physical characteristics
of the stream and prominent landmarks on the banks. Area A
extended downstream 1-km from the Tainter Lake dam to the
lower end of Cedar Falls Rapids, which are large enough to
prevent the upstream passage of a boat. Area B (12.5 ha),
the principal study area, was located in T28N-Rl2W-sec.7 and
extended downstream 1.1 km from Area A. Substrate of Area B
was 33 percent sand, 26 percent gravel, 20 percent rubble,
and 15 percent broken sandstone bedrock. Marginal regions
included silt (6 percent) and supported abundant vegetation
(Paragamian 1973). A public boat landing was located in
Area B. Area C extended downstream (8.8 km) from Area B to
Lake Menomin (571 ha) which was Area D.
Table 1. - Physical dimensions of the Red Cedar River study areas.
Study Area Length (km) Area (ha) Deepest pool (m)
A 1.0 11.5 B 1.1 12.5 4.o C 8.8 90.0 4.5 D 571.0 10.0

3.
On 14 sampling days between 26 April and 20 June, 1973,
676 walleye were captured with 230 volt AC and DC electro
shockers which were used on six and eight of the days,
respectively. Only DC gear was used in 1974 when 524 walleye
were captured on 5 days between 18 April and 2 May. Electro
fishing was always conducted at night. Captured walleye were
anaesthetized with MS 222, measured, weighed, a scale sample
taken, and released.
Walleye less than 250 mm total length were given a 1/2
right pelvic fin clip. Walleye 250 mm long and over were given
a 1/2 left pelvic fin clip and were tagged. The oval, green,
plastic tags (15 X 5 X 0.75 mm) with code number and message
were attached anterior to the dorsal fin by a line with the
aid of a surgical needle (Saunders 1968). In 1973, streamer
tag attachment (Budd, Fry, and Smith 1968) to 279 walleye
was made with 6-lb test monofilament fishing line, and Swedish
smolt attachment (Saunders 1968) to 197 walleye was made with
0.5 mm diameter polyethylene line (Table 2). The sequence
was to tag 100 walleye with streamer tags, then 100 with
Swedish smolt tags, etc ... Of the 476 walleye tagged in
1973, 53 percent had lost their tags by November. In 1974,
Swedish smolt attachment to 368 walleye was made with 30-lb
test monofilament line or 12-lb test nylon multifilament
casting line (Table 2). These lines were tested earlier on
spotted sucker (Minytrema melanops) and carp (Cyprinus carpio)
in a laboratory experiment (Appendix A). Streamer tags were
not used in 1974, but Floy dart tags were applied to 36
walleye (Dell 1968).
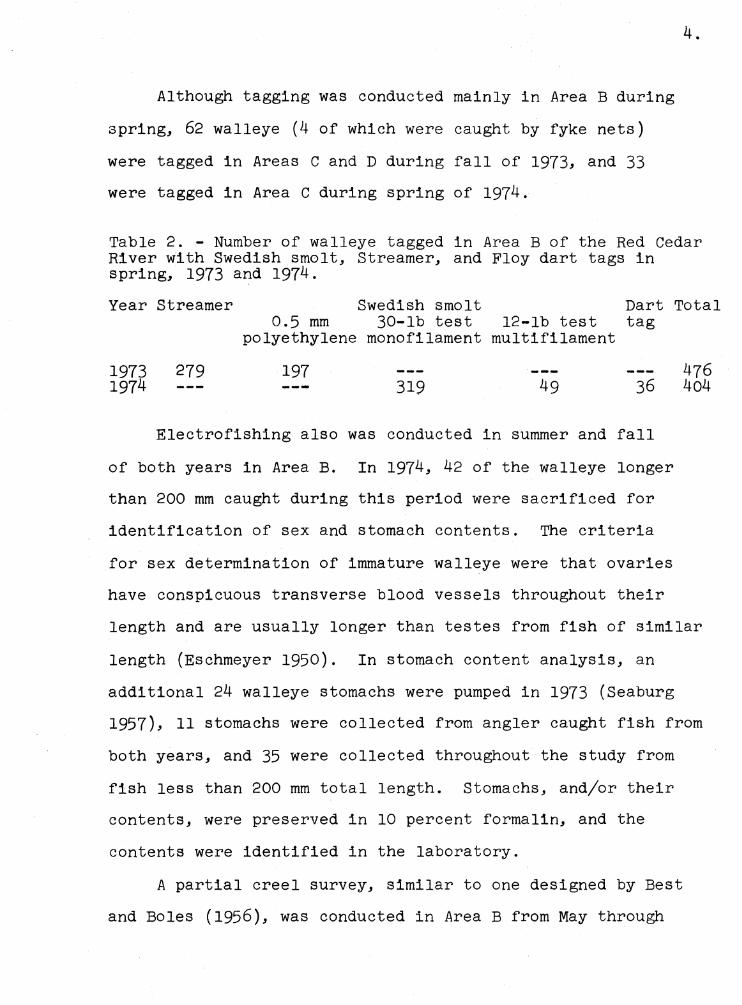
Although tagging was conducted mainly in Area B during
spring, 62 walleye (4 of which were caught by fyke nets)
were tagged in Areas C and D during fall of 1973, and 33
were tagged in Area C during spring of 1974.
4.
Table 2. - Number of walleye tagged in Area B of the Red Cedar River with Swedish smolt, Streamer, and Floy dart tags in spring, 1973 and 1974.
Year Streamer Swedish smolt Dart Total 0.5 mm 30-lb test 12-lb test tag
polyethylene monofilament multifilament
1973 279 197 1974 319 49 36
Electrofishing also was conducted in summer and fall
of both years in Area B. In 1974, 42 of the walleye longer
than 200 mm caught during this period were sacrificed for
identification of sex and stomach contents. The criteria
476 404
for sex determination of immature walleye were that ovaries
have conspicuous transverse blood vessels throughout their
length and are usually longer than testes from fish of similar
length (Eschmeyer 1950). In stomach content analysis, an
additional 24 walleye stomachs were pumped in 1973 (Seaburg
1957), 11 stomachs were collected from angler caught fish from
both years, and 35 were collected throughout the study from
fish less than 200 mm total length. Stomachs, and/or their
contents, were preserved in 10 percent formalin, and the
contents were identified in the laboratory.
A partial creel survey, similar to one designed by Best
and Boles (1956), was conducted in Area B from May through
November of both years. The fishing day was considered to
consist of two, 8-hour periods (0600-1400 hrs and 1400-2200
hrs), and each survey day was censused during one of these
periods. In 1973 the survey was conducted by Wisconsin
Cooperative Fishery Unit personnel. One randomly selected
morning or afternoon was surveyed on both days of each week
end and all holidays. Also, one randomly selected period of
a weekday and the preceding afternoon or following morning
5-
was surveyed. In 1974, a creel survey clerk from the Menomonie
area was available, and the weekday su~vey was changed to
two randomly selected periods plus one or two extra periods
as his summer school schedule permitted.
Anglers were interviewed on shore as they completed their
fishing day in Area B, or by boat at 1400 hrs, which was the
end of the morning period. The afternoon period was surveyed
until all anglers fishing in Area B completed their fishing
trip. Anglers that used the public boat landing in Area B,
but fished in another area, also were interviewed at the
completion of their fishing trip. Information was obtained
on size of fishing party, area fished, length of fishing trip,
distance travelled to fish, bait used, fishing method (boat,
shore, waders, or ice), and species captured and released.
Creeled smallmouth bass, walleye, northern pike (Esox lucius),
and largemouth bass (Micropterus salmoides) were measured.
Presence of other species creeled was recorded, and tags
were recovered.
6.
In 1974, scale samples were taken from 174 of the walleye
seen during the creel survey, and the fish were gutted and
sexed when the angler allowed it. Instantaneous fishermen
counts were made on Area A during 1974. The clerk made 2
counts per survey day; one as he went to work in Area Band
one as he left. Anglers were interviewed in Area A when time
permitted.
A winter creel survey was conducted in Areas C and D
from 15 December 1973 through February 1974. The fishing
day was shortened to 0800 to 1400 hrs for the morning period
and 1400-2100 hrs for the afternoon period. A few anglers
were interviewed as they completed their trips, but most were
interviewed while they were fishing.
Anglers could return tags by mail, or, to several tag
return stations at local businesses. The message on the tag
instructed anglers to tell where the fish were caught, and
personnel at the return stations also requested this infor
mation. The study was given publicity by local news media,
and several signs were posted in the study section.
A random sample of scales from 200 fish caught by electro
fishing in the spring of 1973 was aged. The same procedure
was used in 1974, and also the scales collected during the
creel survey were aged. Scales were taken from the left side
of the fish from the area below the lateral line at the tip
of the depressed pectoral fin. They were pressed on cellulose
acetate slides, 77 X 25 X 0.75 mm thick (Smith 1954), and
viewed on a scale projector under 40 X magnification.
7.
Annuli were counted, and the anterior scale radius to each
annulus was measured. Annuli were recognized by the following
criteria: a clear zone devoid of circuli, a cutting over of
circuli, and radii that may end or bend at an annual mark
(Tesch 1971). Small "bubbles" in the radii were frequently
seen at annual marks. All scales were read at least twice
or until two identical consecutive readings were obtained.
Scales from fish of all length groups were read and confirmed
by two experienced readers.
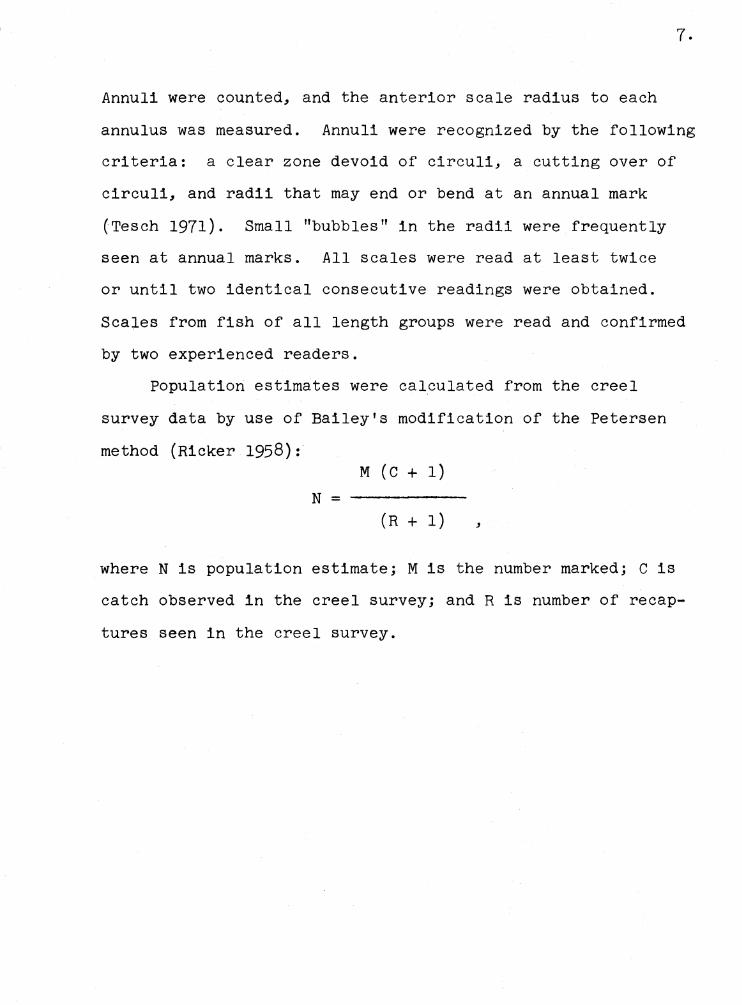
Population estimates were calculated from the creel
survey data by use of Bailey's modification of the Petersen
method (Ricker 1958):
N = M (C + 1)
(R + 1) ,
where N is population estimate; Mis the number marked; C is
catch observed in the creel survey; and R is number of recap
tures seen in the creel survey.
8.
RESULTS AND DISCUSSION
Annulus Formation, Morphological Measures, Growth, and Maturity
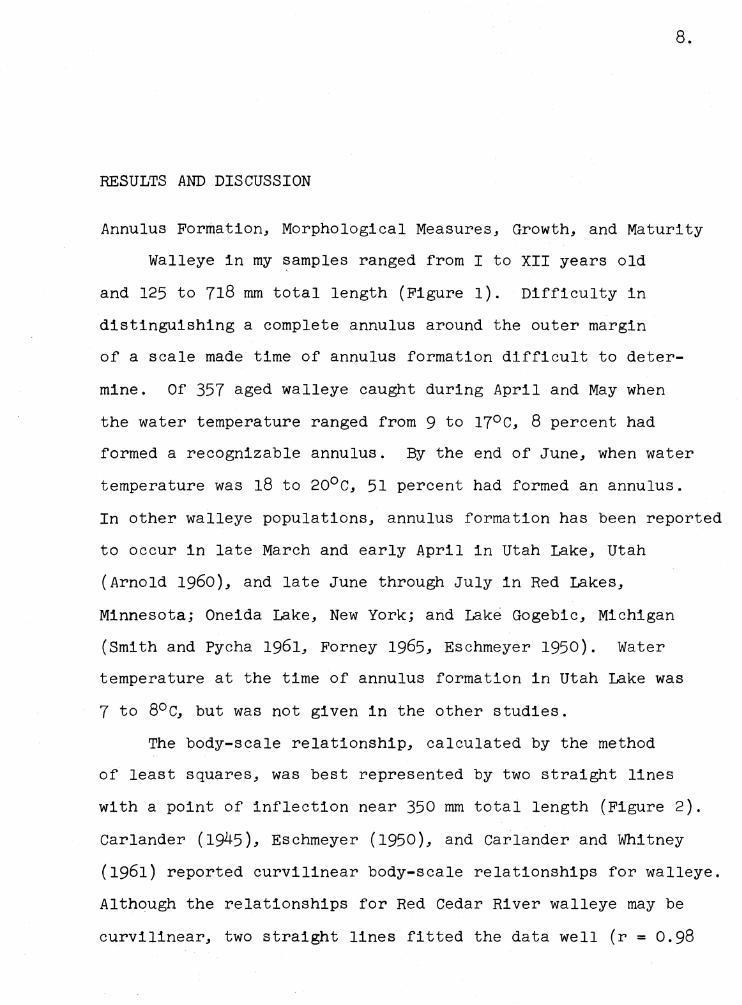
Walleye in my samples ranged from I to XII years old
and 125 to 718 mm total length (Figure 1). Difficulty in
distinguishing a complete annulus around the outer margin
of a scale made time of annulus formation difficult to deter
mine. Of 357 aged walleye caught during April and May when
the water temperature ranged from 9 to 17°c, 8 percent had
formed a recognizable annulus. By the end of June, when water
temperature was 18 to 20°c, 51 percent had formed an annulus.
In other walleye populations, annulus formation has been reported
to occur in late March and early April in Utah Lake, Utah
(Arnold 1960), and late June through July in Red Lakes,
Minnesota; Oneida Lake, New York; and Lake Gogebic, Michigan
(Smith and Pycha 1961, Forney 1965, Eschmeyer 1950). Water
temperature at the time of annulus formation in Utah Lake was
7 to 8°c, but was not given in the other studies.
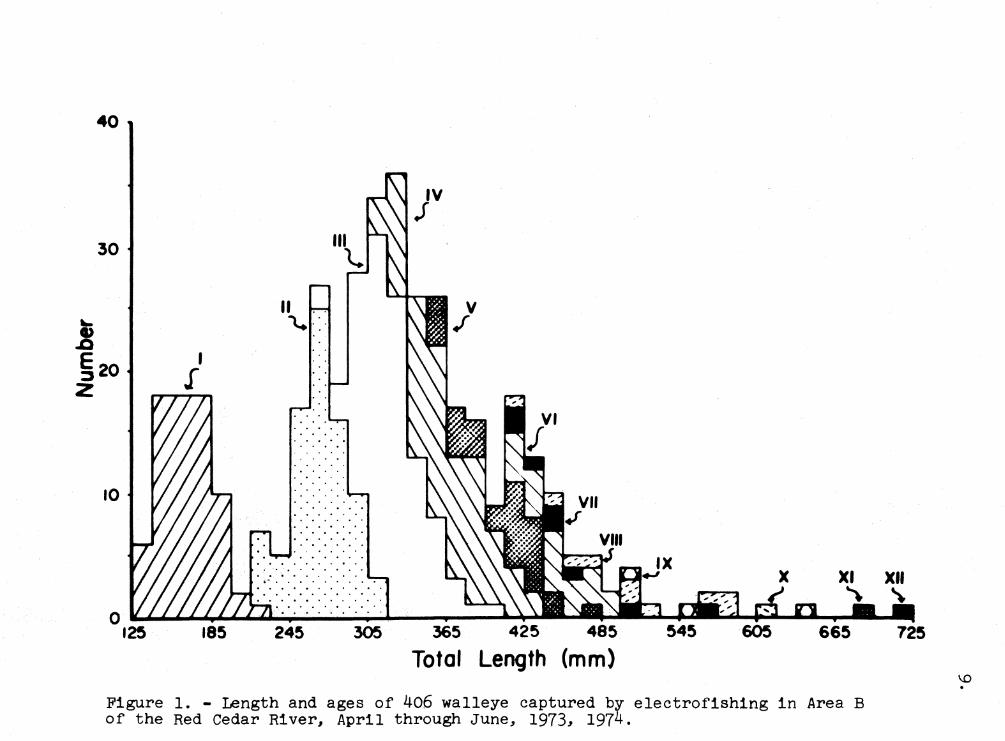
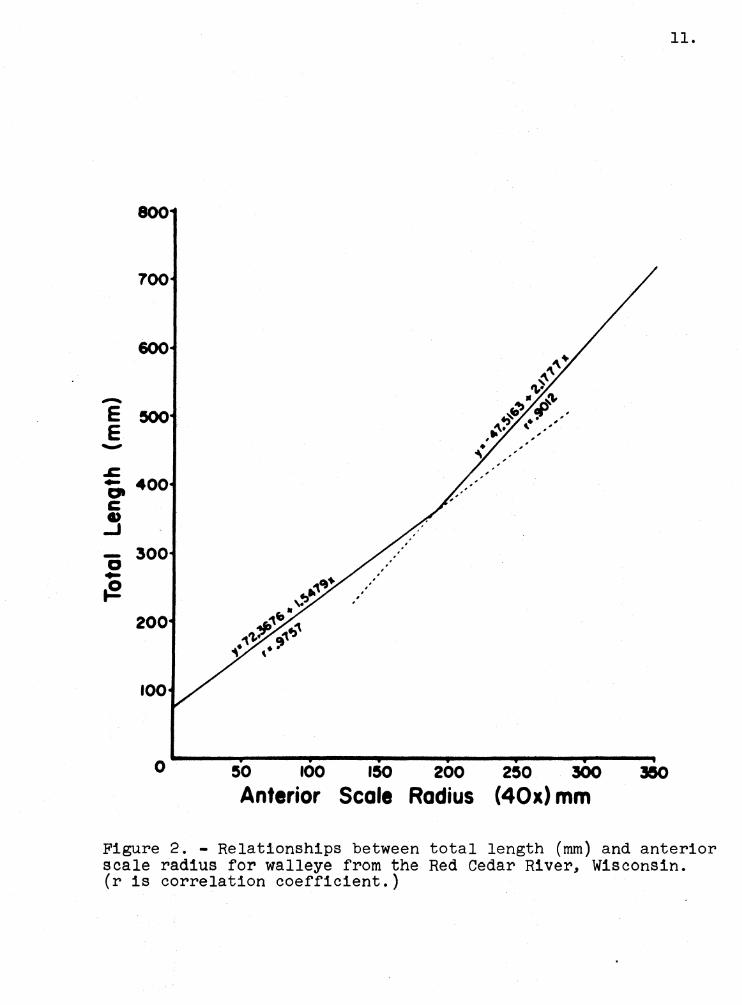
The body-scale relationship, calculated by the method
of least squares, was best represented by two straight lines
with a point of inflection near 350 mm total length (Figure 2).
Carlander (1945), Eschmeyer (1950), and Carlander and Whitney
(1961) reported curvilinear body-scale relationships for walleye.
Although the relationships for Red Cedar River walleye may be
curvilinear, two straight lines fitted the data well (r = 0.98
40
30 Ill l.
II .. "\.. :-
I [
10
0 ............. ~--...... ~,......------------.... .,.... 125 185 245 305 365 425 485 545 605 665
Total Length {mm)
Figure 1. - Length and ages of 406 walleye captured by electrofishing in Area B of the Red Cedar River, April through June, 1973, 1974.
725
\.0 .
10.
and 0.90 for the lower and upper regression lines, respectively).
The relationships, which were determined only for the 1973
sample, were:
Y = 72.3676 + 1.5479 X for walleye less than 350 mm and,
Y = -47.5163 + 2.1777 X for walleye greater than 350 mm,
where, Y is total length in millimeters and Xis the anterior
scale radius (40 X) in millimeters. These relationships were
used to back calculate lengths at each annulus (Figure 3 and
Appendix B). Female walleye grew faster than males after age
III (Appendices C and D). Faster growth rates for female walleye
have been reported in numerous studies (e.g. Eschmeyer 1950,
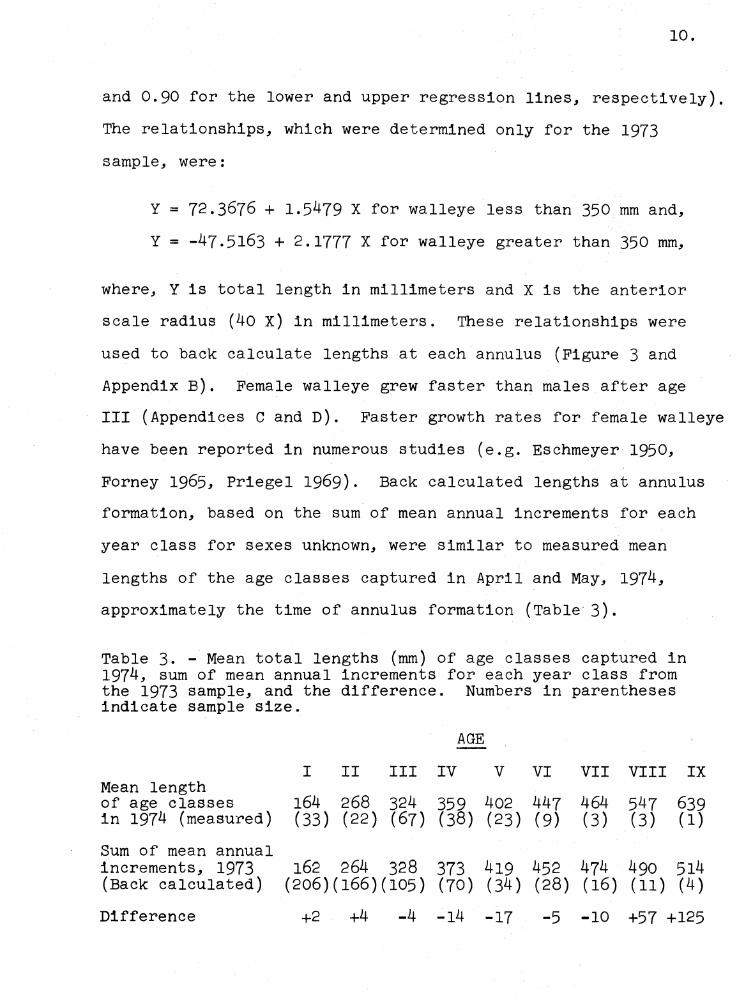
Forney 1965, Priegel 1969). Back calculated lengths at annulus
formation, based on the sum of mean annual increments for each
year class for sexes unknown, were similar to measured mean
lengths of the age classes captured in April and May, 1974,
approximately the time of annulus formation (Table 3).
Table 3. - Mean total lengths (mm) of age classes captured in 1974, sum of mean annual increments for each year class from the 1973 sample, and the difference. Numbers in parentheses indicate sample size.
Mean length of age classes in 1974 (measured)
Sum of mean annual increments, 1973 (Back calculated)
Difference
AGE
I II III IV V VI VII VIII IX
164 268 324 359 402 447 464 547 639 (33) (22) (67) (38) (23) (9) (3) (3) (1)
162 264 328 373 419 452 474 490 514 (206)(166)(105) (70) (34) (28) (16) (11) (4)
+2 +4 -4 -14 -17 -5 -10 +57 +125
11.
800
700
600
-E ,00 , , ,
E , , , , - , ,
.s= .. 400 0' C: I> ..J
- 300 0 .. ~ , ,
200
100
0 SO 100 ISO 200 250 300
Anterior Scale Radius (40x)mm
Figure 2. - Relationships between total length (mm) and anterior scale radius for walleye from the Red Cedar River, Wisconsin. (r is correlation coefficient.)
500 (7)
(5) (12)
400 (6)
- ----- (36)
E E ----- - (35) ..
300 .s::, ._ c::,, --- (61) C Cl)
..J
- 200 0 ._ ~· ---- --- -------
100
o-----+-----+--------.f------+-----+-----+-----+-----1s65 1966 1967 1968 1969 1970 1971 1972
Year Class Figure 3. - Back calculated lengths at annulus formation for 202 Red Cedar River walleye captured by electrofishing from April through June, 1973. Solid lines show growth of individual year classes and broken lines indicate lengths at successive --~ .... , .. 'li.T ... _1.,,. ___ ,a_-----"-'----- ..t-...:a.t--~- _,.._,_ __ -+' .p .. _\- ___ ,..a .e, ___ ---l- ,..,p ___ _ , __ _
I-' I\) .
13.
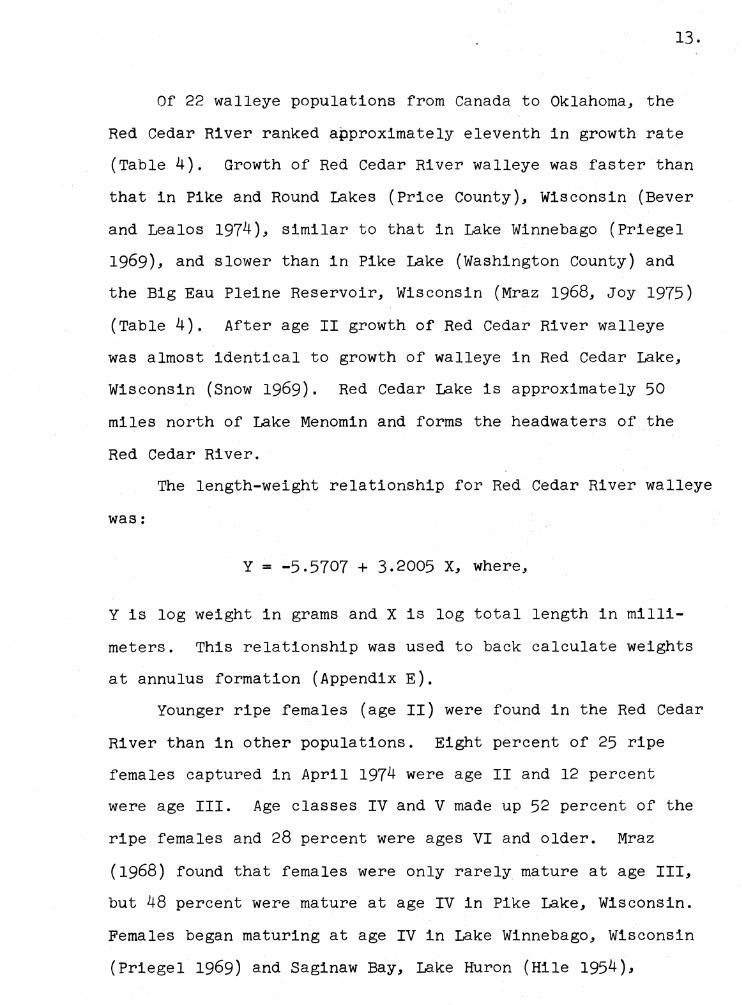
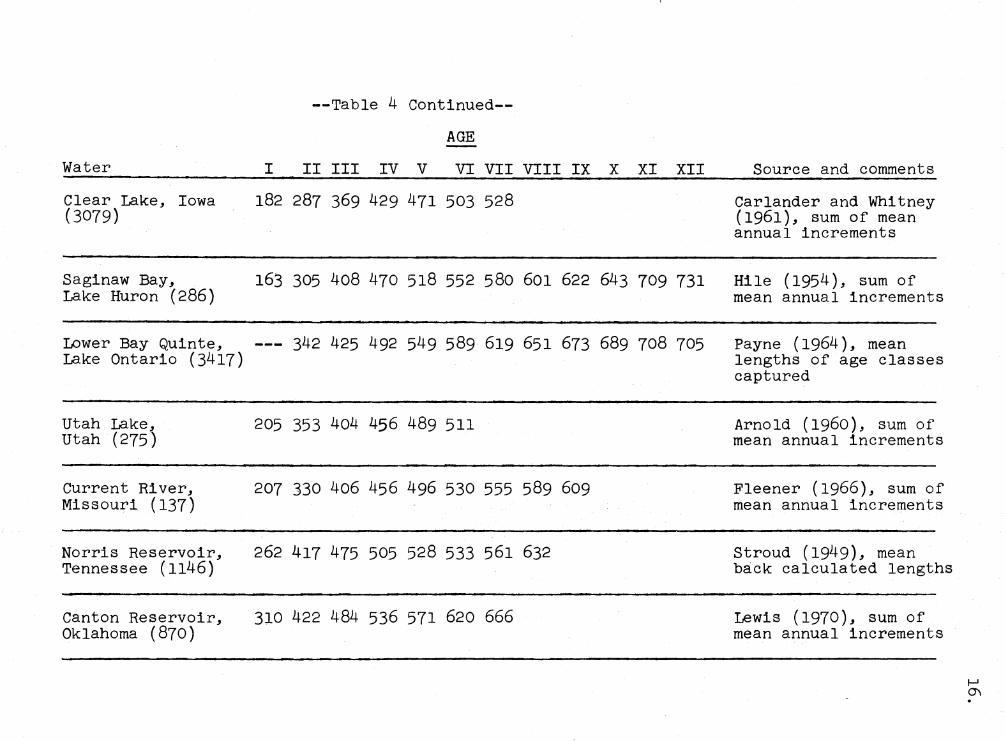
Of 22 walleye populations from Canada to Oklahoma, the
Red Cedar River ranked approximately eleventh in growth rate
(Table 4). Growth of Red Cedar River walleye was faster than
that in Pike and Round Lakes (Price County), Wisconsin (Bever
and Lealos 1974), similar to that in Lake Winnebago (Priegel
1969), and slower than in Pike Lake (Washington County) and
the Big Eau Pleine Reservoir, Wisconsin (Mraz 1968, Joy 1975)
(Table 4). After age II growth of Red Cedar River walleye
was almost identical to growth of walleye in Red Cedar Lake,
Wisconsin (Snow 1969). Red Cedar Lake is approximately 50
miles north of Lake Menomin and forms the headwaters of the
Red Cedar River.
The length-weight relationship for Red Cedar River walleye
was:
Y = -5.5707 + 3.2005 X, where,
Y is log weight in grams and Xis log total length in milli
meters. This relationship was used to back calculate weights
at annulus formation (Appendix E).
Younger ripe females (age II) were found in the Red Cedar
River than in other populations. Eight percent of 25 ripe
females captured in April 1974 were age II and 12 percent
were age III. Age classes IV and V made up 52 percent of the
ripe females and 28 percent were ages VI and older. Mraz
(1968) found that females were only rarely mature at age III,
but 48 percent were mature at age IV in Pike Lake, Wisconsin.
Females began maturing at age IV in Lake Winnebago, Wisconsin
(Priegel 1969) and Saginaw Bay, Lake Huron (Hile 1954),
Water
Red Cedar River, Wisconsin (206)
Pike and Round Lakes, Price County, Wisconsin (266)
Lake Winnebago, Wisconsin (1017)
Red Cedar Lake, Wisconsin (124)
Table 4. - Mean total length (mm) at each annulus for walleye from the Red Cedar River, Wisconsin, and 21 other populations. Numbers in parentheses indicate sample size.
AGE
I II III IV V VI VII VIII IX X XI XII
162 264 328 373 419 452 474 490 514 537 562 618
140 208 264 307 333 358 381 399 429
147 256 330 376 411 441 464 485
130 246 320 373 427 450
Source and comments
This study, sum of mean annual increments
Bever and Lealos (1974), mean back calculated lengths
Priegel (1969), sum of mean annual increments
Snow (1969), mean back calculated lengths
Pike Lake, Washing-ton County, 175 290 367 423 469 505 577 604 638 658 Mraz (1968), sum mean
annual increments Wisconsin (646)
Big Eau Pleine Reservoir, Wisconsin (321)
Three Mile Lake, Ontario
180 299 393 458 498
122 183 236 292 315 366 381 500 622
Joy (1975), sum of mean annual increments
Slastenenko (1956), mean back calculated lengths
I-' ..i::-.
Water
--Table 4 Continued-
AGE
I II III IV V VI VII VIII IX X XI XII
Red Lakes, 140 211 267 312 347 374 398 420 443 Minnesota (5152)
Oneida Lake, 157 237 303 353 387 414 434 New York (3124)
Lac la Ronge, --- 234 282 328 378 424 467 508 546 582 615 645 Saskatchewan
Lake of the Woods, 175 234 295 350 386 416 446 476 498 530 Minnesota (338)
Lake Gogebic, 117 239 307 361 401 437 457 477 495 508 Michigan (519)
Many Point Lake, 127 218 310 376 411 441 464 485 Minnesota
Leech Lake, --- --- --- 361 409 450 488 518 544 561 Minnesota
Spirit Lake, Iowa (529)
147 248 318 377 428 475 513
Source and comments
Smith and Pycha (1961), sum of mean annual increments
Forney (1965), sum of mean annual increments
Rawson (1957), mean back calculated lengths
Schupp (1974), mean back calculated lengths
Eschmeyer (1950), mean back calculated lengths
Olson (1958), mean back calculated lengths
Schupp (1972), mean back calculated lengths
Moen (1964a), sum of mean annual increments ~
V, .
Water I
--Table 4 Continued-
A~
II III IV V VI VII VIII IX X XI XII
Clear Lake, Iowa 182 287 369 429 471 503 528 (3079)
Saginaw Bay, 163 305 408 470 518 552 580 601 622 643 709 731 Lake Huron (286)
Lower Bay Quinte, --- 342 425 492 549 589 619 651 673 689 708 705 Lake Ontario (3417)
Utah Lake, 205 353 404 456 489 511 Utah (275)
Current River, 207 330 406 456 496 530 555 589 609 Missouri (137)
Norris Reservoir, 262 417 475 505 528 533 561 632 Tennessee (1146)
Canton Reservoir, 310 422 484 536 571 620 666 Oklahoma (870)
Source and comments
Carlander and Whitney (1961), sum of mean annual increments
Hile (1954), sum of mean annual increments
Payne (1964), mean lengths of age classes captured
Arnold (1960), sum of mean annual increments
Fleener (1966), sum of mean annual increments
Stroud (1949), mean back calculated lengths
Lewis (1970), sum of mean annual increments
I-' 0\ .
whereas maturity was not reached until ages VI through VIII
in Lac la Ronge, Saskatchewan (Rawson 1957), Red Lakes,
Minnesota (Smith and Pycha 1961), and Little Cut Foot Sioux
Lake, Minnesota (Johnson 1971).
17.
Of the 45 ripe males caught in April and May 1974, 17
(39 percent) were age III, 27 percent were age IV, 18 percent
age V, and 16 percent were ages VI through VIII. Males from
most other populations began maturing at age III. Exceptions
were Lake Winnebago, Wisconsin, where males matured at age II
(Priegel 1969), and Lac la Ronge, Saskatchewan, where only
50 percent were mature at age VIII (Rawson 1957).
Red Cedar River walleye spawned at approximately the
same time (late April) and water temperature (9°c) as other
populations. Peak spawning probably occurred around 20 April,
1974, when water temperature was 9°c. On 18 April, 21 ripe
walleye were caught, 15 males and 6 females (29 percent).
Of the 43 ripe walleye captured on 20 April, 29 were males and
14 (33 percent) were females, and 4 of 28 (14 percent) ripe
walleye caught on 25 April were females. Eschmeyer (1950) I
found that the maximum proportion of ripe females on the
spawning grounds coincided with the peak spawning period on
Lake Gogebic, Michigan. Spawning time and temperatures for
other walleye populations were:
18.
Spawning Water time and temperature Source
Big Eau Pleine late April to 6 - 10°c Joy (1975) Reservoir, Wisconsin early May
Lake Winnebago, late April 6 - 8°c Priegel (1970) Wisconsin
Little cut Foot 8°c Sioux Lake, late April Johnson
Minnesota (1971)
Lake Gogebic, late April to 0
8.5-9 C Eschmeyer Michigan early May ( 1950)
Bay of Quinte, 4 - 10°C Payne ( 1964) Lake Ontario
Utah Lake, late March 7 - 8°c Arnold (1960) Utah
Lac la Ronge, late April to 6 - 10°c Rawson (1957) Saskatchewan 21 May
Food Habits
Fish was the most important food item of all walleye
(Tables 5 and 6). Of 28 young-of-the year and yearlings
117-196 mm long, 46 percent contained aquatic invertebrates
and 61 percent contained fish (Table 5), which made up 84
percent of total food volume. Aquatic invertebrates found
most often in stomachs of small walleye, and their frequencies
of occurrence were Gammarus, 18 percent, Ephemeropteran nymphs,
14 percent, and adult Hydropsyche, 11 percent. These groups
made up 1, 5, and 8 percent of the total food volume, respectively
(Table 5). Cyprinids, the most common fish found in small
walleye, were in 43 percent of the stomachs and made up 54
percent of the total food volume (Table 5). Of the 35 small
walleye stomachs examined, 7 or 20 percent, were empty.
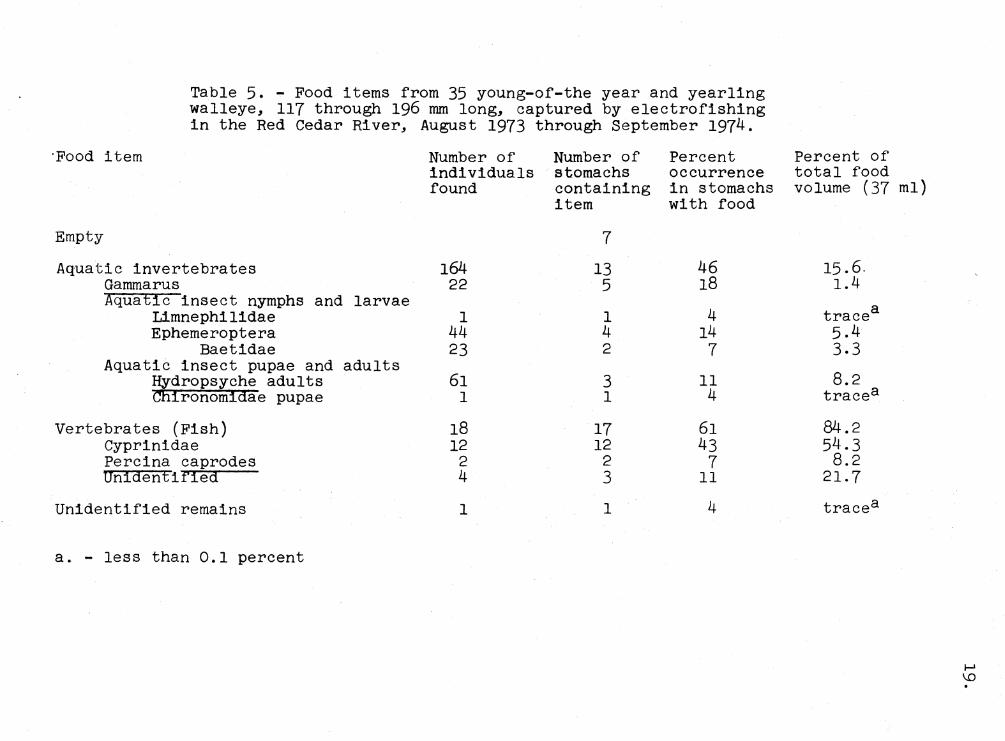
Table 5. - Food items from 35 young-of-the year and yearling walleye, 117 through 196 mm long, captured by electrofishing in the Red Cedar River, August 1973 through September 1974.
·Food item
Empty
Aquatic invertebrates Gammarus Aquatic insect nymphs and larvae
Limnephilidae Ephemeroptera
Baetidae Aquatic insect pupae and adults
Hydropsyche adults chfronomfdae pupae
Vertebrates (Fish) Cyprinidae Percina caprodes Unidentified
Unidentified remains
a. - less than 0.1 percent
Number of individuals found
164 22
1 44 23
61 1
18 12 2 4
1
Number of Percent stomachs occurrence containing in stomachs item with food
7
13 46 5 18
1 4 4 14 2 7
3 11 1 4
17 61 12 43 2 7 3 11
1 4
Percent of total food volume (37 ml)
15. 6. 1.4
tracea 5.4 3.3
8.2 tracea
84.2 54.3
8.2 21.7
tracea
f-1 \.0 .
20.
Other studies have shown that fish comprise the major
food source of small walleye. In Lake Gogebic and the Muskegon
River, Michigan, fish made up about 90 percent of the total
food volume of young-of-the year walleye, 54 to 175 mm long
(Eschmeyer 1950). Those most frequently eaten were yellow
perch in Lake Gogebic, and centrarchids in the Muskegon River.
Cladocerans and aquatic insects were next in importance.
Priegel (1970) found that young-of-the year walleye from
the Lake Winnebago region were generally plankton feeders
until they reached 75 mm in length, when they switched to fish
if present. In Oneida Lake, New York, walleye 120 to 140 mm
long changed from plankton to fish and those longer than
160 mm ate yellow perch almost exclusively (Forney 1966).
No yellow perch were identified in the stomachs of young-of
the year and yearling walleye from the Red Cedar River.
Among longer (233 to 505 mm) walleye in the Red Cedar
River, 16 of 77 (21 percent) stomachs were empty. Fish were
found in 85 percent of 61 stomachs and made up 97 percent
of the total food volume (Table 6). Five fish groups each
made up over 10 percent of the food volume. Log perch
(Percina caprodes) and yellow perch (Perea flavescens) were
found in 28 and 15 percent of the stomachs, and each made up
about 19 percent of the total food volume. White bass (Morone
chrysops) were found in only 3 percent of the walleye stomachs,
but made up 16 percent of the total food volume. Other fish
found in more than one stomach were cyprinids, trout perch
(Percopsis omiscomaycus), and black crappie (Pomoxis nigromaculatue
21.
In Lake Winnebago, Priegel (1963) found fish to comprise
over 95 percent of total food volume, and four species were
about equally abundant in the diet. Similar results were
found by Eschmeyer in Lake Gogebic, Michigan. Walleye from
many other areas ate mostly fish, but often one species pre
dominated. Yellow perch constituted 50 to 90 percent of the
summer food of walleye in Oneida Lake, New York (Forney 1965),
and were eaten almost exclusively in Maple Lake, Minnesota
(Seaburg and Moyle 1964). Other principal foods were alewife
(Alosa pseudoharengus) in the Bay of Quinte, Lake Ontario
(Payne 1964), and ciscoes (Coregonus spp) in Lac la Ronge,
Saskatchewan (Rawson 1957).
Adult ~ydropsyche, the most common aquatic invertebrate
found in Red Cedar River walleye, were in 8 percent of the
stomachs and made up about 2 percent of the total food volume.
Johnson (1969) found walleye I to III years old from Lake
Winnibigoshish, Minnesota, primarily ate Ephemeropteran nymphs
and chironomid larvae in June, and age III walleye ate almost
equal volumes of yellow perch and insects until September.
In the Muskegon River, Michigan, Ephemeropteran nymphs and
adults made up 30 percent of the total food volume
(Eschmeyer 1950).
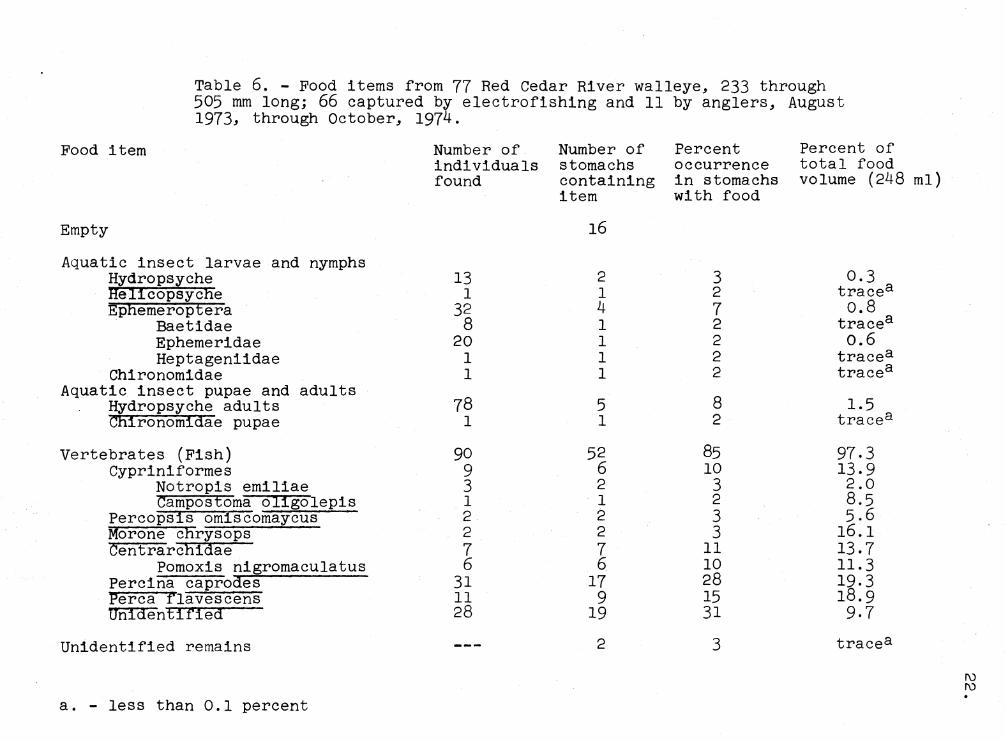
Table 6. - Food items from 77 Red Cedar River walleye, 233 through 505 mm long; 66 captured by electrofishing and 11 by anglers, August 1973, through October, 1974.
Food item
Empty
Aquatic insect larvae and nymphs Hydro psyche He!lcopsyche Ephemeroptera
Baetidae Ephemeridae Heptageniidae
Chironomidae Aquatic insect pupae and adults
Hydropsyche adults Chironomidae pupae
Vertebrates (Fish) Cypriniformes
Notropis emiliae Campostoma oligolepis
Percops1s omiscomaycus Morone chrysops Centrarchidae
Pomoxis nigromaculatus Percina caprodes Perea flavescens Unidentified
Unidentified remains
a. - less than 0.1 percent
Number of Number of individuals stomachs found containing
item
16
13 2 1 1
32 4 8 1
20 1 1 1 1 1
78 5 1 1
90 52 9 6 3 2 1 1 2 2 2 2 7 7 6 6
31 17 11 9 28 19
2
Percent Percent of occurrence total food in stomachs volume (248 ml) with food
3 0.3 2 tracea 7 o.8 2 tracea 2 o.6 2 tracea 2 tracea
8 1.5 2 tracea
85 97-3 10 13.9 3 2.0 2 8.5 3 5.6 3 16.1
11 13.7 10 11.3 28 19.3 15 18.9 31 9-7
3 tracea
f\) f\) .
23.
Mortality Rates
Exploitation Rate. - The mean of three estimates of annual
exploitation rate was 31 percent for walleye 250 mm long
and longer. Of the 476 fish tagged in 1973, 270 were tagged
before the opening of the fishing season on 12 May, and of
these, anglers returned 42 tags while 6 were recovered on the
creel survey. Two recaptured walleye, which had lost tags,
were recorded on the creel survey. Since it was not known
when the fish were tagged, they were not used in calculation
of exploitation rate. The 48 returns were used to calculate
the 1973 exploitation rate, but the data were first corrected
for nonresponse (failure of some anglers to return tags) and
tag loss that occurred throughout the year. Rawstron (1971,
1972), found that California anglers did not return an average
of 34 percent of tagged largemouth bass caught in Merle Collins
Reservoir and 38 percent in Folsom Lake. Data from Moen
(1964b) indicated 47 percent nonresponse for walleye in Spirit
Lake, Iowa, and Stroud and Bitzer (1955) estimated mean non
response of 25 percent for chain pickerel (Esox niger) from
several Massachusetts lakes. I used the mean value of these
estimates, 36 percent nonresponse. Tag loss, determined by
examining recaptured fish from the 476 tagged in 1973, could
be recognized by the left pelvic fin clip. It was often possible
to determine which kind of tag was lost by the scar left on
the fish, and sometimes the polyethylene line used to attach
the Swedish smolt tag remained in the fish.
24.
None of 62 walleye recaptured during the tagging operations
and of 6 recaptured in the creel survey through 25 June had
lost tags. Anglers returned 34 tags during this period, and
they were corrected for nonresponse yielding a total of 53
returns. This total (53) was added to the 6 recaptures seen
on the creel survey through 25 June yielding an estimate of
59 recaptured walleye for that period.
Tag loss first appeared during the period 26 June through
July, 1973. One of three or 33 percent of walleye seen in
the creel survey had lost its tag. Three tags were turned in
by anglers during this period and were corrected for 36 percent
nonresponse and 33 percent tag loss yielding an estimate of
7 returns for the period.
Further tag loss occurred during August, September, and
October, 1973, when 45 walleye were recaptured, 44 by electro
fishing and 1 (tagged after 12 May) was seen during the creel
survey. Of this total, 24 or 53 percent had lost tags. Five
tags were returned by anglers and were corrected for nonresponse
and 53 percent tag loss yielding an estimate of 17 recaptured
fish for the period August through October.
One tagged walleye, reported by an angler during the
winter fishery, was not seen, and therefore was not included
in calculating exploitation rate. The corrected estimated
number of tagged walleye captured by anglers from 12 May,
1973, through February, 1974, then was 83 of 270 tagged, yielding
an estimated exploitation rate of 31 percent for walleye
250 mm and longer (Table 7).
25.
Although walleye lost more streamer than Swedish smolt
tags in 1973, the difference was not significant (chi-square=
0.748, p> 0.25, ldf). Fifteen of 26 (58 percent) walleye
tagged with streamer tags and recaptured by electrofishing
had lost tags as opposed to 8 of 18 (44 percent) tagged with
Swedish smolt tags. Anglers recaptured 26 of 100 walleye
tagged with Swedish smolt tags, and 22 of 170 (13 percent)
with streamer tags. This tag loss was higher than in the
Big Eau Pleine Reservoir, Wisconsin, where Joy (1975) found
no evidence that walleye lost either Swedish smolt or streamer
tags. The reason for high tag loss in this study, which also
occurred on smallmouth bass tagged in the Red Cedar River
(Paragamian 1973), is unknown.
Exploitation rate for 1974 was calculated in the same
manner as 1973. Two rates were calculated, one from the 404
walleye tagged only in Area B, and one from the 437 tagged
in Areas Band C. Tag loss in 1974 could easily be distin
guished from that which occurred in 1973 by the length of
regeneration of the fin clip.
Tag loss was not seen during the period 4 May through
July, 1974, when anglers returned 39 and 40 tags from the 404
and 437 tagged walleye, respectively. These values were
corrected for 36 percent nonresponse and added to the 7 tagged
walleye seen on the creel survey, yielding estimates of 68 and
69 returns for the period.
During August through November 1974, 6 tagged walleye
were recovered on the creel survey and 3 had lost tags.
26.
An additional 3 tagged walleye were captured by electrofishing
in the fall, resulting in an estimated tag loss of 33 percent
(3 of 9 recaptures). Twenty-four and 25 tags, from the 404
and 437 tagged walleye, were returned by anglers during this
period and were corrected for nonresponse and 33 percent tag
loss and added to the 6 recaptures seen on the creel survey
yielding estimates of 63 and 64 returns for the period.
Estimates of number recaptured from 4 May through November,
1974, then were 131 of 404 walleye tagged in Area B, and 133
of 437 tagged in Areas Band C, which yielded corrected
estimated exploitation rates of 32 and 30 percent, respectively
(Table 7).
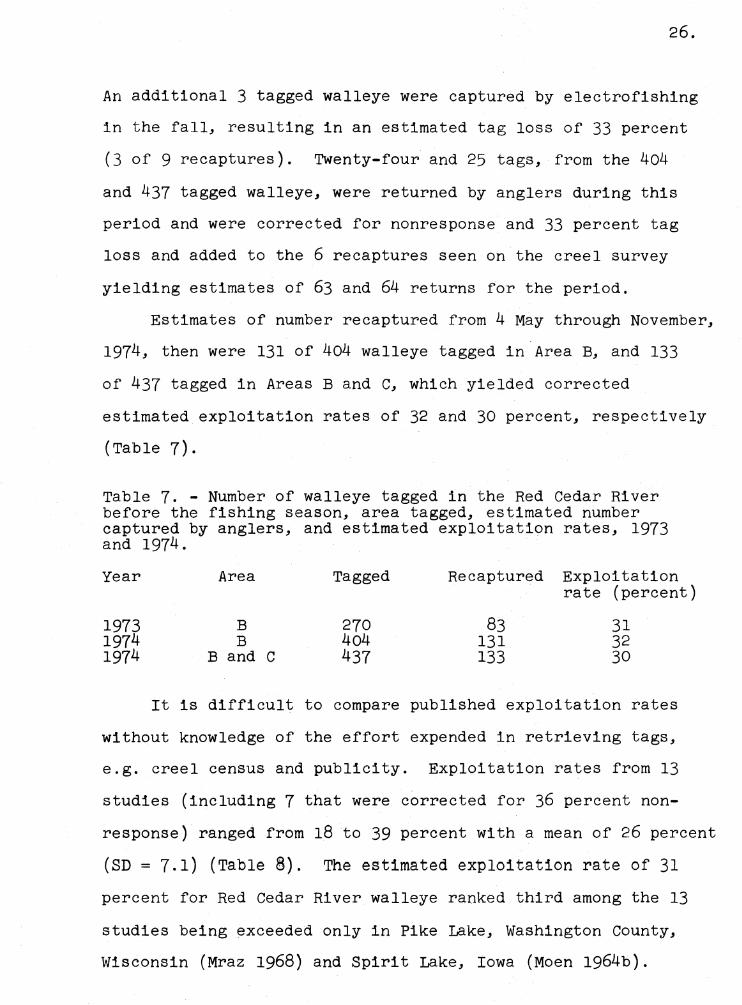
Table 7. - Number of walleye tagged in the Red Cedar River before the fishing season, area tagged, estimated number captured by anglers, and estimated exploitation rates, 1973 and 1974.
Year
1973 1974 1974
Area
B B
Band C
Tagged
270 4~ 437
Recaptured Exploitation rate (percent)
83 31 131 32 133 30
It is difficult to compare published exploitation rates
without knowledge of the effort expended in retrieving tags,
e.g. creel census and publicity. Exploitation rates from 13
studies (including 7 that were corrected for 36 percent non
response) ranged from 18 to 39 percent with a mean of 26 percent
(SD= 7.1) (Table 8). The estimated exploitation rate of 31
percent for Red Cedar River walleye ranked third among the 13
studies being exceeded only in Pike Lake, Washington County,
Wisconsin (Mraz 1968) and Spirit Lake, Iowa (Moen 1964b).
27.
I found no correlation in the 13 studies between exploitation
rate and size of the body of water (r = -0.01), and in six
studies where a creel survey was conducted and fishing pressure
and exploitation was estimated (Tables 8 and 9), I found
no correlation between fishing pressure and exploitation
(r = 0.39).
Data from this and other studies indicate that walleye
exploitation may be related to their food source. Forney
(1967), by dividing the estimated harvest by the population
estimate at the beginning of the season, estimated walleye
exploitation rates between 10 and 47 percent (mean of 24
percent) over a three year period in Oneida Lake, New York.
Forney found an inverse relationship between the abundance of
young-of-the year yellow perch, the main food item of walleye
in Oneida Lake, and fishing success. Years of low young-of
the year perch abundance resulted in high walleye exploitation
rates. The rather diverse food habits (Tables 5 and 6) of
Red Cedar River walleye (indicating they do not rely upon
one specific food source) may be one of the reasons for the
apparently stable exploitation rate (Table 7).
Anglers appeared to select larger tagged walleye in
the Red Cedar River in 1973 but not in 1974. Of the 476
walleye tagged in 1973, 36 percent were 250-299 mm long,
27 percent were 300-349 mm, and 37 percent were 350 mm or
longer, and 7, 21, and 19 percent were returned from the three
length groups, respectively. The differences among the length
groups were significant (chi-square= 16.224, p<.0.01, 2df).
The difference between the two larger length groups was not
significant (chi-square= 0.176, p:::>0.50, ldf). In 1974,
anglers returned 17 percent of 65 walleye tagged at lengths
28.
of 250-299 mm, 14 percent of 126 tagged walleye of 300-349 mm,
and 19 percent of 213 walleye that were 350 mm or longer
(chi-square= 1.130, p;>0.10, ldf). Moen (1964b) found no
difference in the rate of returns of walleye of various sizes
in Spirit Lake, Iowa, but the smallest walleye tagged was
305 mm long. Also, Mraz (1968) found no difference in sizes
returned from walleye 280 mm and longer in Pike Lake, Wisconsin.
Total Annual Mortality and Natural Mortality Rates. - The
mean of three estimates of total annual mortality rate for
Red Cedar River walleye was 50 percent. Estimates from catch
curves (Ricker 1958:44) were 51 percent for ages III through
IX from the 200 fish aged from the electrofishing catch in
1974, and 49 percent for ages III through VIII from 174 of
the walleye recorded in the creel survey in 1974 (Figure 4
and Appendix F). A third estimate of 50 percent was obtained
from recapture of marked fish and this formula (Ricker 1958:128):
R12 M2 sl =
M1 (R22 + 1) J
where, Sl is survival rate of fish marked in year l; R12 is
number of fish marked in year 1 and recaptured in year 2· , M1 is number of fish marked in year l; M2 is number of fish
marked in year 2; and R22 is number of fish marked in year 2
and recaptured during that year.
.... 0
... Q)
..0 E ::, z OI 0 --'
2
■ !lectrofl1hlnt cotoll 1174
•51'4 ,. --••·
•
o..._ ___________________________ _
II Ill IV V VI
Age VII VIII IX X
29.
Figure 4. - Red Cedar River catch curves from the 1974 anglers' catch (sample size= 174) and electrofishing catch (sample size= 200) (Appendix F).
30.
Fourteen walleye tagged in 1973 were recaptured by electro
fishing in 1974, and 6 had lost their tags. A total of 16
walleye tagged in 1973 were recovered in the creel survey in
1974 and 15 had lost their tags. Therefore, 21 of 30, or an
estimated 70 percent of the fish tagged in 1973 had lost their
tags in or before 1974. Anglers returned 11 tags in 1974
from walleye tagged in 1973 and these were corrected for 36
percent nonresponse and 70 percent tag loss yielding an
estimate of 57 returns. This total (57) was added to the 16
recaptures seen on the creel survey giving a total of 73.
Therefore, an estimated 73 of 476 walleye tagged in 1973 were
recaptured by anglers during 1974. These values were fitted
into the equation along with the estimated 133 recaptures of
437 walleye tagged in 1974, yielding an estimated survival
and mortality rate for 1973 tagged fish of 50 percent. Since
the minimum size tagged (250 mm) included almost all age II
walleye, the estimate is for walleye ages II and older. The
variance (Ricker 1958:128) of the estimate was 0.01.
The estimated total annual mortality rate of 50 percent
is probably accurate because three estimates (one based on
recapture of marked fish and two from age composition data)
varied only 2 percent. Moreover, the estimates of 51 and 49
percent from catch curves were derived from walleye caught by
two different gears (electrofishing and angling) at different
times of the year; the electrofishing sample was taken before
the 1974 fishing season and angling sample was taken through-
out the open water fishing season in 1974. Catch curves
31.
constructed from age composition data from catches in a single
year may be biased by fluctuations in year class strength.
However, the high correlation coefficients (r = -0.988 and
-0.994, Figure 4) indicated that there was little variation
in year class strength in this population in recent years.
The method of calculating mortality rate from the formula is
based on the assumption that rate of fishing is constant from
year to year, and it is substantiated by the similar estimated
exploitation rates for the two years (Table 7).
I also constructed a catch curve from the 1973 electro
fishing sample taken in spring and calculated a total annual
mortality rate of 36 percent. Since this estimate was consid
erably lower than the other three and the correlation coeffic
ient (r = -0.913) was smaller, it was disregarded.
A fourth estimate of exploitation was derived from
recaptures of the 476 walleye tagged in 1973 and the estimated
annual mortality rate. If 50 percent of the tagged fish died
during 1973, 238 were extant at the beginning of the 1974
season. Of this total, an estimated 73 were caught by anglers,
resulting in an estimated exploitation rate of 31 percent.
Corrections for tag loss and nonresponse probably were
reasonably accurate. Paragamian (1973), using these corrections,
calculated an exploitation rate of 29 percent for smallmouth
bass in the Red Cedar River, and by comparing the estimated
harvest (from a creel survey) to the estimated standing stock,
obtained a similar estimate of 34 percent. Also, if these
corrections had not been used in the survival formula of
Ricker (1958), a mortality rate of 68 percent (instead of
50 percent) would have been calculated.
32.
The exploitation (31 percent) and the total annual mortality
(50 percent) rates along with an exponential table were used
in formulae of Ricker (1958:25) to calculate instantaneous
mortality rates and annual expectation of death by natural
causes:
Z F --= a u
Z = M + F
a = U + V
where Z, the total instantaneous mortality rate, was 0.693;
F, the instantaneous rate of fishing mortality, was 0.430;
a, the total annual mortality rate, was 50 percent; u, the
exploitation rate was 31 percent; M, the instantaneous natural
mortality rate, was 0.263; and v, the annual expectation of
death by natural causes, was 19 percent.
The total annual mortality rate of 50 percent for Red
Cedar River walleye fell within a wide range for walleye
populations (Table 8). Such rates in 17 studies ranged from
28 to 65 percent with a mean of 50 percent (SD= 12.6).
I found no correlation in these studies between size of water
and total mortality rate (r = 0.17).
33.
In most walleye populations, fishing mortality appeared
to be the major component of total mortality (Table 8).
In 6 of 10 studies, exploitation made up a mean of 68 percent
of total mortality. In Oneida Lake, New York, and Many Point
Lake, Minnesota, exploitation accounted for over 85 percent
of the total annual mortality (Forney 1967, Olson 1958).
Exploitation made up 50 percent of the total mortality in
Lake Winnebago, Wisconsin (Priegel 1968, 1969), and about
40 percent in the Big Eau Pleine Reservoir, Wisconsin, Lake
Winnibigoshish, Minnesota, and Clear Lake, Iowa (Joy 1975,
Johnson and Johnson 1971, Whitney· 1958).
Summer Creel Survey and Fishing Pressure
In the creel survey period 12 May through November, 1973,
637 anglers were interviewed in Area B (12.5 ha), 438 on
weekends and holidays and 199 on weekdays. They fished 1403
hours and creeled 49 walleye on weekends and holidays, and
44 on weekdays. In 1974, 686 anglers were interviewed from
4 May through November, 399 on weekends and holidays and
287 on weekdays. They fished 1408 hours and creeled 58 walleye
in Area B, 41 on weekends and holidays and 17 on weekdays.
These data were expanded to an estimate of total fishing
pressure of 3412 hours or 273 hrs/ha in 1973 and 3478 hours
or 278 hrs/ha in 1974 (Appendices G and H). (Harvest data
will be given in the next section.)
34.
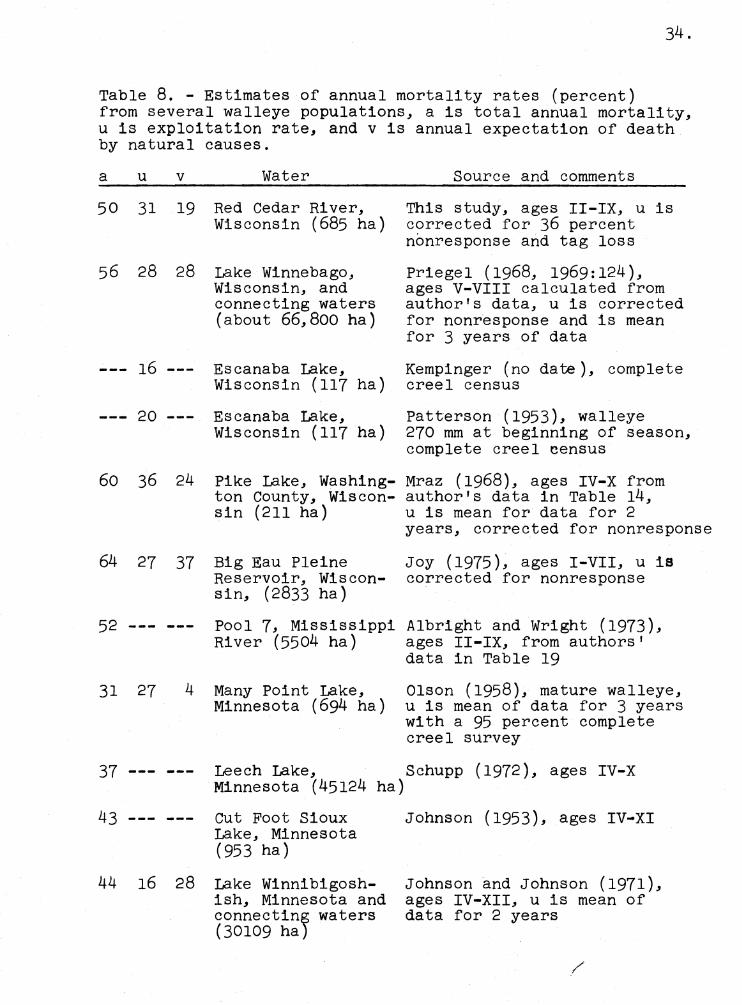
Table 8. - Estimates of annual mortality rates (percent) from several walleye populations, a is total annual mortality, u is exploitation rate, and vis annual expectation of death by natural causes.
a u v Water
50 31 19 Red Cedar River, Wisconsin (685 ha)
56 28 28 Lake Winnebago, Wisconsin, and connecting waters (about 66,800 ha)
16 Escanaba Lake, Wisconsin (117 ha)
--- 20 --- Escanaba Lake, Wisconsin (117 ha)
60 36
64 27
24
37
Pike Lake, Washington County, Wisconsin (211 ha)
Big Eau Pleine Reservoir, Wisconsin, (2833 ha)
Source and comments
This study, ages II-IX, u is corrected for 36 percent nonresponse and tag loss
Priegel (1968, 1969:124), ages V-VIII calculated from author's data, u is corrected for nonresponse and is mean for 3 years of data
Kempinger (no date), complete creel census
Patterson (1953), walleye 270 mm at beginning of season, complete creel eensus
Mraz (1968), ages IV-X from author's data in Table 14, u is mean for data for 2 years, corrected for nonresponse
Joy (1975), ages I-VII, u is corrected for nonresponse
52 --- --- Pool 7, Mississippi Albright and Wright (1973), River (5504 ha) ages II-IX, from authors'
data in Table 19
31 27 4 Many Point Lake, Minnesota (694 ha)
Olson (1958), mature walleye, u is mean of data for 3 years with a 95 percent complete creel survey
37 --- --- Leech Lake, Schupp (1972), ages IV-X Minnesota (45124 ha)
43 --- --- cut Foot Sioux Lake, Minnesota (953 ha)
44 28 Lake Winnibigoshish, Minnesota and connectin~ waters (30109 ha)
Johnson (1953), ages IV~XI
Johnson and Johnson (1971), ages IV-XII, u is mean of data for 2 years
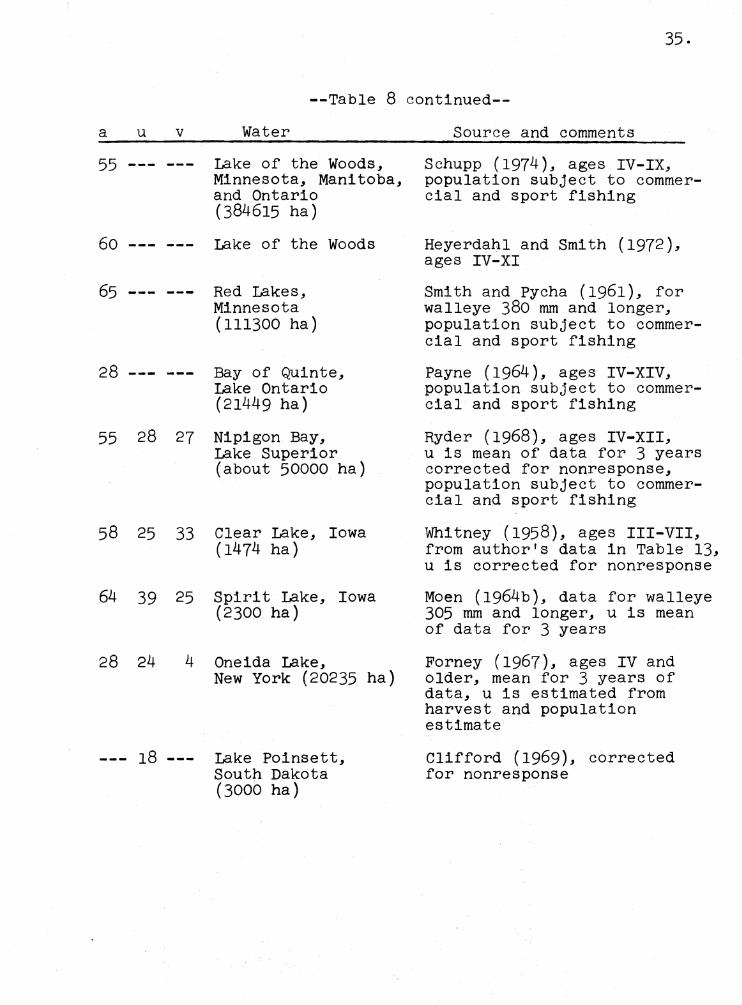
35.
--Table 8 continued--
a u V Water
55 Lake of the Woods, Minnesota, Manitoba, and Ontario (384615 ha)
60 --- --- Lake of the Woods
65 --- --- Red Lakes, Minnesota (111300 ha)
28 --- --- Bay of Quinte, Lake Ontario (21449 ha)
55 28 27 Nipigon Bay, Lake Superior (about 50000 ha)
58 25 33 Clear Lake, Iowa (1474 ha)
64 39 25 Spirit Lake, (2300 ha)
Iowa
28 24 4 Oneida Lake, New York (20235 ha)
--- 18 --- Lake Poinsett, South Dakota (3000 ha)
Source and comments
Schupp (1974), ages IV-IX, population subject to commercial and sport fishing
Heyerdahl and Smith (1972), ages IV-XI
Smith and Pycha (1961), for walleye 380 mm and longer, population subject to commercial and sport fishing
Payne (1964), ages IV-XIV, population subject to commercial and sport fishing
Ryder (1968), ages IV-XII, u is mean of data for 3 years corrected for nonresponse, population subject to commercial and sport fishing
Whitney (1958), ages III-VII, from author's data in Table 13, u is corrected for nonresponse
Moen (1964b), data for walleye 305 mm and longer, u is mean of data for 3 years
Forney (1967), ages IV and older, mean for 3 years of data, u is estimated from harvest and population estimate
Clifford (1969), corrected for nonresponse
36.
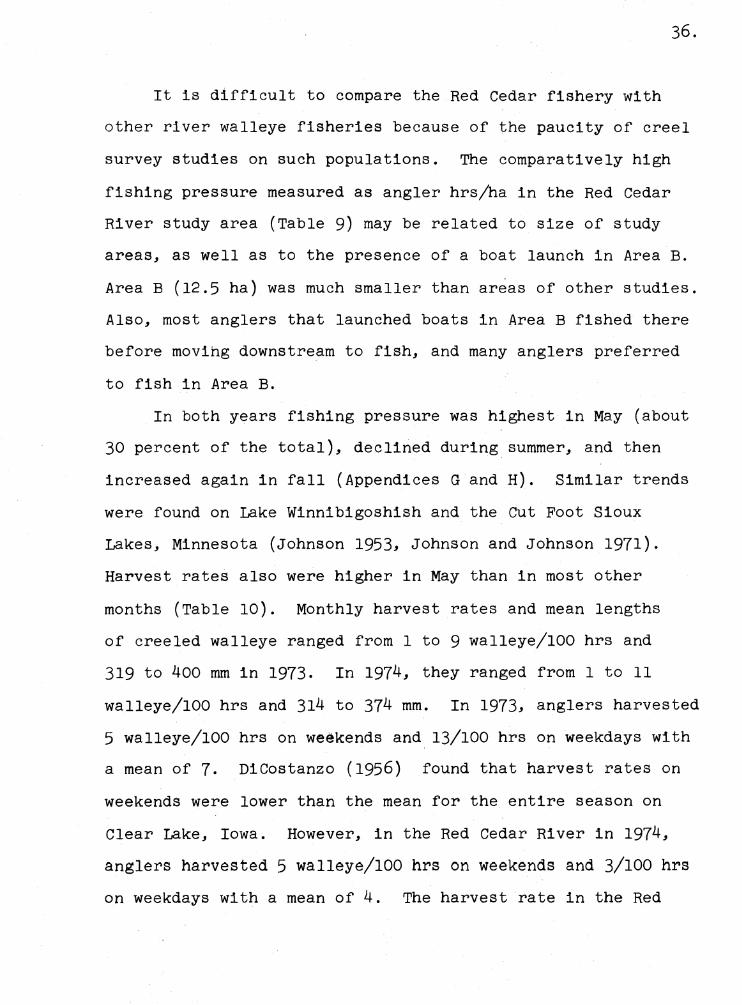
It is difficult to compare the Red Cedar fishery with
other river walleye fisheries because of the paucity of creel
survey studies on such populations. The comparatively high
fishing pressure measured as angler hrs/ha in the Red Cedar
River study area (Table 9) may be related to size of study
areas, as well as to the presence of a boat launch in Area B.
Area B (12.5 ha) was much smaller than areas of other studies.
Also, most anglers that launched boats in Area B fished there
before movihg downstream to fish, and many anglers preferred
to fish in Area B.
In both years fishing pressure was highest in May (about
30 percent of the total), declined during summer, and then
increased again in fall (Appendices G and H). Similar trends
were found on Lake Winnibigoshish and the Cut Foot Sioux
Lakes, Minnesota (Johnson 1953, Johnson and Johnson 1971).
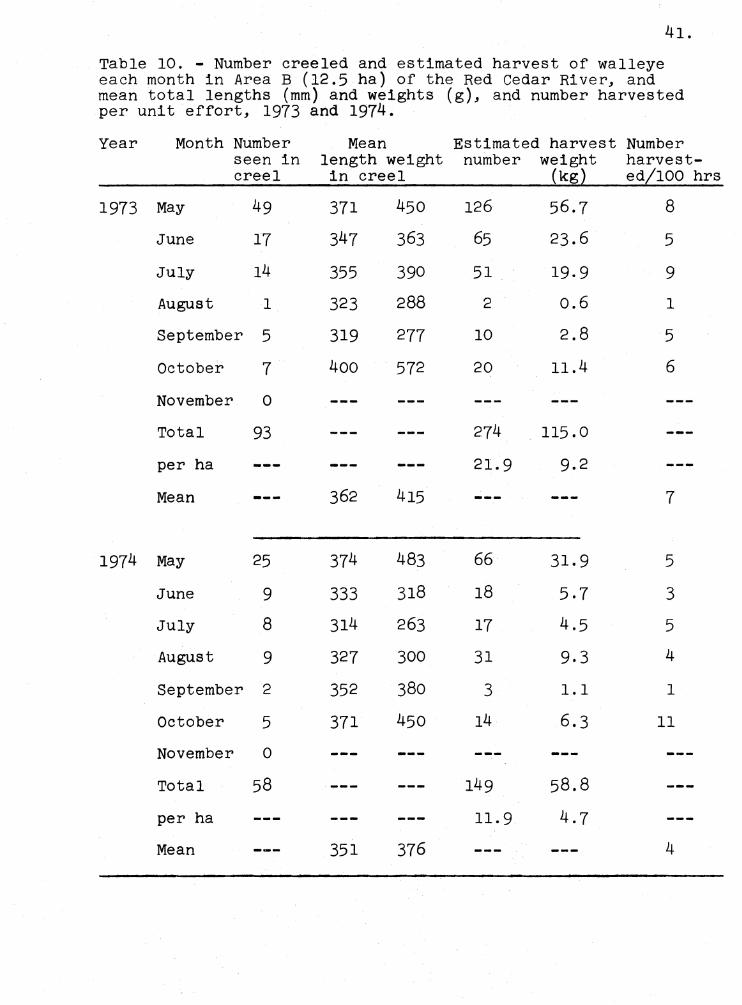
Harvest rates also were higher in May than in most other
months (Table 10). Monthly harvest rates and mean lengths
of creeled walleye ranged from 1 to 9 walleye/100 hrs and
319 to 400 mm in 1973. In 1974, they ranged from 1 to 11
walleye/100 hrs and 314 to 374 mm. In 1973, anglers harvested
5 walleye/100 hrs on weekends and 13/100 hrs on weekdays with
a mean of 7. Dicostanzo (1956) found that harvest rates on
weekends were lower than the mean for the entire season on
Clear Lake, Iowa. However, in the Red Cedar River in 1974,
anglers harvested 5 walleye/100 hrs on weekends and 3/100 hrs
on weekdays with a mean of 4. The harvest rate in the Red
37.
Cedar River, of 4 to 7 walleye/100 hrs, was similar to that in
pools of the Mississippi River, and generally lower than in
lakes (Table 9).
Local anglers fished the Red Cedar River; 64 percent of
those interviewed lived within 10 miles of the study area,
24 percent came from 11 to 50 miles, 7 percent from 51 to
150 miles, and 5 percent travelled more than 150 miles.
The mean number in a fishing party was 1.93 in 1973 and 1.87
in 1974. The mean length of a fishing trip was 2.20 and 2.05
hours for the two years, respectively. In Area B, 43 percent
of the anglers fished from boats and creeled 49 percent of
the walleye, 54 percent fished from shore and caught 38 percent;
and 3 percent waded and landed 13 percent. Boat fishermen
also were more successful than bank fishermen on the Mississippi
River (Nord 1964). Of the interviewed anglers, 33 percent
used artificial bait; 23 percent used worms; 13 percent, minnows;
and 31 percent used combinations of the above or other miscel
laneous baits. They creeled 31, 18, 21, and 30 percent of the
walleye, respectively. Fishermen using artificial bait caught
more walleye than those using natural baits in the Mississippi
River (Nord 1964). Artificial baits used most often on the
Red Cedar River were minnow like lures, spinners, and jigs.
Other baits were usually jig and minnow combinations.
Water
Red Cedar River, Wisconsin Area B . ( 12 . 5 ha)
Tailwaters, Pool 7, Mississippi River
Pool 4, Mississippi River (15702 ha~
Pool 5, Mississippi River (5099 ha}
Pool 7, Mississippi River (5504 ha}
Pool 11, Mississippi River (8539 ha}
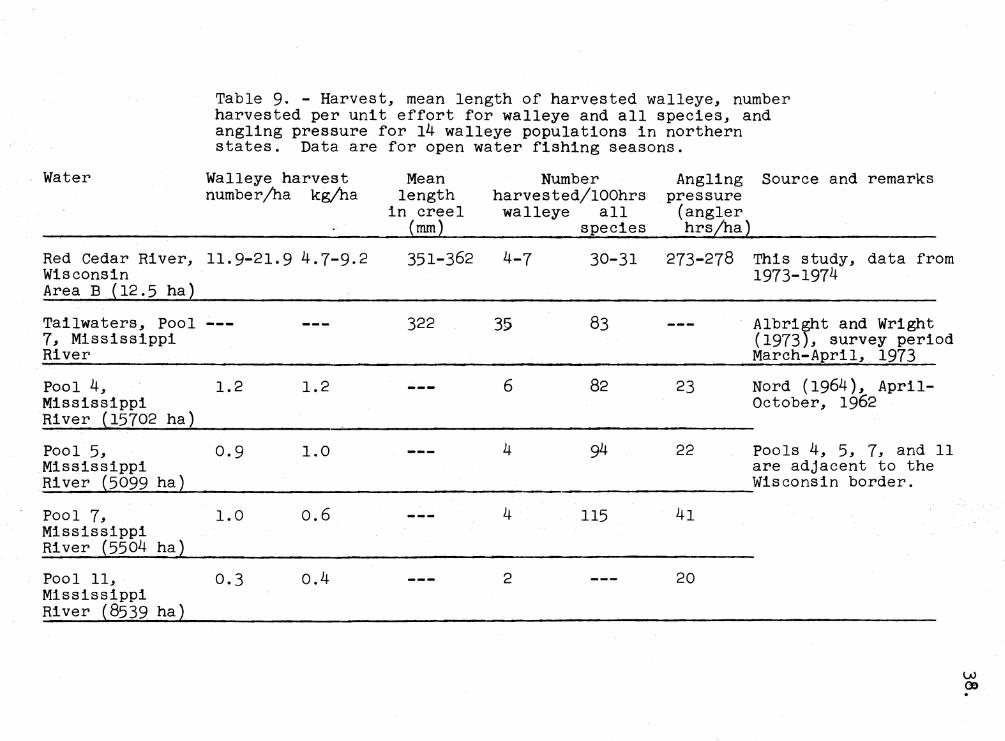
Table 9- - Harvest, mean length of harvested walleye, number harvested per unit effort for walleye and all species, and angling pressure for 14 walleye populations in northern states. Data are for open water fishing seasons.
Walleye harvest Mean Number Angling Source and remarks number/ha kg/ha length harvested/lOOhrs pressure
in creel walleye all (angler (mm} species hrs/ha~
11.9-21.9 4.7-9.2 351-362 4-7 30-31 273-278 This study, data from 1973-1974
322 35 83 Albright and Wright ( 1973), survey period March-April, 1973
1.2 1.2 6 82 23 Nord (1964), April-October, 1962
0.9 1.0 4 94 22 Pools 4, 5, 7, and 11 are adjacent to the Wisconsin border.
1.0 o.6 4 115 41
0.3 o.4 2 20
w 00 .
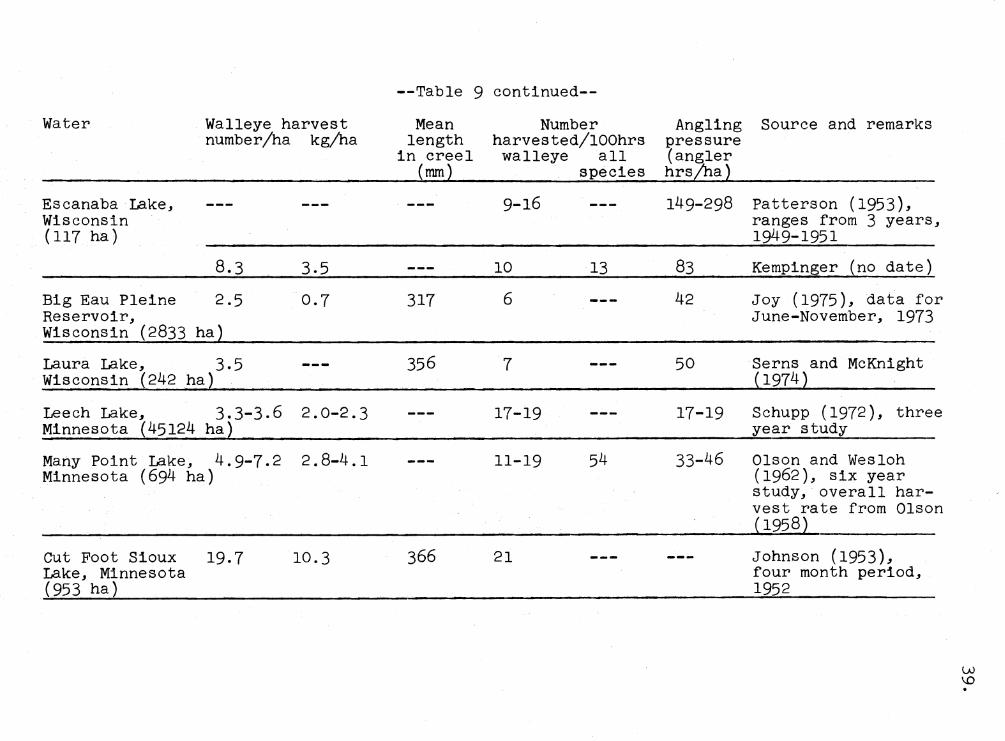
--Table 9 continued--
Water Walleye harvest Mean Number number/ha kg/ha length harvested/lOOhrs
in creel walleye all (mm} species
Escanaba Lake, 9-16 Wisconsin (117 ha)
8.3 3.5 10 13
Big Eau Pleine 2.5 0.7 317 6 Reservoir, Wisconsin (2833 ha}
Laura Lake, 3.5 356 7 Wisconsin (242 ha}
Leech Lake, 3.3-3,6 2.0-2.3 17-19 Minnesota (45124 ha}
Many Point Lake, 4.9-7,2 2.8-4.1 11-19 54 Minnesota (694 ha)
Cut Foot Sioux 19,7 10.3 366 21 Lake, Minnesota (953 ha)
Angling pressure (angler hrs/ha}
149-298
83
42
50
17-19
33-46
Source and remarks
Patterson (1953), ranges from 3 years, 1949-1951
Kempinger {no date)
Joy (1975), data for June-November, 1973
Serns and McKnight {1974}
Schupp (1972), three year study
Olson and Wesloh ( 1962), six year study, overall har-vest rate from Olson
1958
Johnson ( 1953), four month period, 1952
w \0 .

Water Walleye harvest number/ha kg/ha
Cut Foot Sioux 17.6-30.5 9.3-16.9 and Little Cut Foot Sioux Lakes, Minnesota (1853 ha)
Lake Winnibigo- 1.8-2.8 1.2-1.7 shish, Minnesota (28256 ha)
Lake of the 0.6-0.9 0.3-0.5 Woods, Minnesota, Manitoba, and Ontario (384615 ha)
Splithand Lake, Minnesota (575 ha)
5.8-6.6 2.7-3.0
--Table 9 continued--
Mean Number length harvested/lOOhrs
in creel walleye all (mm) species
20-31
381-406 19-26
42-68
19 40-45
Angling pressure (Angler hrs/ha)
98-107
9-12
1-2
30-35
Source and remarks
Johnson and Johnson (1971), two year study
Schupp (1974), three year study on the sport fishery, data from Minnesota anglers
Micklus and Clementson (1960), two year study
41.
Table 10. - Number creeled and estimated harvest of walleye each month in Area B (12.5 ha) of the Red Cedar River, and mean total lengths (mm) and weights (g), and number harvested per unit effort, 1973 and 1974.
Year Month Number Mean Estimated harvest Number seen in length weight number weight harvest-creel in creel (kg} ed/100 hrs
1973 May 49 371 450 126 56,7 8
June 17 347 363 65 23.6 5
July 14 355 390 51 19,9 9
August 1 323 288 2 o.6 1
September 5 319 277 10 2.8 5
October 7 400 572 20 11.4 6
November 0
Total 93 274 115.0
per ha 21.9 9.2
Mean 362 415 7
1974 May 25 374 483 66 31.9 5
June 9 333 318 18 5,7 3
July 8 314 263 17 4.5 5
August 9 327 300 31 9,3 4
September 2 352 380 3 1.1 1
October 5 371 450 14 6.3 11
November 0
Total 58 149 58.8
per ha 11.9 4.7
Mean 351 376 4
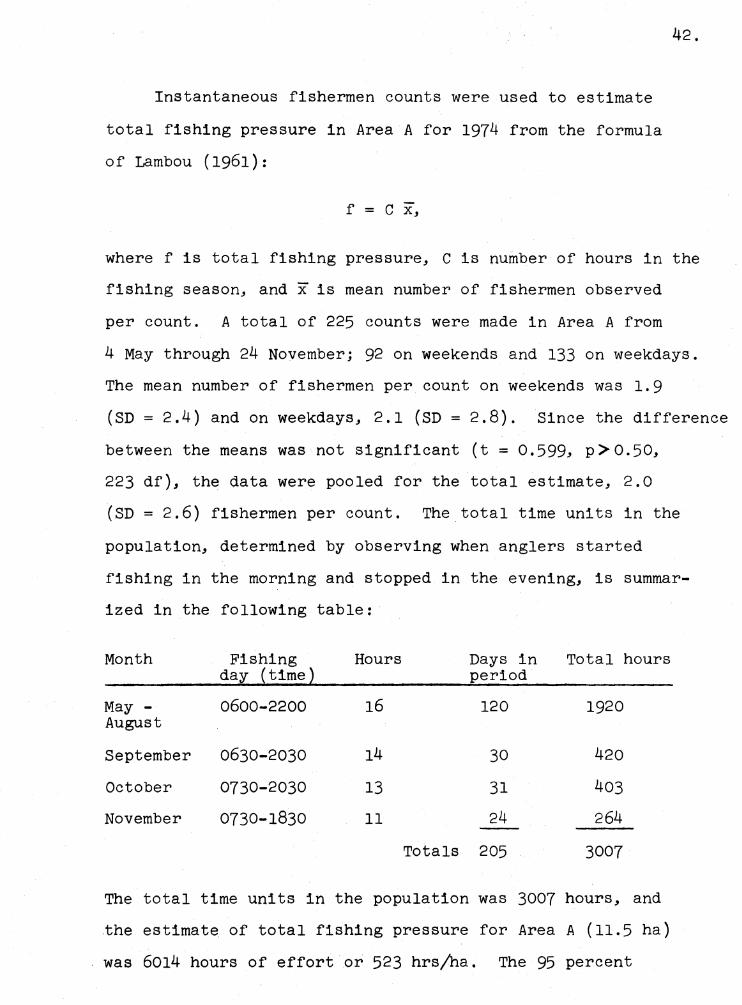
Instantaneous fishermen counts were used to estimate
total fishing pressure in Area A for 1974 from the formula
of Lambou (1961):
f = C x,
42.
where f is total fishing pressure, C is number of hours in the
fishing season, and xis mean number of fishermen observed
per count. A total of 225 counts were made in Area A from
4 May through 24 November; 92 on weekends and 133 on weekdays.
The mean number of fishermen per count on weekends was 1.9
(SD= 2.4) and on weekdays, 2.1 (SD= 2.8). Since the difference
between the means was not significant ( t = 0. 599, p > 0. 50,
223 df), the data were pooled for the total estimate, 2.0
(SD= 2.6) fishermen per count. The total time units in the
population, determined by observing when anglers started
fishing in the morning and stopped in the evening, is summar
ized in the following table:
Month Fishing Hours Days in Total hours day {time} period
May - 0600-2200 16 120 1920 August
September 0630-2030 14 30 420
October 0730-2030 13 31 403
November 0730-1830 11 24 264
Totals 205 3007
The total time units in the population was 3007 hours, and
the estimate of total fishing pressure for Area A ( 11.5 ha)
was 6014 hours of effort or 523 hrs/ha. The 95 percent
confidence interval for the mean number of fishermen-per count ... Nif:
was 1.7 to 2.4, and for fishing pressure, 5112 to 7217 hours or
444 to 628 hrs/ha (Lambou 1961).
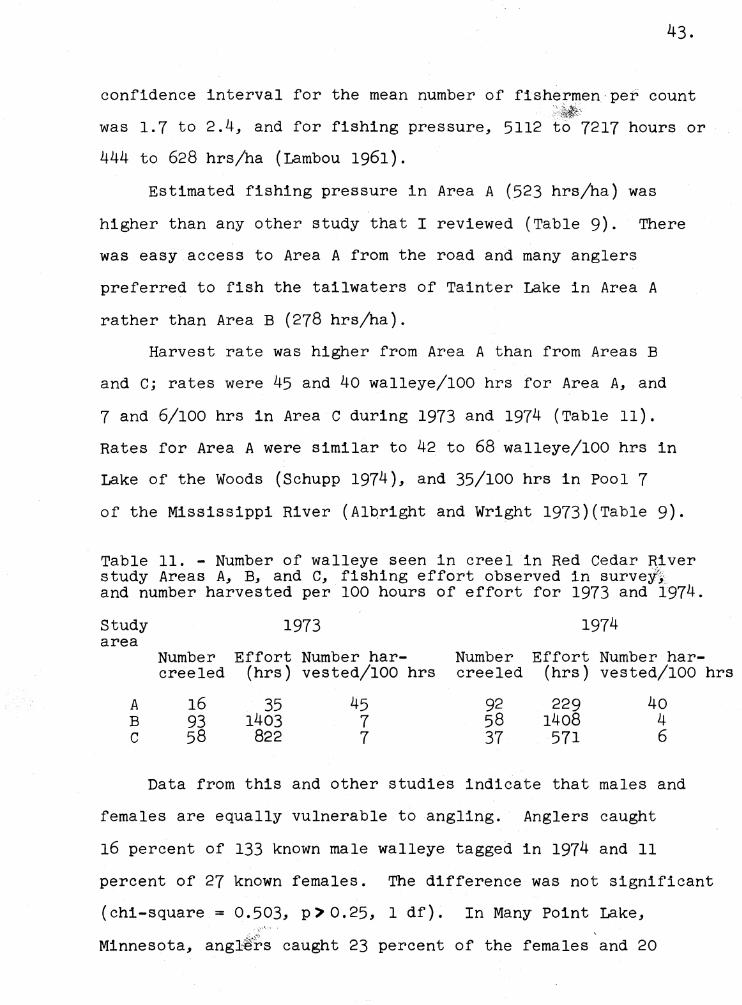
Estimated fishing pressure in Area A (523 hrs/ha) was
higher than any other study that I reviewed (Table 9). There
was easy access to Area A from the road and many anglers
preferred to fish the tailwaters of Tainter Lake in Area A
rather than Area B (278 hrs/ha).
Harvest rate was higher from Area A than from Areas B
and C; rates were 45 and 40 walleye/100 hrs for Area A, and
7 and 6/100 hrs in Area C during 1973 and 1974 (Table 11).
Rates for Area A were similar to 42 to 68 walleye/100 hrs in
Lake of the Woods (Schupp 1974), and 35/100 hrs in Pool 7
of the Mississippi River (Alqright and Wright 1973)(Table 9).
Table 11. - Number of walleye seen in creel in Red Cedar River study Areas A, B, and C, fishing effort observed in survey\ and number harvested per 100 hours of effort for 1973 and 1974.
Study 1973 1974 area
Number Effort Number har- Number Effort Number har-creeled (hrs) vested/100 hrs creeled (hrs) vested/100 hrs
A 16 35 45 92 229 40 B 93 1403 7 58 1408 4 C 58 822 7 37 571 6
Data from this and other studies indicate that males and
females are equally vulnerable to angling. Anglers caught
16 percent of 133 known male walleye tagged in 1974 and 11
percent of 27 known females. The difference was not significant
(chi-square= 0.503, p>0.25, 1 df). In Many Point Lake,
Minnesota, ang1:e·~s caught 23 percent of the females and 20
44.
percent of the males marked in 1957 (Olson 1958). Similar
exploitation rates for the sexes also were found in Pike Lake,
Washington County, Wisconsin (Mraz 1968), and Lake Winnibi
goshish, Minnesota (Johnson and Johnson 1971).
Sex ratios of electrofishing and angler catches in 1974
were similar to some other studies. Of 36 walleye creeled in
Area Bin 1974, 8 were males and 28 were females (Table 12).
Of 42 walleye caught by electrofishing in Area B from May
through October and sexed, 22 were males, 18 were females,
and the sex of 2 was not determined (Table 12). The difference
between the two ratios was significant (chi-square= 8.51,
p <0.01, 1 df). Of 23 angler caught walleye sexed in Area A,
16 were males and 7 were females; and of 14 from Area C, 10
were males and 4 were females. The total of 73 angler caught
walleye that was sexed was 34 males and 39 females (Table 12),
a ratio not significantly different from the electrofishing
ratio (chi-square= 0.619, p> 0.25, 1 df). Open water sampling
during summer yielded sex ratios of about 1:1 in Lac la Ronge,
Saskatchewan (Rawson 1957) and Red Lakes, Minnesota (Smith
and Pycha 1961). The reason for the different sex ratios of
the anglers• catches for each area is not known.
45.
Table 12. - Monthly sex ratios of anglers' catches in Areas A, B, and c, and of the electrofishing catch in Area B of the Red Cedar River. (Mis male, and Fis female. )
Month Area (Angler's catch) Electrofishing A B C
M F M F M F M F
May 2 10 4 0 3 1
June 1 2 2 5 1 1 6 4
July 2 5
August 0 5 1 1
September 7 3 1 1 7 8
October 8 2 2 3 3 1 6 5
Totals 16 7 8 28 10 4 22 18
Harvest and Age Class Composition
Data from the creel survey in Area B was expanded to an
estimate of total walleye harvest of 274 walleye (21.9/ha)
and 115 kg (9.2 kg/ha) in 1973, and 149 walleye (11.9/ha)
and 58.8 kg (4.7 kg/ha) in 1974 (Table 10, Appendices G and H).
The estimated harvest for Area A from 4 May through 24 November
1974 (40 walleye/100 hrs times 6014 hours of effort) was
2406 walleye or 209/ha. The mean length of creeled walleye
from Area A was 329 mm, and the estimated harvest was 736 kg
or 64 kg/ha.
Harvest of 4.7 kg/ha to 9.2 kg/ha for Area B was less than
9.3 to 16.9 kg/ha from the Cut Foot Sioux Lakes, Minnesota
(Johnson and Johnson 1971, Johnson 1953), but was greater
than 0.3 to 4.1 kg/ha from 12 other populations (Table 9);
46.
and harvest of 64 kg/ha for Area A was greater than all other
studies I found. Again, the role of area in the denominator
may be misleading when harvests (kg/ha) are compared. A
relatively small portion (such as Areas A and B) of a body
of water may have a considerably different harvest in kg/ha
than the entire body of water. Schupp (1972) found that 56
percent of the walleye were harvested from 20 percent of the
area on Leech Lake, Minnesota.
The extremely high estimated harvest in Area A as compared
to Area B may have been due to at least three reasons:
1) The estimated harvest per unit effort for Area A may have
been biased by the low number of angler hours observed there
during the survey (Table 11); anglers were interviewed there
only when no one was fishing in Area B; 2) Estimated harvest
in Area A may have been high because walleye moved down through
the Tainter Lake dam from outside the study section and were
then caught in Area A. The extent of such a movement, if any,
in this study is not known, but Eschmeyer and Crowe (1955)
reported at least 50 percent survival of walleye that passed
through power turbines of a 38 meter dam in Quebec. Also,
Joy (1975), with limited data, estimated a possible 11 percent
escapement of walleye through the dam on the Big Eau Pleine
Reservoir, Wisconsin; and 3) Walleye may have been more plenti
ful and vulnerable to angling in Area A as indicated by (A)
higher fishing pressure in Area A, (B) higher estimated harvest
per unit effort.
Age class composition of the anglers' catch for Areas A,
B, and C was similar to other populations where about 80
percent was from II through VI years old. In 1974, scale
analysis of 174 creeled walleye indicated that 11 percent was
age class I; about 82 percent of the harvest was made up of
ages II through V with age class III contributing 28 percent,
and the remaining 7 percent was ages VI through VIII. The
length frequency of 168 creeled walleye in 1973 indicated a
similar age distribution. Schupp (1974) found that more than
80 percent of the catch in Lake of the Woods was ages II
through V, and in Lake Winnibigoshish and Leech Lake, Minnesota,
80 percent was ages III through VI (Johnson and Johnson 1971,
Schupp 1972).
White bass, walleye, and smallmouth bass made up 77 and 73
percent of the estimated total harvest in Area B for 1973 and
1974 (Table 13). Anglers harvested more white bass than other
species during both years, an estimated 32 and 31/ha, respectively.
Harvest rates of white bass were 12 and 11 fish/100 hrs.
White bass harvest of about 30 fish/ha was greater than 0.4
to 5/ha for pools of the Mississippi River, but the harvest rate
(11 to 12) was less than 34 fish/100 hrs from Pool 4 and sim
ilar to 14/100 hrs from Pool 5 (Nord 1964). Other species
creeled included yellow perch, northern pike, black crappie,
white sucker (Catastomus commersoni), bullheads (Ictalurus spp),
largemouth bass, bluegill (Lepom1s macrochirus), redhorse
(Moxostoma spp), carp, and rock bass (Ambloplites rupestris).
48.
The total estimated harvest of all species in study Area B
for 1973 was 1218 fish or 97.4/ha, and for 1974 was 1024
fish or 81.9/ha. All species were harvested at rates of 31
and 30 fish/100 hrs, respectively (Table 13). The Red Cedar
River fishery was fairly diverse, as about 15 species comprised
the catch. The harvest rate was greater than 13 fish/100 hrs
from Escanaba Lake, Wisconsin (Table 9) where northern pike
and walleye were the dominant species in the catch (Kempinger
no date). The rate was lower than 40 to 115 fish/100 hrs
from five other waters where from 4 to 29 species comprised
the catch (Table 9).
Winter Creel Survey
The Red Cedar River walleye fishery was basically a
summer fishery. About equal effort was exerted for the winter
and summer creel surveys, yet only 8 walleye (1 in Area C
and 7 in Area D) were observed in the creel during a 2.5
month winter period. During the winter creel survey period
of 15 December, 1973, through February, 1974, 84 anglers were
interviewed in Area C and 104 in Area D. They fished 231 and
334 hours in the two areas. All walleye seen during the creel
survey were caught on minnows, and anglers were observed fishing
with minnows for 87.5 hours in Area C yielding a harvest rate
of 1 walleye/100 hrs of effort. In Area D, minnows were fished
for 302 hours for a rate of 2 walleye/100 hrs. Data were
not expanded to estimates of total harvest for the winter
fishery, because anglers were seen fishing on only 26 of 45
randomly selected survey days. No anglers were seen on 5
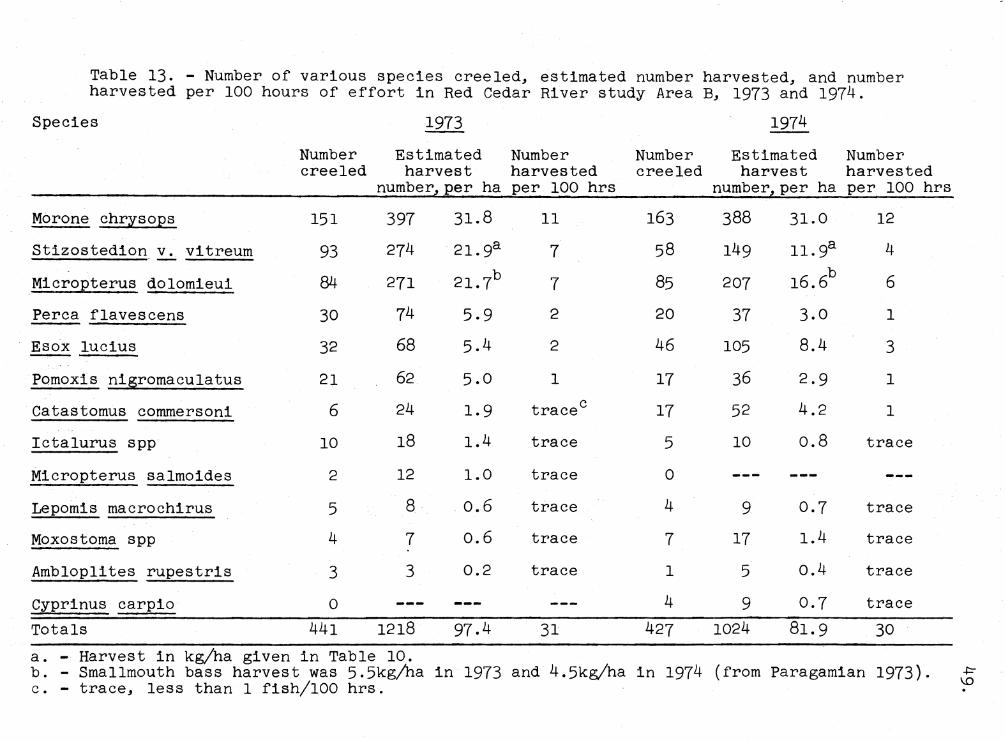
Table 13. - Number of various species creeled, estimated number harvested, and number harvested per 100 hours of effort in Red Cedar River study Area B, 1973 and 1974.
Species
Morone chrysops
Stizostedion v. vitreum
Micropterus dolomieui
Perea flavescens
Esox lucius
Pomoxis nigromaculatus
Catastomus commersoni
Ictalurus spp
Micropterus salmoides
Lepomis macrochirus
Moxostoma spp
Ambloplites rupestris
Cyprinus carpio
Totals
1973
Number Estimated Number creeled harvest harvested
151
93
84
30
32
21
6
10
2
5
4
3
0
441
number,per ha per 100 hrs
397
274
271
74
68
62
24
18
12
8
7
3
1218
5.9
5.4
5.0
1.9
1.4
1.0
o.6
o.6
0.2
97.4
11
7
7
2
2
1
trace
trace
trace
trace
trace
31
1974
Number Estimated Number creeled harvest harvested
163
58
85
20
46
17
17
5
0
4
7
1
4
427
number,per ha per 100 hrs
388
149
207
37
105
36
52
10
9
17
5
9
1024
31.0
11.9a
b 16.6
3.0
8.4
2.9
4.2
o.8
0.7
1.4
o.4
0.7
81.9
12
4
6
1
3
1
1
trace
trace
trace
trace
trace
30
a. - Harvest in kg/ha given in Table 10. b. - Smallmouth bass harvest was 5.5kg/ha in 1973 and 4.5kg/ha in 1974 (from Paragamian 1973). c. - trace, less than 1 fish/100 hrs.
50.
of the 11 weekday and weekend periods. The winter harvest
rate of 1 to 2 walleye/100 hrs in the Red Cedar River was
similar to 3 walleye/100 hrs in Leech Lake, Minnesota (Schupp
1972), but less than 3 to 23/100 hrs from Minnesota waters of
Lake of the Woods (Schupp 1974) and 16/100 hrs in the Big
Eau Pleine Reservoir, Wisconsin (Joy 1975).
The proportion of the total walleye harvest in the Red
Cedar River that occurred in winter was probably similar
to Leech Lake (Schupp 1972), Lake Winnibigoshish (Johnson
and Johnson 1971), and Lake of the Woods, Minnesota (Schupp
1974), where it comprised only about 1 percent of the total.
In contrast, Joy (1975) found that in the Big Eau Pleine
Reservoir, Wisconsin, the winter walleye fishery accounted
for 48 percent of the total harvest.
Species seen most often in the winter anglers' creel
were black crappie, bluegill, and yellow perch. Number/100 hrs
harvested was 17 and 13 for black crappie, 46 and 2 for bluegill,
and 37 and 7 for yellow perch in Areas C and D, respectively.
Movement
Data from angler tag returns, electrofishing catches,
and estimated harvest in Area B indicated that walleye moved
downstream into Lake Menomin (Area D) in summer and back up
stream in September and October. High catches of walleye in
spring of both years were probably related to the spawning run.
Several studies have shown that walleye return to the same
spawning grounds each year (e.g. Olson and Scidmore 1962,
Crowe 1962). Of the 78 tag returns from the 476 fish tagged
in 1973, 23 were caught in Area A, 28 in Area B, 13 in Area C
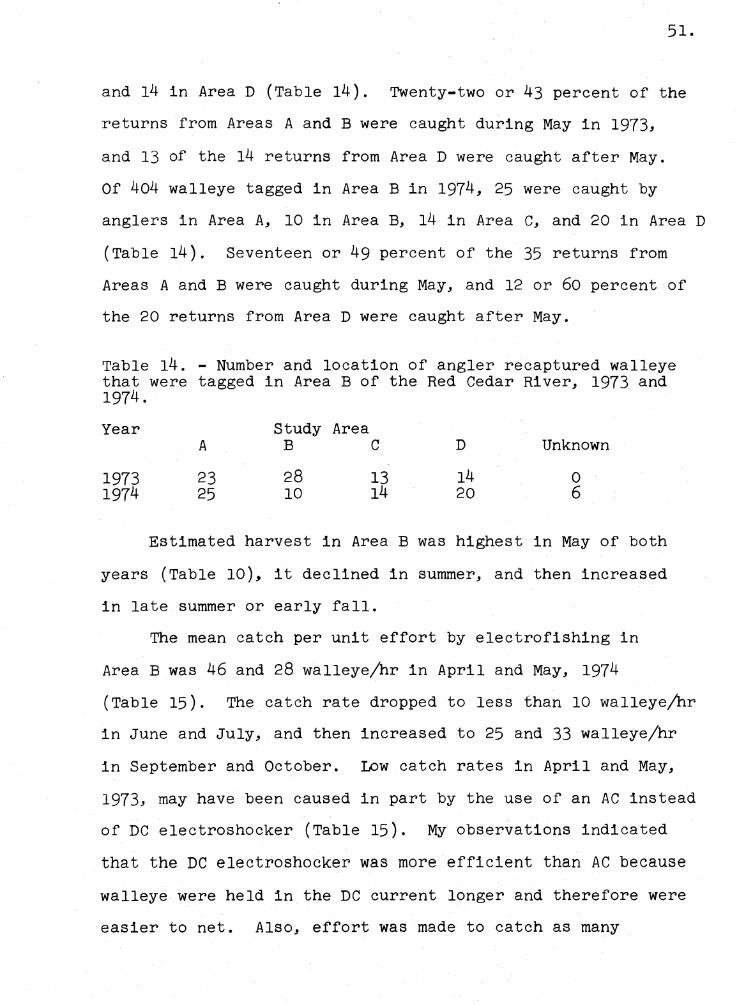
51.
and 14 in Area D (Table 14). Twenty-two or 43 percent of the
returns from Areas A and B were caught during May in 1973,
and 13 of the 14 returns from Area D were caught after May.
Of 404 walleye tagged in Area Bin 1974, 25 were caught by
anglers in Area A, 10 in Area B, 14 in Area C, and 20 in Area D
(Table 14). Seventeen or 49 percent of the 35 returns from
Areas A and B were caught during May, and 12 or 60 percent of
the 20 returns from Area D were caught after May.
Table 14. - Number and location of angler recaptured walleye that were tagged in Area B of the Red Cedar River, 1973 and 1974.
Year
1973 1974
A
23 25
Study Area B C
28 10
13 14
D
14 20
Unknown
0 6
Estimated harvest in Area B was highest in May of both
years (Table 10), it declined in summer, and then increased
in late summer or early fall.
The mean catch per unit effort by electrofishing in
Area B was 46 and 28 walleye/hr in April and May, 1974
(Table 15). The catch rate dropped to less than 10 walleye/hr
in June and July, and then increased to 25 and 33 walleye/hr
in September and October. Low catch rates in April and May,
1973, may have been caused in part by the use of an AC instead
of DC electroshocker (Table 15). My observations indicated
that the DC electroshocker was more efficient than AC because
walleye were held in the DC current longer and therefore were
easier to net. Also, effort was made to catch as many
52.
smallmouth bass as possible in 1973 (Paragamian 1973) and
total fishing effort was high. Few walleye were caught after
one complete circuit of the study area (approximately 1.2 hours
of effort) yet fishing was continued in an attempt to catch
smallmouth bass. Electrofishing catches in Area B during
September and October, 1973, increased to 39 and 53 walleye/hr.
The catch rate fell to 6 walleye/hr on 16 November when the
water temperature fell to 3°c (Table 15), indicating that
walleye may have moved back downstream.
The low number of tag returns from Area C, 13 and 14 in
1973 and 1974 (Table 14), indicated that walleye did not remain
there or were not concentrated there for long. Electrofishing
operations yielded 58 walleye 250 mm and longer in Areas C
and Din fall, 1973, and 33 in Area C in spring, 1974.
However, the catches per unit effort in Area B during the
same periods were about five times those in the downstream
areas.
More larger walleye than small may have moved upstream
in fall. Of walleye longer than 245 mm caught between 27
August and 19 October, 1973, 10 percent of 61 caught in
Areas C and D were longer than 350 mm, whereas 51 percent
of 262 captured in Area B were that long. Also, one walleye
351 mm long that was tagged in Area D was later recaptured
in Area B.
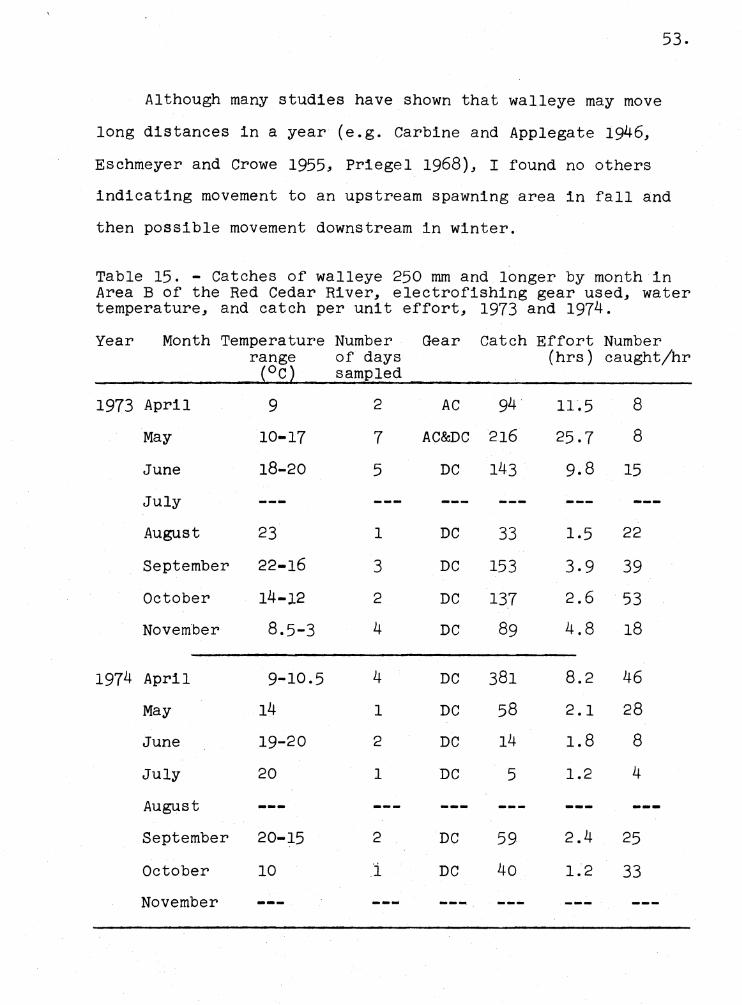
53.
Although many studies have shown that walleye may move
long distances in a year (e.g. Carbine and Applegate 1946,
Eschmeyer and Crowe 1955, Priegel 1968), I found no others
indicating movement to an upstream spawning area in fall and
then possible movement downstream in winter.
Table 15. - Catches of walleye 250 mm and longer by month in Area B of the Red Cedar River, electrofishing gear used, water temperature, and catch per unit effort, 1973 and 1974.
Year Month Temperature Number Gear catch Effort Number (hrs) caught/hr range of days
( 0 c) sampled
1973 April 9 2 AC 94
May
June
July
August
September
October
November
1974 April
May
June
July
August
September
October
November
10-17
18-20
23
22-16
14-l2
8.5-3
9-10.5
14
19-20
20
20-15
10
7
5
1
3
2
4
4
1
2
1
2
i
AC&DC 216
DC 143
DC
DC
DC
DC
DC
DC
DC
DC
DC
DC
33
153
137
89
381
58
14
5
59
40
11.5
25.7
9.8
8
8
15
1.5 22
3.9 39
2.6 53
4.8 18
8.2 46
2.1 28
1.8 8
1.2 4
2.4
1.2
25
33
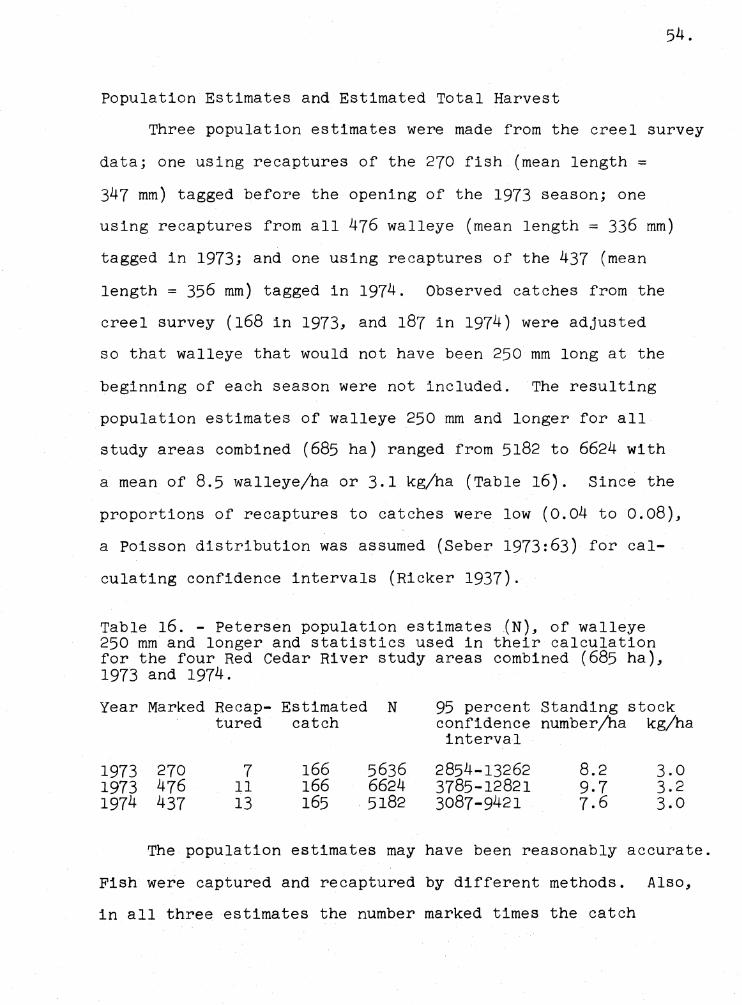
54.
Population Estimates and Estimated Total Harvest
Three population estimates were made from the creel survey
data; one using recaptures of the 270 fish (mean length=
347 mm) tagged before the opening of the 1973 season; one
using recaptures from all 476 walleye (mean length= 336 mm)
tagged in 1973; and one using recaptures of the 437 (mean
length= 356 mm) tagged in 1974. Observed catches from the
creel survey (168 in 1973, and 187 in 1974) were adjusted
so that walleye that would not have been 250 mm long at the
beginning of each season were not included. The resulting
population estimates of walleye 250 mm and longer for all
study areas combined (685 ha) ranged from 5182 to 6624 with
a mean of 8.5 walleye/ha or 3.1 kg/ha (Table 16). Since the
proportions of recaptures to catches were low (0.04 to 0.08),
a Poisson distribution was assumed (Seber 1973:63) for cal
culating confidence intervals (Ricker 1937).
Table 16. - Petersen population estimates (N), of walleye 250 mm and longer and statistics used in their calculation for the four Red Cedar River study areas combined (685 ha), 1973 and 1974.
Year Marked Recap- Estimated N 95 percent Standing stock tured catch confidence number/ha kg/ha
interval
1973 270 7 166 5636 2854-13262 8.2 3.0 1973 476 11 166 6624 3785-12821 9.7 3.2 1974 437 13 165 5182 3087-9421 7.6 3.0
The population estimates may have been reasonably accurate.
Fish were captured and recaptured by different methods. Also,
in all three estimates the number marked times the catch
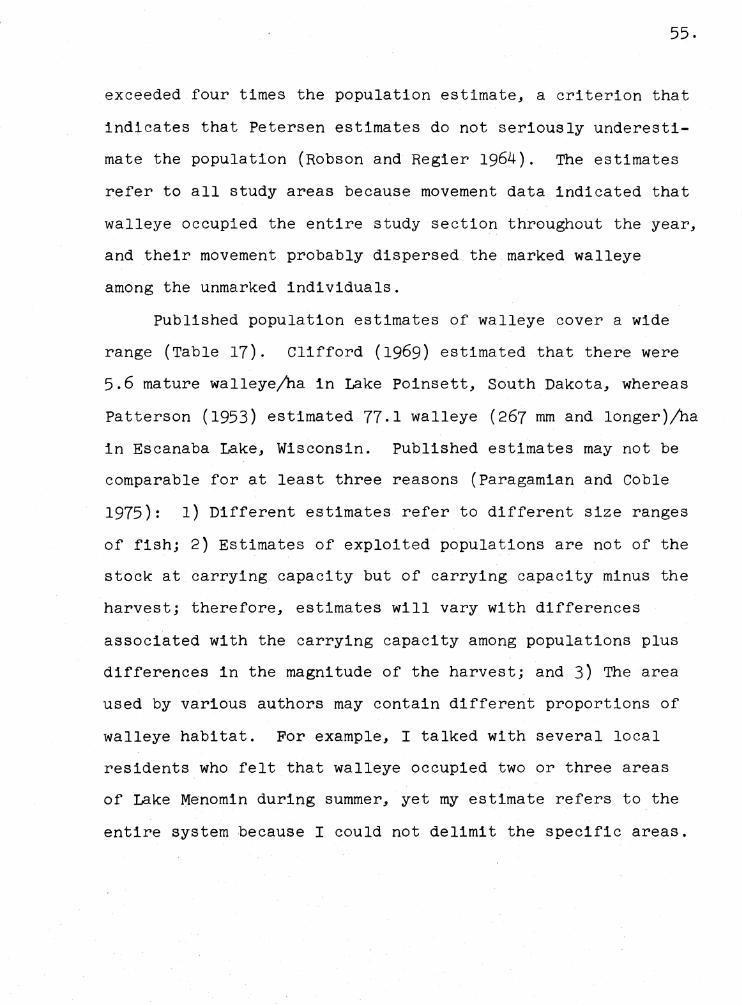
55,
exceeded four times the population estimate, a criterion that
indicates that Petersen estimates do not seriously underesti
mate the population (Robson and Regier 1964). The estimates
refer to all study areas because movement data indicated that
walleye occupied the entire study section throughout the year,
and their movement probably dispersed the marked walleye
among the unmarked individuals.
Published population estimates of walleye cover a wide
range (Table 17). Clifford (1969) estimated that there were
5.6 mature walleye/ha in Lake Poinsett, South Dakota, whereas
Patterson (1953) estimated 77.1 walleye (267 mm and longer)/ha
in Escanaba Lake, Wisconsin. Published estimates may not be
comparable for at least three reasons (Paragamian and Coble
1975): 1) Different estimates refer to different size ranges
of fish; 2) Estimates of exploited populations are not of the
stock at carrying capacity but of carrying capacity minus the
harvest; therefore, estimates will vary with differences
associated with the carrying capacity among populations plus
differences in the magnitude of the harvest; and 3) The area
used by various authors may contain different proportions of
walleye habitat. For example, I talked with several local
residents who felt that walleye occupied two or three areas
of Lake Menomin during summer, yet my estimate refers to the
entire system because I could not delimit the specific areas.
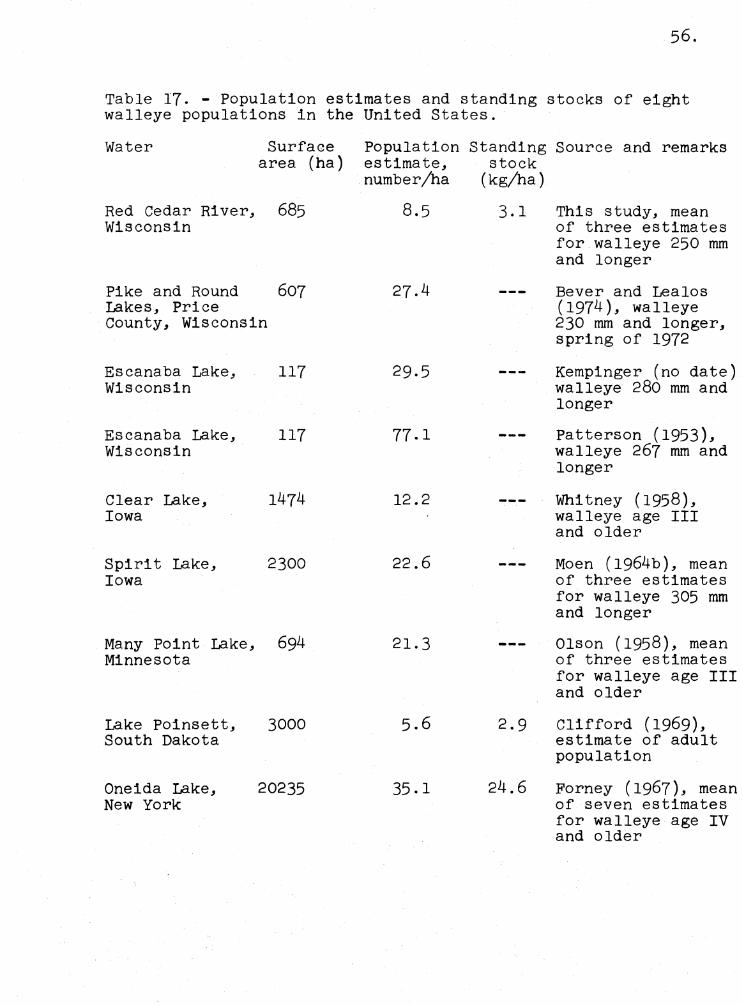
56.
Table 17. - Population estimates and standing stocks of eight walleye populations in the United States.
Water Surface area (ha)
Red Cedar River, 685 Wisconsin
Pike and Round 607 Lakes, Price County, Wisconsin
Escanaba Lake, 117 Wisconsin
Escanaba Lake, 117 Wisconsin
Clear Lake, 1474 Iowa
Spirit Lake, 2300 Iowa
Many Point Lake, 694 Minnesota
Lake Poinsett, 3000 South Dakota
Oneida Lake, 20235 New York
Population Standing Source and remarks estimate, stock number/ha (kg/ha)
8.5 3.1
27.4
29,5
77.1
12.2
22.6
21.3
5,6 2.9
35 .1 24.6
This study, mean of three estimates for walleye 250 mm and longer
Bever and Lealos (1974), walleye 230 mm and longer, spring of 1972
Kempinger (no date) walleye 280 mm and longer
Patterson (1953), walleye 267 mm and longer
Whitney ( 1958), walleye age III and older
Moen (1964b), mean of three estimates for walleye 305 mm and longer
Olson (1958), mean of three estimates for walleye age III and older
Clifford (1969), estimate of adult population
Forney (1967), mean of seven estimates for walleye age IV and older
57.
Estimates of total harvest for all study areas of walleye
250 mm and longer (exploitation rate X number in population)
were 1747 (2.6/ha) to 2035 (3.0/ha) for 1973, and 1606 (2.3/ha)
for 1974. Although these estimates were less than 4.9 to 30.5
walleye/ha from five other studies, similar to 1.8 to 3.6/ha
from four studies, and greater than estimates of 0.9 to 1.2/ha
in pools of the Mississippi River (Table 9), they were less
than an estimated 209/ha harvested from Area A (11.5 ha)
in 1974. If some walleye moved into Area A in early spring
and then stayed there throughout the summer and fall, they
would not have been marked and the population estimate would
have been too low. This may explain the high harvest in Area A
but does not seem likely as it contradicts the movement pattern
discussed earlier.
Critical Size and Equilibrium Yield
The critical size (Ricker 1945) is the size and age
when instantaneous growth rate (Ricker 1958:31) equals instan
taneous natural mortality rate, and therefore is the size
at which a year class should reach its maximum biomass.
When fish are smaller than the critical size, the biomass of
the year class increases because growth rate exceeds natural
mortality rate, and when fish are larger than the critical
size, the biomass of the year class declines because mortality
exceeds growth. Theoretically, the maximum harvest would
be obtained if all fish were caught at the critical size.
The critical size of walleye in this s·tudy fell between
419 and 452 mm total length, weights of 663 and 845 grams,
or ages V and VI (Table 18).
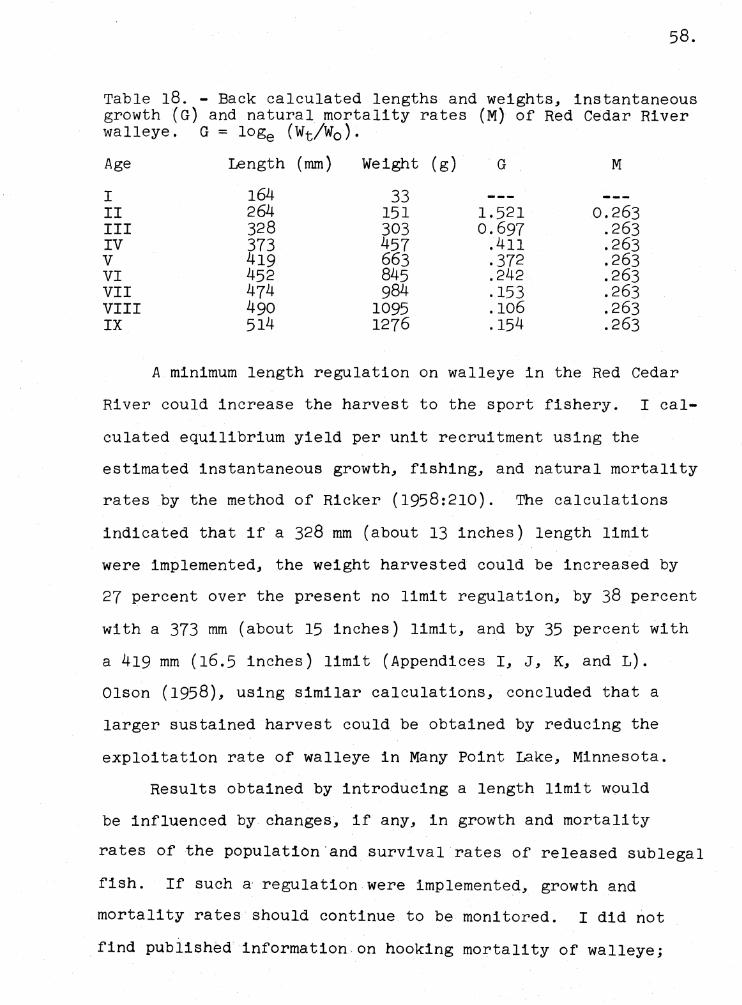
58.
Table 18. - Back calculated lengths and weights, instantaneous growth (G) and natural mortality rates (M) of Red Cedar River walleye. G = loge (Wt/W0 ).
Age Length (mm) Weight (g) G M
I 164 33 II 264 151 1.521 0.263 III 328 303 0.697 .263 IV 373 457 .411 .263 V 419 663 .372 .263 VI 452 845 .242 .263 VII 474 984 .153 .263 VIII 490 1095 .106 .263 IX 514 1276 .154 . 263
A minimum length regulation on walleye in the Red Cedar
River could increase the harvest to the sport fishery. I cal-
culated equilibrium yield per unit recruitment using the
estimated instantaneous growth, fishing, and natural mortality
rates by the method of Ricker (1958:210). The calculations
indicated that if a 328 mm (about 13 inches) length limit
were implemented, the weight harvested could be increased by
27 percent over the present no limit regulation, by 38 percent
with a 373 mm (about 15 inches) limit, and by 35 percent with
a 419 mm (16,5 inches) limit (Appendices I, J, K, and L).
Olson (1958), using similar calculations, concluded that a
larger sustained harvest could be obtained by reducing the
exploitation rate of walleye in Many Point Lake, Minnesota.
Results obtained by introducing a length limit would
be influenced by changes, if any, in growth and mortality
rates of the population·and survival rates of released sublegal
fish. If such a, regulation were implemented, growth and
mortality rates should continue to be monitored. I did not
find published information on hooking mortality of walleye;
59.
however, studies with trout (Salmo spp) indicated that hooking
mortality was not substantial except in deeply hooked fish
(Hunsacker et. al. 1970), and survival of such fish may exceed
50 percent if the line is cut leaving the hook in the fish
(Mason and Hunt 1967). I also calculated equilibrium yield
with 328, 373, and 419 mm length limits and included an extreme
hooking mortality of 50 percent for sublegal fish (Appendices
M, N, and 0). With a 328 mm size limit and 50 percent hooking
mortality, the weight harvested would increase by 2 percent
over the no limit regulation, and would decrease by 10 and 29
percent with 373 and 419 mm limits.
If my data and calculations are accurate, the effect of a
size limit on Red Cedar River walleye might be: 1) Increased
harvest in weight; 2) Increase in the number of walleye in the
population that were smaller than the size limit, which could
mean, (A) increased number of piscivores that might be bene
ficial if "stunted panfish" were a problem, (B) increased
catch rate of smaller walleye that must be released; and 3)
Anglers would take home fewer, but larger walleye. It would
be interesting to determine which regulation anglers would
prefer when given this information (data and implications).
60.
LITERATURE CITED
Albright, G.H. and K.J. Wright. 1973. Mississippi River special tailwater sport fishing creel census in Pool 7, March 1-April 30, 1973. Wisconsin Dept. Nat. Res., Fish Mgmt. Bur., Mgmt. Rept. No. 64, 27pp.
Arnold, B.B. 1960. Life history notes on the walleye, Stizostedion vitreum vitreum (Mitchill), in a turbid water, Utah Lake, Utah. MS thesis, Utah State University, Logan, Utah, 114pp.
Best, E.A. and H.D. Boles. 1956. An evaluation of creel census methods. California Fish and Game 42(2):109-115.
Bever, G.C. and J.M. Lealos. 1974. Walleye fishery in Pike and Round Lakes, Price County. Wisconsin Dept. Nat. Res., Bur. Fish Wild. Mgmt., Fish Mgmt. Sec., Rept. No. 73, 16pp.
Budd, J.C., F.E.J. Fry, and J.B. Smith. 1968. Survival of marked lake trout in Lake Manitou, Manitoulin Island, Ontario. J. Fish. Res. Board, Canada 25(11):2257-2268.
Carbine, W.F. and V.C. Applegate. 1946. Recaptures of tagged walleyes, Stizostedion v. vitreum (Mitchill), in Houghton Lake and the Muskegon River, Roscommon County, Michigan. Copeia No. 2:97~100.
Carlander, K.D. 1945. Age growth, sexual maturity, and population fluctuations of the yellow pikeperch, Stizostedion vitreum vitreum (Mitchill), with special reference to the commercial fisheries, Lake of the Woods~ Minnesota. Trans. Amer. Fish. Soc. 73:90-107.
, and R.R. Whitney. 1961. Age and growth of walleyes ---.-1-n-c-!ear Lake,· Iowa, 1935-1957. Trans. Amer. Fish. Soc.
90(2):130-138.
Clifford, T.J. 1969, An estimate of the standing crop and angler harvest of the walleye sport fishery of Lake Poinsett, South Dakota. Proc. South Dakota Acad. Sci. 48:151-156.
Crowe, W.R. 1962. Homing behavior in walleyes. Trans. Amer. Fish. Soc. 91(4):350-354.
Dell, M.B. 1968. applicator.
A new fish tag and rapid, cartridge-fed Trans. Amer. Fish. Soc. 97(1):57-59.
61.
Dicostanzo, C. 1956. Creel census techniques and harvest of fishes in Clear Lake, Iowa. Ph.D. thesis, Iowa State University, Ames, Iowa, 130pp.
Eschmeyer, P.H. 1950. The life history of the walleye, Stizostedion vitreum vitreum (Mitchill), in Michigan. Michigan Dept. Cons., Inst. Fish. Res. Bull. No. 3, 99pp.
, and W.R. Crowe. 1955. The movement and recovery ---o-r-,-t-agged walleyes in Michigan, 1929-1953. Michigan
Dept. Cons., Inst. Fish. Res., Misc. Pub. No. 8, 32pp.
Fleener, G.G. 1966. Life history of the walleye in Current River, Missouri. Missouri Dept. Cons., Fed. Aid Fish Wildl. Restoration Proj. F-l-R-15, Work Plan No. 9, Job 4, 5pp.
Forney, J.L. 1965, Factors affecting growth and maturity in a walleye population. New York Fish and Game Jour. 12(2):217-232 .
. 1966. Factors affecting first-year growth of ---w-a-1-1-eyes in Oneida Lake, New York. New York Fish and
Game Jour. 13(2):146-167 .
. 1967. Estimates of biomass and mortality rates -----r-n-a-walleye population. New York Fish and Game Jour.
14(2):176-192.
Heyerdahl, E.G. and L.L. Smith, Jr. 1972. Fishery resources for Lake of the Woods, Minnesota. University of Minnesota Agri. Exp. Sta., Tech Bull. No. 288, 145pp.
Hile, R. 1954. Fluctuations in growth and year-class strength of the walleye in Saginaw Bay. U.S. Dept. Interior, Fish and Wildl. Serv., Fishery Bull. 91, 59pp.
Hunsacker, D., L.F. Marnell, and F.P. Sharpe. 1970. Hooking mortality of Yellowstone cutthroat trout. Prog. FishCult. 32(4):231-235.
Johnson, F. 1953. Size of harvest and present status of the walleye fishery in Cutfoot Sioux Lake, Itasca County. Minnesota Dept. Cons., Invest. Rept. No. 138, 7pp .
. 1969. Environmental and species associations ___ o_f_....t-he walleye in Lake Winnibigoshish and connected waters,
including observations of food habits and predator prey relationships. Minnesota Fish. Invest., No. 5(1969): 5-36.
62 .
. 1971. Numerical abundance, sex ratios, and size -----age composition of the walleye spawning run at Little Cut Foot Sioux Lake, Minnesota 1942-1969, with data on fecundity and incidence of Lymphocystis. Minnesota Dept. Nat. Res., Div. Game and Fish, Sec. Fish., Inves. Rept. No. 315, 9pp.
, and M.W. Johnson. 1971. Characteristics of the ---1-9-5-7--1958 and 1939 sport fishery of Lake Winnibigoshish
and connecting waters with special emphasis on the walleye population and catch. Minnesota Dept. Nat. Res., Div. Game and Fish, Sec. Fish., Invest. Rept. No. 312, 3lpp.
Joy, E.T. (1975). Walleye in the Big Eau Pleine Reservoir, Wisconsin. MS thesis, University of Wisconsin-Stevens Point, Stevens Point, Wisconsin.
Kempinger, J.J. (No date). Estimation and exploitation of fish populations. Wisconsin Dept. Nat. Res., Fed. Aid Fish Wildl. Restoration Proj. F-83-R-4, Job IV-A, 2pp (mimeo).
Lambou, V.W. 1961. Determination of fishing pressure from fishermen or party counts with a discussion of sampling problems. Proc. Fifteenth Ann. Conf. S.E. Assoc. Game Fish Comm:380-401.
Lewis, S.A. 1970, Age and growth of walleye, Stizostedion vitreum vitreum (Mitchill), in Canton Reservoir, Oklahoma. Proc. Oklahoma Acad. Sci. 50:84-86.
Mason, J.W., and R.L. Hunt. 1967, Mortality rates of deeply hooked rainbow trout. Prog. Fish-Cult. 29(2):87-91.
Micklus, R.C. and H.A. Clementson. 1960. A three year study of the fish population and catch in Splithand Lake, Itasca County. Minnesota Dept. Cons., Invest. Rept. No. 26, 6pp.
Moen, T. 1964a. Fish studies on Spirit and Okoboji Lakes. Iowa Cons. Comm., Fed. Aid Fish Wildl. Restoration Proj. F-68-R-3, Job No. 3,9pp .
. 1964b. Fish studles on Spirit and Okoboji Lakes. ___ J_o_b---No. 2- Walleye population studies, Spirit Lake.
Iowa Cons. Comm . ., Fed. Aid Fish Wildl. Restoration Proj. No. F-68-R-3, Job No. 2, 17pp.
Mraz, D.M. 1968. Recruitment, ,growth, exploitation and management of walleyes in a southeastern Wisconsin lake. Wisconsin Dept. Nat. Res., Tech. Bull. No. 40, 38pp.
Niemuth, W., W. Churchill, and T. Wirth. 1972. Walleye, its life history, ecology, and management. Wisconsin Dept. Nat. Res., Pub. No. 227-72, 20pp.
Nord, R.C. 1964. The 1962-63 sport fishery of the upper Mississippi River. Contribution, Upper Mississippi River Cons. Comm.,209pp.
Olson, D.E. 1958. Statistics of a walleye sport fishery in a Minnesota Lake. Trans. Amer. Fish. Soc. 87:52-72.
, and M. Wesloh. 1962. A record of six years of ___ a_n_g~l..,..ing on Many Point Lake, Becker County, Minnesota with
special reference to the effect of walleye fingerling stocking. Minnesota Dept. Cons., Div. Game and Fish, Sec. Res. and Planning, Inves. Rept. No. 247, 5pp.
, and W.J. Scidmore. 1962. Homing behavior of --~s=p~a~w-ning walleyes. Trans. Amer. Fish. Soc. 91(4):355-361.
Paragamian, V.L. 1973. Population characteristics of smallmouth bass (Micropterus dolomieui) in the Plover and Red Cedar Rivers, Wisconsin. MS thesis, University of Wisconsin-Stevens Point, Stevens Point, Wisconsin, 77pp.
, and D.W. Coble. 1975. Vital statistics of small---m-ou-t~h~ bass in two Wisconsin rivers, and other waters.
J. Wildl. Manage. 39(1):201-210.
Patterson, D.L. 1953. The walleye population in Escanaba Lake, Vilas County, Wisconsin. Trans. Amer. Fish. Soc. 82:34~41.
Payne, N.R. 1964. The life history of the walleye, Stizostedion vitreum vitreum (Mitchill), in the Bay of Quinte. MS thesis, University of Toronto, 40pp.
Priegel, G.R. 1963. Food of walleye and sauger in Lake Winnebago, Wisconsin. Trans. Amer. Fish. Soc. 92(3): 312-313 .
. 1968. The movement, rate of exploitation and ___ h_o_m~i-ng behavior of walleyes in Lake Winnebago and connect-
ing waters, Wisconsin, as determined by tagging. Trans. Wisconsin Acad. Sci., Arts and Letters. 56:207-223 .
. 1969. Age and growth of the walleye in Lake __ __,,W~i_n_n_ebago. Trans. Wisconsin Acad. Sci., Arts and Letters.
57:121-133 .
. 1970. Reproduction and early life history of the ---w-a-1-1-eye in the Lake Winnebago region. Wisconsin Dept.
Nat. Res., Tech. Bull. No. 45, 105pp.
64.
Rawson, D.S. 1957, The life history and ecology of the yellow walleye, Stizostedion vitreum, in Lac la Ronge, Saskatchewan. Trans. Amer. Fish. Soc. 86:15-37.
Rawstron, R.R. 1971. Nonreporting of tagged white catfish, largemouth bass, and bluegills by anglers at Folsom Lake, California. California Fish and Game, 57(4):246-252 .
. 1972. Nonreporting of tagged lar~emouth bass, ---1-9~5-5--1968. California Fish and Game, 58(2):145-147.
Ricker, W.E. 1937, The concept of confidence or fiducial limits applied to the Poisson frequency distribution. Amer. Stat. Assoc. Jour. 32(198):349-356 .
. 1945. A method of estimating minimum size limits ---r-o_r_o-btaining maximum yield. Copeia No. 2:84-94 .
. 1958. Handbook of computations for biological ---s~t-a~t~istics of fish populations. Bull. Fish. Res. Board,
Canada, No. 119, 300pp.
Robson, D.S. and H.A. Regier. 1964. Sample size in Petersen mark-recapture experiments. Trans. Amer. Fish. Soc. 93(3) :215-226.
Ryder, R.A. 1968. Dynamics and exploitation of mature walleyes, Stizostedion vitreum vitreum, in the Nipigon Bay region of Lake Superior. J. Fish. Res. Board, Canada. 25(7): 1347-1376.
Saunders, R.L. 1968. An evaluation of two methods of attaching tags to Atlantic salmon smolts. Prog. Fish-Cult. 30(2): 104-109.
Schupp, D.H. 1972. The walleye fishery of Leech Lake Minnesota. Minnesota Dept. Nat. Res., Division Game and Fish, Section Fish., Invest. Rept. No. 317, llpp .
. 1974, The fish population structure and angling ____ h_a_r_v-est of Lake of the Woods, Minnesota, 1968-70.
Minnesota Dept. Nat. Res., Div. Fish Wildl., Sec. Fish., Invest. Rept. No. 324, 16pp.
Seaburg, K.G. 1957, A stomach sampler for live fish. Frog. Fish-Cult. 19(3):137-139,
, and J.B. Moyle. 1964. Feeding habits, digestive ---r-a~t-e-s, and growth of some Minnesota warm water fishes.
Trans. Amer. Fish. Soc. 93(3):269-285.
Seber, G. A,' 1973. The estimation of animal abundance and related parameters. Charles Griffin and Co. Limited, London, 506pp.
Serns, S.L. and T.C. McKnight. 1974. A summer creel census of Stormy, Black Oak, and Laura Lakes, Vilas County. Wisconsin Dept. Nat. Res., Fish Mgmt. Sec., Rept. No. 71, 27pp.
Slastenenko, E.P. 1956. The growth of yellow pikeperch, Stizostedion vitreum (Mitchill) in the Three Mile Lake, Ontario. CanaaI'an7;'1sh-Cult. 19:17-24.
Smith, L.L. and R.L. Pycha. 1961. Factors related to commercial production of the walleye in Red Lakes, Minnesota. Trans. Amer. Fish. Soc. 90(2):190-217.
Smith, S.H. 1954. Method of producing plastic impressions of fish scales without heat. Prog. Fish-Cult. 16(2):75~78.
Snow, H.E. 1969. Comparative growth of eight species of fish in thirteen northern Wisconsin lakes. Wisconsin Dept. Nat. Res., Res. Rept. No. 46, 23pp.
Stroud, R.H. 1949. Growth of Norris Reservoir walleye during the first twelve years of impoundment. Jour. Wildl. Manage. 13(2):157-177.
, and H. Bitzer. 1955. Harvests and management of -----warmwater fish populations in Massachusetts' lakes, ponds, and reservoirs. Prog. Fish-Cult. 17(2):51-63.
Tesch, F.W. 1971. Age and growth. Pages 98-130 in W.E. Ricker; ed. Methods for assessment of fish production in fresh waters. IBP Handbook No. 3, Blackwell Scientific Publications, Oxford and Edinburgh, 348pp.
Whitney, R.R. 1958, Numbers of mature walleyes in Clear Lake, Iowa, 1952-3, as estimated by tagging. Iowa State College J. Sci. 33(1):55-79.
66.
APPENDICES
Page
Appendix A. Spotted sucker and carp tagging experiment.
Appendix B. Mean back calculated total length (mm) at each annulus, and growth based on sum of mean of increments for each year class for 206 walleye caught by electrofishing, 26 April through 21 June, 1973, Red Cedar River, Wisconsin.
Appendix C. Mean back calculated total length (mm) at each annulus, and growth based on sum of mean of increments for each year class for 24 female walleye caught by electrofishing, 18 April through 2 May, 1974, Red Cedar River, Wisconsin.
Appendix D. Mean back calculated total length (mm) at each annulus, and growth based on sum of mean of increments for each year class for 52 male walleye caught by electrofishing, 18 April through 2 May, 1974, Red Cedar River, Wisconsin.
Appendix E. Mean back calculated weights (g) at each annulus, and weights based on sum of mean length increments for each year class from 206 walleye caught by electrofishing, 26 April through 21 June, 1973, Red Cedar River, Wisconsin.
Appendix F. Number of walleye of each age class from the 1974 electrofishing and anglers' catches and the regression formulae for the catch curves
69
72
73
74
75
shown in Figure 4. 76
Appendix G. Percent of total time surveyed from 15 May through October, 1973, observed and estimated number·of walleye harvested and fishing pressure in Area B of the Red Cedar River, Wisconsin. 77
Appendix H. Percent of total time surveyed from 4 May through 24 November,. 1974, observed and estimated number of walleyenarvested and fishing pressure in Area B ,of the Red Cedar River, Wisconsin. 80
Appendix I. Back calculated lengths (mm) and weights (g) at annulus formation, and computation of equilibrium yield per unit recruitment for walleye in the Red Cedar River, Wisconsin, under present condition of no size limit. G,M, and Fare instantaneous rates of growth, natural mortality, and fishing mortality.
Appendix J. Back calculated lengths (mm) and weights (g) at annulus formation, and computation of equilibrium yield per unit recruitment with a 328 mm (about 13 inches) length limit for walleye in the Red Cedar River, Wisconsin. G, M, and Fare instantaneous rates of growth, natural mortality, and fishing mortality.
Appendix K. Back calculated lengths (mm) and weights (g) at annulus formation, and computation of equilibrium yield per unit recruitment with a 373 mm (about 15 inches) length limit for walleye in the Red Cedar River, Wisconsin. G, M, and Fare instantaneous rates of growth, natural mortality, and fishing mortality.
Appendix L. Back calculated lengths (mm) and weights (g) at annulus formation, and computation of equilibrium yield per unit recruitment with a 419 mm (16.5 inches) length limit for walleye in the Red Cedar River, Wisconsin. G, M, and Fare instantaneous rates of growth, natural mortality, and fishing mortality.
Appendix M. Back calculated lengths (mm) and weights (g) at annulus formation, and computation of equilibrium yield per unit recruitment with a 328 mm (about 13 inches) length limit and 50 percent hooking mortality on sublegal fish for walleye in the Red Cedar River, Wisconsin. G, M, and Fare instantaneous rates of growth, natural mortality, and fishing mortality.
Page
84
86
88
90
92
Appendix N. Back calculated lengths (mm) and weights (g) at annulus formation, and computation of equilibrium yield per unit recruitment with a 373 mm (about 15 inches) length limit and 50 percent hooking mortality on sublegal fish for walleye in the Red Cedar River, Wisconsin. G, M, and Fare instantaneous rates of growth, natural mortality, and fishing mortality.
Appendix 0. Back calculated lengths (mm) and weights (g) at annulus formation, and computation of equilibrium yield per unit recruitment with a 419 mm (16.5 inches) length limit and 50 percent hooking mortality on sublegal fish for walleye in the Red Cedar River, Wisconsin. G, M, and Fare instantaneous rates of growth, natural mortality, and fishing mortality.
68.
Page
94
96
APPENDIX A
Spotted sucker and carp tagging experiment
INTRODUCTION
Streamer and Swedish smolt tags attached to Red Cedar
River walleye in 1973 proved unsatisfactory because of an
estimated 53 percent tag loss during that year. Two different
lines with Swedish smolt attachment were tested in a laboratory
experiment in 1974. Spotted sucker (Minytrema melanops) and
carp (Cyprinus carpio) were tagged with 30-lb test monofilament
fishing line and 12-lb test nylon multifilament casting line,
held in 2 artificial streams for 66 days, and tag loss and
mortality were observed.
MATERIALS AND METHODS
Forty-five spotted sucker (289 to 434 mm total length)
and 3 carp (279 to 425 mm long) were obtained from the
National Fish Hatchery at Genoa, Wisconsin, in March, 1974.
On 26 March, 1974, all fish were anaesthetized with MS 222,
measured, and divided equally between 2 artificial streams,
10.3 m X 48 cm X 45 cm deep. A control group of eight spotted
sucker and one carp was given a 1/2 right pelvic fin clip
and returned to the streams. Three spotted sucker (needle
controls) were given a 1/2 left pectoral fin clip and two
surgical needles were drawn through the fish just anterior
to the dorsal fin. The two test groups consisted of 17 spotted
sucker and 1 carp, each. One group was tagged with 30-lb
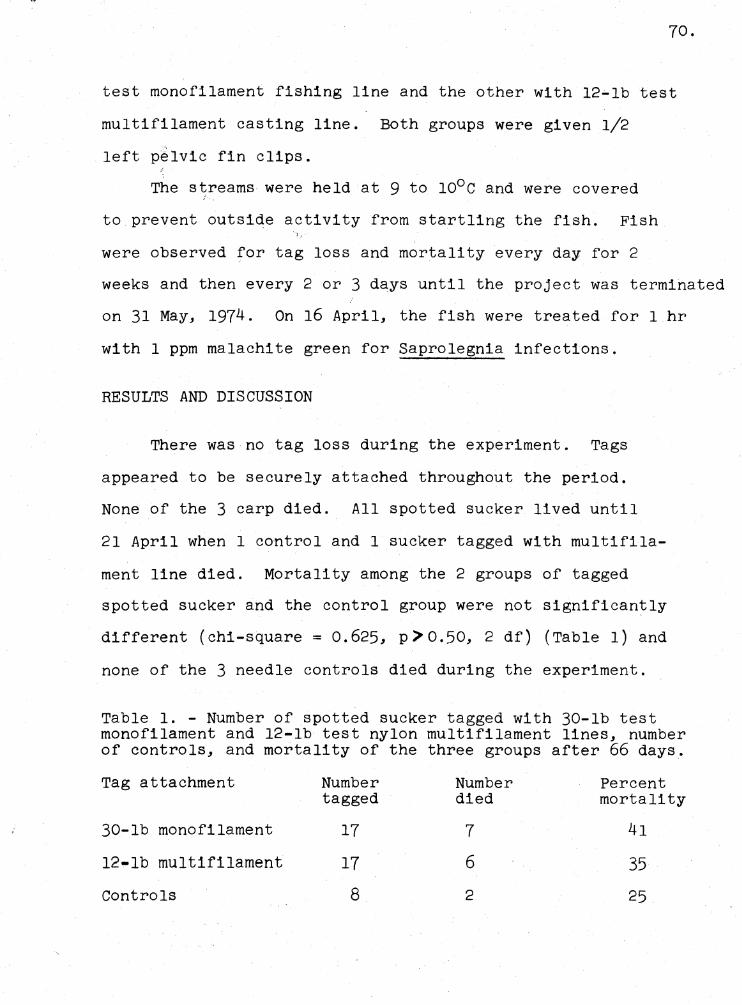
70.
test monofilament fishing line and the other with 12-lb test
multifilament casting line. Both groups were given 1/2
left pelvic fin clips.
The streams were held at 9 to 10°c and were covered
to prevent outside activity from startling the fish. Fish
were observed for tag loss and mortality every day for 2
weeks and then every 2 or 3 days until the project was terminated
on 31 May, 1974. On 16 April, the fish were treated for 1 hr
with 1 ppm malachite green for Saprolegnia infections.
RESULTS AND DISCUSSION
There was no tag loss during the experiment. Tags
appeared to be securely attached throughout the period.
None of the 3 carp died. All spotted sucker lived until
21 April when 1 control and 1 sucker tagged with multifila
ment line died. Mortality among the 2 groups of tagged
spotted sucker and the control group were not significantly
different (chi-square= 0.625, p::>0.50, 2 df) (Table 1) and
none of the 3 needle controls died during the experiment.
Table 1. - Number of spotted sucker tagged with 30-lb test monofilament and 12-lb test nylon multifilament lines, number of controls, and mortality of the three groups after 66 days.
Tag attachment Number Number Percent tagged died mortality
30-lb monofilament 17 7 41
12-lb mult1f1lament 17 6 35
Controls 8 2 25
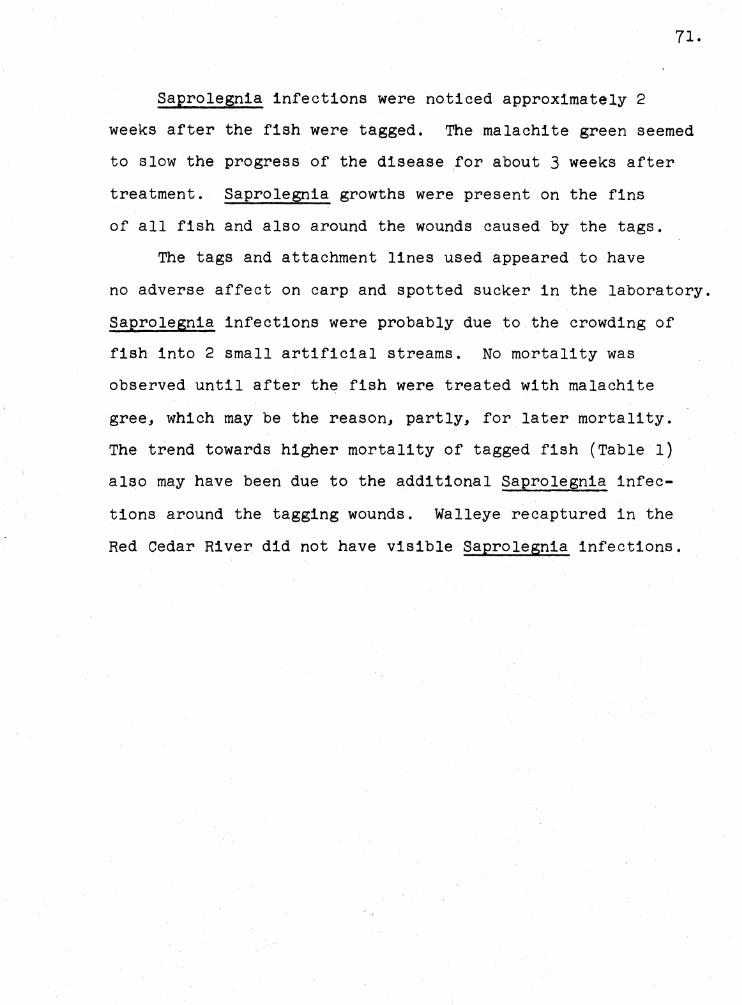
71.
Saprolegnia infections were noticed approximately 2
weeks after the fish were tagged. The malachite green seemed
to slow the progress of the disease for about 3 weeks after
treatment. Saprolegnia growths were present on the fins
of all fish and also around the wounds caused by the tags.
The tags and attachment lines used appeared to have
no adverse affect on carp and spotted sucker in the laboratory.
Saprolegnia infections were probably due to the crowding of
fish into 2 small artificial streams. No mortality was
observed until after the fish were treated with malachite
gree, which may be the reason, partly, for later mortality.
The trend towards higher mortality of tagged fish (Table 1)
also may have been due to the additional Saprolegnia infec
tions around the tagging wounds. Walleye recaptured in the
Red Cedar River did not have visible Saprolegnia infections.
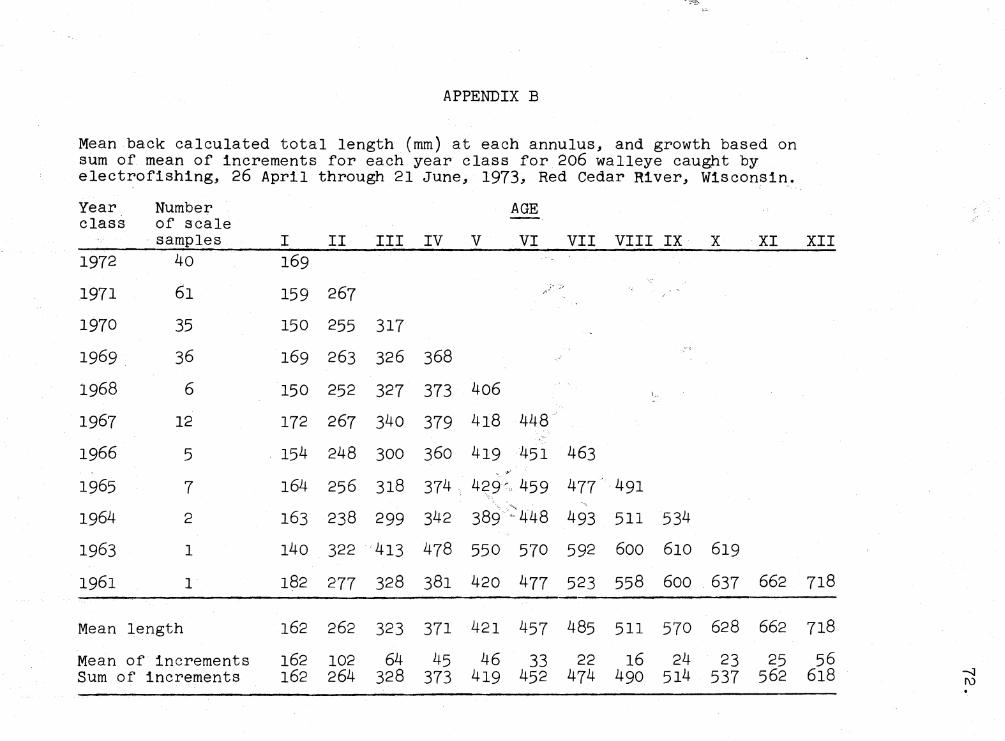
APPENDIX B
Mean back calculated total length (mm) at each annulus, and growth based on sum of mean of increments for each year class for 206 walleye caught by electrofishing, 26 April through 21 June, 1973, Red Cedar River, Wisconsin.
Year Number AGE class of scale
samples I II III IV V VI VII VIII IX X XI XII 1972 40 169
1971 61 159 267
1970 35 150 255 317
1969 36 169 263 326 368
1968 6 150 252 327 373 406
1967 12 172 267 340 379 418 448 ..
1966 5 154 248 300 360 419 451 463 ·- ·J>.'
1965 7 164 256 318 374 429 ',. 459 477' 491 ~ .... ~
1964 2 163 238 299 342 389 .,. 448 493 511 534
1963 1 140 322 413 478 550 570 592 600 610 619
1961 1 182 277 328 381 420 477 523 558 600 637 662 718
Mean length 162 262 323 371 421 457 485 511 570 628 662 718
Mean of increments 162 102 64 45 46 33 22 16 24 23 25 56 Sum of increments 162 264 328 373 419 452 474 490 514 537 562 618 --.1
I\) .
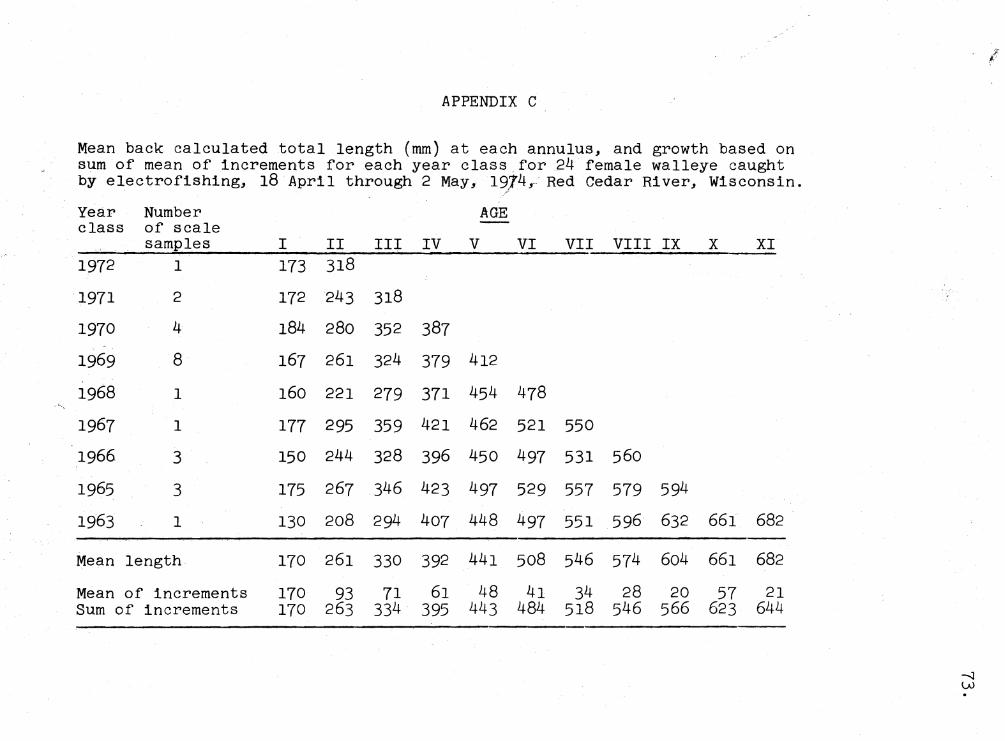
APPENDIX C
Mean back calculated total length (mm) at each annulus, and growth based on sum of mean of increments for each year class for 24 female walleye caught by electrofishing, 18 April through 2 May, 1QJ4, Red Cedar River, Wisconsin.
Year Number AGE class of scale
samples I II III IV V VI VII VIII IX X XI 1972 1 173 318
· 1971 2 172 243 318
1970 4 184 280 352 387
1969 8 167 261 324 379 412
1968 1 160 221 279 371 454 478
1967 1 177 295 359 421 462 521 550
1966 3 150 244 328 396 450 497 531 560
1965 3 175 267 346 423 497 529 557 579 594
1963 1 130 208 294 407 448 497 551 596 632 661 682
Mean length 170 261 330 392 441 508 546 574 604 661 682
Mean of increments 170 93 71 61 48 41 34 28 20 57 21 Sum of increments 170 263 334 395 443 484 518 546 566 623 644
---..J l,0
/'
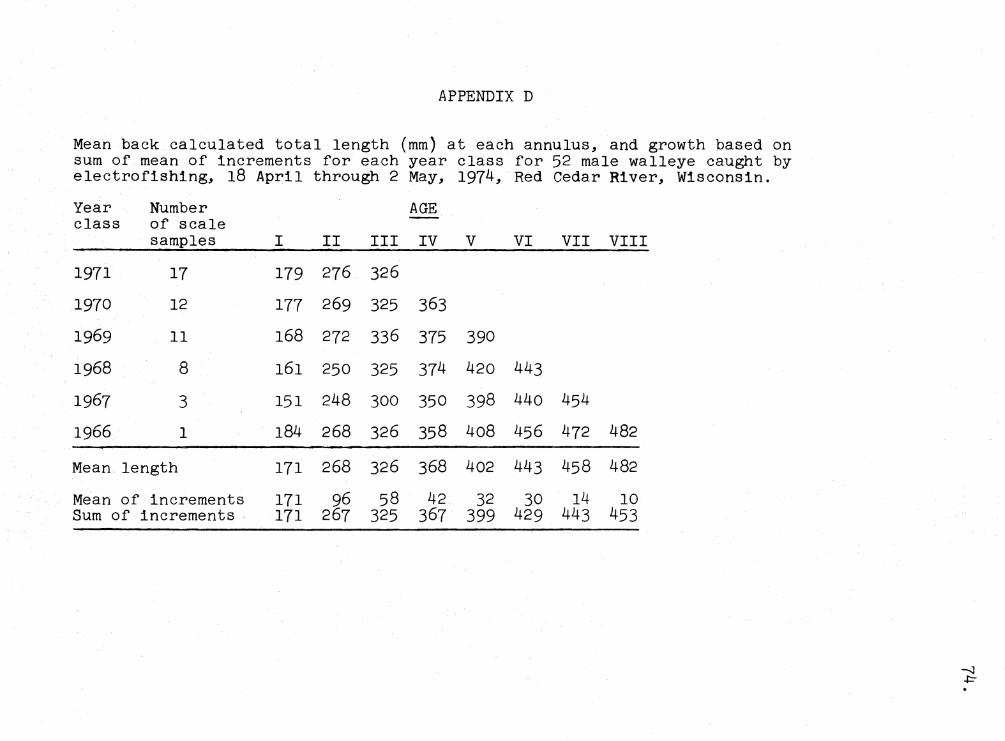
APPENDIX D
Mean back calculated total length (mm) at each annulus, and growth based on sum of mean of increments for each year class for 52 male walleye caught by electrofishing, 18 April through 2 May, 1974, Red Cedar River, Wisconsin.
Year Number AGE class of scale
samples I II III IV V VI VII VIII
1971 17 179 276 326
1970 12 177 269 325 363
1969 11 168 272 336 375 390
1968 8 161 250 325 374 420 443
1967 3 151 248 300 350 398 440 454
1966 1 184 268 326 358 408 456 472 482
Mean length 171 268 326 368 402 443 458 482
Mean of increments 171 96 58 42 32 30 14 10 Sum of increments 171 267 325 367 399 429 443 453
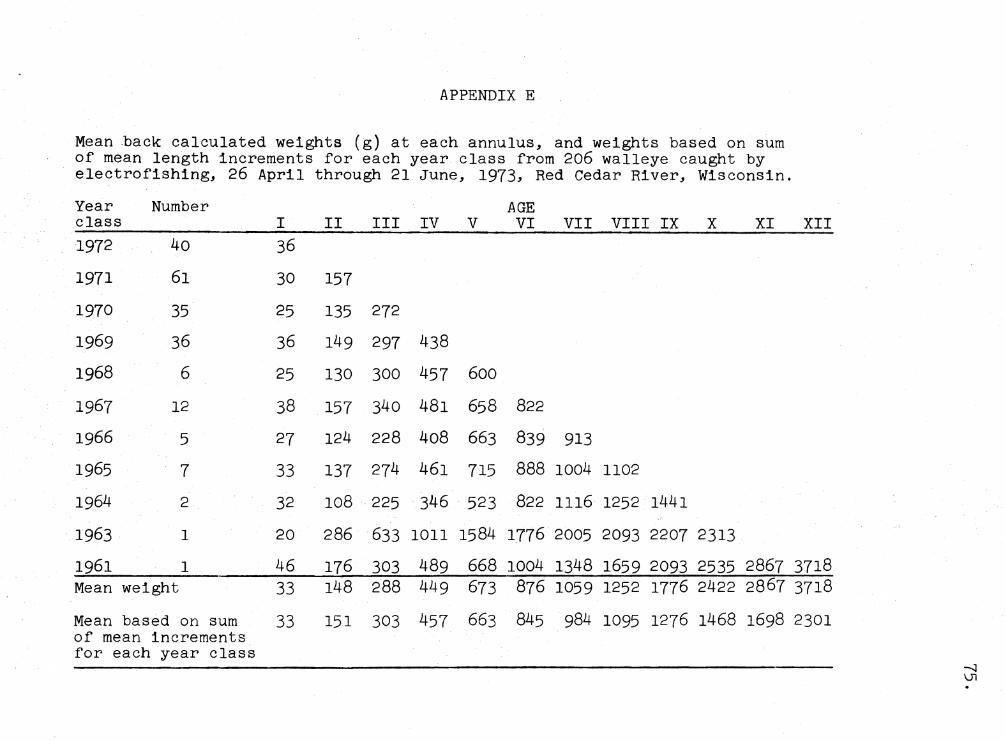
APPENDIX E
Mean back calculated weights (g) at each annulus, and weights based on sum of mean length increments for each year class from 206 walleye caught by electrofishing, 26 April through 21 June, 1973, Red Cedar River, Wisconsin.
Year Number AGE class I II III IV V VI VII VIII IX X XI XII 1972 40 36
1971 61 30 157
1970 35 25 135 272
1969 36 36 149 297 438
1968 6 25 130 300 457 600
1967 12 38 157 340 481 658 822
1966 5 27 124 228 408 663 839 913
1965 7 33 137 274 461 715 888 1004 1102
1964 2 32 108 225 346 523 822 1116 1252 1441
1963 1 20 286 633 1011 1584 1776 2005 2093 2207 2313
1961 1 46 176 303 489 668 1004 1348 1659 2093 2535 2867 3718 Mean weight 33 148 288 449 673 876 1059 1252 1776 2422 2867 3718
Mean based on sum 33 151 303 457 663 845 984 1095 1276 1468 1698 2301 of mean increments for each year class
--.:J \Jl .
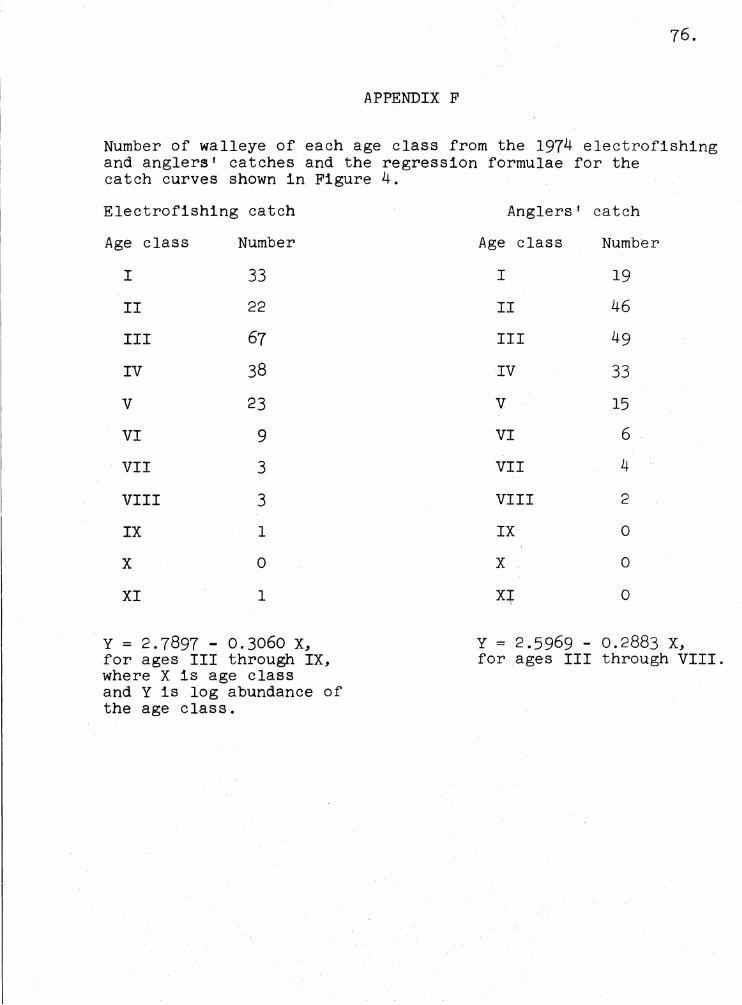
76.
APPENDIX F
Number of walleye of each age class from the 1974 electrofishing and anglers' catches and the regression formulae for the catch curves shown in Figure 4.
Electrofishing catch
Age class
I
II
III
IV
V
VI
VII
VIII
IX
X
XI
Number
33
22
67
38
23
9
3
3
1
0
1
Y = 2.7897 - 0.3060 x, for ages III through IX, where Xis age class and Y is log abundance of the age class.
Anglers' catch
Age class
I
II
III
IV
V
VI
VII
VIII
IX
X
XI '
Number
19
46
49
33
15
6
4
2
0
0
0
Y = 2.5969 - 0.2883 x, for ages III through VIII.
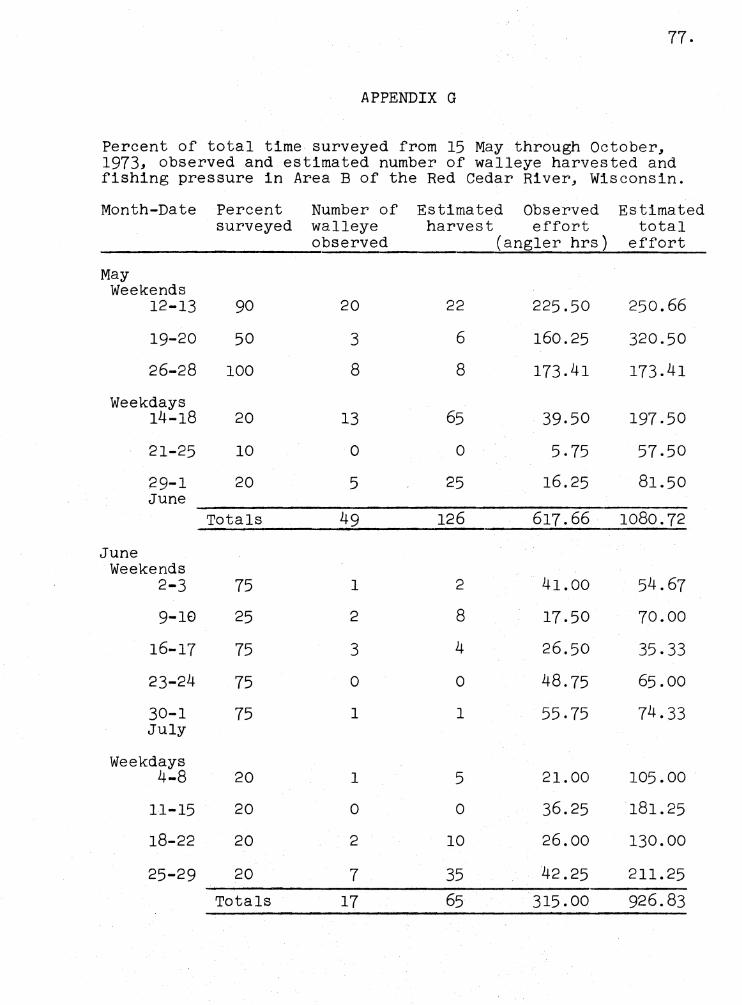
77.
APPENDIX G
Percent of total time surveyed from 15 May through October, 1973, observed and estimated number of walleye harvested and fishing pressure in Area B of the Red Cedar River, Wisconsin.
Month-Date Percent Number of Estimated Observed Estimated surveyed walleye harvest effort total
observed (angler hrs) effort
May Weekends
12-13 90 20 22 225,50 250.66
19-20 50 3 6 160.25 320.50
26-28 100 8 8 173.41 173.41
Weekdays 14-18 20 13 65 39.50 197,50
21-25 10 0 0 5. 75 57.50
29-1 20 5 25 16.25 81.50 June
Totals 49 126 617.66 1080.72
June Weekends
2-3 75 1 2 41.00 54.67
9-10 25 2 8 17.50 70.00
16-17 75 3 4 26.50 35.33
23-24 75 0 0 48.75 65.00
30-1 75 1 1 55-75 74.33 July
Weekdays 4-8 20 1 5 21.00 105.00
11-15 20 0 0 36.25 181.25
18-22 20 2 10 26.00 130.00
25-29 20 7 35 42.25 211.25
Totals 17 65 315.00 926.83
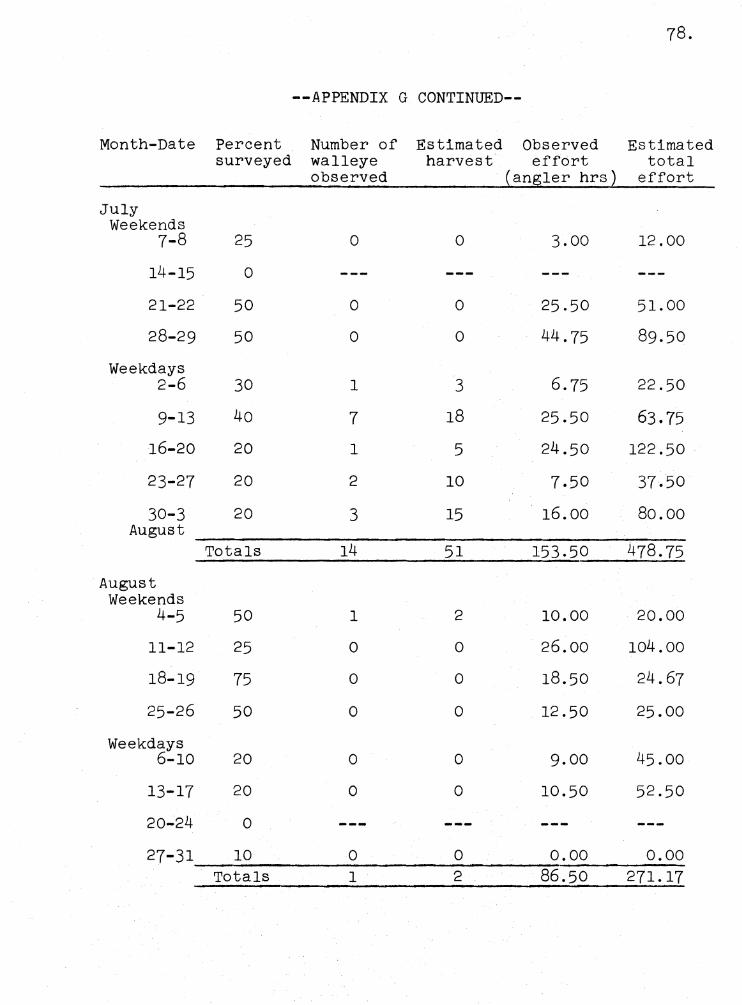
78.
--APPENDIX G CONTINUED--
Month-Date Percent Number of Estimated Observed Estimated surveyed walleye harvest effort total
observed (angler hrs) effort
July Weekends
7-8 25 0 0 3.00 12.00
14-15 0
21-22 50 0 0 25,50 51. 00
28-29 50 0 0 44.75 89.50
Weekdays 2-6 30 1 3 6,75 22.50
9-13 40 7 18 25,50 63.75
16-20 20 1 5 24.50 122.50
23-27 20 2 10 7.50 37.50
30-3 20 3 15 16.00 80.00 August
Totals 14 51 153 .so 478.75
August Weekends
4-5 50 1 2 10.00 20.00
11-12 25 0 0 26.00 104.oo
18-19 75 0 0 18.50 24.67
25-26 50 0 0 12.50 25.00
Weekdays 6-10 20 0 0 9.00 45.00
13-17 20 0 0 10.50 52,50
20-24 0
27-31 10 0 0 0.00 0.00 Totals 1 2 86.50 271.17
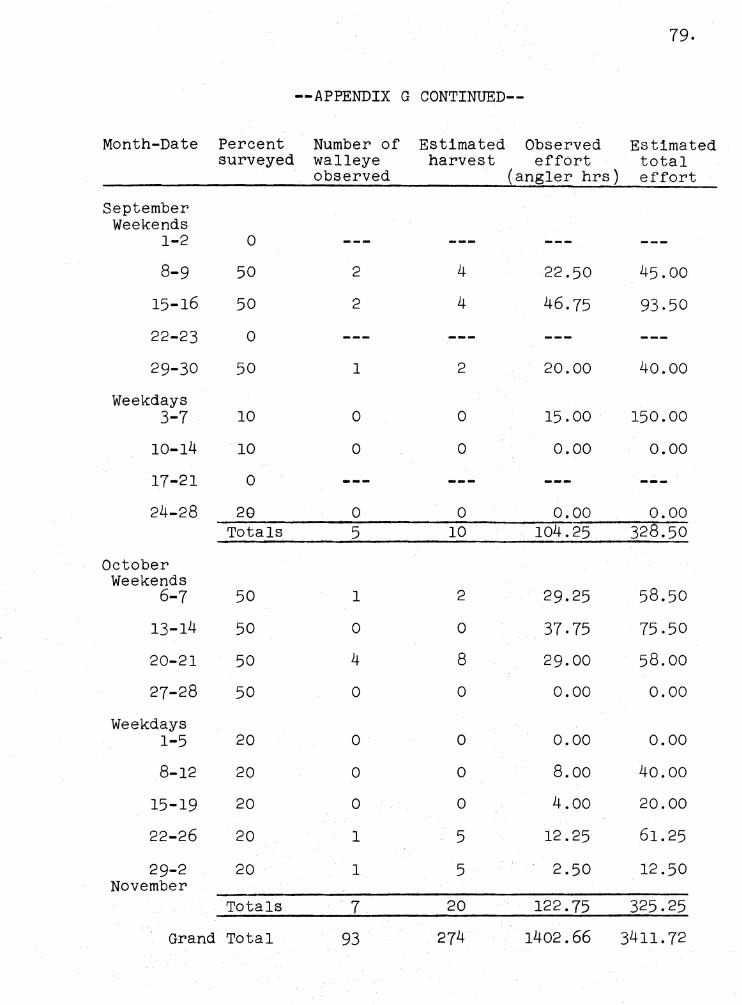
79.
--APPENDIX G CONTINUED--
Month-Date Percent Number of Estimated Observed Estimated surveyed walleye harvest effort total
observed (angler hrs) effort
September Weekends
1-2 0
8-9 50 2 4 22.50 45.00
15-16 50 2 4 46.75 93,50
22-23 0
29-30 50 1 2 20.00 40.00
Weekdays 3-7 10 0 0 15. 00 150.00
10-14 10 0 0 0.00 0.00
17-21 0
24-28 29 0 0 0.00 0.00 Totals 5 10 104.25 328.50
October Weekends
6-7 50 1 2 29.25 58.50
13-14 50 0 0 37,75 75,50
20-21 50 4 8 29.00 58.oo
27-28 50 0 0 0.00 0.00
Weekdays 1-5 20 0 0 0.00 0.00
8-12 20 0 0 8.00 40.00
15-19 20 0 0 4.00 20.00
22-26 20 1 5 12.25 61.25
29-2 20 1 5 2.50 12 .50 November
Totals 7 20 122.75 325,25
Grand Total 93 274 1402. 66 3411. 72
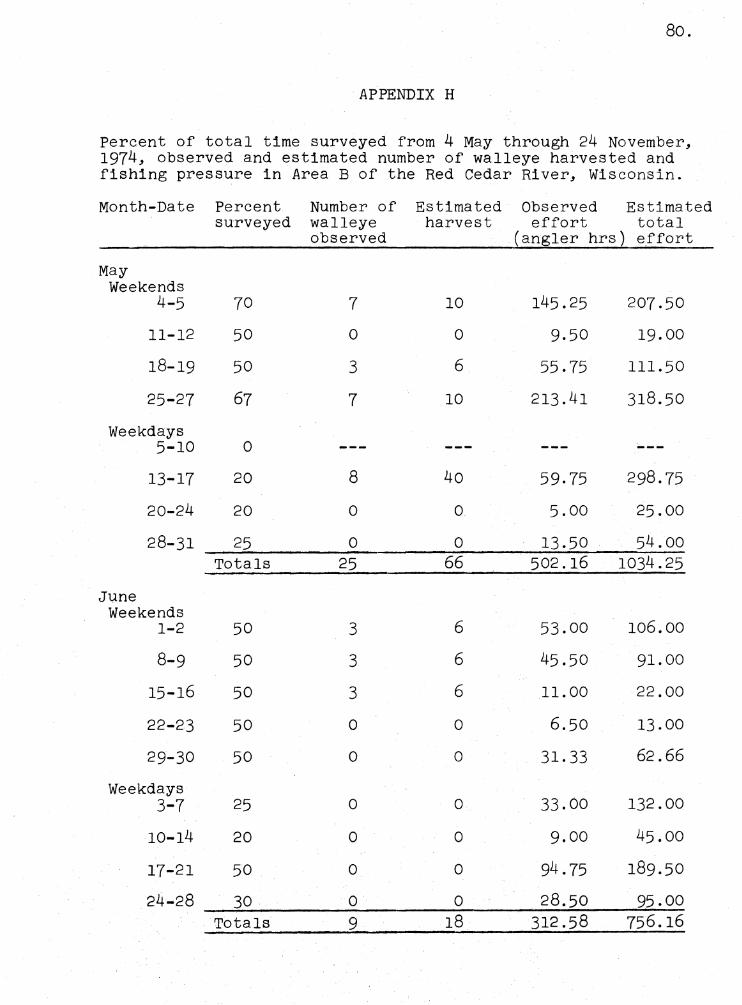
80.
APPENDIX H
Percent of total time surveyed from 4 May through 24 November, 1974, observed and estimated number of walleye harvested and fishing pressure in Area B of the Red Cedar River, Wisconsin.
Month-Date Percent Number of Estimated Observed Estimated surveyed walleye harvest effort total
observed (angler hrs) effort
May Weekends
4-5 70 7 10 145.25 207.50
11-12 50 0 0 9.50 19.00
18-19 50 3 6 55.75 111. 50
25-27 67 7 10 213.41 318.50
Weekdays 5-10 0
13-17 20 8 40 59. 75 298.75
20-24 20 0 0 5.00 25.00
28-31 25 0 0 13.50 54.oo Totals 25 66 502.16 1034.25
June Weekends
1-2 50 3 6 53.00 106.00
8-9 50 3 6 45.50 91.00
15-16 50 3 6 11.00 22.00
22-23 50 0 0 6.50 13.00
29-30 50 0 0 31.33 62.66
Weekdays 3-7 25 0 0 33.00 132.00
10-14 20 0 0 9.00 45.00
17-21 50 0 0 94. 75 189.50
24-28 30 0 0 28.50 95.00 Totals 9 18 312.58 756.16
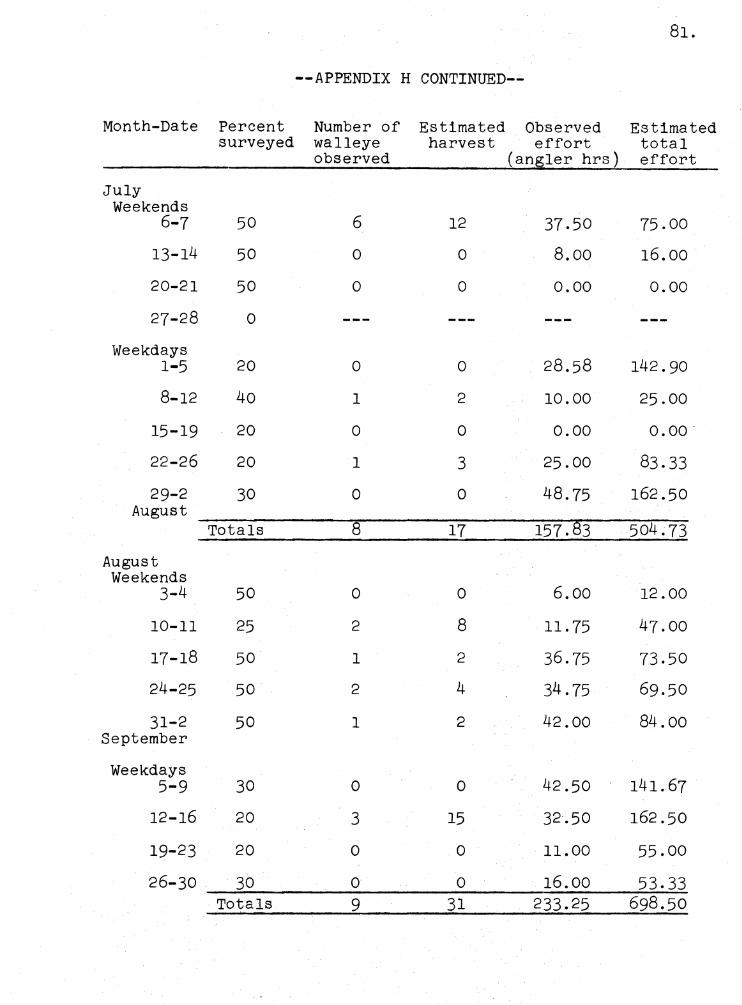
81.
--APPENDIX H CONTINUED--
Month-Date Percent Number of Estimated Observed Estimated surveyed walleye harvest effort total
observed (angler hrs) effort
July Weekends
6-7 50 6 12 37.50 75.00
13-14 50 0 0 8.00 16.00
20-21 50 0 0 0.00 0.00
27-28 0
Weekdays 1-5 20 0 0 28.58 142.90
8-12 40 1 2 10.00 25.00
15-19 20 0 0 0.00 0.00 -
22-26 20 1 3 25.00 83.33
29-2 30 0 0 48.75 162.50 August
Totals 8 17 157. 83 504. 73
August Weekends
3-4 50 0 0 6.00 12.00
10-11 25 2 8 11.75 47.00
17-18 50 1 2 36,75 73.50
24-25 50 2 4 34. 75 69,50
31-2 50 1 2 42.00 84.oo September
Weekdays 5-9 30 0 0 42.50 141.67
12-16 20 3 15 32.50 162 .50
19-23 20 0 0 11.00 55.00
26-30 30 0 0 16.00 53,33 Totals 9 31 233.25 698.50
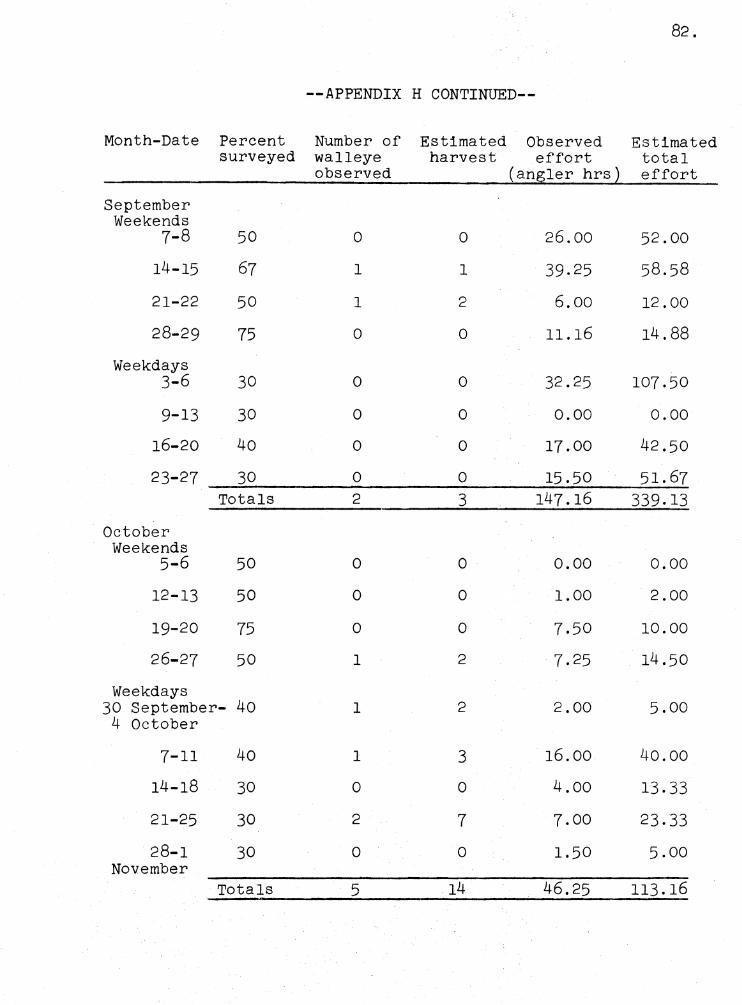
82.
--APPENDIX H CONTINUED--
Month-Date Percent Number of Estimated Observed Estimated surveyed walleye harvest effort total
observed (an~ler hrs~ effort
September Weekends
7-8 50 0 0 26.00 52.00
14-15 67 1 1 39.25 58.58
21-22 50 1 2 6.00 12.00
28-29 75 0 0 11.16 14.88
Weekdays 3-6 30 0 0 32.25 107.50
9-13 30 0 0 0.00 0.00
16-20 40 0 0 17.00 42.50
23-27 30 0 0 15.50 51.67 Totals 2 3 14 7. 16 339.13
October Weekends
5-6 50 0 0 0.00 0.00
12-13 50 0 0 1.00 2.00
19-20 75 0 0 7 .50 10.00
26-27 50 1 2 7.25 14.50
Weekdays 30 September- 40 1 2 2.00 5.00
4 October
7-11 40 1 3 16.00 40.00
14-18 30 0 0 4.00 13.33
21-25 30 2 7 7.00 23.33
28-1 30 0 0 1.50 5.00 November
Totals 5 14 46.25 113.16
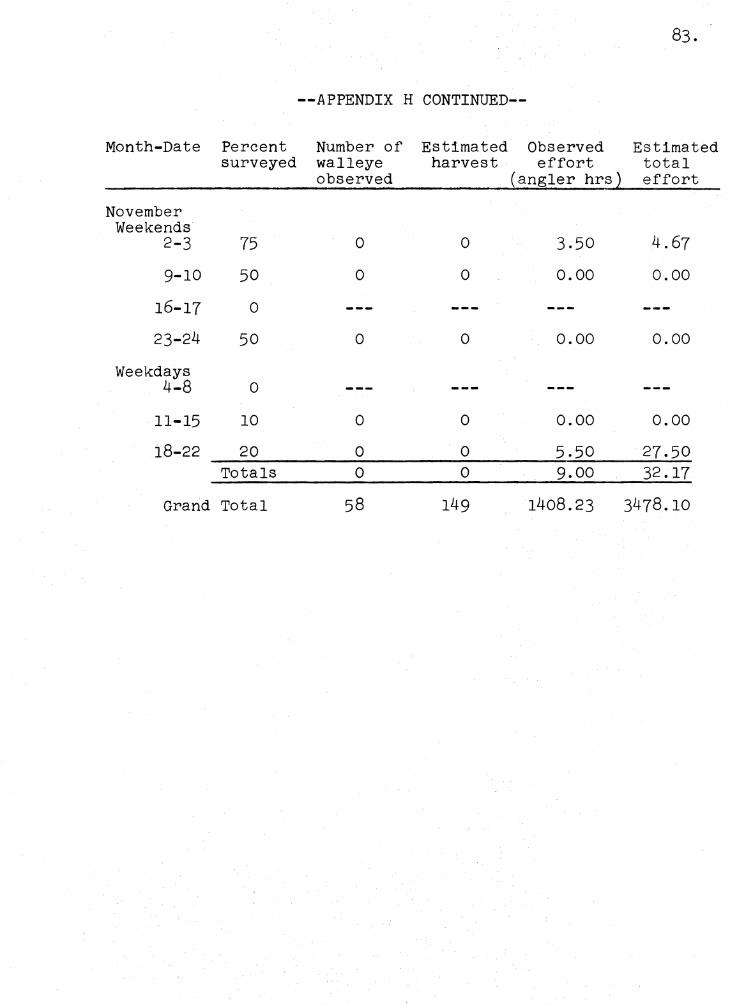
--APPENDIX H CONTINUED--
Month-Date Percent Number of Estimated Observed Estimated surveyed walleye harvest effort total
observed (angler hrs) effort
November Weekends
2-3 75 0 0 3.50 4.67
9-10 50 0 0 0.00 0.00
16-17 0
23-24 50 0 0 0.00 0.00
Weekdays 4-8 0
11-15 10 0 0 0.00 0.00
18-22 20 0 0 5.50 27.50 Totals 0 0 9.00 32.17
Grand Total 58 149 1408.23 3478.10
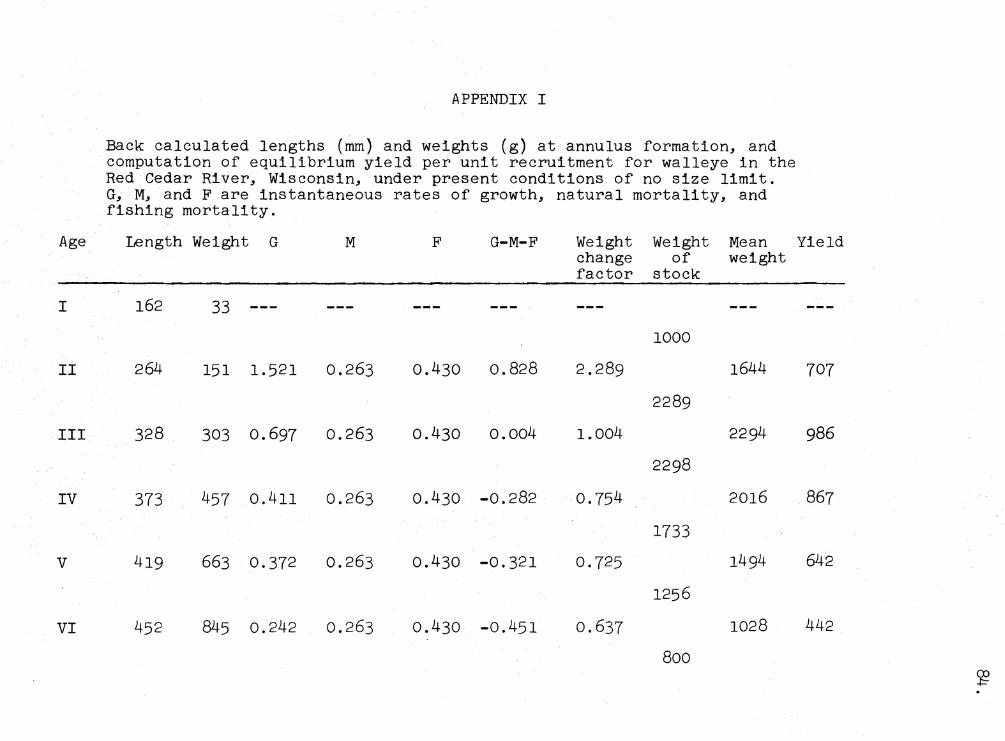
APPENDIX I
Back calculated lengths (mm) and weights (g) at annulus formation, and computation of equilibrium yield per unit recruitment for walleye in the Red Cedar River, Wisconsin, under present conditions of no size limit. G, M, and Fare instantaneous rates of growth, natural mortality, and fishing mortality.
Age Length Weight G M F G-M-F Weight Weight Mean Yield change of weight factor stock
I 162 33
1000
II 264 151 1.521 0.263 o.430 0.828 2.289 1644 707
2289
III 328 303 0.697 0.263 o.430 0.004 1.004 2294 986
2298
IV 373 457 o.411 0.263 o.430 -0.282 0.754 2016 867
1733
V 419 663 0.372 0.263 o.430 -0.321 0.725 1494 642
1256
VI 452 845 0.242 0.263 o.430 -0.451 0.637 1028 442
800 a:, .f;:-.
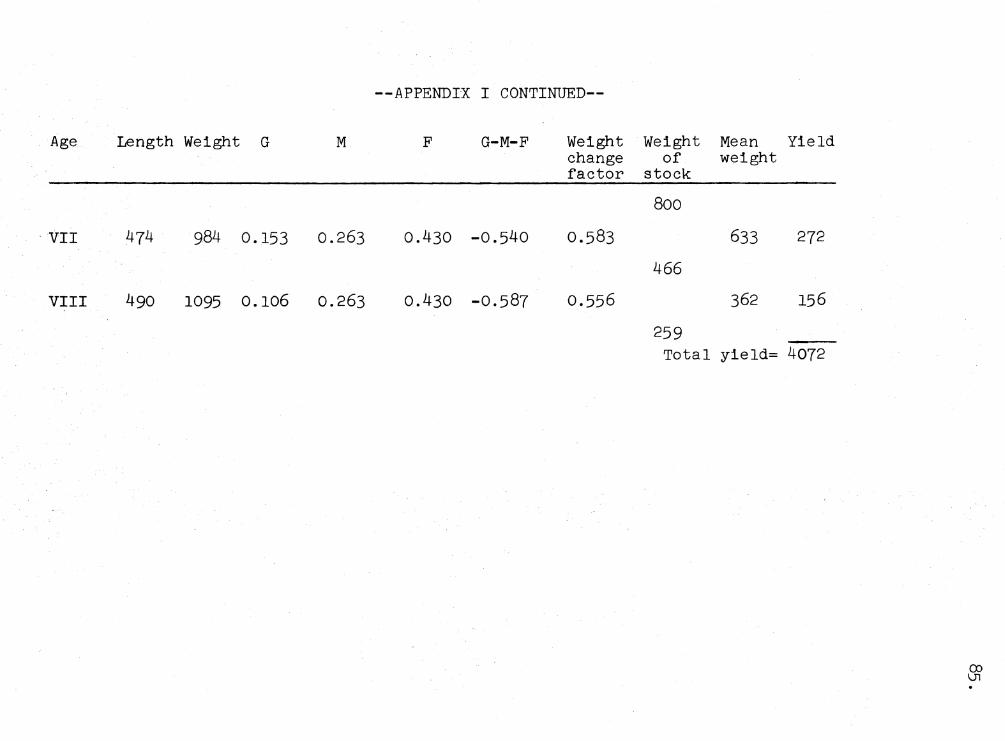
--APPENDIX I CONTINUED--
Age Length Weight G M F G-M-F Weight change factor
· VII 474 984 0.153 0.263 o.430 -0.540 0.583
VIII 490 1095 0.106 0.263 o.430 -0.587 0.556
Weight of
stock
800
466
259 Total
Mean weight
633
362
yield=
Yield
272
156
4072
(X) \.J7 .
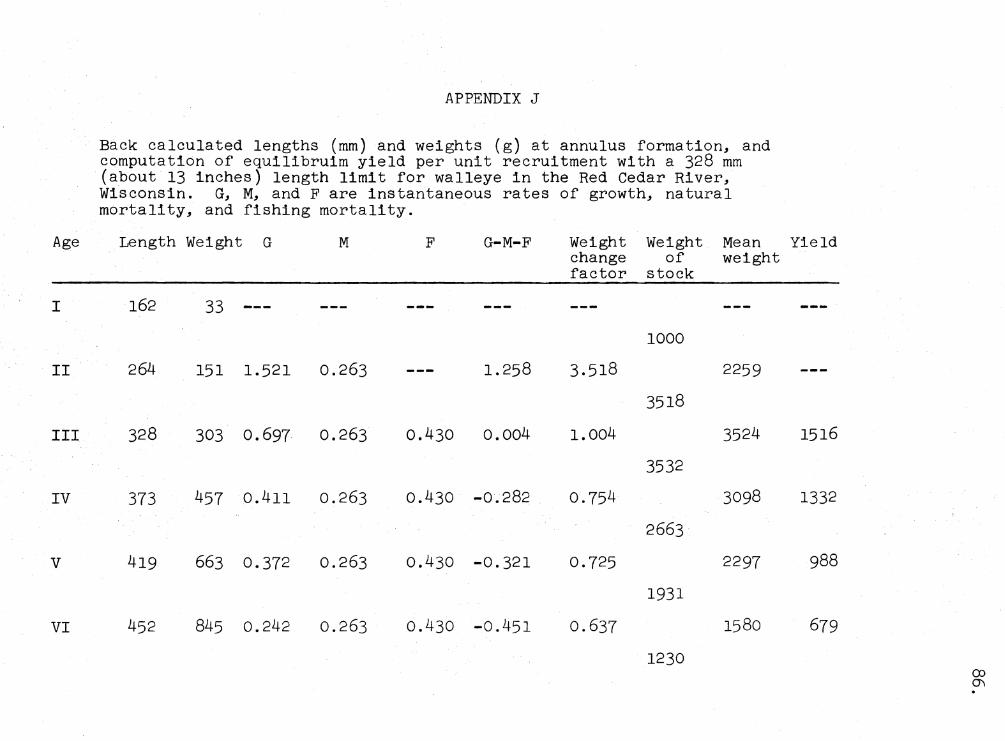
APPENDIX J
weights at annulus formation, Back calculated lengths (mm) and (g) computation of equilibruim yield per unit recruitment with a 328 mm (about 13 inches) length limit for walleye in the Red Cedar River,
and
Wisconsin. G, M, and Fare instantaneous rates of growth, natural mortality, and fishing mortality.
Age Length Weight G M F G-M-F Weight Weight Mean Yield change of weight factor stock
I 162 33
1000
II 264 151 1.521 0.263 1.258 3.518 2259
3518
III 328 303 0.697 0.263 o.430 0.004 1.004 3524 1516
3532
IV 373 457 o.411 0.263 o.430 -0.282 0,754 3098 1332
2663
V 419 663 0.372 0.263 o.430 -0.321 0.725 2297 988
1931
VI 452 845 0.242 0.263 o.430 -0.451 0.637 1580 679
1230 (X) O'\ .
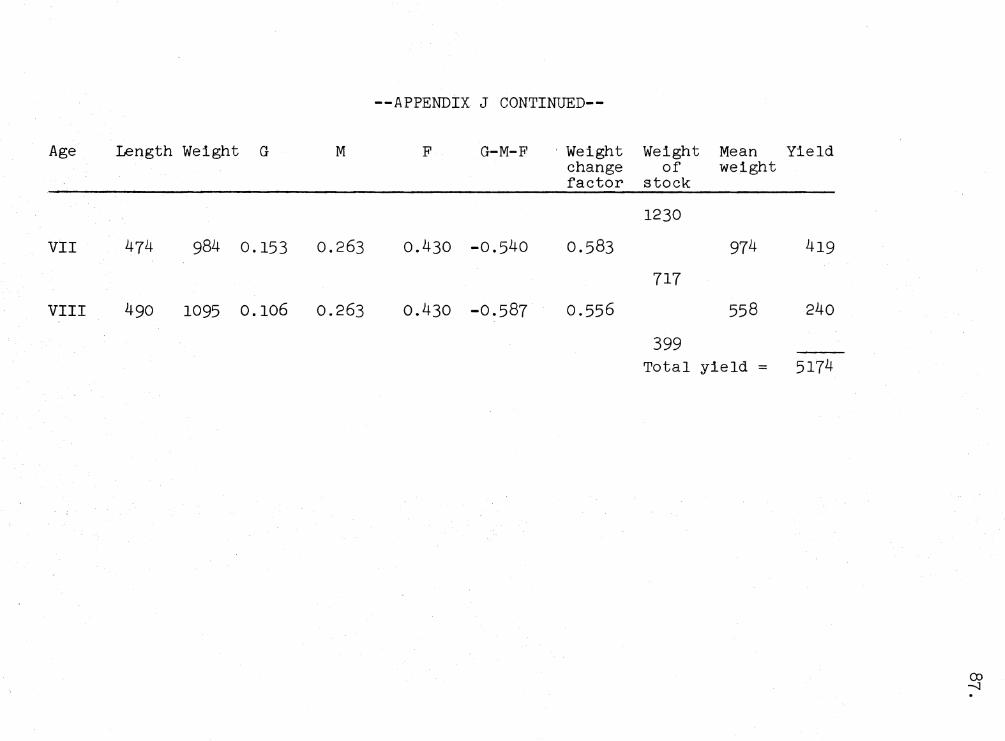
--APPENDIX J CONTINUED--
Age Length Weight G M F G-M-F · Weight change factor
VII 474 984 0.153 0.263 o.430 -0. 540 0.583
VIII 490 1095 0.106 0.263 o.430 -0.587 0,556
Weight of
stock
1230
717
399 Total
Mean weight
974
558
yield =
Yield
419
240
5174
(X) --,;J .
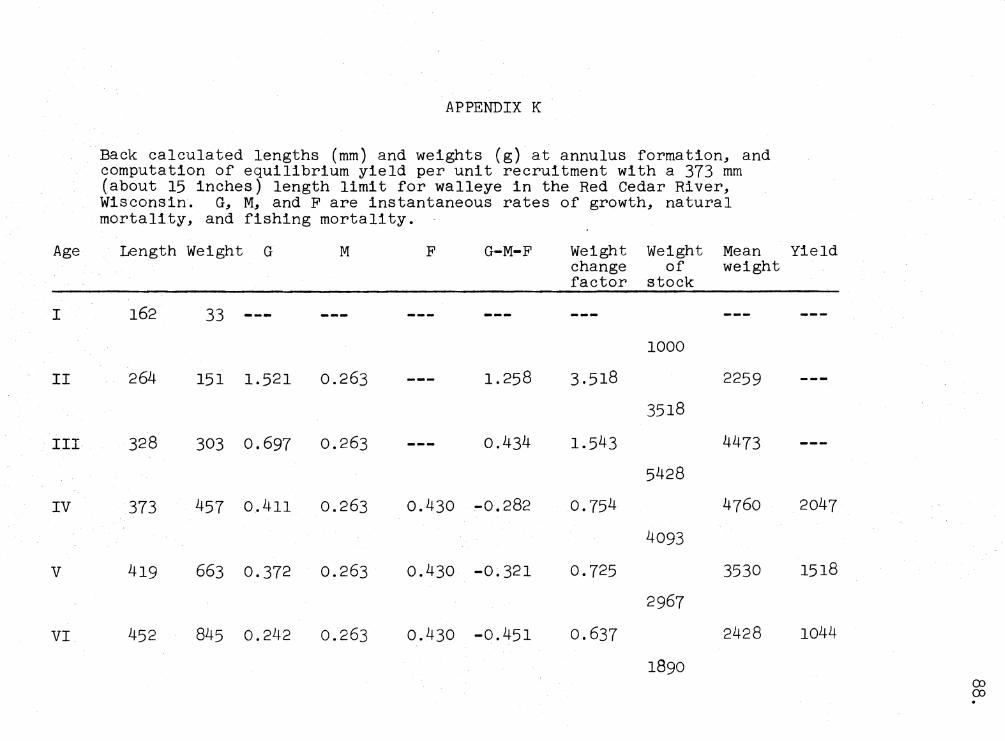
APPENDIX K
Back calculated lengths (mm) and weights (g) at annulus formation, and computation of equilibrium yield per unit recruitment with a 373 mm (about 15 inches) length limit for walleye in the Red Cedar River, Wisconsin. G, M, and Fare instantaneous rates of growth, natural mortality, and fishing mortality.
Age Length Weight G M F G-M-F Weight Weight Mean Yield change of weight factor stock
I 162 33
1000
II 264 151 1.521 0.263 1.258 3.518 2259
3518
III 328 303 0.697 0.263 o.434 1.543 4473
5428
IV 373 457 o.411 0.263 o.430 -0.282 0.754 4760 2047
4093
V 419 663 0.372 0.263 o.430 -0.321 0.725 3530 1518
2967
VI 452 845 0.242 0.263 o.430 -0. 451 o.637 2428 1044
1890 O'.) O'.) .
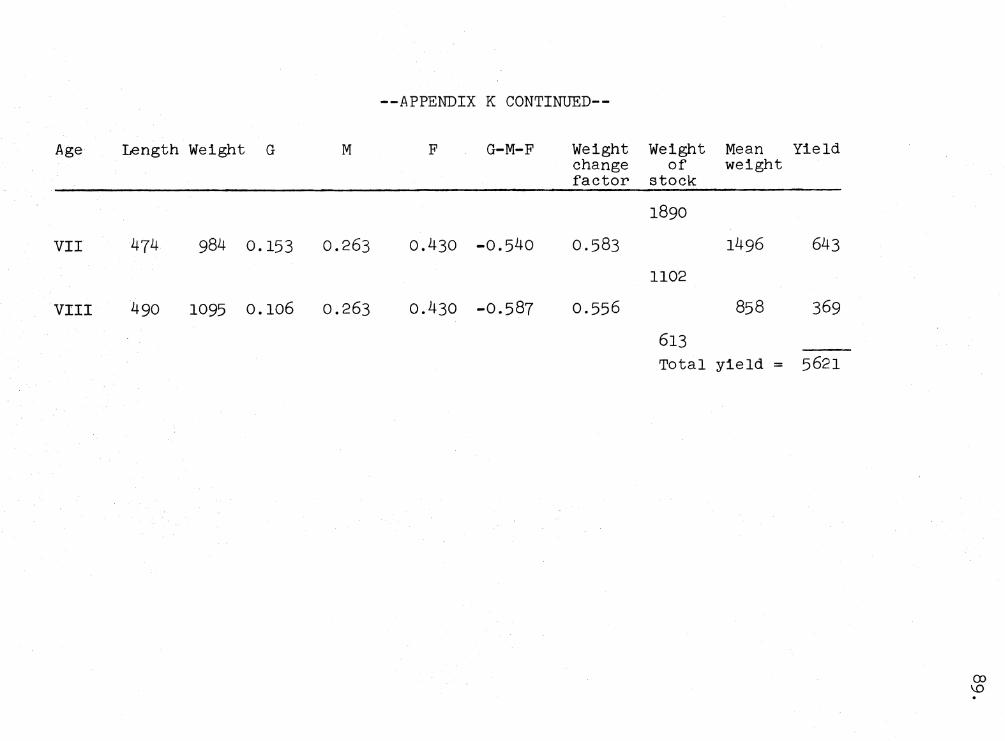
--APPENDIX K CONTINUED--
Age Length Weight G M F G-M-F Weight change factor
VII 474 984 0.153 0.263 o.430 -0.540 0.583
VIII 490 1095 0.106 0.263 o.430 -0. 587 0,556
Weight of
stock
1890
1102
613 Total
Mean weight
1496
858
yield =
Yield
643
369
5621
CX> \0 .
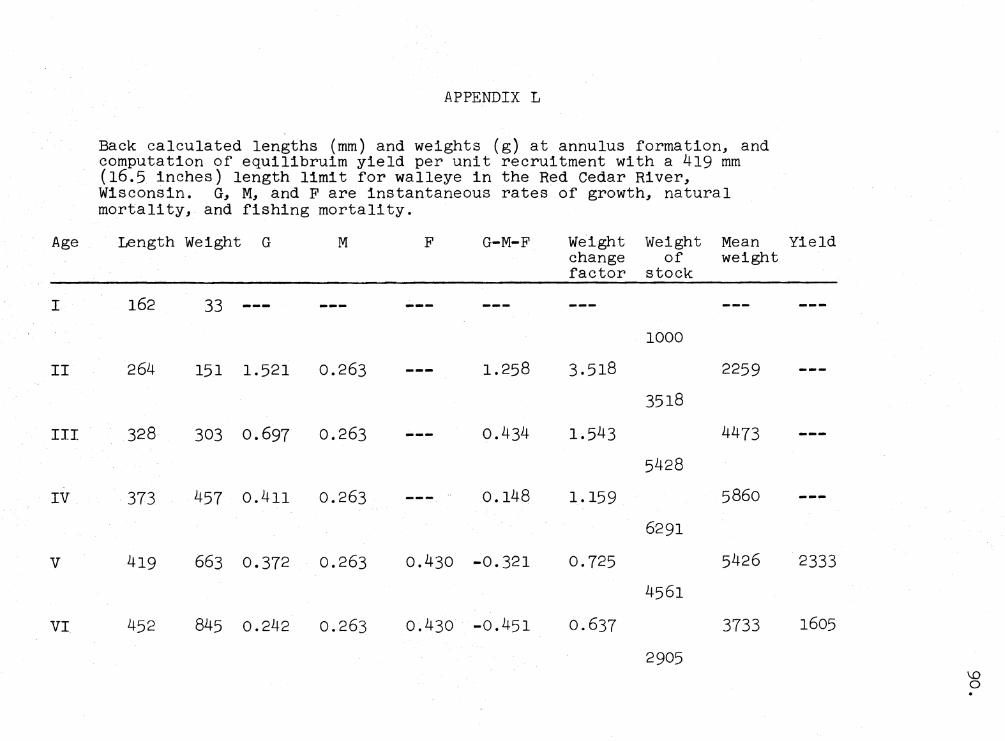
APPENDIX L
Back calculated lengths (mm) and weights (g) at annulus formation, and computation of equilibruim yield per unit recruitment with a 419 mm (16.5 inches) length limit for walleye in the Red Cedar River, Wisconsin. G, M, and Fare instantaneous rates of growth, natural mortality, and fishing mortality.
Age Length Weight G M F G-M-F Weight Weight Mean Yield change of weight factor stock
I 162 33
1000
II 264 151 1.521 0.263 1.258 3.518 2259
3518
III 328 303 0.697 0.263 o.434 1.543 4473
5428
IV 373 457 o.411 0.263 0.148 1.159 5860
6291
V 419 663 0.372 0.263 o.430 -0.321 0.725 5426 2333
4561
VI 452 845 0.242 0.263 o.430 -o.451 0.637 3733 1605
2905 \..0 0 .
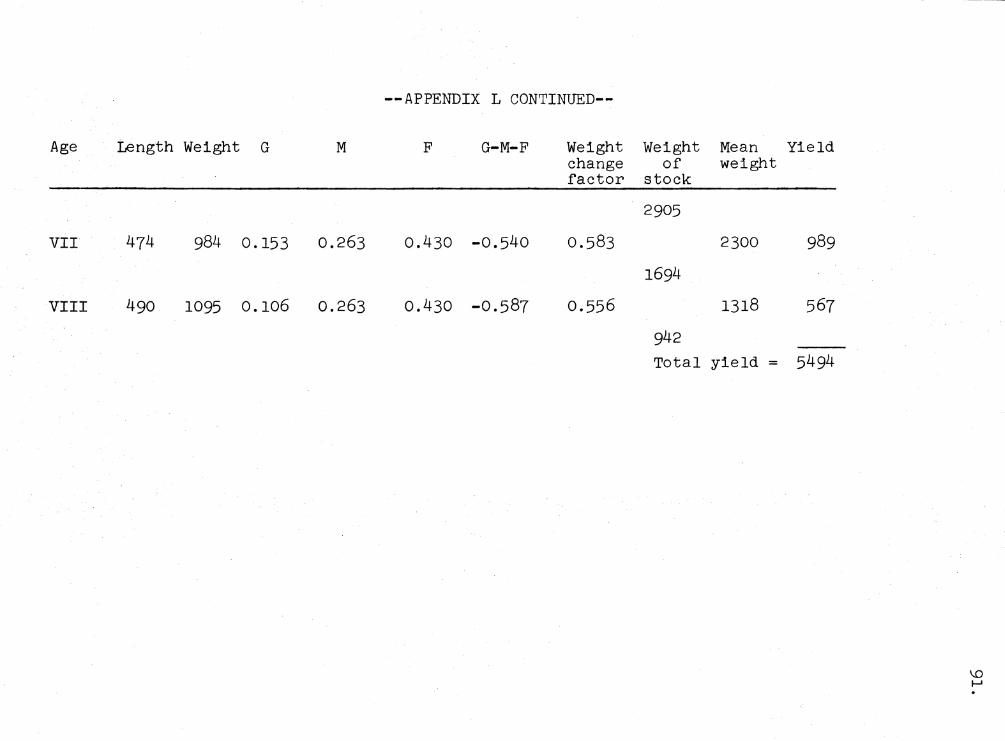
--APPENDIX L CONTINUED--
Age Length Weight G M F G-M-F Weight change factor
VII 474 984 0.153 0.263 o.430 -0.540 0.583
VIII 490 1095 0.106 0.263 o.430 -0.587 0.556
Weight of
stock
2905
1694
942 Total
Mean weight
2300
1318
yield =
Yield
989
567
5494
\.0 f--' .
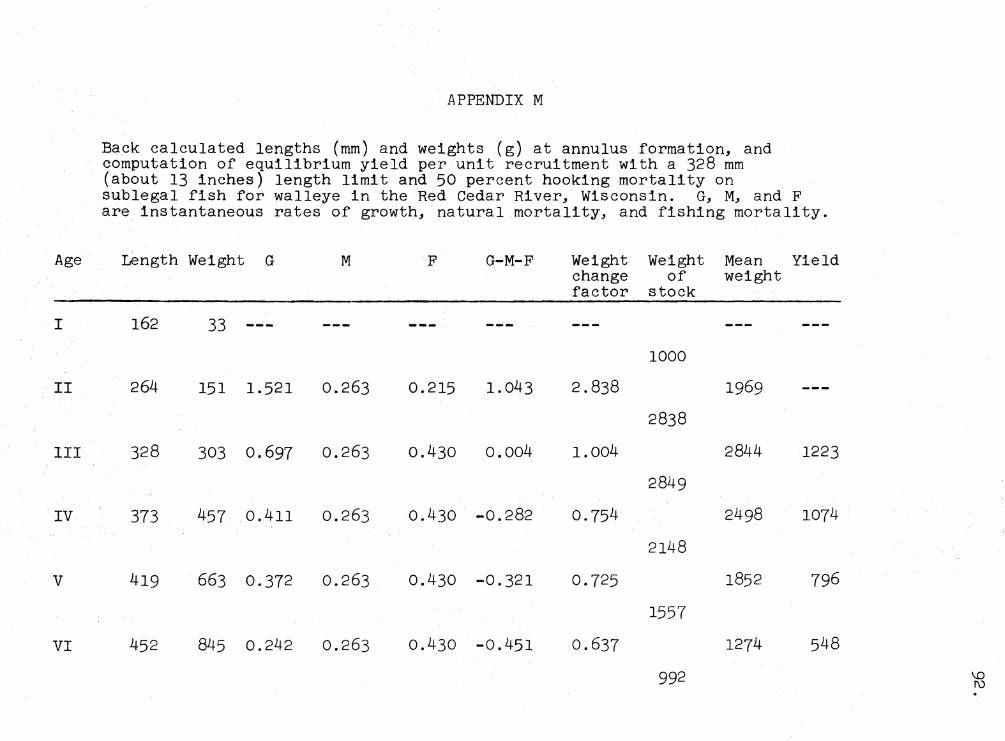
Age
I
II
III
IV
V
VI
APPENDIX M
Back calculated lengths (mm) and weights (g) at annulus formation, and computation of equilibrium yield per unit recruitment with a 328 mm (about 13 inches) length limit and 50 percent hooking mortality on sublegal fish for walleye in the Red Cedar River, Wisconsin. G, M, and F are instantaneous rates of growth, natural mortality, and fishing mortality.
Length Weight G M F G-M-F
162 33
264 151 1.521 0.263 0.215 1.043
328 303 0.697 0.263 o.430 0.004
373 457 0.411 0.263 o.430 -0.282
419 663 0.372 0.263 o.430 -0.321
452 845 0.242 0.263 0.430 -0.451
Weight change factor
2.838
1.004
0.754
0.725
o.637
Weight of
stock
1000
2838
2849
2148
1557
992
Mean Yield weight
2844 1223
1074
796
1274 548
\.0 f\) .
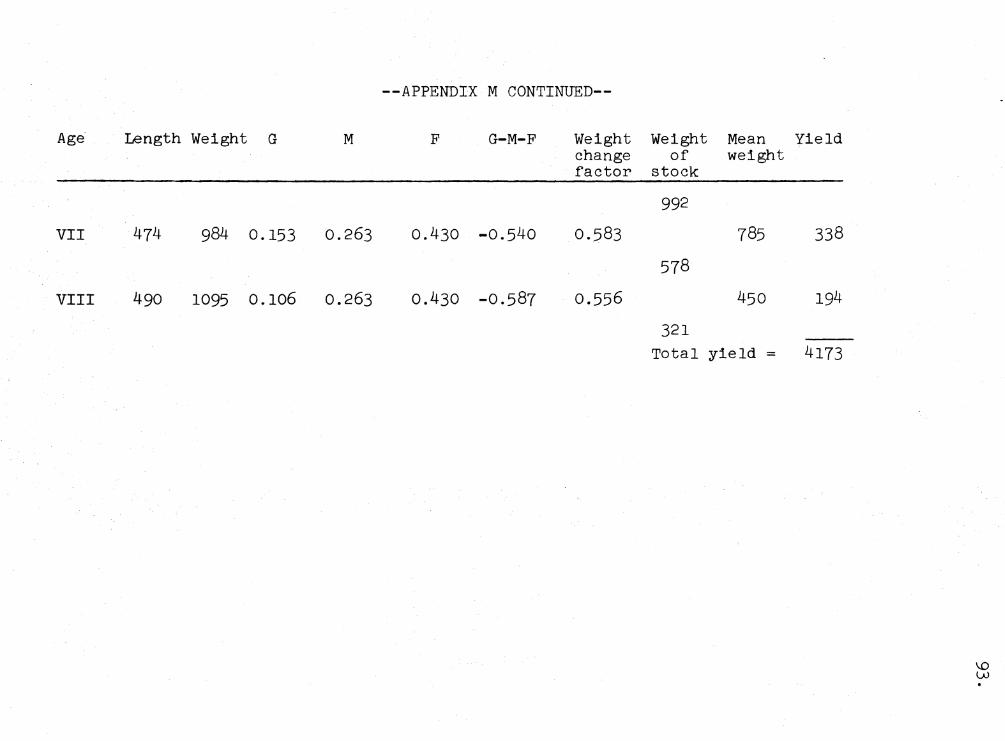
--APPENDIX M CONTINUED--
Age Length Weight G M F G-M-F Weight change factor
VII 474 984 0.153 0.263 o.430 -0.540 0.583
VIII 490 1095 0.106 0.263 o.430 -0.587 0.556
Weight Mean of weight
stock
992
785
578
450
321 Total yield =
Yield
338
194
4173
\.0 lA.l .

Age
I
II
III
IV
V
VI
APPENDIX N
Back calculated lengths (mm) and weights (g) at annulus formation, and computation of equilibruim yield per unit recruitment with a 373 mm (about 15 inches) length limit and 50 percent hooking mortality on sublegal fish for walleye in the Red Cedar River, Wisconsin. G, M, and F are instantaneous rates of growth, natural mortality, and fishing mortality.
Length Weight G M F G-M-F
162 33
264 151 1.521 0.263 0.215 1.043
328 303 0.697 0.263 0.215 0.219
373 457 o.411 0.263 o.430 -0.282
419 663 0.372 0.263 o.430 -0.321
452 845 0.242 0.263 o.430 -o.451
Weight change factor
2.838
1.245
0.754
0.725
0.637
Weight of
stock
1000
3533
2664
1931
1230
Mean Yield weight
3186
3098 1332
2298 988
1580 679
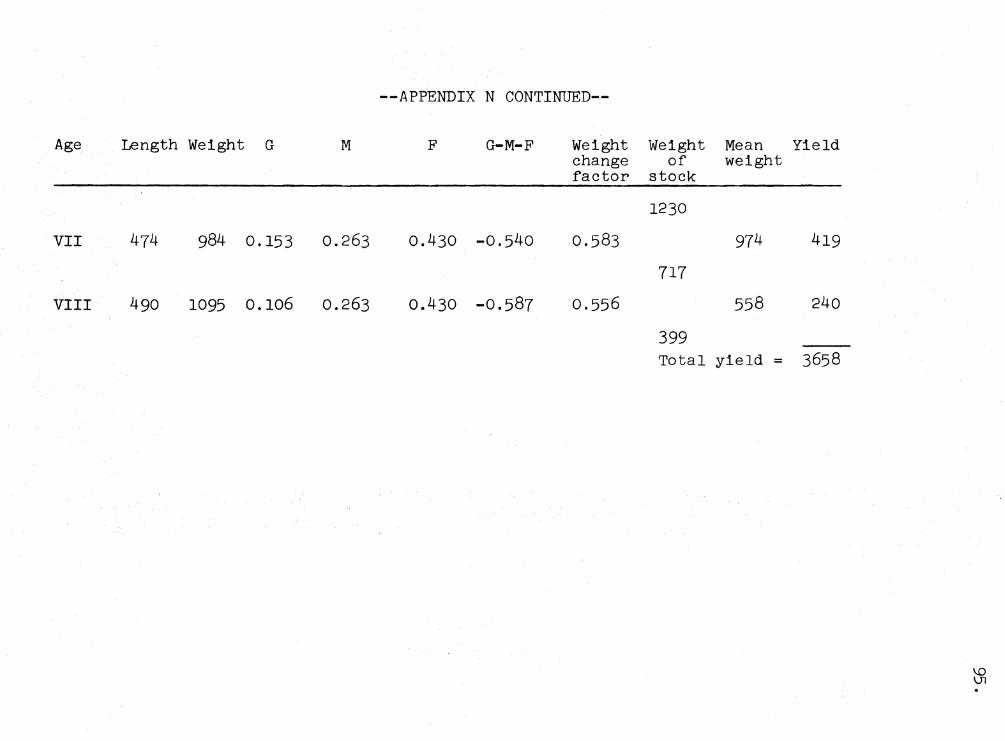
--APPENDIX N CONTINUED--
Age Length Weight G M F G-M-F Weight change factor
VII 474 984 0.153 0.263 o.430 -0.540 0.583
VIII 490 1095 0.106 0.263 o.430 -0.587 0.556
Weight Mean of weight
stock
1230
974
717
558
399 Total yield =
Yield
419
240
3658
\..0 Vl .
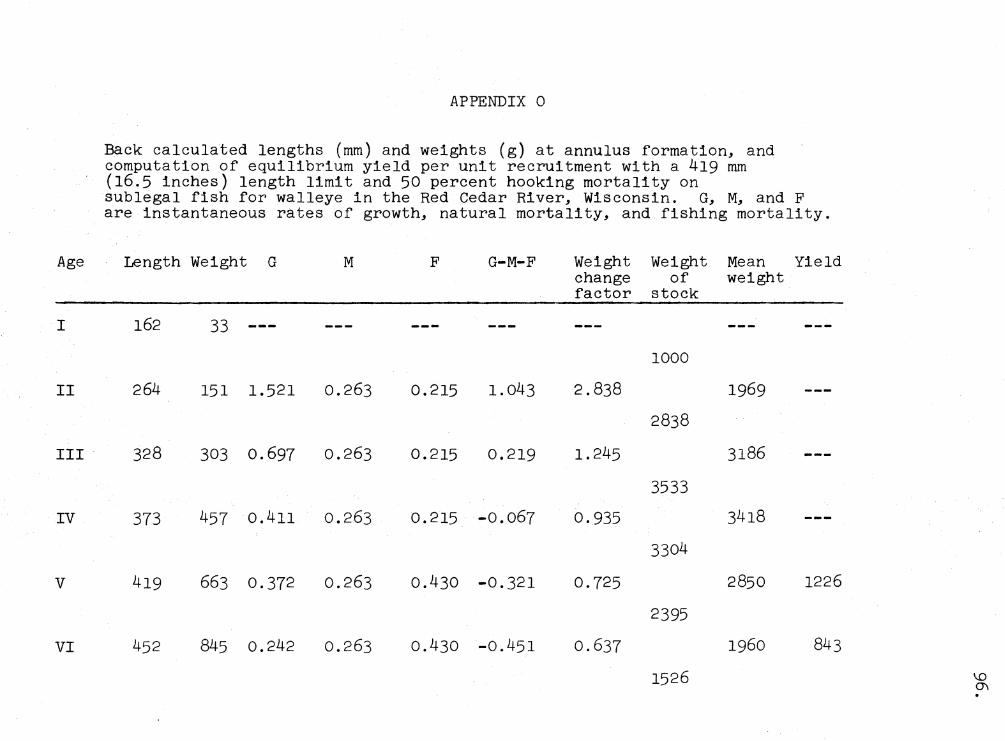
Age
I
II
III
IV
V
VI
APPENDIX 0
Back calculated lengths (mm) and weights (g) at annulus formation, and computation of equilibrium yield per unit recruitment with a 419 mm (16.5 inches) length limit and 50 percent hooking mortality on sublegal fish for walleye in the Red Cedar River, Wisconsin. G, M, and F are instantaneous rates of growth, natural mortality, and fishing mortality.
Length Weight G M F G-M-F
162 33
264 151 1.521 0.263 0.215 1.043
328 303 0.697 0.263 0.215 0.219
373 457 o.411 0.263 0.215 -0.067
419 663 0,372 0.263 o.430 -0.321
452 845 0.242 0.263 o.430 -o.451
Weight change factor
2,838
1.245
0.935
0.725
0.637
Weight of
stock
1000
2838
3533
3304
2395
1526
Mean Yield weight
3186
2850 1226
1960 843
'-0 O'\ .
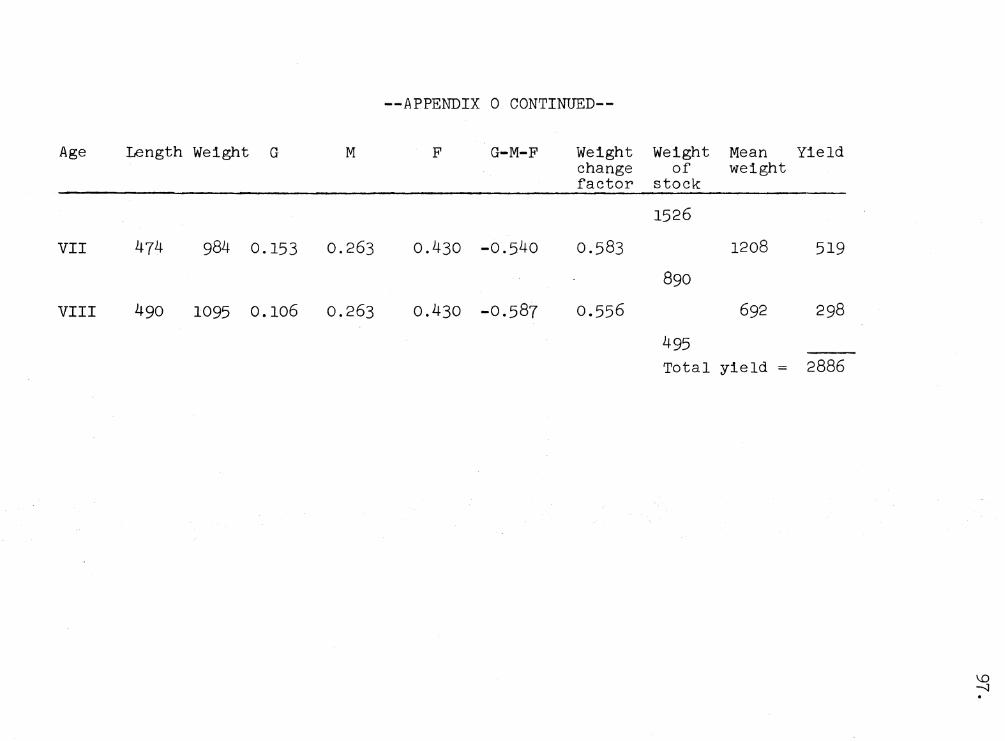
--APPENDIX 0 CONTINUED--
Age Length Weight G M F G-M-F Weight Weight Mean Yield change of weight factor stock
1526
VII 474 984 0.153 0.263 o.430 -0.540 0.583 1208 519
890
VIII 490 1095 0.106 0.263 o.430 -0.587 0.556 692 298
495 Total yield = 2886