1968 hoek brittle fracture of rock - rocscience · boundary exceeds the local tensile strength of...
TRANSCRIPT
Brittle Fracture of Rock
Evert Hoek
Chapter 4 in Rock Mechanics in Engineering Practice
Edited by K.G. Stagg and O.C. Zienkiewicz
London: J. Wiley, 99 to 124
1968
Brittle fracture of rock
2
4.1 Introduction
In chapters 1 and 2 the mechanical properties of rock materials have been discussed in
some detail and it has been shown that most rocks exhibit patterns of behaviour which
can be usefully employed by the practical engineer. Since most of the conclusions
presented in chapters 1 and 2 are based upon empirical studies it is of interest to examine
the basic mechanism of brittle failure of rock in order to gain some understanding of the
underlying reasons for the behaviour patterns which are observed. Not only does such an
examination satisfy the curiosity of the academically inclined but it also provides a basis
for meaningful extrapolation from available experimental results.
A comprehensive review of the research effort which has been devoted to the study of the
brittle failure of rock has recently been presented by Jaeger (1966). Rather than present
yet another review on the theoretical aspects of this subject the author has chosen to
present the known physical facts in a form which will be both meaningful and useful to
the practical engineer. In order to achieve this end within the limited space available in
this chapter, the dynamic aspects of rock fracture have been ignored and the discussion is
limited to failure under quasi-static loading conditions such as those which can be
expected to occur in rock structures.
4.2 Fracture initiation
A rock material contains a large number of randomly oriented zones of potential failure
in the form of grain boundaries. Let us assume that one such grain boundary, illustrated
in figure 4.1, contains a number of open flaws and that, in accordance with the concept
postulated by Griffith (1921, 1924), these flaws are approximately elliptical in shape. It
can be shown that very high tensile stresses occur on the boundary of a suitably oriented
elliptical opening, even under compressive stress conditions, and it is assumed that
fracture initiates from the boundary of an open flaw when the tensile stress on this
boundary exceeds the local tensile strength of the material.
In order to obtain an estimate of the stresses around the boundary of an open elliptical
flaw it is necessary to make the following simplifying assumptions:
a) The ellipse can be treated as a single opening in a semi-infinite elastic medium, i.e.
adjacent flaws do not interact and local variations in material properties are ignored.
b) The ellipse and the stress system which acts upon the material surrounding it can be
treated two dimensionally, i.e. the influence of the three-dimensional shape of a flaw and
of the stress zσ in the crack plane can be ignored.
Brittle fracture of rock
3
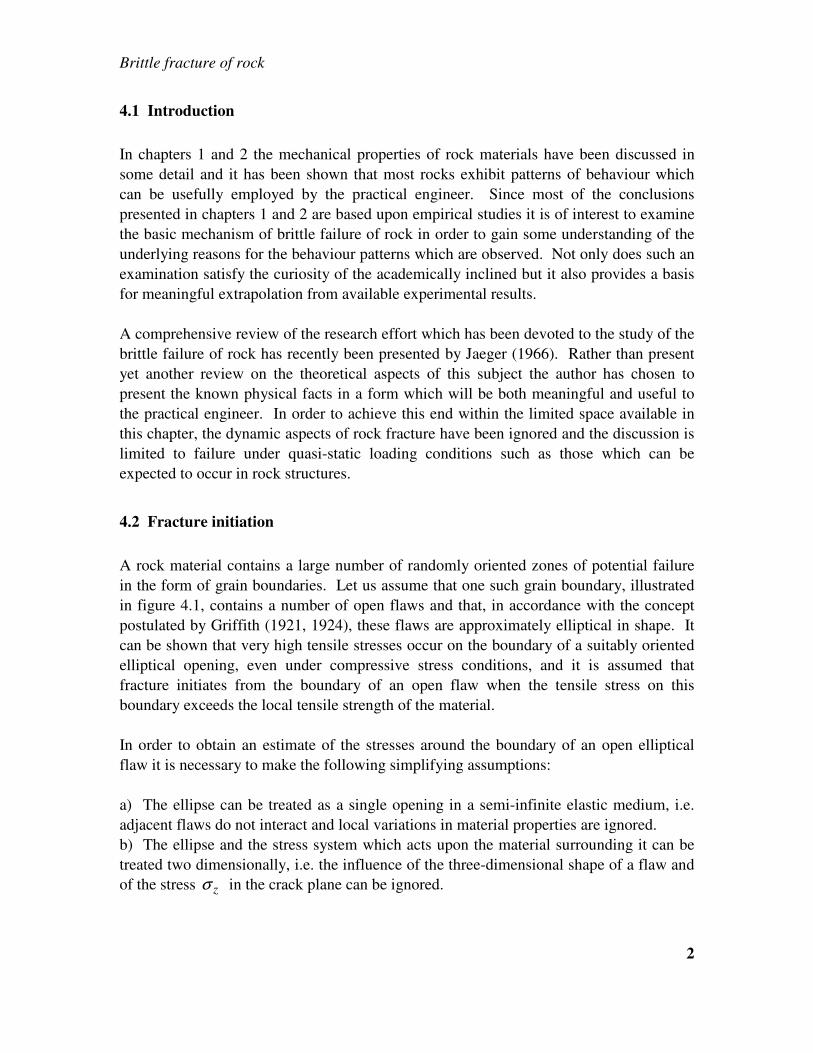
Figure 4.1 Stress system acting on a potential failure plane in rock.
Although these assumptions do introduce certain errors (Jaeger 1966), the magnitude of
these errors is estimated to be less than ± 10% which is within the order of accuracy
aimed at in this analysis.
The stress system acting upon the grain boundary under consideration is shown in Figure
4.1. The convention adopted in this analysis is such that compression is regarded as
positive and that 321 σσσ >> where 21, σσ and 3σ are the three principal stresses
acting on the rock body. The elliptical flaw is inclined at an angle β to the major stress
direction, i.e. the direction of maximum compressive stress. The normal stress yσ and
the shear stress xyτ which act on the material surrounding the elliptical flaw are related
to the maximum and minimum principal stresses 1σ and 3σ by the following equations:
( ) ( ) βσσσσσ 2cos2 3131 −−+=y (4.1)
( ) βσστ 2sin2 31 −=xy (4.2)
Brittle fracture of rock
4
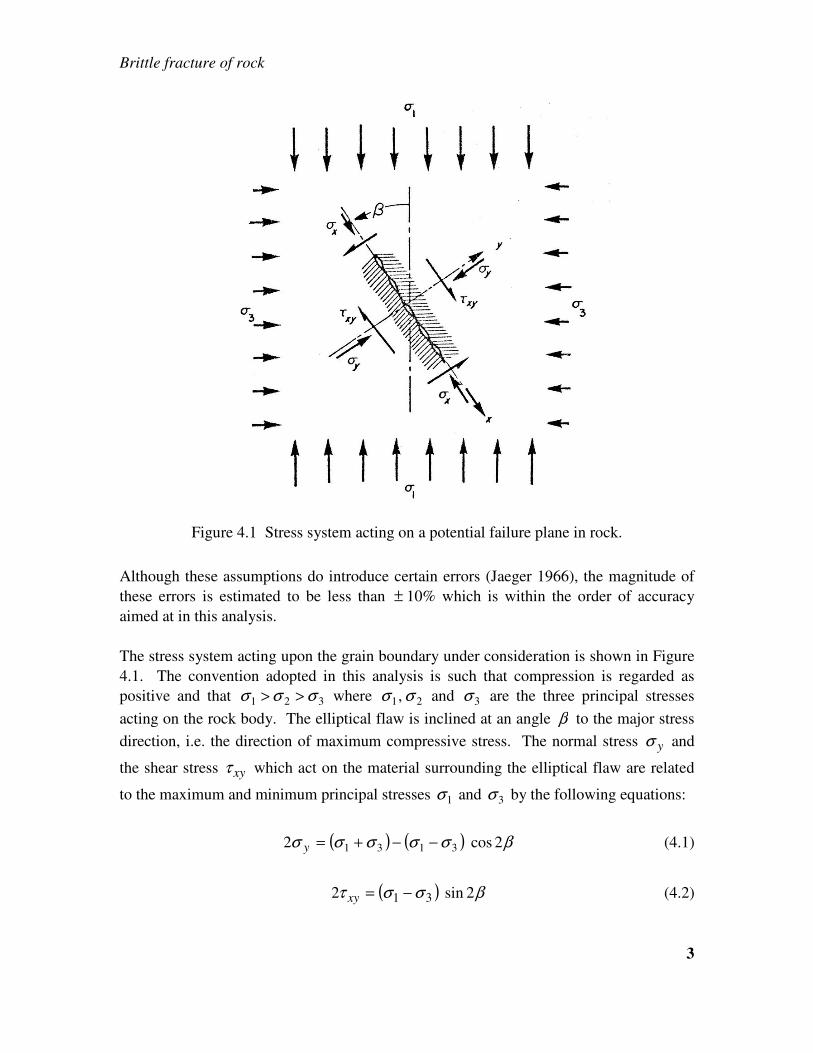
Equation of ellipse:
,sin
,cos
α
α
⋅=
⋅=
by
ax
where α is the eccentric angle;
,tantan αθ ⋅= m
where ./ abm =
Figure 4.2 Stresses acting on the material surrounding a two-dimensional
elliptical flaw.
The stress xσ which acts parallel to the axis of the elliptical flaw and the intermediate
principal stress zσ which acts in the z direction will be shown to have a negligible
influence upon the stresses near the tip of the flaw and can be ignored.

Brittle fracture of rock
5
In the discussion which follows, the stress system will be discussed in terms of the
normal and shear stresses yσ and xyτ only. The interested reader can revert to the
principal stresses 1σ and 3σ at any stage of the analysis by substitution of the relations
given in equations (4.1) and (4.2).
The parameters which define the boundary of the elliptical flaw are given in Figure 4.2
and, of these, the most important are the ratio of the minor to the major axis of the ellipse
mab =/ and the eccentric angle α which defines the position of a point on the boundary
of the ellipse. The tangential stress on the boundary of the ellipse bσ is given by the
following equation (Inglis 1913; Denkhaus 1964):
( ){ } ( ){ } ( ){ }αα
ααταασαασσ
222
222222
sincos
cossin12cossin21sincos2
+
+−−++−+=
m
mmmmm xyxyb
(4.3)
In a material such as rock it can be assumed that the elliptical flaws will have a very
small axis ratio m , i.e. they will be very flat in shape. This means that the maximum
tensile stress will occur near the tip of the elliptical flaw, i.e. when the eccentric angle α
is very small. When ααα →→ sin,0 and 1cos →α . Substitution of these relations
into equation (4.3) and neglecting terms of the second order and higher which appear in
the numerator gives the following approximate expression for the boundary stress bσ
near the tip of the elliptical flaw:
( )22
2
α
ατσσ
+
⋅−⋅=
m
m xyyb (4.4)
An important fact which emerges from this simplification is that the stress xσ , which lies
parallel to the major axis of the ellipse, has a negligible influence upon the boundary
stress near the tip of the flaw. By analogy the influence of the intermediate principal
stress zσσ =2 can also be ignored.
The maximum tangential stress on the boundary of the elliptical flaw is given when
,0=α
σ
d
d b
i.e. when
Brittle fracture of rock
6
αατστα 2)(2)2)(( 22 ⋅−⋅=−+ xyyxy mm
Giving
,α
τσ
xyb
−= (4.5)
Or, rearranging in terms of 1/ :α
01
121
22=−⋅
⋅+
mm xy
y
τ
σ
α (4.6)
Solving equation (4.6) for 1/α :
( )
+±⋅
= 2211xyyy
xymτσσ
τα (4.7)
From equations (4.5) and (4.7)
( )22xyyyb m τσσσ +±−=⋅ (4.8)
The assumed criterion for fracture initiation is that a crack will propagate from the
boundary of the elliptical flaw when the tangential stress bσ reaches a limiting value
equal to the tensile strength of the material at that point. Since it is not practical to
measure either the local tensile strength of the material surrounding the flaw or the axis
ratio m, it is convenient to express the term mb ⋅σ in equation (4.8) in terms of a quantity
which can be measured more readily. Such a quantity is the uniaxial tensile strength tσ
of the rock body which contains the flaw under consideration and this is obtained when
ty σσ = and 0=xyτ giving
tb m σσ 2−=⋅ (4.9)
Substituting this relation into equation (4.8) and squaring both sides of the resulting
equation gives
( )yttxy σσστ −= 42 (4.10)
This equation, which is the equation of a parabola in the yxy στ − plane, defines the
Brittle fracture of rock
7
relation between the shear and normal stresses xyτ and yσ at which fracture initiates on
the boundary of an open elliptical flaw. Note that, in substituting a numerical value for
the uniaxial tensile strength tσ , it is necessary to include a negative sign in order to
satisfy the sign convention adopted in this chapter. Hence a particular rock will have a
uniaxial tensile strength of -2000 lb/in2.
4.3 Fracture propagation
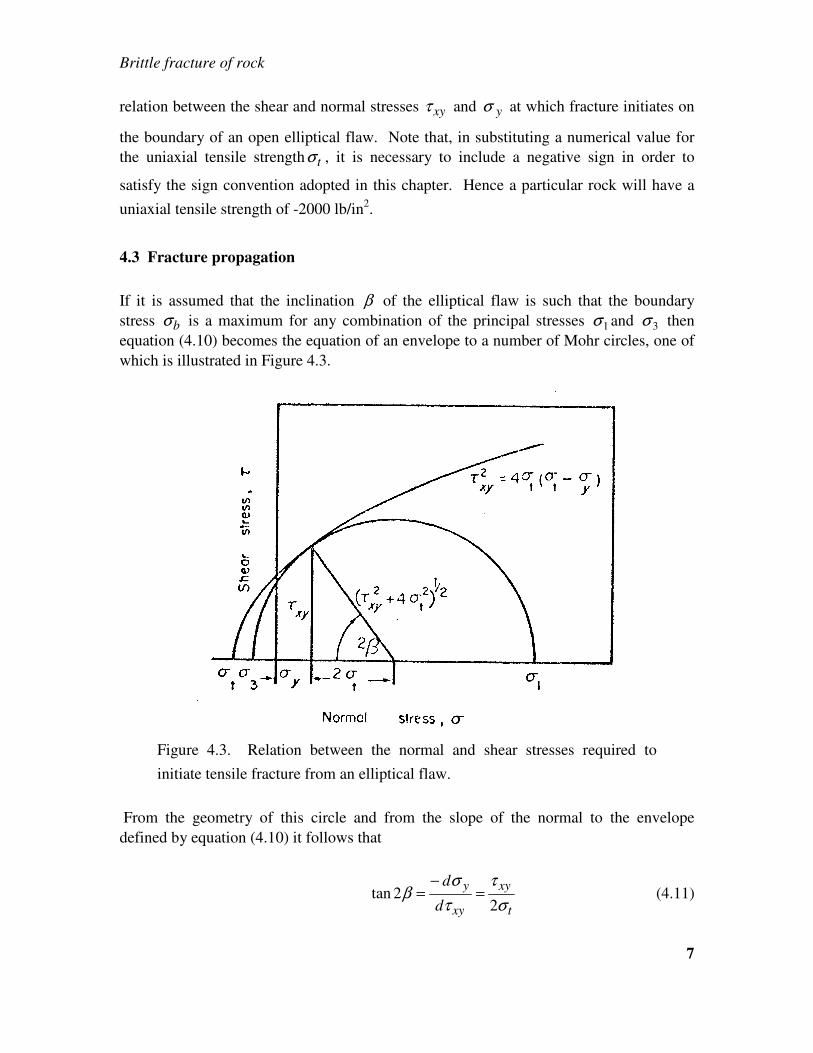
If it is assumed that the inclination β of the elliptical flaw is such that the boundary
stress bσ is a maximum for any combination of the principal stresses 1σ and 3σ then
equation (4.10) becomes the equation of an envelope to a number of Mohr circles, one of
which is illustrated in Figure 4.3.
Figure 4.3. Relation between the normal and shear stresses required to
initiate tensile fracture from an elliptical flaw.
From the geometry of this circle and from the slope of the normal to the envelope
defined by equation (4.10) it follows that
t
xy
xy
y
d
d
σ
τ
τ
σβ
22tan =
−= (4.11)
Brittle fracture of rock
8
From equations (4.5) and (4.9)
α
τσσ
xytb
mm
⋅−==⋅ 2 ,
hence
βσ
τα 2tan
2⋅−=
⋅−= m
m
t
xy, (4.12)
which defines the relations between the position of the maximum tensile stress on the
boundary of the elliptical flaw (α ) and the inclination of this flaw ( β ) to the direction of
the minimum principal stress 3σ .
Since fracture is assumed to occur when the tangential stress on the boundary of the flaw
exceeds the local tensile strength of the material, it can be assumed that the crack will
propagate in a direction which is normal to the boundary of the ellipse. The normal to the
ellipse defined by the equation given in Figure 4.2 is defined by
dy
dx−=γtan ,
where
⋅⋅=
⋅⋅−=
αα
αα
dmady
dadx
cos
sin (4.13)
Hence
m
αγ
tantan = (4.14)
But, since α is small, tan αα → , hence
βα
γ 2tantan −==m
(4.15)
or
βγ 2−= or ( )βπ 2− (4.16)
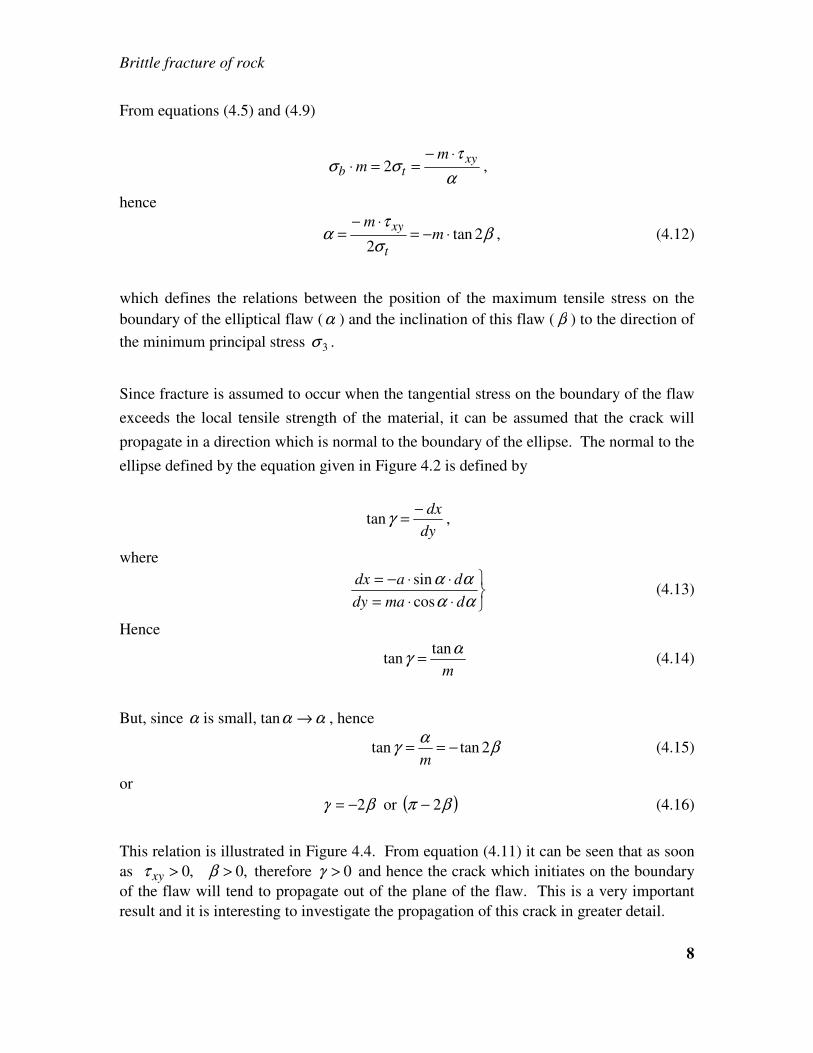
This relation is illustrated in Figure 4.4. From equation (4.11) it can be seen that as soon
as ,0,0 >> βτ xy therefore 0>γ and hence the crack which initiates on the boundary
of the flaw will tend to propagate out of the plane of the flaw. This is a very important
result and it is interesting to investigate the propagation of this crack in greater detail.
Brittle fracture of rock
9
Figure 4.4 Direction of crack propagation from the tip of an elliptical flaw
under compressive stress conditions.
4.3.1 Fracture propagation when 0=xyτ
From equations (4.11) and (4.16), when 0,0 == βτ xy and 0=λ . In other words, under
conditions of uniaxial tensile stress to which the crack is perpendicular, a crack is
initiated at the tip ( 0=α ) of the elliptical flaw and it will propagate in the plane of the
initial flaw.
Substituting 0=xyτ and 0=α in equation (4.4) gives
mm
yb
322 σσσ == (4.17)
If it assumed that the radius of curvature of the propagating crack is of the same order of
magnitude as the radius of curvature of the original elliptical flaw, then propagation of
this crack has the same effect as decreasing the axis ratio m of the original flaw. From
Brittle fracture of rock
10
equation (4.17) it will be seen that this results in an increase in the boundary stress bσ
and hence the crack will continue to propagate, even if the applied stresses are decreased.
Under these conditions the propagation of this crack results in tensile rupture1 of the
specimen. An important conclusion which can be drawn form this discussion is that
tensile rupture will occur in a plane defined by 0=β , i.e. in a plane which is
perpendicular to the direction of the applied tensile stress 3σ .
4.3.2 Fracture propagation when 0>xyτ
As already discussed, when 0>xyτ , the crack which initiates on the boundary of the
elliptical flaw propagates out of the plane of this flaw. It has been demonstrated
experimentally (Brace & Bombolakis 1963; Hoek & Bieniawski 1965) and theoretically
(Paul & Gangal 1966; Bray, personal communication) that this propagating crack will
follow a curved path as indicated in Figure 4.4. This crack path tends to align itself along
the direction of the major principal stress 1σ which, in effect, gives rise to a situation in
which the equivalent elliptical flaw is inclined at 0=β and the stress at the tip of the
propagating crack can be approximated from equation (4.17).
When 3σ > 0, i.e. when 3σ is compressive, an entirely different situation occurs in that
the stress at the tip of the propagating crack becomes compressive when the crack is
aligned in the direction of the major principal stress 1σ . Under these conditions
propagation of the crack will cease and the new flaw so created will be stable under the
existing conditions of applied stress.
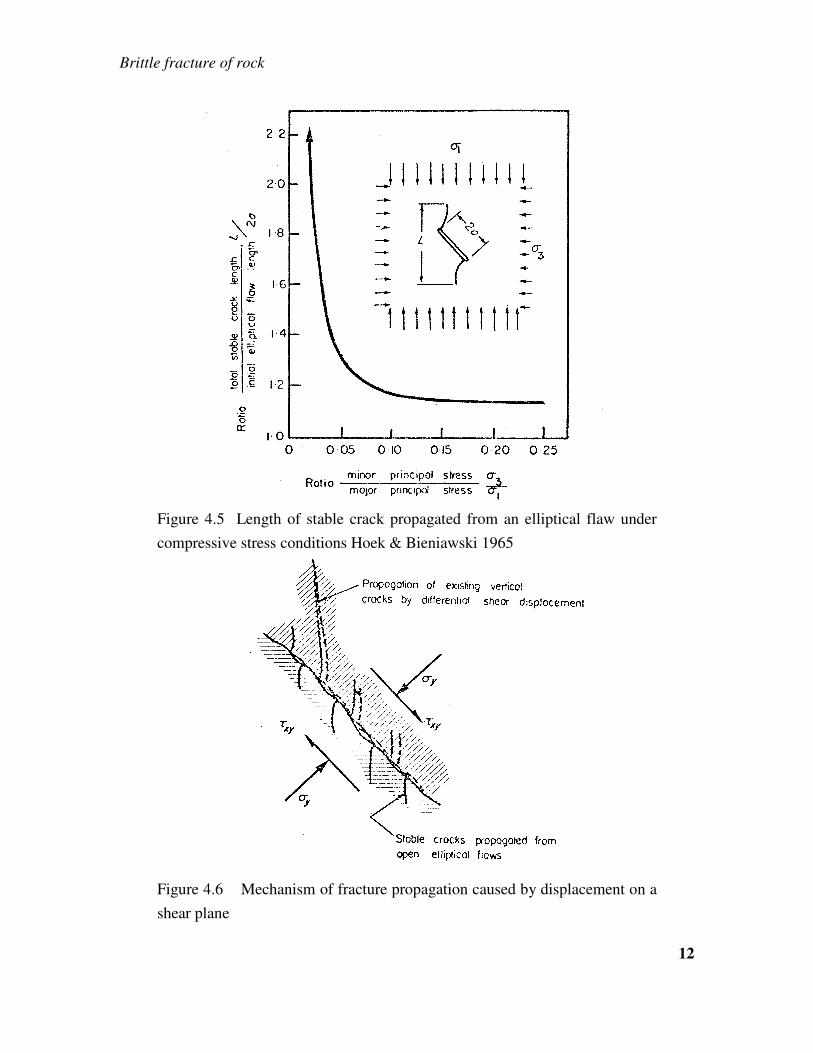
The length of the crack which propagates from an open elliptical flaw for a given
combination of applied stresses has been determined experimentally by Hoek and
Bieniawski (1965) and the results of these experiments are plotted in Figure 4.5.
The important conclusion to be drawn from these results is that a single open elliptical
flaw cannot cause rupture of a rock specimen under conditions in which that applied
stresses ( 1σ and 3σ ) are both compressive.
1 In this discussion the disintegration of the specimen into two or more separate pieces will be termed
rupture.
Brittle fracture of rock
11
4.4 Rock fracture in compression
When the principal stresses 1σ and 3σ applied to a rock body containing an open
elliptical flaw are both compressive, the crack which is initiated on the boundary of this
flaw will only propagate a short distance before it stops and becomes stable (Figure 4.5).
In considering the problem of rupture under compressive stress, it is necessary to
determine the conditions necessary to propagate the stable crack described above or the
conditions necessary lo initiate some new failure mode.
Experimental evidence obtained by Hoek and Bieniawski (1965) suggests that
propagation of the stable cracks which were initiated from open flaws occurs when the
shear resistance of the zone containing these flaws is overcome and shear movement
occurs as suggested in Figure 4.6.
The condition for the onset of shear movement may be expressed by the following
equation:
yoxy µσττ += (4.18)
where oτ is the intrinsic shear resistance of the material, i.e. the shear resistance when
the normal stress yσ = 0 and which is due to interlocking of asperities and to cohesive
forces. The coefficient of internal friction µ is the ratio between the shear stress xyτ
required to sustain movement, once the intrinsic shear resistance oτ has been overcome,
and the normal stress yσ .
The criterion expressed by equation (4.18) is familiar to most engineers and is most
commonly associated with the names of Navier, Coulomb and Mohr (see Jaeger's 1966
review for historical details).
Since the condition expressed by equation (4.18) is that required to initiate shear
movement, it does not follow automatically that this equation defines the conditions for
rupture of the specimen. Consequently it is necessary to consider the events which follow
initiation of the shear movement in order to establish whether rupture of the specimen
will occur.
Brittle fracture of rock
12
Figure 4.5 Length of stable crack propagated from an elliptical flaw under
compressive stress conditions Hoek & Bieniawski 1965
Figure 4.6 Mechanism of fracture propagation caused by displacement on a
shear plane
Brittle fracture of rock
13
In applying the Navier-Coulomb criterion, equation (4.18), to a rock failure problem it is
usual to assume that rupture of the specimen takes place as a result of shear movement
along a plane inclined at an angle β to the minor principal stress direction as suggested
in Figure 4.7(a). The relation between the angle β and the coefficient of internal friction
µ can be found by considering the slope of the Mohr envelope as was done earlier in this
paper in the case of the Griffith criterion (Figure 4.3):
µτ
σβ
12tan
−=
−=
xy
y
d
d (4.19)
While it is accepted that simultaneous movement on the shear plane is a valid failure
mode it is suggested that interlocking of asperities on this plane can also give rise to
differential shear movement which results in the propagation of existing vertical cracks,
as suggested in Figure 4.6. This would result in the vertical tensile type of rupture
illustrated in Figure 4.7(b).
A third possibility is that rupture can occur as a result of some combination of the two
modes discussed above, giving a rupture surface which is intermediate between the
direction of the major principal stress al and the direction of the shear plane which is
inclined at an angle β to the major principal stress direction.
A final possibility is that the propagation of either of the above modes could be inhibited
by changes in either the stress field or the material properties in the crack path, resulting
in a stable crack configuration such as that illustrated in Figure 4.7(c). Propagation of
this stable crack system would require a further increase in the applied compressive
stress 1σ .
It will be evident to the reader, from the discussion given above, that the final appearance
of a rock specimen which has been tested to rupture under compressive stress conditions
will depend upon the size of the specimen and upon the degree of restraint imposed by
the testing machine platens. The influence of laboratory test procedures upon the results
of rupture tests on rock specimens will be discussed in a later section of this chapter in
which the application of such results to practical rock mechanics problems is discussed.
Factors which influence the material 'constants' ot τσ , and µ and the effect of changes in

Brittle fracture of rock
14
these constants upon the behaviour of the material will also be discussed in a later section
of this chapter.
Figure 4.7 Suggested rupture modes under compressive stress conditions,
(a) Shear failure; (b) Tensile failure; (c) Stable crack configuration.
4.5 A rupture criterion for brittle rock
In order to obtain the simplest possible rupture criterion for a brittle rock, consider the
behaviour of a specimen which contains a large number of randomly oriented flaws of
similar size and shape, for example, a carefully selected sample of a homogeneous fine-
Brittle fracture of rock
15
grained rock, such as Witwatersrand quartzite (Hoek 1966). Such a material will exhibit
no significant anisotropy in its strength behaviour and will have a uniaxial compressive
strength of approximately ten times its uniaxial tensile strength.
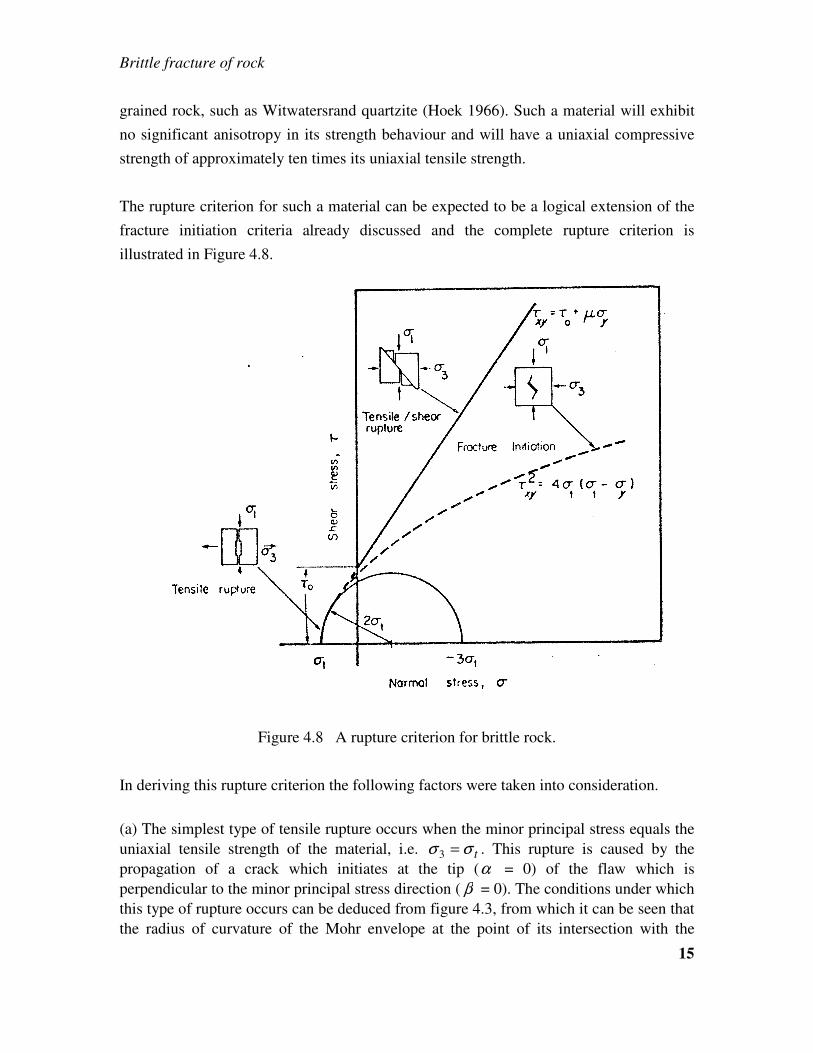
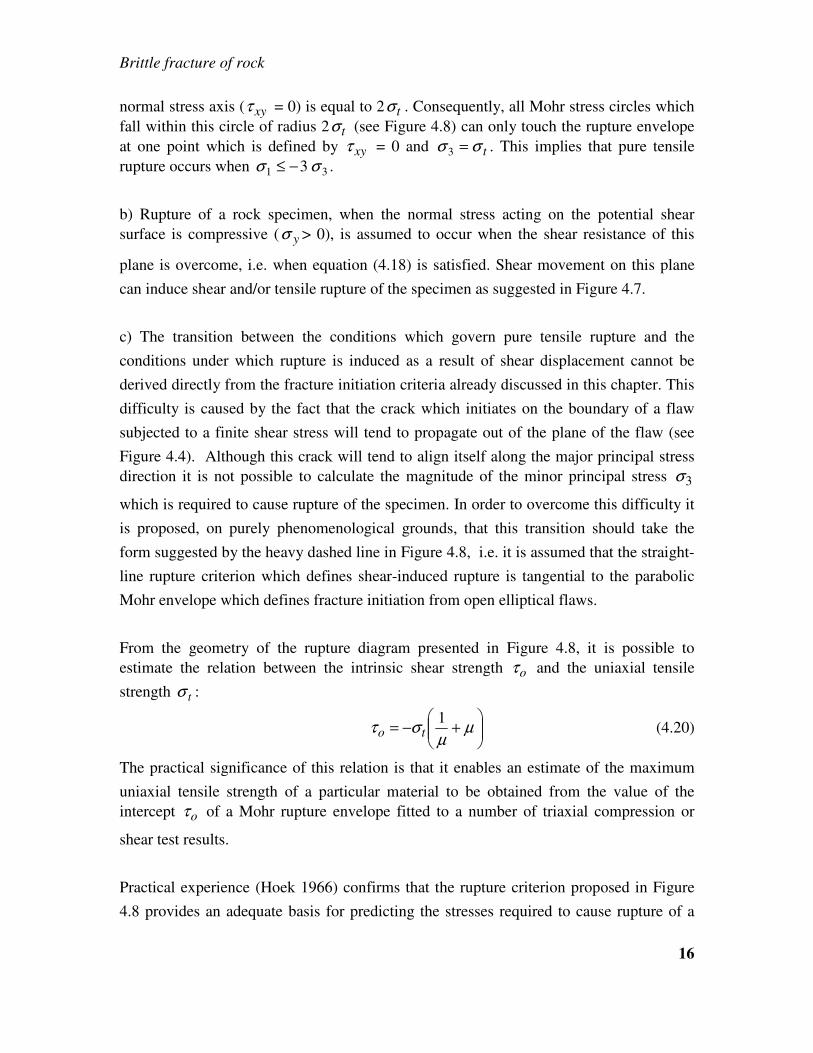
The rupture criterion for such a material can be expected to be a logical extension of the
fracture initiation criteria already discussed and the complete rupture criterion is
illustrated in Figure 4.8.
Figure 4.8 A rupture criterion for brittle rock.
In deriving this rupture criterion the following factors were taken into consideration.
(a) The simplest type of tensile rupture occurs when the minor principal stress equals the
uniaxial tensile strength of the material, i.e. tσσ =3 . This rupture is caused by the
propagation of a crack which initiates at the tip (α = 0) of the flaw which is
perpendicular to the minor principal stress direction ( β = 0). The conditions under which
this type of rupture occurs can be deduced from figure 4.3, from which it can be seen that
the radius of curvature of the Mohr envelope at the point of its intersection with the
Brittle fracture of rock
16
normal stress axis ( xyτ = 0) is equal to 2 tσ . Consequently, all Mohr stress circles which
fall within this circle of radius 2 tσ (see Figure 4.8) can only touch the rupture envelope
at one point which is defined by xyτ = 0 and tσσ =3 . This implies that pure tensile
rupture occurs when 31 3 σσ −≤ .
b) Rupture of a rock specimen, when the normal stress acting on the potential shear
surface is compressive ( yσ > 0), is assumed to occur when the shear resistance of this
plane is overcome, i.e. when equation (4.18) is satisfied. Shear movement on this plane
can induce shear and/or tensile rupture of the specimen as suggested in Figure 4.7.
c) The transition between the conditions which govern pure tensile rupture and the
conditions under which rupture is induced as a result of shear displacement cannot be
derived directly from the fracture initiation criteria already discussed in this chapter. This
difficulty is caused by the fact that the crack which initiates on the boundary of a flaw
subjected to a finite shear stress will tend to propagate out of the plane of the flaw (see
Figure 4.4). Although this crack will tend to align itself along the major principal stress
direction it is not possible to calculate the magnitude of the minor principal stress 3σ
which is required to cause rupture of the specimen. In order to overcome this difficulty it
is proposed, on purely phenomenological grounds, that this transition should take the
form suggested by the heavy dashed line in Figure 4.8, i.e. it is assumed that the straight-
line rupture criterion which defines shear-induced rupture is tangential to the parabolic
Mohr envelope which defines fracture initiation from open elliptical flaws.
From the geometry of the rupture diagram presented in Figure 4.8, it is possible to
estimate the relation between the intrinsic shear strength oτ and the uniaxial tensile
strength tσ :
+−= µ
µστ
1to (4.20)
The practical significance of this relation is that it enables an estimate of the maximum
uniaxial tensile strength of a particular material to be obtained from the value of the
intercept oτ of a Mohr rupture envelope fitted to a number of triaxial compression or
shear test results.
Practical experience (Hoek 1966) confirms that the rupture criterion proposed in Figure
4.8 provides an adequate basis for predicting the stresses required to cause rupture of a
Brittle fracture of rock
17
brittle rock material under the conditions normally encountered in mining or civil
engineering rock mechanics problems2. However, from the discussion on the direction of
fracture propagation (Figure 4.7), it is evident that no reliable estimate of the angle of
rupture of a rock specimen can be made from the Mohr rupture diagram presented in
Figure 4.8. In other words, the angle 2 β subtended by the normal to the rupture
envelope (see Figure 4.3) defines the orientation of the flaw from which fracture initiates
or upon which shear displacement occurs but it gives no information on the subsequent
path which the fracture will follow. The author believes that the angle of rupture of an
element of rock is critically dependent upon the restraints imosed upon it by the testing
machine platens, in the case of a laboratory test, or by the surrounding material in the
case of a rock structure. A great deal of careful thought and experimentation has still to
be devoted to this problem in order to clarify the current confusion which exists in
relation to the angle of rupture of rock materials.
4.6 Factors which influence the rupture behaviour of rock
The 'ideal' brittle material upon which the derivation of the fracture initiation and rupture
criteria presented above is based cannot be considered representative of the material
which would be found in a rock structure, such as a dam foundation or the rock
surrounding a mine excavation. Nor can the conditions to which a carefully selected
laboratory test specimen is subjected be regarded as representative of the wide variety of
conditions which are likely to be encountered in the field.
Obviously, a theoretical rupture criterion which accounts for all possible deviations from
the ‘ideal’ would be far too complex to have any practical value. On the other hand, the
‘ideal’ would be far to complex to have any practical value if some estimate can be made
of the extent to which the rock behaviour is likely to be influenced by deviation from the
idealized assumptions.
2 Deviations from the linear Mohr envelope defined by equation (4.18) are discussed in a later section of
this chapter.
Brittle fracture of rock
18
4.6.1 Influence of moisture on the strength of rock
The presence of moisture in a rock body can influence the rupture behaviour of the rock
in two important ways:
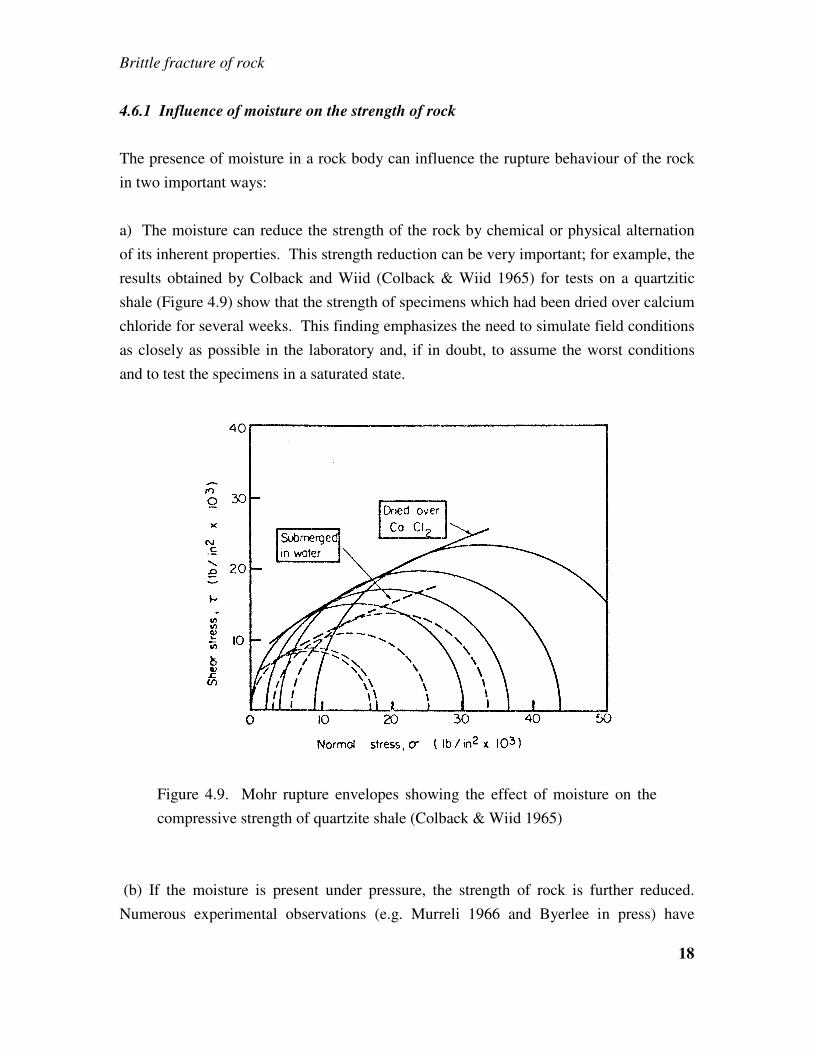
a) The moisture can reduce the strength of the rock by chemical or physical alternation
of its inherent properties. This strength reduction can be very important; for example, the
results obtained by Colback and Wiid (Colback & Wiid 1965) for tests on a quartzitic
shale (Figure 4.9) show that the strength of specimens which had been dried over calcium
chloride for several weeks. This finding emphasizes the need to simulate field conditions
as closely as possible in the laboratory and, if in doubt, to assume the worst conditions
and to test the specimens in a saturated state.
Figure 4.9. Mohr rupture envelopes showing the effect of moisture on the
compressive strength of quartzite shale (Colback & Wiid 1965)
(b) If the moisture is present under pressure, the strength of rock is further reduced.
Numerous experimental observations (e.g. Murreli 1966 and Byerlee in press) have
Brittle fracture of rock
19
confirmed the theoretical prediction that the influence of pore pressure can be allowed for
in the rupture criteria discussed in this chapter by replacing the normal stress yσ by an
effective stress ( py −σ ). Noting that a compressive stress of magnitude p balances the
internal pore pressure, it is clear that only the excess py −σ can be effective in
developing tensions. Consequently, equation (4.10) becomes
( ){ }pyttxy −−= σσστ 42 (4.21)
while equation (4.18) becomes
( )pyoxy −+= σµττ (4.22)
It is important to note that in any testing involving a study of the influence of moisture or
of pore-pressure effects, the rate of loading of the specimen is a critical factor. The
discussion presented above is based upon static stress conditions and unless the rate of
loading is low enough to permit the pore pressure to distribute itself uniformly throughout
the volume of the specimen or, in the case of a drained test, to prevent the build up of
dynamic pore pressures, the conclusions presented above will not be valid3.
4.6.2 Influence of the normal stress upon the frictional behaviour of rock
The envelope fitted to a set of Mohr circles obtained from low pressure triaxial
compression tests on brittle rocks is usually adequately represented by a straight line as
suggested by equation (4.18) (Wuerker 1959). Since many civil and mining engineering
applications involve low confining pressures (up to say one-half the uniaxial compressive
strength of the rock), the assumption that the coefficient of friction µ is a constant is
sufficiently accurate for these applications.
However, in the case of problems involving high confining pressures such as those which
may be encountered in deep-level mining or in problems of interest to the geologist, this
3 Professor W. F. Brace of the Massachusetts Institute of Technology, in a personal communication to the
author, gives the critical strain rate for the loading of a small specimen (approximately 0.5 inch diameter x
1.5 inches long) of Westerly granite as approximately 10-7
in/in/s.
Brittle fracture of rock
20
assumption can be seriously in error. The assumption that the coefficient of friction is a
constant can also be misleading in the case of 'soft' rocks, such as shales and siltstones,
which exhibit non-linear rupture envelopes, even at very low confining pressures.
Experimental evidence obtained by Murrell (1966), Hobbs (1966), Patton (1966) and
Byerlee (in press) suggests that the coefficient of internal friction µ in equation (4.18) is
not a constant but depends upon the magnitude of the normal compressive stress yσ . The
reason for this breakdown of Amonton's law of friction is associated with the interlocking
of the asperities on the shear plane (see Figure 4.6). This interlocking depends upon the
intimacy of the contact of the asperities which, in turn, depends upon the magnitude of
the normal stress yσ .
Although a number of theoretical models of this interlocking behaviour have been
considered (Murrell 1966; Hobbs 1966; Byerlee in press), the problem has not been
adequately solved and, in the author's opinion, a considerable amount of theoretical work
is still necessary. However, in the absence of a rigorous theoretical solution, a useful
empirical solution can be obtained by assuming that the rupture behaviour of a brittle
rock can be characterized by the following equation:
bmo Aσττ += maxmax (4.23)
where ( )312
1max σστ −= is the maximum shear stress,
( )312
1σσσ +=m is the mean normal stress
and omaxτ is the intercept of the maxτ versus mσ plot when mσ = 0.
The reasons for the choice of the maximum shear stress maxτ and the mean normal stress
mσ in place of the shear and normal stresses xyτ and yσ as suggested by (Murrell 1966)
and (Hobbs 1966) are important and are worthy of some consideration.
In analysing the results of conventional triaxial compression tests, we are faced with the
problem of determining the values of the shear and normal stresses xyτ and yσ from the
experimentally determined values of the applied axial and lateral stresses 1σ and 3σ ( =
2σ ). If the inclination β of the plane upon which the shear and normal stresses act is
Brittle fracture of rock
21
known, their values can be calculated from equations (4.1) and (4.2). However, as
discussed earlier in this chapter, available evidence suggests that the fracture path is a
complex one which may have no direct relation to the shear and normal stresses which
were responsible for its initiation and propagation (see Figure 4.7b). In addition, current
triaxial testing techniques are such that the fracture path is almost certainly influenced by
platen effects and by the non-uniformity of the stress distribution in the specimen at the
final stages of rupture. Consequently, any attempt to determine the inclination β of the
rupture surface from the configuration of a ruptured triaxial specimen must be treated
with suspicion.
In order to overcome these difficulties, the author suggests the use of the maximum shear
stress and the mean normal stress which can be calculated directly from the axial stress
1σ and confining pressure 3σ values obtained from a set of triaxial tests. It will be seen
from Figure 4.11 that, for an actual set of experimental results, the maxτ versus yσ plot
is closely related to the xyτ versus yσ relation which is assumed to be defined by the
Mohr envelope. This suggests that the relation proposed in equation (4.23) and a similar
relation between xyτ and yσ proposed by Murrell (1966) and Hobbs (1966) are not
contradictory and that the advantage of using equation (4.23) depends solely upon its
practical convenience4.
In order to evaluate the constants A and b in equation (4.23) for a given material, it is
convenient to rewrite the equation in the following form:
c
m
c
o bAσ
σ
σ
ττ1010
maxmax10 logloglog +=
− (4.24)
where cσ is the uniaxial compressive strength of the material.
The advantage of normalizing the experimental results by dividing each measured value
by the uniaxial compressive strength of a number of tests on the same plot. This
advantage is obvious in Figure 4.10 in which the results of triaxial tests on the eight
4 An interesting application of the maximum shear stress versus mean normal stress plot has been described
by the author (Hoek 1966) in connection with the analysis of rock fracture around underground excavations
by means of photoelastic models

Brittle fracture of rock
22
sandstones listed in Table 4.1 are plotted on the same graph. Normalizing the results has
the additional advantage of minimizing the influence of testing techniques, specimen
sizes and environmental conditions since these conditions are usually common to both
numerator and denominator of the dimensionless ratios.
Figure 4.10 Relation between the maximum shear and mean normal stresses
at rupture for sandstones
Plotting the experimental results on logarithmic scales permits a direct evaluation of the
constants A and b since A is given by the value of cσττ )( 0max − when 1=cm σσ ,
)0)((log10 =cm σσ , and the value of b is given by the slope of the straight line through
the experimental points. However, complete evaluation of the constants requires that the
value of the intercept 0maxτ be known and, in the absence of experimental values, the
author suggests that a reasonable estimate is given by 1.00max =cστ .
Fitting the best straight line to the experimental points plotted in Figure 4.10 by the
method of least squares and substitution of the resulting values of A and b into equation
(4.23) gives

Brittle fracture of rock
23
85.0max 76.01.0
+=
c
m
c σ
σ
σ
τ (4.25)
which, as shown in Figure 4.11, adequately defines the rupture behaviour of the
sandstones listed in Table 4.1.
Table 4.1 Sandstones included in Figure 4.10
Uniaxial compressive strength Name Experimenter Country
lb.in2
kg/cm2
--- Jaeger Australia 9,000 633
Darley Dale 1 Price England 5,780 406
Pennant Price England 22,500 1,582
Rush Springs Bredthauer America 25,000 1,758
Iwaki Horibe and
Kobayashi
Japan 1,780 125
---- Everling Germany 18,500 1,300
Darley Dale II Murrell England 11,500 1,300
Warmbaths Wiid South Africa 14,750 1,037
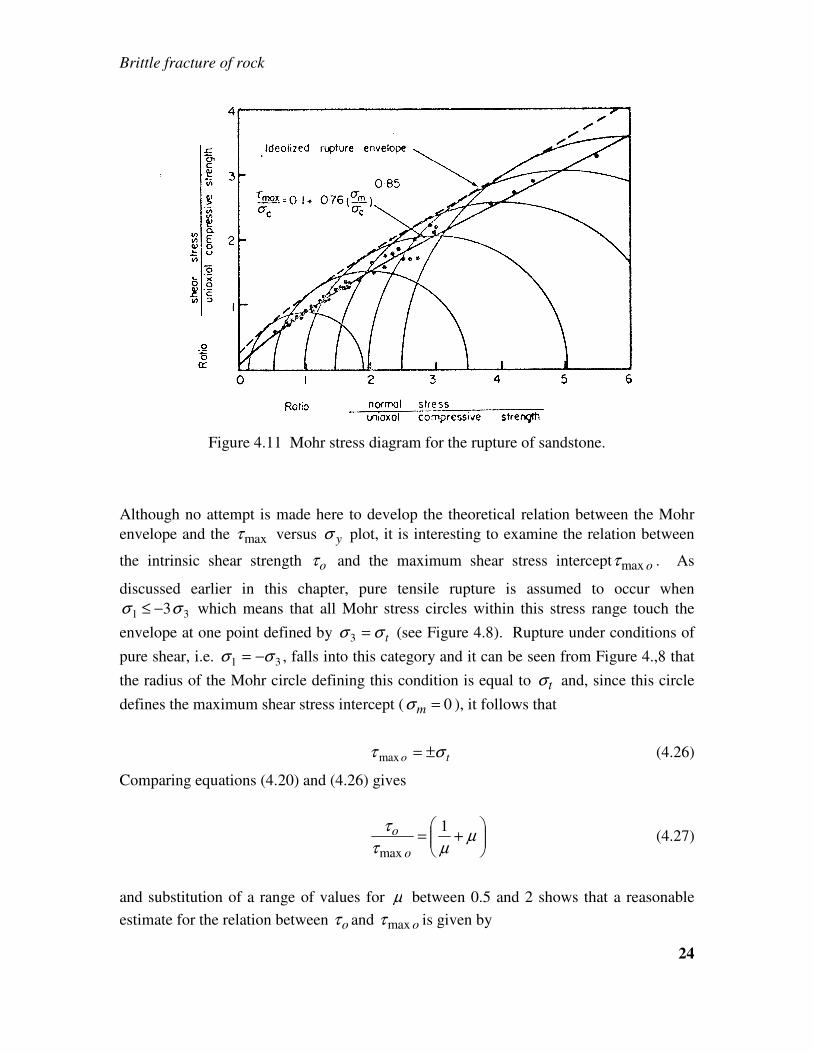
In Figure 4.11, a set of idealized Mohr circles and their envelope are shown and it will be
noted that, having defined the relation between the maximum shear stress and mean
normal stress, the construction of these circles and the fitting of the envelope is reduced
to a simple and reliable graphical operation. This is in contrast to the difficulties of
fitting an envelope by eye to a set of experimentally determined Mohr circles since such
an envelope is invariably fitted to the circles of maximum diameter and does not take into
account the scatter of the experimental values5.
5 The interested reader can easily check this difficulty for himself by constructing a few Mohr circles from
the experimental values given in Figure 4.11 and noting the exaggerated curvature of the envelope fitted to
the maximum diameter circles.
Brittle fracture of rock
24
Figure 4.11 Mohr stress diagram for the rupture of sandstone.
Although no attempt is made here to develop the theoretical relation between the Mohr
envelope and the maxτ versus yσ plot, it is interesting to examine the relation between
the intrinsic shear strength oτ and the maximum shear stress intercept omaxτ . As
discussed earlier in this chapter, pure tensile rupture is assumed to occur when
31 3σσ −≤ which means that all Mohr stress circles within this stress range touch the
envelope at one point defined by tσσ =3 (see Figure 4.8). Rupture under conditions of
pure shear, i.e. 31 σσ −= , falls into this category and it can be seen from Figure 4.,8 that
the radius of the Mohr circle defining this condition is equal to tσ and, since this circle
defines the maximum shear stress intercept ( 0=mσ ), it follows that
to στ ±=max (4.26)
Comparing equations (4.20) and (4.26) gives
+= µ
µτ
τ 1
max o
o (4.27)
and substitution of a range of values for µ between 0.5 and 2 shows that a reasonable
estimate for the relation between oτ and omaxτ is given by
Brittle fracture of rock
25
oo max2ττ ≅ (4.28)
Although the prime purpose of plotting the triaxial test results for sandstone in Figures
4.10 and 4.11 is to demonstrate the influence of the normal stress upon the frictional
behaviour of rock, these figures cannot be left without noting the remarkable similarity in
the rupture behaviour of the eight sandstones which, from the information given in Table
4.1, have widely varying geographical locations and geologic materials, any attempt at an
explanation of this similarity would be based on pure speculation and would be out of
place in this chapter. However, since similar patterns of behaviour have been noted for
many other rock types (Hoek & Bieniawski 1965; Hoek 1966), the practical significance
of such patterns, even if they can only be defined by empirical relations such as that
suggested by Equation (4.23), is important.
Following the thoughts which probably motivated Wuerker (1959) when he prepared his
annotated tables of rock strength, it is suggested that the availability of a collection of
dimensionless results, such as those presented in figure 4.10, could be of considerable
assistance to the practical engineer who may have neither the time nor the facilities to
carry out the large number of triaxial tests necessary to define the behaviour of the
material with which he is concerned. In order to obtain an estimate of the behaviour of a
particular material, it would only be necessary to determine the uniaxial compressive
strength cσ , under the environmental conditions and using the testing technique and size
of specimen most appropriate to the particular problem under consideration. Substitution
of this value of cσ into the characteristic equation of that type of material (e.g. equation
(4.25) for sandstone) would give a maxτ versus mσ plot, and if necessary the Mohr
circles and envelope, which would be sufficiently accurate for most practical purposes6. †
6 The author wishes to make it quite clear that he does not advocate the procedure suggested above as a
solution to all problems of rock testing. The curve which defines the rupture behaviour of a rock may be an
extremely useful tool but it cannot replace the ‘feel’ of his material which an engineer can only obtain by
working with it and observing its behaviour under test conditions. However, since the ever-increasing
demands of progress restrict the time which the modern engineer can afford to spend on the luxury of
getting to know his material, the suggested procedure, while academically unattractive to the physicist, may
still prove very practical in engineering application. In order to implement the ideas outlined above, a
research project has been initiated at Imperial College, London, which involves the collection and computer
analysis of all available results for triaxial rock tests, using published data and whatever raw data it proves
practical to obtain.
Brittle fracture of rock
26
4.6.2 Influence of anisiotropy on the strength of rock
The ideal brittle rock, upon which most of the discussion presented thus far has been
based, is assumed to contain a large number of randomly oriented flaws of equal size.
These conditions would very seldom be found in practical rock mechanics problems and,
hence, it is necessary to make an estimate of the probable influence of anisotropy would
exceed the scope of this chapter and it will suffice to illustrate the main points of practical
interest by one example.
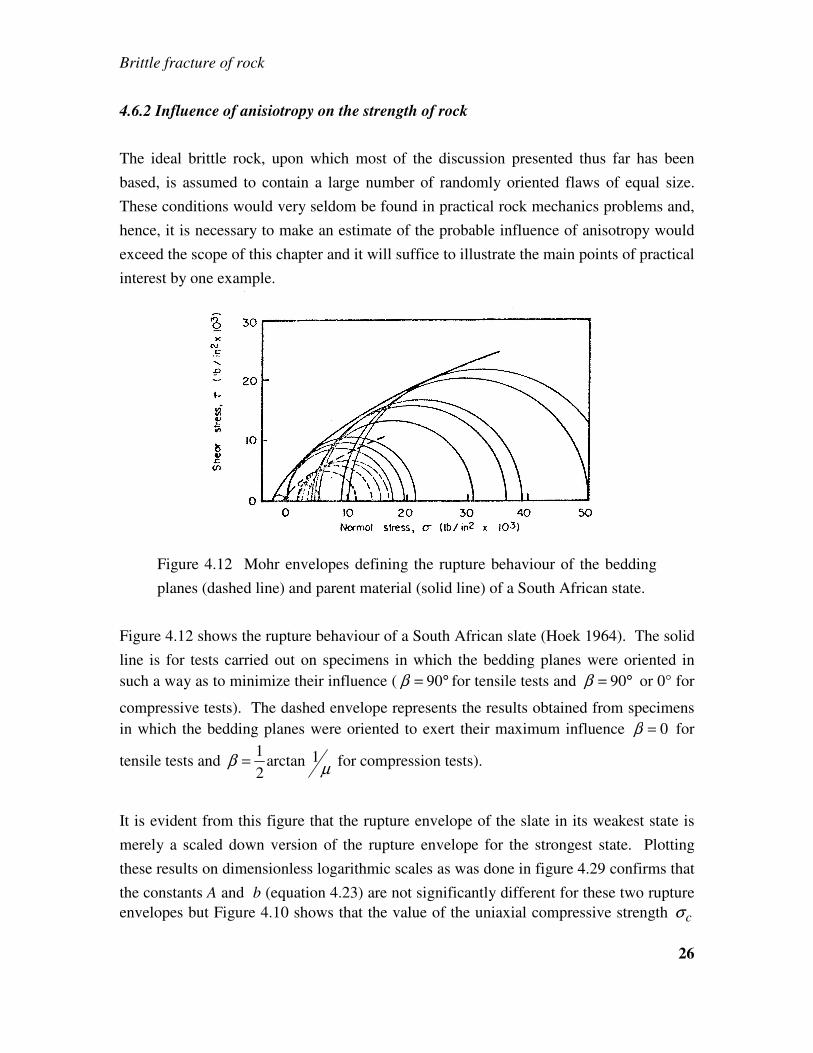
Figure 4.12 Mohr envelopes defining the rupture behaviour of the bedding
planes (dashed line) and parent material (solid line) of a South African state.
Figure 4.12 shows the rupture behaviour of a South African slate (Hoek 1964). The solid
line is for tests carried out on specimens in which the bedding planes were oriented in
such a way as to minimize their influence ( °= 90β for tensile tests and °= 90β or 0° for
compressive tests). The dashed envelope represents the results obtained from specimens
in which the bedding planes were oriented to exert their maximum influence 0=β for
tensile tests and µ
β 1arctan2
1= for compression tests).
It is evident from this figure that the rupture envelope of the slate in its weakest state is
merely a scaled down version of the rupture envelope for the strongest state. Plotting
these results on dimensionless logarithmic scales as was done in figure 4.29 confirms that
the constants A and b (equation 4.23) are not significantly different for these two rupture
envelopes but Figure 4.10 shows that the value of the uniaxial compressive strength cσ
Brittle fracture of rock
27
varies by a factor of approximately 4, depending upon the orientation of the bedding
planes to the principal stress directions.
The practical significance of these findings is that, in problems in which the principal
stress directions and major weakness planes in the material are known, the appropriate
value of cσ can be determined and used in analysing the rupture behaviour of the rock.
Hence, for example, the analysis of the stability of a slope in which the rock contains
well-defined planes of weakness must take the orientation of these planes into account.
Note that, in such cases, the weakness planes may contain soft filling material which may
reduce the frictional resistance of this plane, i.e. the values of A and b will differ from
those of the parent material and must be determined independently.
In cases in which the orientations of the weakness planes in relation to the principal stress
directions are not known, it can only be assumed that the rupture behaviour of the
material will lie somewhere between the two envelopes representing its weakest and
strongest states (e.g. Figure 4.12 for slate). Since this would be the case in many
practical rock mechanics problems, it is suggested that, where the stability of a structure
is at stake, the only safe course to follow is to use the envelope defining the weakest state
of the material.
4.6.4 Influence of laboratory testing techniques upon the rupture of rock
A large proportion of the research effort which has gone into building up the science of
rock mechanics has been devoted to the detailed study of laboratory testing techniques.
Jaeger (1966) has given an excellent review of this work which includes studies of the
influence of specimen geometry, platen friction, rate of loading, size of specimen and of
the stiffness of the testing machine upon the behaviour of the rock specimen. No useful
purpose would be served by attempting to repeat the details of this review and the
following discussion will be confined to certain basic principles of rock testing.
The results of presented in Figures 4.10 and 4.11 suggest that the shape of the
characteristic curve which defines the rupture behaviour of a rock is largely independent
of the method of testing. Consequently, in choosing a testing technique, which
determines the position of the characteristic curve on the στ − plane, it is necessary to
consider:
Brittle fracture of rock
28
a) the basic principles of materials testing which have to be fulfilled and
b) the purpose for which the test results are required.
The most important requirement which must be met in carrying out a test is that it must
be possible to determine the stresses acting on the specimen. Since most rocks exhibit
some degree of anisotropy and all rock become anisotropic as a point of rupture is
approached (Walsh 1965; Brace, Pauling & Scholz 1966), any test specimen in which
there are significant stress gradients and for which the stress at rupture has to be
calculated on the basis of the theory of elasticity must be treated with suspicion. This
applies to specimens tested in bending, torsion and to certain indirect tests which involve
high stress gradients, e.g. indentation of the specimen with a steel ball or diamond point.
The simplest solution to the problem is to choose a specimen geometry which permits
calculation of the applied stresses from a simple load/area relation. However, even when
this condition is met, e.g. in the case of a cylindrical specimen subjected to direct
compressive stress, it is still necessary to ensure that stress gradients are not induced as a
result of poor end conditions (Hoek 1966, Mogi, 1966).
The purpose for which the results of laboratory tests on rock specimens is required can
have an important bearing upon the test method chosen. This is particularly true in
relation to the direction of the most important failure surface in a ruptured specimen
(Figure 4.7). For example, if the results of a set of laboratory tests are to be applied to a
slope stability problem in which the shear rupture mode (Figure 4.7a) is of prime
importance, an applied stress condition which encourages the development of this shear
mode, i.e. a shear-box test, would be a logical choice for the test method.
In the case of the rock surrounding underground mine excavations, both tensile and shear
modes may be important. An even more important consideration may be the stress
redistribution associated with fracture which may result in the load on an element being
relieved if it tends to deform by a large amount in relation to the surrounding rock. An
appreciation of this problem has led to the development of ‘stiff-machine’ testing
techniques (Cook and Hojem 1966; Bieniawski in submission) which restrict the strain
which takes place in the specimen.
The conclusion to be drawn from the discussion presented above is that, while it is
Brittle fracture of rock
29
important to exercise care in preparing and testing rock specimens, it is even more
important to give serious consideration to the use to which the results are to be put.
Unless the test method chosen bears a direct relation to the problem under consideration,
a great deal of effort can be expended on obtaining information which may have little or
no practical significance.
References
Bieniawski, Z.T. Paper submitted. Mechanism of brittle fracture of rock. submitted to
Intern. J. Rock Mech. Mining Sci.
Brace, W.F. and E.G. Bombolakis 1963. A note on brittle crack growth in compression,
J. Geophys. Res., 68, No. 12, 3709-3713.
Brace, W.F., Paulding, B.W. and C. Scholz 1966. Dilatancy and fracture of crystalline
rocks, J. Geophys. Res., 71, No. 16, 3939-3953.
Bray, J.W. personal communication.
Byerlee, J.D. In press. A theory of friction based on brittle fracture, J. Appl Phys.
Byerlee, J.D. In press. The frictional characteristics of granite under high confining
pressure, J. Geophys. Res.
Colback, P.S.B. and B. L. Wiid 1965 The influence of moisture content on the
compressive strength of rock, Proc. Symp. Rock Mech., 3rd, Toronto.
Cook, N.G.W. and J.P.M. Hojem, 1966. A rigid 50-ton compression and tension testing
machine. S. African Mech. Engr., Nov., 89-92.
Denkhaus, H.G. 1964. The application of the mathematical theory of elasticity to
problems of stress in hard rock at great depth. Bull. Inst. Mining Met., 68, 283-309.
Donath, F.A. 1964. Strength variation and deformation behaviour in anisotropic rock. In
State of Stress in the Earth's Crust (Ed. W.R. Judd), Elsevier: New York, pp. 281-
298.
Griffith, A.A. 1924. Theory of rupture, Intern. Congr. Appl. Mech., 1st, Delft, 55-63.
Griffith, A.A. 1921. The phenomena of rupture and flow in solids. Phil. Trans. Roy. Soc.
London, Series A, 221, 163-198.
Hobbs, D.W. 1966. A study of the behaviour of broken rock under triaxial compression,
Brittle fracture of rock
30
and its application to mine roadways, Intern. J. Rock Mech. Mining Sci., 3, 11-43.
Hoek, E. 1964. Fracture of anisotropic rock. J. S. African Inst. Mining Met., 64, 510-
518.
Hoek, E. 1966. A photoelastic technique for the determination of potential fracture
zones in rock structures. Symp. Rock Mech., Minnesota, (Proceedings to be
published by AIME, 1967).
Hoek, E. 1966. Rock mechanics - an introduction for the practical engineer. Mining Mag.
(London), April, June, July issues.
Hoek, E. and Z. T. Bieniawski 1965. Brittle fracture propagation in rock under
compression, Intern. J. Fracture Mech., 1, No. 3, 137-155.
Inglis, C.E. 1913. Stresses in a plate due to the presence of cracks and sharp corners,
Trans. Inst. Naval Architects, London, 55, Part I, 219-230.
Jaeger, J.C. 1966. The brittle fracture of rocks. Symp. Rock Mech., Minnesota,
(Proceedings to be published by AIME, 1967).
K. Mogi 1966. Some precise measurements of fracture strength of rocks under uniform
compressive stress, Rock Mech. Eng. Geol., 4, Part 1, 43-55.
Murrell, S.A.F. 1966. The effect of triaxial stress systems on the strength of rocks at
atmospheric temperatures, Geophys. J., 10, No. 3, 231-281.
Patton, F.D. 1966. Multiple modes of shear failure in rock, Proc. Intern. Congr. Rock
Mech., Lisbon, 509-514.
Paul, B. and M. Gangal 1966. Initial and subsequent fracture curves for biaxial
compression of brittle materials, Symp. Rock Mech., Minnesota, 1966 (Proceedings
to be published by A1ME, 1967).
Walsh, J. B. and W. F. Brace 1964. A fracture criterion for anisotropic rock. Geophys.
Res., 69, No. 16, 3449-3456.
Walsh, J.B. 1965. The effect of cracks on the compressibility of rock, Geophys. Res., 70,
No. 2, 381-389.
Wuerker, R.D. 1959. Annotated tables of strength of rock, Trans. AIME (Petrol. Div),
No. 663-669.