calibration of nonlocal models for tensile fracture in ...eprints.gla.ac.uk/107220/1/107220.pdf ·...
TRANSCRIPT

Contents lists available at ScienceDirect
Journal of the Mechanics and Physics of Solids
Journal of the Mechanics and Physics of Solids 82 (2015) 48–60
http://d0022-50(http://c
n CorrE-m
journal homepage: www.elsevier.com/locate/jmps
Calibration of nonlocal models for tensile fracture in quasi-brittle heterogeneous materials
Dimitrios Xenos a, David Grégoire b, Stéphane Morel c, Peter Grassl a,n
a School of Engineering, University of Glasgow, Glasgow, UKb Laboratoire des Fluides Complexes et leurs Réservoirs, LFC-R UMR5150, Univ. Pau & Pays Adour, Anglet, Francec Université de Bordeaux, UMR 5295, Institut de Mécanique et d'Ingénierie - Bordeaux (I2M), Dept. Génie Civil et Environnemental (GCE),Bordeaux, France
a r t i c l e i n f o
Article history:Received 20 January 2015Received in revised form18 April 2015Accepted 21 May 2015Available online 27 May 2015
Keywords:Nonlocal modelDamage mechanicsFractureCalibrationQuasi-brittle materials
x.doi.org/10.1016/j.jmps.2015.05.01996/& 2015 The Authors. Published by Elsevreativecommons.org/licenses/by/4.0/).
esponding author. Tel.: þ44 141 330 5208.ail address: [email protected] (P. Gr
a b s t r a c t
A new calibration strategy for integral-type nonlocal damage models for quasi-brittlematerials is proposed. It is based on the assumption that in the fracture process zone inquasi-brittle materials the large majority of energy is dissipated in a localised rough crack.Measuring the roughness of the fracture surface allows for calibrating the interactionradius of nonlocal models by matching experimental and numerical standard deviationsof spatial distributions of dissipated energy densities. Firstly, fracture analyses with alattice model with random fields for strength and fracture energy are used to support theassumptions of the calibration process. Then, the calibration strategy is applied to anintegral-type nonlocal damage model for the case of a fracture surface of a three-pointbending test.& 2015 The Authors. Published by Elsevier Ltd. This is an open access article under the CC
BY license (http://creativecommons.org/licenses/by/4.0/).
1. Introduction
Fracture in quasi-brittle heterogeneous materials, such as concrete, rock, stiff soils, wood and bones, is characterised bythe formation of a finite nonlinear zone ahead of a macroscopic crack in which energy is dissipated; it is defined as theFracture Process Zone (FPZ). The size of this zone influences the load capacity of structures and is one of the parameterswhich determine a size effect on the nominal strength of structural members specific for quasi-brittle materials (Bažant,2002).
Integral-type nonlocal models are often used for describing the fracture process of quasi-brittle materials (Pijaudier-Cabot and Bažant, 1987; Bažant and Jirásek, 2002). In these models, the stress at a point is determined by a weighted spatialaverage of state variables in the vicinity of this point. The size of the vicinity in which the averaging is performed isdetermined by the nonlocal interaction radius. Integral-type nonlocal models describe localised fracture by narrow, butfinite, regular strain profiles. This is the main difference to nonlinear fracture mechanics approaches, such as cohesive crackmodels, in which localised fracture is described by displacement jumps. Integral-type nonlocal models are popular becausethey provide results, which are mesh size and orientation insensitive for both tensile and compressive failure. The nonlocalaveraging should describe the finite FPZ experimentally observed in heterogeneous materials.
ier Ltd. This is an open access article under the CC BY license
assl).
D. Xenos et al. / J. Mech. Phys. Solids 82 (2015) 48–60 49
The FPZ in concrete was studied by acoustic emission tests by, for instance, Mihashi et al. (1991), Landis (1999), Otsukaand Date (2000), Haidar et al. (2005), Muralidhara et al. (2010), and Grégoire et al. (2015) in which acoustic signals origi-nating from fracture events are spatially located and the strength of the signal is used to differentiate between the mag-nitude of energy dissipation of events. Other studies include techniques to record the displacements (Cedolin et al., 1987;Wu et al., 2011; Skarżyński et al., 2011) and fracture surface measurements (Lange et al., 1993; Mourot et al., 2006; Morelet al., 2008; Ponson et al., 2006). Despite providing important insight into fracture processes in quasi-brittle materials, theseinvestigations have not yet resulted in calibration strategies for the interaction radius of nonlocal models. In other studies ithas been suggested to determine the nonlocal radius by inverse calibration based on structural results (Bažant and Pijaudier-Cabot, 1989; Carmeliet, 1999; Bellégo et al., 2003; Jirásek et al., 2004; Iacono et al., 2006, 2008). One of the disadvantages ofinverse calibration is that the parameters strongly influencing the width of the fracture process zone, such as the nonlocalradius in integral type nonlocal models, are obtained using structural results unrelated to this width. Consequently, a goodfit of structural results may lead to completely unrealistic widths of fracture process zones. For instance, in Jirásek et al.(2004), simultaneous fitting of size effect data for nominal strength and nominal fracture energy, resulted in a nonlocalradius of 75 mm, which corresponds to much wider FPZs than observed in experiments.
In this work, a new, more direct calibration procedure for the nonlocal radius of integral type nonlocal models is pro-posed, by matching experimentally and numerically determined dissipated energy densities. Optical profiling techniques(Mourot et al., 2006) are used to measure the roughness of the crack surface obtained from a three point bending test. Thiscrack surface profile is then used to compute the standard deviation of the distribution of the deviation of the height of thecrack surface from the mean crack plane. If the final rough crack is the dominant source of dissipated energy and the, usuallyvarying, energy per crack length can be considered, for the purpose of the calibration, to be uniform, then this standarddeviation is equal to the standard deviation of the dissipated energy density profile obtained by a nonlocal model from, forinstance, a uniaxial tensile test. Matching the experimentally and numerically determined standard deviations provides thelink between the fracture process zone and the nonlocal radius.
One of the assumptions of this calibration procedure is that the large majority of energy dissipated in the fracture processzone originates from the crack which forms the main fracture surface, for which the roughness is measured. This as-sumption is supported by experimental results (Cedolin et al., 1987), and numerical and analytical modelling results (Planaset al., 1992; Nirmalendran and Horii, 1992; Bolander et al., 1998). Furthermore, it is assumed that the dissipation along thecrack surface can be considered to be uniform for the purpose of the calibration. The validity of these assumptions isinvestigated here by qualitative two-dimensional meso-scale analyses of direct tensile tests of a periodic specimen in planestress using a lattice model developed in Grassl and Jirásek (2010), which is conceptually similar to models reported inZubelewicz and Bažant (1987), Herrmann et al. (1989), Schlangen and Van Mier (1992), Bolander and Saito (1998), Bolanderet al. (1998), and Delaplace et al. (1996). For these lattice analyses, the heterogeneity of the material is idealised by a singleisotropic autocorrelated random field for strength and fracture energy generated by a spectral representation method(Shinozuka and Jan, 1972) used previously for lattice modelling of fracture in Grassl and Bažant (2009) and Grassl and Jirásek(2010). This type of lattice analyses of tensile fracture has been shown to provide qualitatively realistic results (Grassl andJirásek, 2010; Grassl et al., 2015) and, if calibrated appropriately, can provide a good agreement with fracture experiments(Grassl et al., 2012; Grégoire et al., 2015). In the present study, the modelling approach is only used to investigate the validityof the assumptions of the calibration procedure and a direct comparison with experiments or macroscopic nonlocalmodelling results is not carried out.
The aim of this study is to propose a new calibration strategy for the interaction radius of nonlocal models based onsurface roughness measured in experiments. To the authors' knowledge, this is the first time that a quantitative calibrationprocedure for the nonlocal radius based on local experimentally measurable results with strong physical meaning is pro-posed in the literature. This application of the calibration procedure is illustrated for concrete in the present work. It isanticipated that it can be applied to a wide range of other quasi-brittle heterogeneous materials.
2. Calibration procedure
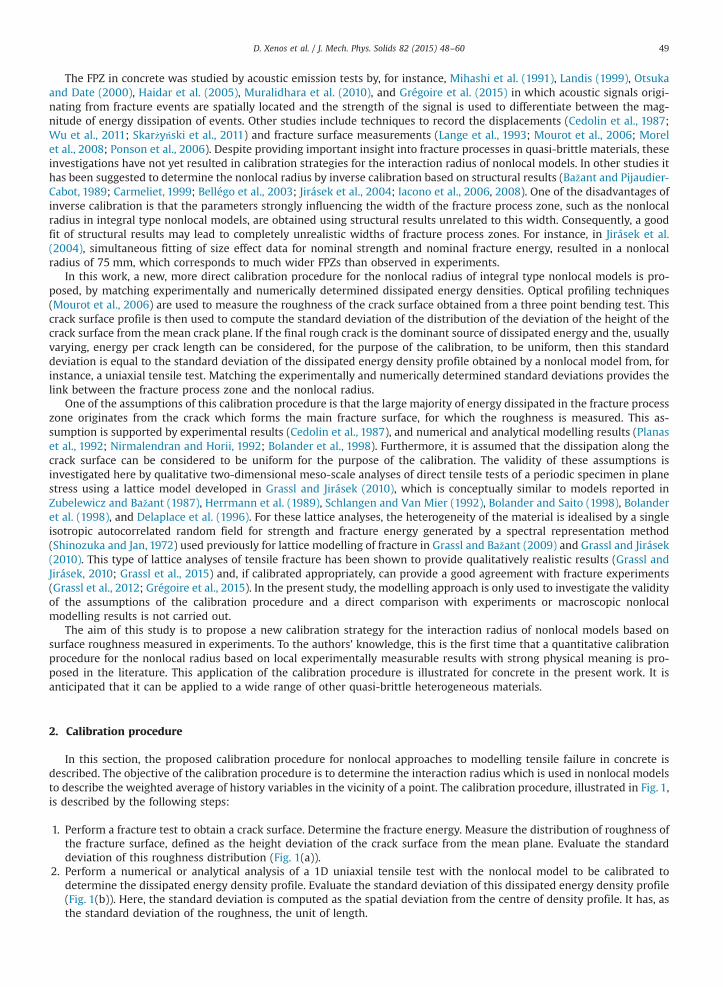
In this section, the proposed calibration procedure for nonlocal approaches to modelling tensile failure in concrete isdescribed. The objective of the calibration procedure is to determine the interaction radius which is used in nonlocal modelsto describe the weighted average of history variables in the vicinity of a point. The calibration procedure, illustrated in Fig. 1,is described by the following steps:
1.
Perform a fracture test to obtain a crack surface. Determine the fracture energy. Measure the distribution of roughness ofthe fracture surface, defined as the height deviation of the crack surface from the mean plane. Evaluate the standarddeviation of this roughness distribution (Fig. 1(a)).2.
Perform a numerical or analytical analysis of a 1D uniaxial tensile test with the nonlocal model to be calibrated todetermine the dissipated energy density profile. Evaluate the standard deviation of this dissipated energy density profile(Fig. 1(b)). Here, the standard deviation is computed as the spatial deviation from the centre of density profile. It has, asthe standard deviation of the roughness, the unit of length.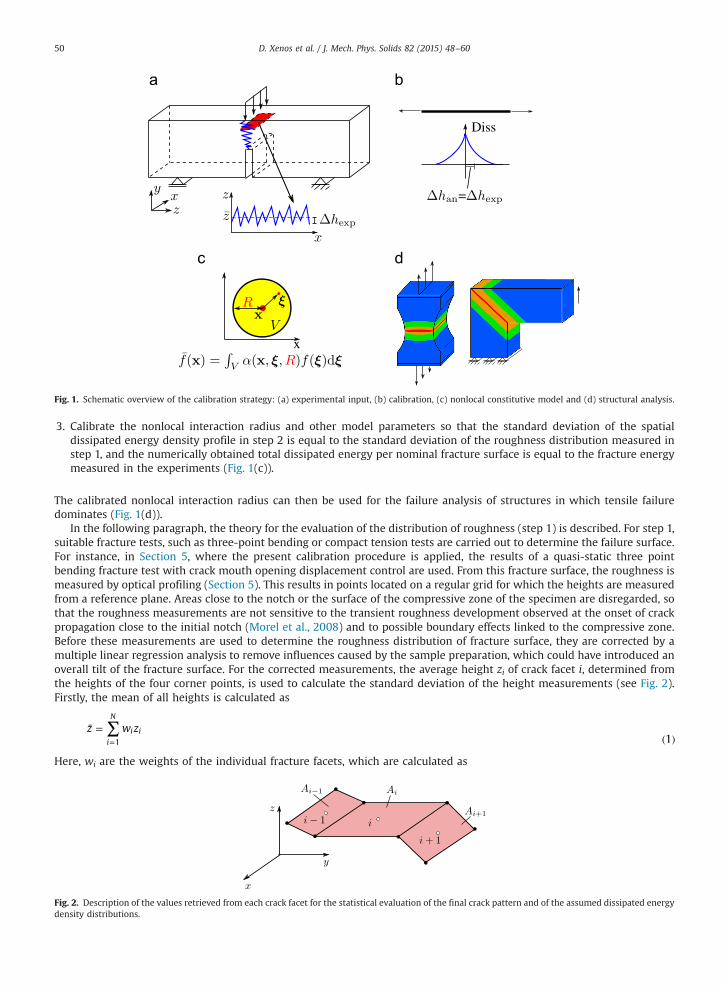
Fig. 1. Schematic overview of the calibration strategy: (a) experimental input, (b) calibration, (c) nonlocal constitutive model and (d) structural analysis.
D. Xenos et al. / J. Mech. Phys. Solids 82 (2015) 48–6050
3.
Calibrate the nonlocal interaction radius and other model parameters so that the standard deviation of the spatialdissipated energy density profile in step 2 is equal to the standard deviation of the roughness distribution measured instep 1, and the numerically obtained total dissipated energy per nominal fracture surface is equal to the fracture energymeasured in the experiments (Fig. 1(c)).The calibrated nonlocal interaction radius can then be used for the failure analysis of structures in which tensile failuredominates (Fig. 1(d)).
In the following paragraph, the theory for the evaluation of the distribution of roughness (step 1) is described. For step 1,suitable fracture tests, such as three-point bending or compact tension tests are carried out to determine the failure surface.For instance, in Section 5, where the present calibration procedure is applied, the results of a quasi-static three pointbending fracture test with crack mouth opening displacement control are used. From this fracture surface, the roughness ismeasured by optical profiling (Section 5). This results in points located on a regular grid for which the heights are measuredfrom a reference plane. Areas close to the notch or the surface of the compressive zone of the specimen are disregarded, sothat the roughness measurements are not sensitive to the transient roughness development observed at the onset of crackpropagation close to the initial notch (Morel et al., 2008) and to possible boundary effects linked to the compressive zone.Before these measurements are used to determine the roughness distribution of fracture surface, they are corrected by amultiple linear regression analysis to remove influences caused by the sample preparation, which could have introduced anoverall tilt of the fracture surface. For the corrected measurements, the average height zi of crack facet i, determined fromthe heights of the four corner points, is used to calculate the standard deviation of the height measurements (see Fig. 2).Firstly, the mean of all heights is calculated as
z w z1
N
ii i
1
∑¯ =( )=
Here, wi are the weights of the individual fracture facets, which are calculated as
Fig. 2. Description of the values retrieved from each crack facet for the statistical evaluation of the final crack pattern and of the assumed dissipated energydensity distributions.

D. Xenos et al. / J. Mech. Phys. Solids 82 (2015) 48–60 51
wA
A 2i
i
kN
k1
=∑ ( )=
where Ai is the area of fracture facet i. Here, it is assumed that all fracture facets dissipate the same energy, since informationabout individual dissipation for each fracture facet is normally not available from optical profiling. Then, the standarddeviation is calculated as
h w z z3
N
ii i
1
2∑Δ = ( − ¯)( )=
The above approach to evaluate the standard deviation hΔ was also used for the meso-scale modelling approach in Section3. For this approach, the individual dissipation for each fracture facet is available, which is considered by changing (2) to
wA d
A d 4i
i i
kN
k k1
=∑ ( )=
where di is the dissipation per unit area of the facet i.
3. Meso-scale modelling approach
The calibration procedure presented in the previous section is based on the assumptions that the large majority of energyis dissipated in a localised crack and that the standard deviation of the roughness distribution calculated with a uniformenergy dissipation across the fracture surface is very similar to the standard deviation calculated from a crack with anonuniform dissipation distribution typical for heterogeneous materials. In the present section, the validity of these twoassumptions is studied by means of two-dimensional plane stress meso-scale lattice analyses of a direct tension test. Theseanalyses are also used to study the influence of the size of heterogeneity on the standard deviation.
The lattice model has been used previously in Grassl and Jirásek (2010) and is therefore only reviewed briefly. The nodesof the lattice are randomly located in the domain, subject to the constraint of a minimum distance dmin (Fig. 3(a)). The latticeelements are obtained from the edges of the triangles of the Delaunay triangulation of the domain (solid lines in Fig. 3(a)),whereby the mid cross-sections of the lattice elements are the edges of the polygons of the dual Voronoi tessellation(dashed lines in Fig. 3(a)).
Each lattice node of an element, shown in Fig. 3(b), possesses three degrees of freedom, namely two translations and onerotation, which are related to displacement discontinuities at point C of the element by rigid body kinematics. The dis-placement discontinuities are transformed into strains by dividing them by the distance between the two lattice nodes. Thestrains are related to the stresses by an isotropic damage model. The elastic stiffness matrix in the damage model dependson two model parameters which control the elastic material properties, represented by Young's modulus E and Poisson'sratio ν of the material. The evolution of the damage parameter depends on the equivalent strain, which is a function of thenormal stress nσ and shear stress qσ , and describes in the nominal stress space an elliptic strength envelope (Fig. 4(a)). Forpure tensile loading, the nominal stress is limited by the tensile strength ft, whereas for pure compressive and pure shearloading, it is limited by the compressive strength f cfc t= and shear strength f qfq t= , respectively. An exponential softeninglaw is applied to describe the post-peak stress–strain response (Fig. 4(a)). Here, wf is a model parameter which controls theinitial slope of the softening curve and is related to the fracture energy of the material.
The heterogeneity of the material properties is considered by autocorrelated Gaussian random fields of tensile strengthand fracture energy, which are assumed to be fully correlated (Shinozuka and Jan, 1972). An exponential autocorrelationfunction is used which is controlled by the autocorrelation length la (Fig. 5(a)). This length determines the size of the area inwhich the random field assumes similar values (Fig. 5(b)). Therefore, the autocorrelation length is related implicitly to the
Fig. 3. (a) A lattice based on Delaunay triangulation and Voronoi tessellation. (b) Lattice element in the global coordinate system.

Fig. 4. (a) Elliptic strength envelope in the nominal stress space. (b) Exponential stress crack opening curve.
Fig. 5. (a) Exponential autocorrelation function R of separation distance ξ. (b) Example of random field f for a mean of unity and a coefficient of variation ofc 0.2v = .
D. Xenos et al. / J. Mech. Phys. Solids 82 (2015) 48–6052
size of the heterogeneities by determining the geometry of strong and weak zones within the specimen. It is independent ofthe spacing dmin of the lattice nodes. Thus, the geometry of the background lattice is not related to the material structure.
The lattice modelling approach is used to analyse a specimen with a periodic background lattice and periodic boundaryconditions (Fig. 6(a)). The motivation for using periodicity is that the crack patterns are not influenced by the boundaries,since the mesh is irregular throughout the specimen. The periodicity of both background lattice and boundary conditions isachieved by allowing elements to cross boundaries and by relating the DOFs of nodes located outside the cell to theirperiodic counterparts through a macroscopic strain and stress field applied to the cell (Fig. 6(b)). For instance, the dis-placements of the node J′ in Fig. 6(b) are related to those of node J inside the specimen through the macroscopic strain field.The mathematical formulation of this periodic boundary condition is described in detail in Grassl and Jirásek (2010). In theanalyses in this work, the periodic specimen was subjected to an axial stress with the condition that the average lateralstress is equal to zero. Displacement control was used so that softening, i.e. decreasing stress with increasing displacements,can be modelled.
For all analyses, the edge length of the square specimen was chosen as 100 mm. The minimum distance used for gen-erating the background lattice was set to d 0.75 mmmin = . For the first set of analyses, which was used to investigate the two
Fig. 6. Geometry of the periodic cell: (a) cell with its eight periodic neighbours and (b) detail of a schematic lattice in the periodic cell with elementscrossing the boundary.
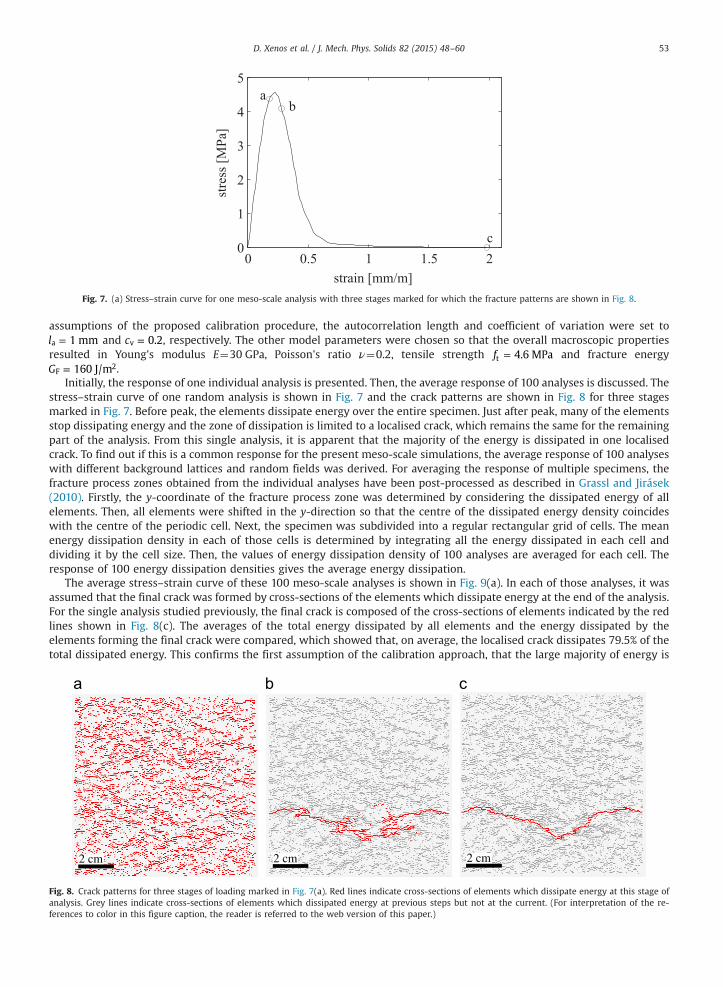
Fig. 7. (a) Stress–strain curve for one meso-scale analysis with three stages marked for which the fracture patterns are shown in Fig. 8.
D. Xenos et al. / J. Mech. Phys. Solids 82 (2015) 48–60 53
assumptions of the proposed calibration procedure, the autocorrelation length and coefficient of variation were set tol 1 mma = and c 0.2v = , respectively. The other model parameters were chosen so that the overall macroscopic propertiesresulted in Young's modulus E¼30 GPa, Poisson's ratio ν¼0.2, tensile strength f 4.6 MPat = and fracture energyG 160 J/mF
2= .Initially, the response of one individual analysis is presented. Then, the average response of 100 analyses is discussed. The
stress–strain curve of one random analysis is shown in Fig. 7 and the crack patterns are shown in Fig. 8 for three stagesmarked in Fig. 7. Before peak, the elements dissipate energy over the entire specimen. Just after peak, many of the elementsstop dissipating energy and the zone of dissipation is limited to a localised crack, which remains the same for the remainingpart of the analysis. From this single analysis, it is apparent that the majority of the energy is dissipated in one localisedcrack. To find out if this is a common response for the present meso-scale simulations, the average response of 100 analyseswith different background lattices and random fields was derived. For averaging the response of multiple specimens, thefracture process zones obtained from the individual analyses have been post-processed as described in Grassl and Jirásek(2010). Firstly, the y-coordinate of the fracture process zone was determined by considering the dissipated energy of allelements. Then, all elements were shifted in the y-direction so that the centre of the dissipated energy density coincideswith the centre of the periodic cell. Next, the specimen was subdivided into a regular rectangular grid of cells. The meanenergy dissipation density in each of those cells is determined by integrating all the energy dissipated in each cell anddividing it by the cell size. Then, the values of energy dissipation density of 100 analyses are averaged for each cell. Theresponse of 100 energy dissipation densities gives the average energy dissipation.
The average stress–strain curve of these 100 meso-scale analyses is shown in Fig. 9(a). In each of those analyses, it wasassumed that the final crack was formed by cross-sections of the elements which dissipate energy at the end of the analysis.For the single analysis studied previously, the final crack is composed of the cross-sections of elements indicated by the redlines shown in Fig. 8(c). The averages of the total energy dissipated by all elements and the energy dissipated by theelements forming the final crack were compared, which showed that, on average, the localised crack dissipates 79.5% of thetotal dissipated energy. This confirms the first assumption of the calibration approach, that the large majority of energy is
Fig. 8. Crack patterns for three stages of loading marked in Fig. 7(a). Red lines indicate cross-sections of elements which dissipate energy at this stage ofanalysis. Grey lines indicate cross-sections of elements which dissipated energy at previous steps but not at the current. (For interpretation of the re-ferences to color in this figure caption, the reader is referred to the web version of this paper.)
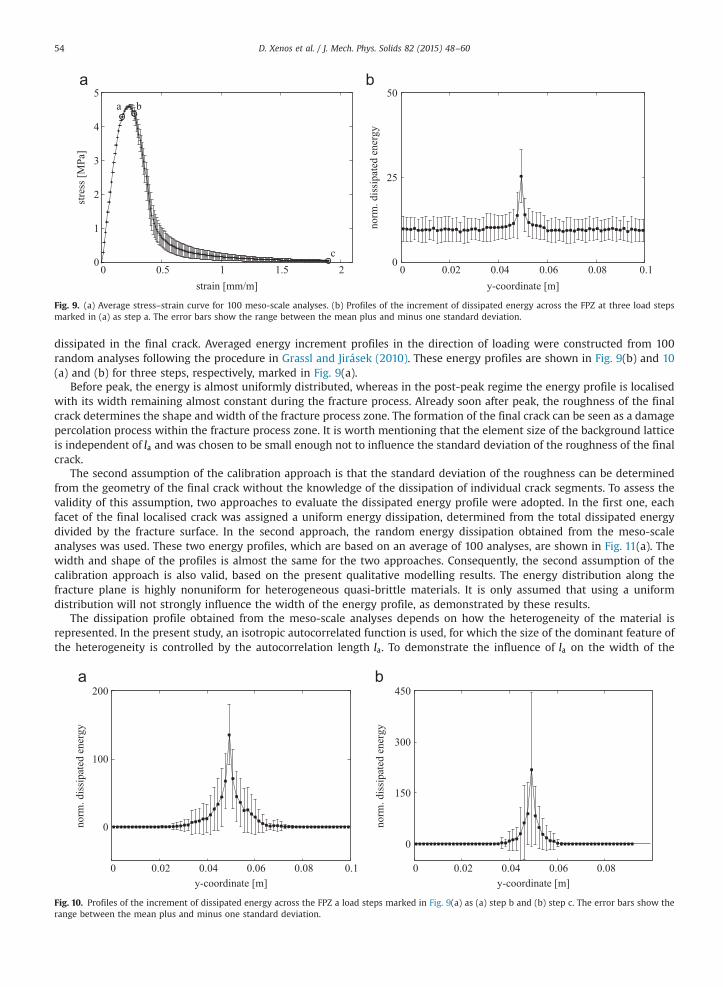
Fig. 9. (a) Average stress–strain curve for 100 meso-scale analyses. (b) Profiles of the increment of dissipated energy across the FPZ at three load stepsmarked in (a) as step a. The error bars show the range between the mean plus and minus one standard deviation.
D. Xenos et al. / J. Mech. Phys. Solids 82 (2015) 48–6054
dissipated in the final crack. Averaged energy increment profiles in the direction of loading were constructed from 100random analyses following the procedure in Grassl and Jirásek (2010). These energy profiles are shown in Fig. 9(b) and 10(a) and (b) for three steps, respectively, marked in Fig. 9(a).
Before peak, the energy is almost uniformly distributed, whereas in the post-peak regime the energy profile is localisedwith its width remaining almost constant during the fracture process. Already soon after peak, the roughness of the finalcrack determines the shape and width of the fracture process zone. The formation of the final crack can be seen as a damagepercolation process within the fracture process zone. It is worth mentioning that the element size of the background latticeis independent of la and was chosen to be small enough not to influence the standard deviation of the roughness of the finalcrack.
The second assumption of the calibration approach is that the standard deviation of the roughness can be determinedfrom the geometry of the final crack without the knowledge of the dissipation of individual crack segments. To assess thevalidity of this assumption, two approaches to evaluate the dissipated energy profile were adopted. In the first one, eachfacet of the final localised crack was assigned a uniform energy dissipation, determined from the total dissipated energydivided by the fracture surface. In the second approach, the random energy dissipation obtained from the meso-scaleanalyses was used. These two energy profiles, which are based on an average of 100 analyses, are shown in Fig. 11(a). Thewidth and shape of the profiles is almost the same for the two approaches. Consequently, the second assumption of thecalibration approach is also valid, based on the present qualitative modelling results. The energy distribution along thefracture plane is highly nonuniform for heterogeneous quasi-brittle materials. It is only assumed that using a uniformdistribution will not strongly influence the width of the energy profile, as demonstrated by these results.
The dissipation profile obtained from the meso-scale analyses depends on how the heterogeneity of the material isrepresented. In the present study, an isotropic autocorrelated function is used, for which the size of the dominant feature ofthe heterogeneity is controlled by the autocorrelation length la. To demonstrate the influence of la on the width of the
Fig. 10. Profiles of the increment of dissipated energy across the FPZ a load steps marked in Fig. 9(a) as (a) step b and (b) step c. The error bars show therange between the mean plus and minus one standard deviation.
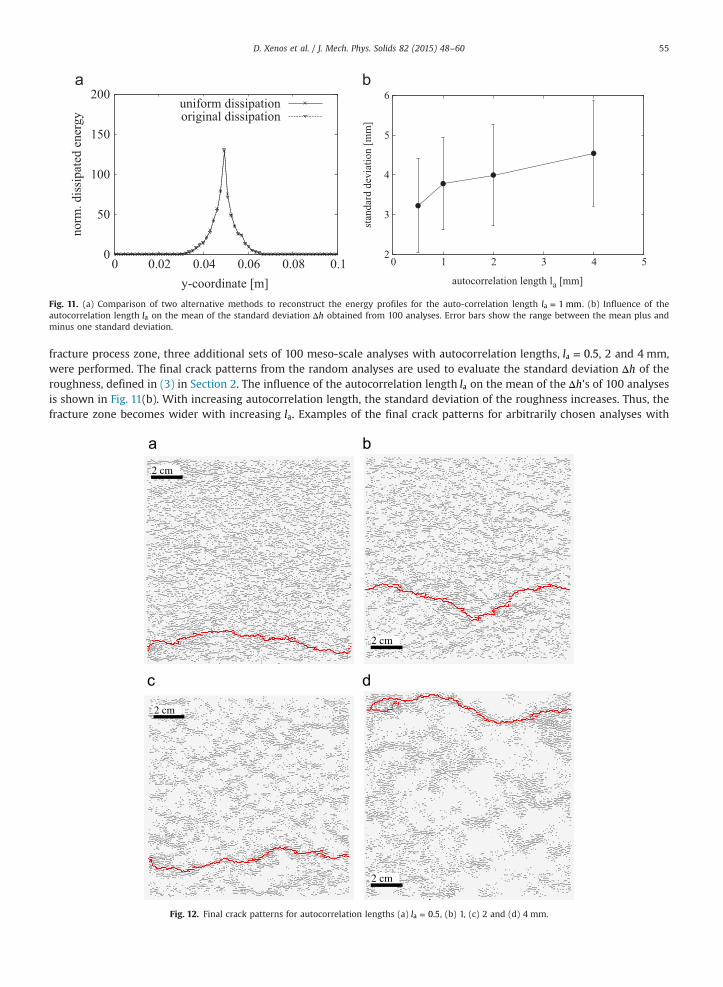
Fig. 11. (a) Comparison of two alternative methods to reconstruct the energy profiles for the auto-correlation length l 1 mma = . (b) Influence of theautocorrelation length la on the mean of the standard deviation hΔ obtained from 100 analyses. Error bars show the range between the mean plus andminus one standard deviation.
D. Xenos et al. / J. Mech. Phys. Solids 82 (2015) 48–60 55
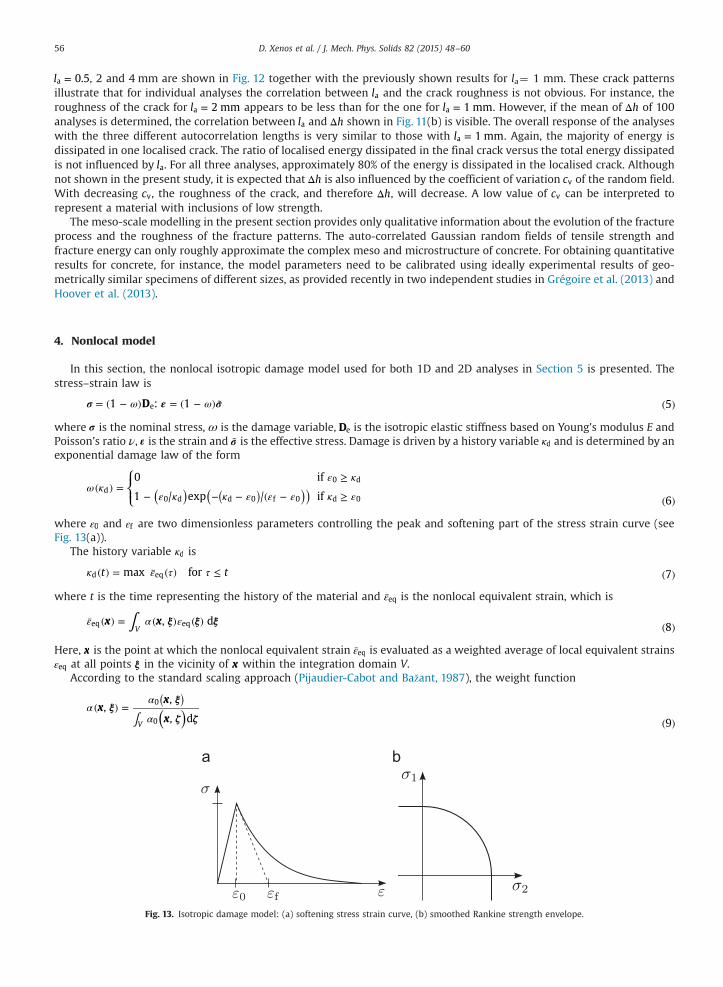
fracture process zone, three additional sets of 100 meso-scale analyses with autocorrelation lengths, l 0.5a = , 2 and 4 mm,were performed. The final crack patterns from the random analyses are used to evaluate the standard deviation hΔ of theroughness, defined in (3) in Section 2. The influence of the autocorrelation length la on the mean of the hΔ 's of 100 analysesis shown in Fig. 11(b). With increasing autocorrelation length, the standard deviation of the roughness increases. Thus, thefracture zone becomes wider with increasing la. Examples of the final crack patterns for arbitrarily chosen analyses with
Fig. 12. Final crack patterns for autocorrelation lengths (a) l 0.5a = , (b) 1, (c) 2 and (d) 4 mm.
D. Xenos et al. / J. Mech. Phys. Solids 82 (2015) 48–6056
l 0.5a = , 2 and 4 mm are shown in Fig. 12 together with the previously shown results for la¼ 1 mm. These crack patternsillustrate that for individual analyses the correlation between la and the crack roughness is not obvious. For instance, theroughness of the crack for l 2 mma = appears to be less than for the one for l 1 mma = . However, if the mean of hΔ of 100analyses is determined, the correlation between la and hΔ shown in Fig. 11(b) is visible. The overall response of the analyseswith the three different autocorrelation lengths is very similar to those with l 1 mma = . Again, the majority of energy isdissipated in one localised crack. The ratio of localised energy dissipated in the final crack versus the total energy dissipatedis not influenced by la. For all three analyses, approximately 80% of the energy is dissipated in the localised crack. Althoughnot shown in the present study, it is expected that hΔ is also influenced by the coefficient of variation cv of the random field.With decreasing cv, the roughness of the crack, and therefore hΔ , will decrease. A low value of cv can be interpreted torepresent a material with inclusions of low strength.
The meso-scale modelling in the present section provides only qualitative information about the evolution of the fractureprocess and the roughness of the fracture patterns. The auto-correlated Gaussian random fields of tensile strength andfracture energy can only roughly approximate the complex meso and microstructure of concrete. For obtaining quantitativeresults for concrete, for instance, the model parameters need to be calibrated using ideally experimental results of geo-metrically similar specimens of different sizes, as provided recently in two independent studies in Grégoire et al. (2013) andHoover et al. (2013).
4. Nonlocal model
In this section, the nonlocal isotropic damage model used for both 1D and 2D analyses in Section 5 is presented. Thestress–strain law is
D1 : 1 5eσ ε σω ω= ( − ) = ( − ) ˜ ( )
where σ is the nominal stress, ω is the damage variable, De is the isotropic elastic stiffness based on Young's modulus E andPoisson's ratio ν, ε is the strain and σ̃ is the effective stress. Damage is driven by a history variable dκ and is determined by anexponential damage law of the form
⎪⎪⎧⎨⎩
0 if
1 / exp / if 6d
0 d
0 d d 0 f 0 d 0( ) ( ))( )ω κε κ
ε κ κ ε ε ε κ ε( ) =
≥
− − − ( − ≥ ( )
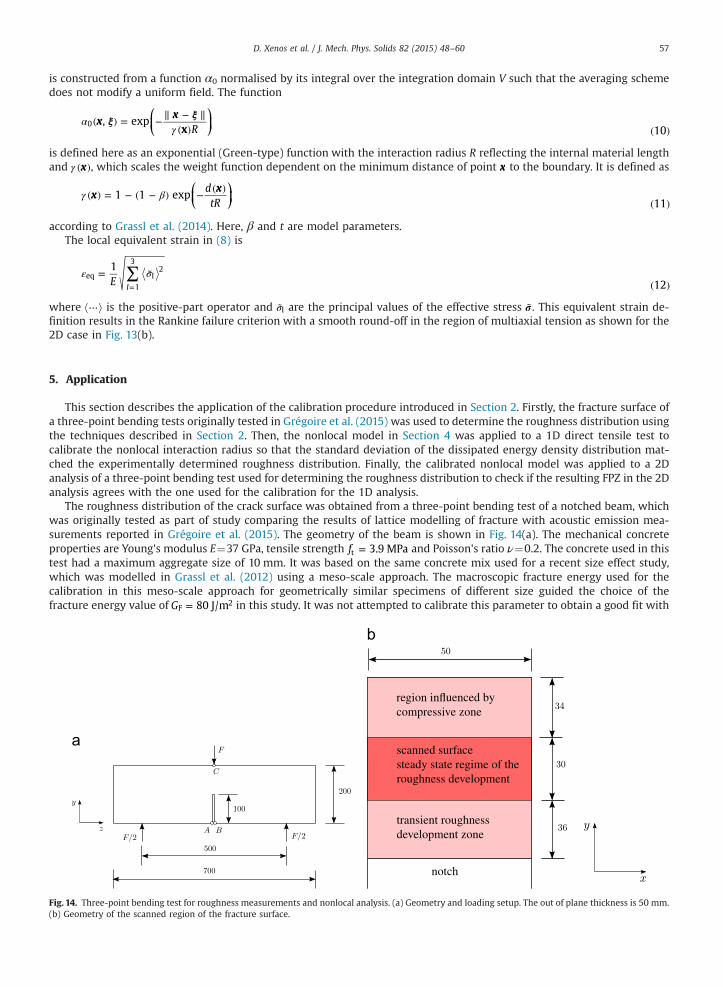
where 0ε and fε are two dimensionless parameters controlling the peak and softening part of the stress strain curve (seeFig. 13(a)).
The history variable dκ is
t tmax for 7d eqκ ε τ τ( ) = ¯ ( ) ≤ ( )
where t is the time representing the history of the material and eqε̄ is the nonlocal equivalent strain, which is
x x, d 8Veq eq∫ ξ ξ ξε α ε¯ ( ) = ( ) ( ) ( )
Here, x is the point at which the nonlocal equivalent strain eqε̄ is evaluated as a weighted average of local equivalent strainseqε at all points ξ in the vicinity of x within the integration domain V.
According to the standard scaling approach (Pijaudier-Cabot and Bažant, 1987), the weight function
xx
x,
,
, d 9V
0
0( )( )
∫ξ
ξ
ζ ζα
α
α( ) =
( )
Fig. 13. Isotropic damage model: (a) softening stress strain curve, (b) smoothed Rankine strength envelope.
D. Xenos et al. / J. Mech. Phys. Solids 82 (2015) 48–60 57
is constructed from a function α0 normalised by its integral over the integration domain V such that the averaging schemedoes not modify a uniform field. The function
⎛⎝⎜
⎞⎠⎟x
xRx
, exp10
0 ξ ξαγ
( ) = − ∥ − ∥( ) ( )
is defined here as an exponential (Green-type) function with the interaction radius R reflecting the internal material lengthand xγ ( ), which scales the weight function dependent on the minimum distance of point x to the boundary. It is defined as
⎛⎝⎜
⎞⎠⎟x
xdtR
1 1 exp11
γ β( ) = − ( − ) − ( )( )
according to Grassl et al. (2014). Here, β and t are model parameters.The local equivalent strain in (8) is
E1
12Ieq
1
3
I2∑ε σ= ˜
( )=
where ⋯ is the positive-part operator and Iσ̃ are the principal values of the effective stress σ̃ . This equivalent strain de-finition results in the Rankine failure criterion with a smooth round-off in the region of multiaxial tension as shown for the2D case in Fig. 13(b).
5. Application
This section describes the application of the calibration procedure introduced in Section 2. Firstly, the fracture surface ofa three-point bending tests originally tested in Grégoire et al. (2015) was used to determine the roughness distribution usingthe techniques described in Section 2. Then, the nonlocal model in Section 4 was applied to a 1D direct tensile test tocalibrate the nonlocal interaction radius so that the standard deviation of the dissipated energy density distribution mat-ched the experimentally determined roughness distribution. Finally, the calibrated nonlocal model was applied to a 2Danalysis of a three-point bending test used for determining the roughness distribution to check if the resulting FPZ in the 2Danalysis agrees with the one used for the calibration for the 1D analysis.
The roughness distribution of the crack surface was obtained from a three-point bending test of a notched beam, whichwas originally tested as part of study comparing the results of lattice modelling of fracture with acoustic emission mea-surements reported in Grégoire et al. (2015). The geometry of the beam is shown in Fig. 14(a). The mechanical concreteproperties are Young's modulus E¼37 GPa, tensile strength f 3.9 MPat = and Poisson's ratio ν¼0.2. The concrete used in thistest had a maximum aggregate size of 10 mm. It was based on the same concrete mix used for a recent size effect study,which was modelled in Grassl et al. (2012) using a meso-scale approach. The macroscopic fracture energy used for thecalibration in this meso-scale approach for geometrically similar specimens of different size guided the choice of thefracture energy value of G 80 J/mF
2= in this study. It was not attempted to calibrate this parameter to obtain a good fit with
Fig. 14. Three-point bending test for roughness measurements and nonlocal analysis. (a) Geometry and loading setup. The out of plane thickness is 50 mm.(b) Geometry of the scanned region of the fracture surface.
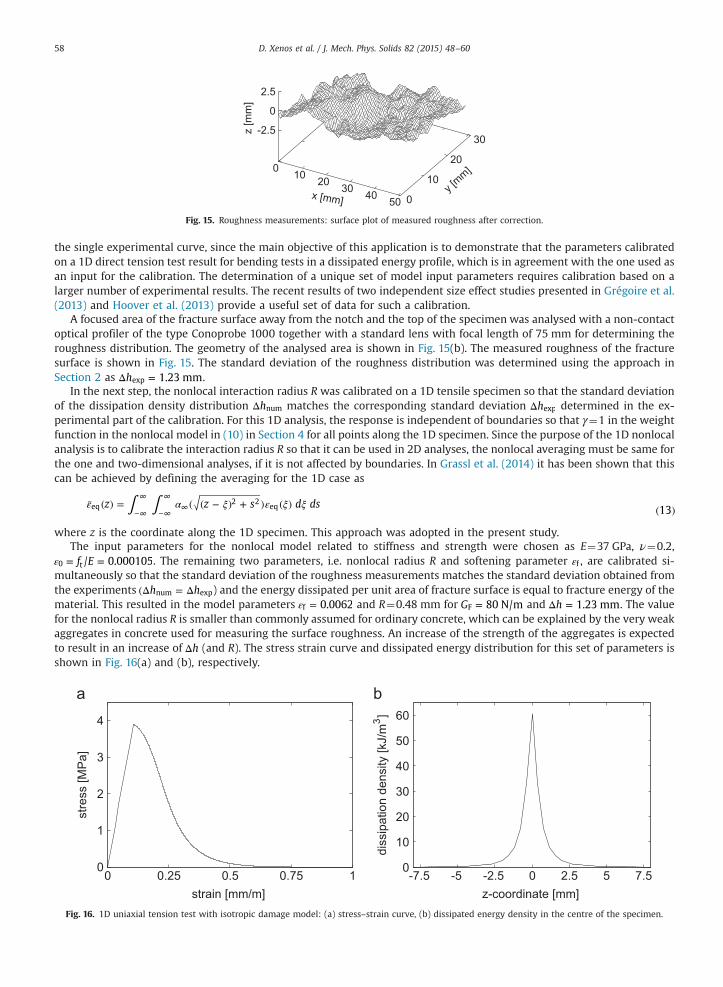
Fig. 15. Roughness measurements: surface plot of measured roughness after correction.
D. Xenos et al. / J. Mech. Phys. Solids 82 (2015) 48–6058
the single experimental curve, since the main objective of this application is to demonstrate that the parameters calibratedon a 1D direct tension test result for bending tests in a dissipated energy profile, which is in agreement with the one used asan input for the calibration. The determination of a unique set of model input parameters requires calibration based on alarger number of experimental results. The recent results of two independent size effect studies presented in Grégoire et al.(2013) and Hoover et al. (2013) provide a useful set of data for such a calibration.
A focused area of the fracture surface away from the notch and the top of the specimen was analysed with a non-contactoptical profiler of the type Conoprobe 1000 together with a standard lens with focal length of 75 mm for determining theroughness distribution. The geometry of the analysed area is shown in Fig. 15(b). The measured roughness of the fracturesurface is shown in Fig. 15. The standard deviation of the roughness distribution was determined using the approach inSection 2 as h 1.23 mmexpΔ = .
In the next step, the nonlocal interaction radius R was calibrated on a 1D tensile specimen so that the standard deviationof the dissipation density distribution hnumΔ matches the corresponding standard deviation hexpΔ determined in the ex-perimental part of the calibration. For this 1D analysis, the response is independent of boundaries so that γ¼1 in the weightfunction in the nonlocal model in (10) in Section 4 for all points along the 1D specimen. Since the purpose of the 1D nonlocalanalysis is to calibrate the interaction radius R so that it can be used in 2D analyses, the nonlocal averaging must be same forthe one and two-dimensional analyses, if it is not affected by boundaries. In Grassl et al. (2014) it has been shown that thiscan be achieved by defining the averaging for the 1D case as
z z s d ds 13eq2 2
eq∫ ∫ε α ξ ε ξ ξ¯ ( ) = ( ( − ) + ) ( ) ( )−∞
∞
−∞
∞∞
where z is the coordinate along the 1D specimen. This approach was adopted in the present study.The input parameters for the nonlocal model related to stiffness and strength were chosen as E¼37 GPa, ν¼0.2,
f E/ 0.0001050 tε = = . The remaining two parameters, i.e. nonlocal radius R and softening parameter fε , are calibrated si-multaneously so that the standard deviation of the roughness measurements matches the standard deviation obtained fromthe experiments h hnum exp(Δ = Δ ) and the energy dissipated per unit area of fracture surface is equal to fracture energy of thematerial. This resulted in the model parameters 0.0062fε = and R¼0.48 mm for G 80 N/mF = and h 1.23 mmΔ = . The valuefor the nonlocal radius R is smaller than commonly assumed for ordinary concrete, which can be explained by the very weakaggregates in concrete used for measuring the surface roughness. An increase of the strength of the aggregates is expectedto result in an increase of hΔ (and R). The stress strain curve and dissipated energy distribution for this set of parameters isshown in Fig. 16(a) and (b), respectively.
Fig. 16. 1D uniaxial tension test with isotropic damage model: (a) stress–strain curve, (b) dissipated energy density in the centre of the specimen.
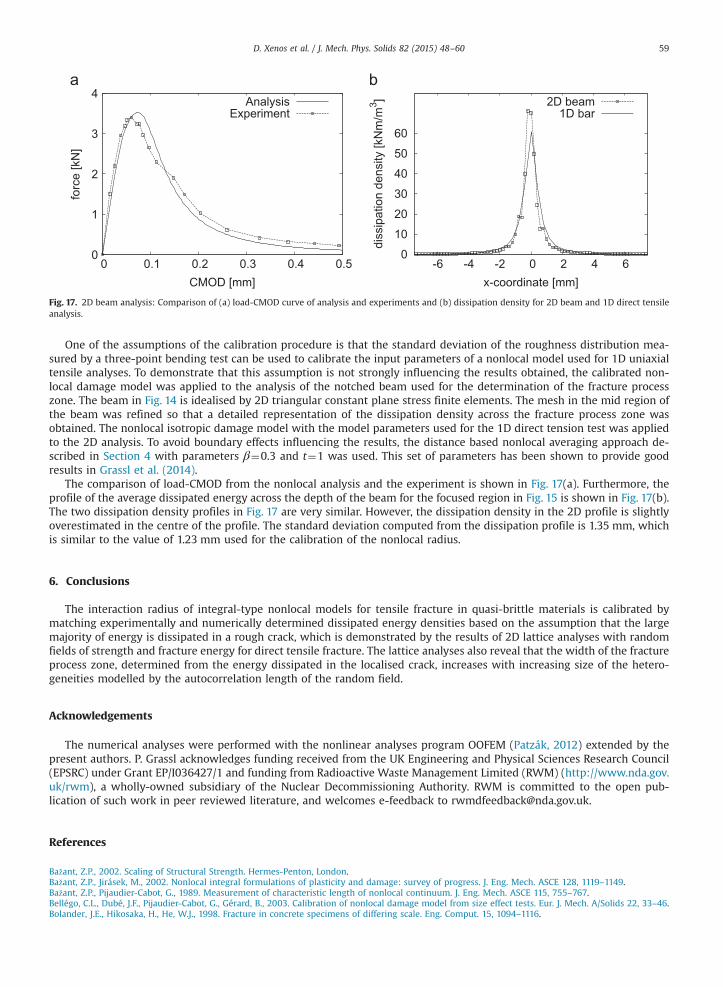
Fig. 17. 2D beam analysis: Comparison of (a) load-CMOD curve of analysis and experiments and (b) dissipation density for 2D beam and 1D direct tensileanalysis.
D. Xenos et al. / J. Mech. Phys. Solids 82 (2015) 48–60 59
One of the assumptions of the calibration procedure is that the standard deviation of the roughness distribution mea-sured by a three-point bending test can be used to calibrate the input parameters of a nonlocal model used for 1D uniaxialtensile analyses. To demonstrate that this assumption is not strongly influencing the results obtained, the calibrated non-local damage model was applied to the analysis of the notched beam used for the determination of the fracture processzone. The beam in Fig. 14 is idealised by 2D triangular constant plane stress finite elements. The mesh in the mid region ofthe beam was refined so that a detailed representation of the dissipation density across the fracture process zone wasobtained. The nonlocal isotropic damage model with the model parameters used for the 1D direct tension test was appliedto the 2D analysis. To avoid boundary effects influencing the results, the distance based nonlocal averaging approach de-scribed in Section 4 with parameters β¼0.3 and t¼1 was used. This set of parameters has been shown to provide goodresults in Grassl et al. (2014).
The comparison of load-CMOD from the nonlocal analysis and the experiment is shown in Fig. 17(a). Furthermore, theprofile of the average dissipated energy across the depth of the beam for the focused region in Fig. 15 is shown in Fig. 17(b).The two dissipation density profiles in Fig. 17 are very similar. However, the dissipation density in the 2D profile is slightlyoverestimated in the centre of the profile. The standard deviation computed from the dissipation profile is 1.35 mm, whichis similar to the value of 1.23 mm used for the calibration of the nonlocal radius.
6. Conclusions
The interaction radius of integral-type nonlocal models for tensile fracture in quasi-brittle materials is calibrated bymatching experimentally and numerically determined dissipated energy densities based on the assumption that the largemajority of energy is dissipated in a rough crack, which is demonstrated by the results of 2D lattice analyses with randomfields of strength and fracture energy for direct tensile fracture. The lattice analyses also reveal that the width of the fractureprocess zone, determined from the energy dissipated in the localised crack, increases with increasing size of the hetero-geneities modelled by the autocorrelation length of the random field.
Acknowledgements
The numerical analyses were performed with the nonlinear analyses program OOFEM (Patzák, 2012) extended by thepresent authors. P. Grassl acknowledges funding received from the UK Engineering and Physical Sciences Research Council(EPSRC) under Grant EP/I036427/1 and funding from Radioactive Waste Management Limited (RWM) (http://www.nda.gov.uk/rwm), a wholly-owned subsidiary of the Nuclear Decommissioning Authority. RWM is committed to the open pub-lication of such work in peer reviewed literature, and welcomes e-feedback to [email protected].
References
Bažant, Z.P., 2002. Scaling of Structural Strength. Hermes-Penton, London.Bažant, Z.P., Jirásek, M., 2002. Nonlocal integral formulations of plasticity and damage: survey of progress. J. Eng. Mech. ASCE 128, 1119–1149.Bažant, Z.P., Pijaudier-Cabot, G., 1989. Measurement of characteristic length of nonlocal continuum. J. Eng. Mech. ASCE 115, 755–767.Bellégo, C.L., Dubé, J.F., Pijaudier-Cabot, G., Gérard, B., 2003. Calibration of nonlocal damage model from size effect tests. Eur. J. Mech. A/Solids 22, 33–46.Bolander, J.E., Hikosaka, H., He, W.J., 1998. Fracture in concrete specimens of differing scale. Eng. Comput. 15, 1094–1116.

D. Xenos et al. / J. Mech. Phys. Solids 82 (2015) 48–6060
Bolander, J.E., Saito, S., 1998. Fracture analysis using spring networks with random geometry. Eng. Fract. Mech. 61, 569–591.Carmeliet, J., 1999. Optimal estimation of gradient damage parameters from localization phenomena in quasi-brittle materials. Mech. Cohesive-Frictional
Mater. 4, 1–16.Cedolin, L., Poli, S.D., Iori, I., 1987. Tensile behavior of concrete. J. Eng. Mech. 113, 431–449.Delaplace, A., Pijaudier-Cabot, G., Roux, S., 1996. Progressive damage in discrete models and consequences on continuum modelling. J. Mech. Phys. Solids
44, 99–136.Grassl, P., Bažant, Z.P., 2009. Random lattice-particle simulation of statistical size effect in quasi-brittle structures failing at crack initiation. J. Eng. Mech. 135,
85–92.Grassl, P., Fahy, C., Gallipoli, D., Wheeler, S.J., 2015. On a 2d hydro-mechanical lattice approach for modelling hydraulic fracture. J. Mech. Phys. Solids 75,
104–118.Grassl, P., Grégoire, D., Solano, L.R., Pijaudier-Cabot, G., 2012. Meso-scale modelling of the size effect on the fracture process zone of concrete. Int. J. Solids
Struct. 49, 1818–1827.Grassl, P., Jirásek, M., 2010. Meso-scale approach to modelling the fracture process zone of concrete subjected to uniaxial tension. Int. J. Solids Struct. 47,
957–968.Grassl, P., Xenos, D., Jirásek, M., Horák, M., 2014. Evaluation of nonlocal approaches for modelling fracture near nonconvex boundaries. Int. J. Solids Struct.
51, 3239–3251.Grégoire, D., Rojas-Solano, L.B., Lefort, V., Grassl, P., Saliba, J., Regoin, J.P., Loukili, A., Pijaudier-Cabot, G., 2015. Mesoscale analysis of failure in quasi-brittle
materials: comparison between lattice model and acoustic emission data. Int. J. Numer. Anal. Methods Geomech. http://dx.doi.org/10.1002/nag.2363.Grégoire, D., Rojas-Solano, L.B., Pijaudier-Cabot, G., 2013. Failure and size effect for notched and unnotched concrete beams. Int. J. Numer. Anal. Methods
Geomech. 37, 1434–1452.Haidar, K., Pijaudier-Cabot, G., Dubé, J.F., Loukili, A., 2005. Correlation between internal length, the fracture process zone and size effect in model materials.
Mater. Struct. 35, 201–210.Herrmann, H.J., Hansen, A., Roux, S., 1989. Fracture of disordered elastic lattices in 2 dimensions. Phys. Rev. B 39, 637–648.Hoover, C., Bažant, Z.P., Vorel, J., Wendner, R., Hubler, M., 2013. Comprehensive concrete fracture tests: description and results. Eng. Fract. Mech. 114,
92–103.Iacono, C., Sluys, L.J., van Mier, J.G.M., 2006. Estimation of model parameters in nonlocal damage theories by inverse analysis techniques. Comput. Methods
Appl. Mech. Eng. 195, 7211–7222.Iacono, C., Sluys, L.J., van Mier, J.G.M., 2008. Calibration of a higher-order continuum model using global and local data. Eng. Fract. Mech. 75, 4642–4665.Jirásek, M., Rolshoven, S., Grassl, P., 2004. Size effect on fracture energy induced by non-locality. Int. J. Numer. Anal. Methods Geomech. 28, 653–670.Landis, E.N., 1999. Micro–macro fracture relationships and acoustic emissions in concrete. Constr. Build. Mater. 13, 65–72.Lange, D.A., Jennings, H.M., Shah, S.P., 1993. Relationship between fracture surface-roughness and fracture-behavior of cement paste and mortar. J. Am.
Ceram. Soc. 76, 589–597.Mihashi, H., Nomura, N., Niiseki, S., 1991. Influence of aggregate size on fracture process zone of concrete detected with 3-dimensional acoustic-emission
technique. Cem. Concr. Res. 21, 737–744.Morel, S., Bonamy, D., Ponson, L., Bouchaud, E., 2008. Transient damage spreading and anomalous scaling in mortar crack surfaces. Phys. Rev. E 78, 016112.Mourot, G., Morel, S., Bouchaud, E., Valentin, G., 2006. Scaling properties of mortar fracture surfaces. Int. J. Fract. 140, 39–54.Muralidhara, S., Prasad, B.K., Eskandari, H., Karihaloo, B.L., 2010. Fracture process zone size and true fracture energy of concrete using acoustic emission.
Constr. Build. Mater. 24, 479–486.Nirmalendran, S., Horii, H., 1992. Analytical modelling of microcracking and bridging in fracture of quasi-brittle materials. J. Mech. Phys. Solids 40, 863–886.Otsuka, K., Date, H., 2000. Fracture process zone in concrete tension specimen. Eng. Fract. Mech. 65, 111–131.Patzák, B., 2012. OOFEM – an object-oriented simulation tool for advanced modeling of materials and structures. Acta Polytech. 52, 59–66.Pijaudier-Cabot, G., Bažant, Z.P., 1987. Nonlocal damage theory. J. Eng. Mech. ASCE 113, 1512–1533.Planas, J., Elices, M., Guinea, G.V., 1992. Measurement of the fracture energy using three-point bend tests: part 2—influence of bulk energy dissipation.
Mater. Struct. 25, 305–312.Ponson, L., Bonamy, D., Auradou, H., Mourot, G., Morel, S., Bouchaud, E., Guillot, C., Hulin, J., 2006. Anisotropic self-affine properties of experimental fracture
surfaces. Int. J. Fract. 140, 27–37.Schlangen, E., Van Mier, J.G.M., 1992. Simple lattice model for numerical simulation of fracture of concrete materials and structures. Mater. Struct. 25,
534–542.Shinozuka, M., Jan, C.M., 1972. Digital simulation of random processes and its applications. J. Sound Vib. 25, 111–128.Skarżyński, L., Syroka, E., Tejchman, J., 2011. Measurements and calculations of the width of the fracture process zones on the surface of notched concrete
beams. Strain 47, e319–e332.Wu, Z., Rong, H., Zheng, J., Xu, F., Dong, W., 2011. An experimental investigation on the FPZ properties in concrete using digital image correlation technique.
Eng. Fract. Mech. 78, 2978–2990.Zubelewicz, A., Bažant, Z.P., 1987. Interface modeling of fracture in aggregate composites. J. Eng. Mech. ASCE 113, 1619–1630.