15n-cpmas nuclear magnetic resonance spectroscopy - chemistry
TRANSCRIPT
15N-CPMAS nuclear magnetic resonance spectroscopy andbiological stability of soil organic nitrogen in whole soil and
particle-size fractions
R.J. DiCostya,*, D.P. Welikyb, S.J. Andersonc, E.A. Pauld
aUSDA Forest Service, Southern Research Station, 320 Green St., Athens, GA 30602, USAbDepartment of Chemistry, Michigan State University, East Lansing, MI 48824, USA
cEarth Systems Science and Policy, California State University- Monterey Bay, Seaside, CA 93955, USAd843 Rossum Dr., Loveland, CO 80537, USA
Received 20 February 2003; accepted 8 August 2003
(returned to author for revision 10 June 2003)
Abstract
Soil organic nitrogen was quantified by solid-state 15N cross-polarization nuclear magnetic resonance spectroscopy(NMR) during a 14-month laboratory incubation of a sandy loam soil amended with 15N-clover. In whole soil and
particle-size fractions, the clover-derived N was always 85–90% amide, 5–10% guanidinium N of arginine, and 5%amino. Quantitativeness of these results was suggested by (1) analysis of a standard containing a complex mixture oforganic 15N and (2) correlation of spectral intensities with 15N concentrations. Based on the unchanging proteinaceousNMR signature of clover-derived N throughout the incubation, differences in the mineralization/immobilization
kinetics of clover-N among the different particle-size fractions appeared not to be linked to organic functional group.Kinetic analysis of the mineralization of 15N, with correction of rate constants for field temperatures, suggested that theproteinanceous 15N in the clay and fine silt fractions observed here had a mean residence time of 7 years in the field.
# 2003 Elsevier Ltd. All rights reserved.
1. Introduction
The chemical structure of soil organic nitrogen (SON)is controversial. Broadly speaking, soil organic nitrogen
has been studied by one of three methods: (1) wet che-mical extraction, (2) pyrolysis mass spectrometry, and(3) 15N-nuclear magnetic resonance spectroscopy. Frac-
tions isolated by wet chemical extraction include aminoacid-N, amino sugar-N, ‘‘NH3–N’’,1 hydrolyzableunknown N, and acid-insoluble N (Stevenson, 1994);
about one half of soil N is unidentifiable by this tech-nique (Schnitzer, 1985; Stevenson, 1994). Soil scientists
have applied cross-polarization magic-angle spinning15N-nuclear magnetic resonance spectroscopy in thesolid state (CPMAS–NMR) and pyrolysis-mass spec-trometry (PyMS) to gain further information about the
chemical structure of soil organic N, but the conclusionsof different investigators are often contradictory.
Based on PyMS and chromatography studies of whole
soils and hydrolysis fractions, Schulten and Schnitzer(1998) state that soil N is distributed as follows: proteins+peptides+amino acids, 40%; amino sugars, 5–6%;
heterocyclic N, 35%; and ‘‘NH3’’, 19%. In a PyMS studyof agricultural soils, Schulten and Hempfling (1992)found a negative correlation between heterocyclic N andtotal soil N. According to these authors, the low-N soils
had a decreased capacity to immobilize N (as a result ofmanagement practices) and thereby became enrichedwith relatively resistant heterocyclic N.
0146-6380/$ - see front matter # 2003 Elsevier Ltd. All rights reserved.
doi:10.1016/j.orggeochem.2003.08.005
Organic Geochemistry 34 (2003) 1635–1650
www.elsevier.com/locate/orggeochem
* Corresponding author. Fax: +706-559-4317.
E-mail address: [email protected] (R.J. DiCosty).1 NH3–N is operationally defined as the ammonia recovered
upon steam distillation of MgO-treated hydrolysate.
In contrast to the above studies, NMR researchershave found 80% or more of soil N in amide form (pep-tide bonds in proteins), with the remainder in the formof amino acids, amino sugars, or the amino groups of
nucleic acid bases (Knicker et al., 1993, 1997, 1999;Clinton et al., 1995; Hopkins et al., 1997). HeterocyclicN has been identified by NMR analysis of soil humic
and fulvic acids, but with concentrations ranging from 4to 9% (Zhuo and Wen, 1992) or from 9 to 22%(Mahieu et al., 2000). These concentrations of hetero-
cyclic N are below those proposed by Schulten andSchnitzer (1998), and may be somewhat overestimateddue to overlap of the relatively small heterocyclic N
peaks by the adjacent large amide peak. [See spectra inZhuo and Wen (1992) and Mahieu et al. (2000).] Giventhat Schulten and Hempfling (1992) proposed that het-erocyclic N is an indicator of agricultural management
practices (see above), it is important to reconcile thecontroversy concerning the chemical nature of soilorganic N.
Both PyMS and CPMAS–NMR have potential prob-lems in quantitation of soil organic N. In the case ofPyMS, incomplete sample volatilization or thermal
rearrangement may confound the analysis (Schulten etal., 1995). In CPMAS–NMR, quantitation may fail ifdifferential relaxation effects during the contact and
delay times are not considered. These effects have beenassessed in plant material, compost, and soluble extracts(Knicker and Ludemann, 1995; Knicker et al., 1997),but have not been thoroughly investigated in soil.
Another potential problem of CPMAS–NMR is thatrigid aromatic structures may have excessively long T1H
values (50 s or more) (Wilson et al., 1984); the delay
times required to detect the N in such structures may betoo lengthy for a practical experiment. Furthermore,NMR studies of soil N often require addition of 15N;
incubation time of the 15N with soil may be insufficientfor formation of heterocyclic N (Schulten and Schnitzer,1998). Finally, NMR may be currently unable to detectthe numerous heterocyclic N structures thought to be
present in soil (Schulten and Schnitzer, 1998). Thestructures may be obscured by the high frequencyshoulder of the amide-N peak. If numerous heterocyclic
N structures exist in soil and have a wide range of chem-ical shifts, the structures may give rise to numeroussmall signals that are undetectable in a typical CPMAS–
NMR experiment.Despite the limitations of CPMAS–NMR, its non-
invasiveness makes it attractive for studies of SON. The
technique has only recently been applied to soil particle-size fractions (Knicker et al., 1999), which are known tocontain biologically and chemically distinct pools oforganic matter (e.g. Catroux and Schnitzer, 1987). It is
of interest to determine if the amide-dominated spectrafound in the particle-size fractions studied by Knicker etal. (1999) are characteristic of most soils.
Our objectives were to (1) measure differentialrelaxation effects of the various SON functional groupsin a soil amended with 15N clover, (2) test whetherCPMAS–NMR is quantitative for both heterocyclic and
noncyclic SON, and (3) use CPMAS–NMR to quantifythe SON functional groups formed in whole soil andparticle-size fractions during clover decomposition.
2. Materials and methods
2.1. Clover-uracil-soil test sample
For testing whether NMR was quantitative (Objec-tives 1 and 2 of the Introduction), an intimate mixtureof 15N-uracil, 15N-clover, and unlabeled soil (Marletteseries, see below) was prepared such that the molecular
interactions (e.g. binding to soil particles) would besomewhat similar to those expected in a natural soil.The uracil, clover, and soil were combined in a sufficient
volume of water for complete dissolution of the uracil;the resulting suspension was mechanically shaken for 1h, quickly frozen in liquid nitrogen (to minimize pre-
cipitation of relatively insoluble uracil), and lyophilized.This mixing method influenced the NMR behavior ofthe sample; the sample prepared as above exhibited a
lower T1H value than a sample mixed only by grindingwith mortar and pestle (data not shown). This is likelydue to shorter distances between 15N nuclei and para-magnetic species (e.g. Fe) in the water-treated sample.
The quantitativeness of NMR for the aforementionedmixture of 15N-uracil, 15N-clover, and unlabeled soilwas evaluated by comparing the NMR peak area pro-
portions to the known sample composition, after cor-rection for differential relaxation effects (as describedbelow).
2.2. Soil incubation experiment
2.2.1. Overview
The objective of quantifying soil organic N duringclover decomposition (Objective 3 of the Introduction)was addressed via a soil incubation experiment. The Ap
horizon of an agricultural soil was amended with 15N-labeled red clover (Trifolium pratense L.) and incubatedin laboratory microlysimeters for 14 months. Inorganic
N was removed via in situ leaching several times duringthe incubation. On five dates, the incubated soil wasultrasonically fractionated into five size classes, and the
concentrations of N and 15N were determined for eachsize fraction and whole soil. The applicability of theobserved N dynamics to field conditions was evaluatedby comparing the whole-soil N retention observed here
to that measured in the field by other researchers, aftermaking temperature corrections with the Q10 equation(Katterer et al., 1998). On three of the five dates, the
1636 R.J. DiCosty et al. / Organic Geochemistry 34 (2003) 1635–1650

SON in the fractions and whole soil was characterizedby CPMAS–NMR.
2.2.2. C, N, and 15N analyses
Total C and N contents of clover, soils, and particle-size fractions were determined by dry combustion(Carlo Erba NA 1500 Series 2 N/C/S Analyzer). The15N concentrations of the clover, soils and particle-sizefractions were determined by mass spectrometry ateither Michigan State University (Europa Scientific 20-
20 Stable Isotope Analyzer) or University of Georgia.Samples were diluted as necessary with natural abun-dance N in the form of atropine, soil, or aqueous
ammonium sulfate to avoid introducing excessive 15Ninto the mass spectrometers. For whole soil sampleswith high levels of nitrate, inorganic N was removedprior to dry combustion and mass spectrometric ana-
lyses by thrice extracting with 0.01 M CaCl2. Dixon’sgap test (Bliss, 1967) was used to identify outliers at the10% probability level for replicated elemental and iso-
topic analyses (C, N and 15N). These outliers compriseda small proportion of the data, and were excluded fromthe final data due only to their extreme deviations. This
was deemed necessary because it is difficult to com-pletely avoid analytical errors in samples with lowmasses or low concentrations of analytes.
2.2.3. Soil and plant material. The soil used for theincubation was a fine-loamy, mixed mesic GlossoboricHapludalf (Marlette series) from East Lansing, Michi-
gan, USA. The Ap layer of soil was excavated from 0 to10 cm depth, air-dried, sieved to remove fragments >2mm in diameter, and thoroughly mixed.
The particle-size distribution of the soil was deter-mined by the pipet method (Gee and Bauder, 1986;Whittig and Allardice, 1986). Carbonates were removed
and the soil cation exchange sites were saturated withsodium by treatment with 1 M sodium acetate (adjustedto pH 5), at 70–80 �C. Excess salts were then removedby centrifugation with water, after which organic matter
was removed by addition of 30% hydrogen peroxide at70 �C. Next, sodium hexametaphosphate was addedfollowed by either 24 h or more of soaking or about 16
h of shaking; both methods gave the same results. Sand(>53 mm diameter) was determined by sieving, and finesilt (2–10 mm) and coarse clay (0.2–2 mm) were deter-
mined by shaking the remaining suspension and takingpipet aliquots at the appropriate settling times. Fine clay(<0.2 mm) was determined in a tube centrifuge based on
an integrated version of Stokes’ law, and coarse silt (10–53 mm) was determined by difference. Throughout theprocedure, the presence of residual salts was taken intoaccount by appropriate measurements and corrections.
The results are shown in the leftmost data column ofTable 1. The soil was identified as a sandy loam per theUSDA textural classification system (Brady, 1990).
The clover (Trifolium pratense L.) used as a soilamendment had been grown hydroponically using15NO3 as the sole N source. The clover was freeze-driedand ball-milled to a powdery texture prior to mixing it
with soil. The characteristics of the clover were as fol-lows (means�sample standard deviations): Ntotal (gkg�1)=38.9�1.0, molar C:N ratio=12.9�0.4, atom%15N=91.8�2.0.
2.2.4. Incubation conditions. Soils were incubated at
room temperature (about 23 �C) in the dark in labora-tory-scale microlysimeters (Nadelhoffer, 1990). Beforeincubation, the soil was amended with 34.3 g of the 15N-
labeled red clover per kg amended soil (dry basis). Thetotal C and N contents of the soil were approximatelydoubled as a result of adding the amendment, and theclover-C corresponded to about 1.4% of the soil dry
weight. The high concentration of clover in the soilensured that 15N-NMR spectra could be obtained in areasonable amount of time.
Into each microlysimeter, 62.1 g of amended soil (drybasis) were packed at an approximate bulk density of1.2 Mg m�3. Then, water was added to �33 kPa soil
water potential. The soil water potential was maintainedby adding water about twice per week. Excess inorganicN produced by the mineralization of the clover was
removed by leaching the microlysimeters on severaloccasions with N-free nutrient solution (Nadelhoffer,1990). The N-free nutrient solution contained 1.3 mMCaCl2, 0.67 mM KH2PO4, 0.33 mM K2SO4, 0.33 mM
MgSO4, 8.33 mM H3BO3, 0.67 mM MnCl2, 0.67 mMZnSO4, 0.17 mM CuSO4, and 0.17 mM Na2MoO4, withfinal pH=5.1. At the end of the study, about 11 pore
volumes of leachate had been collected from eachmicrolysimeter.
2.2.5. Ultrasonic fractionation of soil. After 11, 34, 95,190, and 439 days of incubation, the soil from twomicrolysimeters was composited, sonicated, and sepa-rated into five organo-mineral size classes. The size
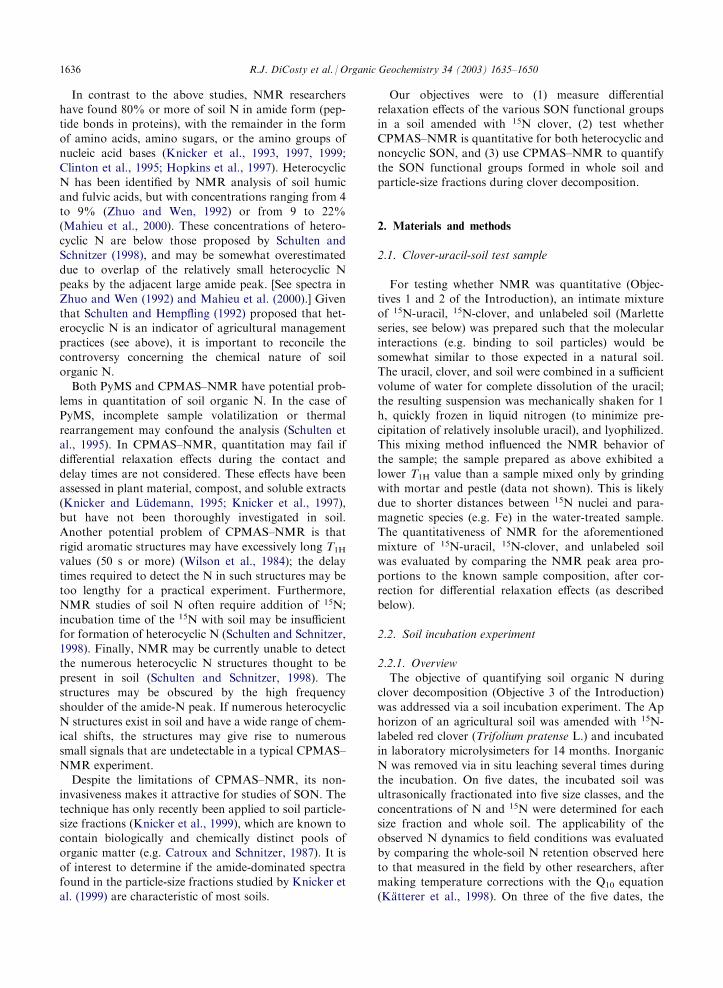
classes were fine clay (0–0.2 mm diameter), coarse clay(0.2–2 mm), fine silt (2–10 mm), coarse silt (10–53 mm),and sand (53–2000 mm). An ultrasonic energy of 38.3 kJ
per 28 g soil was used; the energy was measured asdescribed by Morra et al. (1991) and North (1976). Thisenergy produced a particle-size distribution that was
lower in fine clay but higher in coarse clay and fine siltthan that of the pipet method (Table 1). Sonication wascarried out in a 250-ml beaker that was resting in an ice
bath, with a 1:5 soil:water ratio (w/w), 28 g soil (drybasis), 1.27 cm (0.5 in) ultrasonic probe diameter, and 3cm probe depth. The incubated soils required briefhand-shaking after addition of water; the shaking served
to break up large clods of moist soil prior to sonication.After sonication, the three finest size fractions were
physically separated on the basis of Stokes’ law. The
R.J. DiCosty et al. / Organic Geochemistry 34 (2003) 1635–1650 1637
fine clay was isolated by centrifugation, the coarse clayby gravity sedimentation at 4 �C (the low temperature
served to slow microbial transformations), and the finesilt by gravity sedimentation at room temperature. Eachseparation consisted of eight centrifugation or sedi-
mentation cycles. During the separations, the concen-tration of clay was kept below 10 g/l because clayconcentrations above 10 g/l significantly increase the
suspension viscosity relative to pure water and therebyconfound the Stokes’ law calculations (Elonen, 1971).After the three finest size fractions were isolated, the
coarse silt and sand were separated by wet sieving.When the separations were completed, the three fine
size fractions were concentrated by flocculation withMgCl2; the supernatant was removed by siphoning,
with centrifugation as necessary. The two coarse sizefractions were either flocculated as above or allowed to set-tle under gravity, and were concentrated by siphoning the
supernatant. Salts were removed by dialysis at 4 �C. Theseparation, concentration, and dialysis were completed inabout 2 weeks, with samples stored at 4 �C between steps.
The separated fractions and a sample of unfractionatedwhole soil were lyophilized, and stored at�70 �C.
2.3. NMR spectroscopy
NMR spectra of the solid state samples were acquiredon a Varian VXR 400 MHz spectrometer with afrequency of 40.5 MHz for 15N and 400.0 MHz for 1H.
Cross-polarization magic-angle spinning (CPMAS) wasused to enhance the signal-to-noise ratio and hasten
data acquisition (Fig. 1). In the CPMAS technique, a90� pulse to 1H is followed by a simultaneous irradi-ation of 1H and 15N at fields corresponding to the
Hartmann–Hahn match (Stejskal and Memory, 1994).During this period of simultaneous irradiation (knownas the contact time), magnetization is transferred from1H to 15N. The exponential rates of magnetizationbuildup and decay for 15N during the contact time arecharacterized by the cross-polarization buildup time
(TNH) and spin-lattice relaxation time in the rotatingframe (T1rH), respectively, and vary according to Nfunctional group.
After the contact time, the 15N signal is acquired
during a period of high-power proton decoupling (theacquisition time). The CPMAS scan then concludes withthe delay time, in which the 1H nuclei return (in whole
or in part) to equilibrium. The characteristic time T1H
for 1H to return to equilibrium (spin-lattice relaxationtime of 1H in the laboratory frame) may vary with
functional group.Standard samples were run to ensure optimal perfor-
mance of the spectrometer before each series of NMRexperiments. The magic angle was optimized using KBr.
The 90� 1H pulse length, and cross-polarization anddecoupling fields were optimized on a setup samplecomprised of 15N-uracil, (15NH4)2SO4, and unlabeled
Table 1
Particle-size distribution as determined by conventional pipet or ultrasound methods
Method
Fraction
Conventionalpipet (%)a
Ultrasound
(38.3 kJ/28 g
soil) (%)a
Ultrasonic yield/
conventional yield
fine clay (<0.2 mm)
6.5 (0.3) 3.8 (0.6) 0.59Coarse clay (0.2–2mm)
9.1 (0.9) 12.4 (0.7) 1.37Fine silt (2–10 mm)
9.9 (0.9) 12.0 (0.4) 1.21Coarse silt (10–53 mm)
19.7 (0.2) 15.4 (2.9) 0.78Sand (53–2000 mm)
54.8 (0.2) 56.3 (3.1) 1.03a Sample standard deviations in parentheses.
Fig. 1. The cross-polarization magic angle spinning pulse sequence for 15N.
1638 R.J. DiCosty et al. / Organic Geochemistry 34 (2003) 1635–1650

soil. This sample had been intimately mixed in the samemanner as was the (uracil+clover+soil) used for testingthe quantitativeness of NMR (see above). In the setupsample, the uracil (Fig. 2) served to verify that the
spectrometer could detect heterocyclic N, and the nar-row resonance of (15NH4)2SO4 allowed for precisedetermination of the cross-polarization fields. The 90�
1H pulse lengths were between 6.5 and 10.5 ms, and thedecoupling frequency during acquisition was 65–80 kHz(as measured with an oscilloscope). With this decou-
pling frequency and 10 Hz of line broadening, max-imum (full-width at half-maximum) linewidths were 4–6ppm for uracil and 2 ppm for ammonium sulfate. Opti-
mal contact times were 0.2–0.4 ms; delay times were 0.5 sor longer to avoid probe overheating, and acquisitiontimes were 6–10 ms.
For experimental soil samples, 200–300 mg of soil
were packed into a silicon nitride rotor of 7 mm dia-meter and spun at a frequency of 4500 Hz. Chemicalshifts were referenced to (15NH4)2SO4 (=0 ppm); che-
mical shift assignments are summarized in Table 2 andgiven in detail in Appendix A.
2.3.1. Correction for differential relaxation effects. Dif-ferential relaxation effects were considered to insureaccurate quantitation of NMR spectra. The
following model accounted for differential relaxationeffects during the contact and delay times, and is basedon concepts and equations presented by Stejskal andMemory (1994):
S0 ¼ S tC; tDð Þ
"
�1 � TNH=T1rH
� �exp �tC=T1rH
� �� exp �tC=TNHð Þ
!
�1
1 � exp �tD=T1Hð Þ
� �#ð1Þ
where S0 is the theoretical signal intensity, S(tC,tD) is the
measured signal intensity at contact time tC and delaytime tD, and TNH, T1rH, and T1H are as described pre-viously. The first and second terms within the square
brackets account for differential relaxation during thecontact and delay times, respectively. For convenience,the first term within the square brackets will be referredto as the contact-time correction factor (CFtC):
CFtC ¼1 � TNH=T1rH
� �exp �tc=T1rH
� �� exp �tc=TNHð Þ
ð2Þ
To implement the model, NMR spectra were acquiredfor each sample matrix (i.e. clover, whole soil, fine clay,
coarse clay, fine silt, and (clover+uracil+soil)) withsystematic variation of the contact and delay times.Model parameters were generated with either the
COMPLEX nonlinear optimization program of Box(Kuester and Mize, 1973; as modified by Dr. ThomasManetsch, Michigan State University) or the Marquardtmethod within PROC NLIN of the SAS software (SAS
Institute, 1989); standard errors of the parameters werecomputed using SAS.
2.4. Clover-N mineralization in whole soil and particle-size fractions
Clover-N mineralization in whole soil and particle-
size fractions was measured by the kinetic analysis oforganic clover-derived N in whole soils and particle-sizefractions as a function of incubation time. The clover-derived N amounts in the various fractions were com-
puted with the assumption that isotopic discrimination
Fig. 2. Chemical structure of uracil.Table 2
Summary of 15N chemical shifts
Shift region (ppm)
Nitrogen functionality0
Ammonium5–34
Amino groups in free and amino-terminal amino acids42–76
Amino groups of nucleic acids, guanidine nitrogens of arginine, indole-N of tryptophan83–116
Amide N of proteins120–148
Heterocyclic N in certain positions in nucleic acids, in histidine, or in flavin158
Heterocyclic N in pyrrole (chlorophyll)170–211
Heterocyclic N in nucleic acids, in flavin, or in pyrrole (chlorophyll)312–320
Heterocyclic N in oxidized flavin structures354
NitrateR.J. DiCosty et al. / Organic Geochemistry 34 (2003) 1635–1650 1639
was negligible, and the data were fit to one of twomathematical models.
The first model was a two-pool exponential decay:
Nt ¼ N1exp �k1tð Þ þN2exp �k2tð Þ ð3Þ
where Nt is the amount of N at time=t, N1 and N2 arethe N amounts in the pools at the beginning of incu-
bation, and k1 and k2 are rate constants.The second model was applicable in the fine and
coarse clay fractions, where a period of net N accumu-
lation preceded a period of net N depletion:
Nt ¼ �Aexp �kAtð Þ þ Bexp �kDtð Þ ð4Þ
where A and B are (positive) constants, kA is the accu-mulation rate constant, and kD is the depletion rateconstant.
Parameter estimates and standard errors in the mod-
els were generated via the Levenberg–Marquardtmethod within the nonlinear regression module (PROCNLIN) of the SAS software (SAS Institute, 1989).
3. Results and discussion
3.1. NMR quantitation test
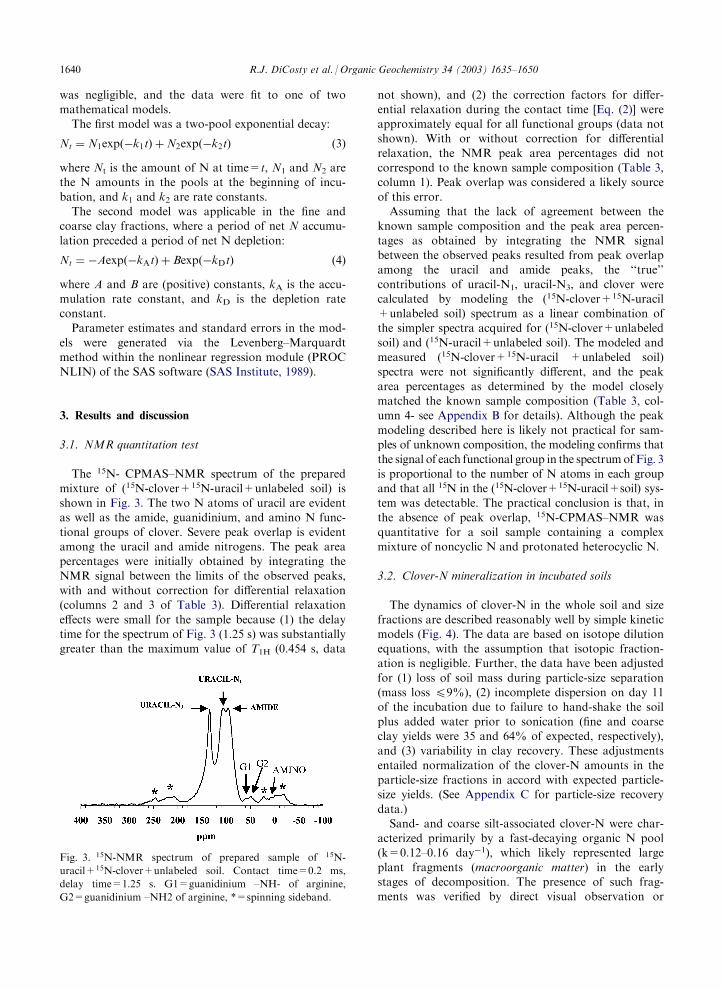
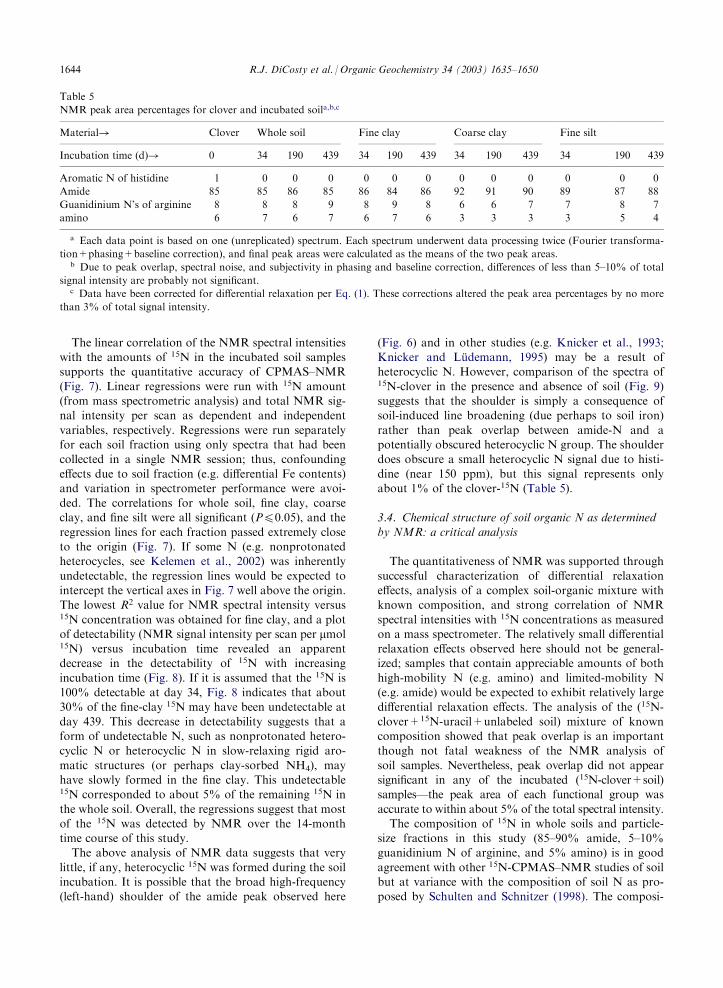
The 15N- CPMAS–NMR spectrum of the preparedmixture of (15N-clover+15N-uracil+unlabeled soil) isshown in Fig. 3. The two N atoms of uracil are evidentas well as the amide, guanidinium, and amino N func-
tional groups of clover. Severe peak overlap is evidentamong the uracil and amide nitrogens. The peak areapercentages were initially obtained by integrating the
NMR signal between the limits of the observed peaks,with and without correction for differential relaxation(columns 2 and 3 of Table 3). Differential relaxation
effects were small for the sample because (1) the delaytime for the spectrum of Fig. 3 (1.25 s) was substantiallygreater than the maximum value of T1H (0.454 s, data
not shown), and (2) the correction factors for differ-ential relaxation during the contact time [Eq. (2)] wereapproximately equal for all functional groups (data notshown). With or without correction for differential
relaxation, the NMR peak area percentages did notcorrespond to the known sample composition (Table 3,column 1). Peak overlap was considered a likely source
of this error.Assuming that the lack of agreement between the
known sample composition and the peak area percen-
tages as obtained by integrating the NMR signalbetween the observed peaks resulted from peak overlapamong the uracil and amide peaks, the ‘‘true’’
contributions of uracil-N1, uracil-N3, and clover werecalculated by modeling the (15N-clover+15N-uracil+unlabeled soil) spectrum as a linear combination ofthe simpler spectra acquired for (15N-clover+unlabeled
soil) and (15N-uracil+unlabeled soil). The modeled andmeasured (15N-clover+15N-uracil +unlabeled soil)spectra were not significantly different, and the peak
area percentages as determined by the model closelymatched the known sample composition (Table 3, col-umn 4- see Appendix B for details). Although the peak
modeling described here is likely not practical for sam-ples of unknown composition, the modeling confirms thatthe signal of each functional group in the spectrum of Fig. 3
is proportional to the number of N atoms in each groupand that all 15N in the (15N-clover+15N-uracil+soil) sys-tem was detectable. The practical conclusion is that, inthe absence of peak overlap, 15N-CPMAS–NMR was
quantitative for a soil sample containing a complexmixture of noncyclic N and protonated heterocyclic N.
3.2. Clover-N mineralization in incubated soils
The dynamics of clover-N in the whole soil and size
fractions are described reasonably well by simple kineticmodels (Fig. 4). The data are based on isotope dilutionequations, with the assumption that isotopic fraction-ation is negligible. Further, the data have been adjusted
for (1) loss of soil mass during particle-size separation(mass loss 49%), (2) incomplete dispersion on day 11of the incubation due to failure to hand-shake the soil
plus added water prior to sonication (fine and coarseclay yields were 35 and 64% of expected, respectively),and (3) variability in clay recovery. These adjustments
entailed normalization of the clover-N amounts in theparticle-size fractions in accord with expected particle-size yields. (See Appendix C for particle-size recovery
data.)Sand- and coarse silt-associated clover-N were char-
acterized primarily by a fast-decaying organic N pool(k=0.12–0.16 day�1), which likely represented large
plant fragments (macroorganic matter) in the earlystages of decomposition. The presence of such frag-ments was verified by direct visual observation or
Fig. 3. 15N-NMR spectrum of prepared sample of 15N-
uracil+15N-clover+unlabeled soil. Contact time=0.2 ms,
delay time=1.25 s. G1=guanidinium –NH- of arginine,
G2=guanidinium –NH2 of arginine, *=spinning sideband.
1640 R.J. DiCosty et al. / Organic Geochemistry 34 (2003) 1635–1650
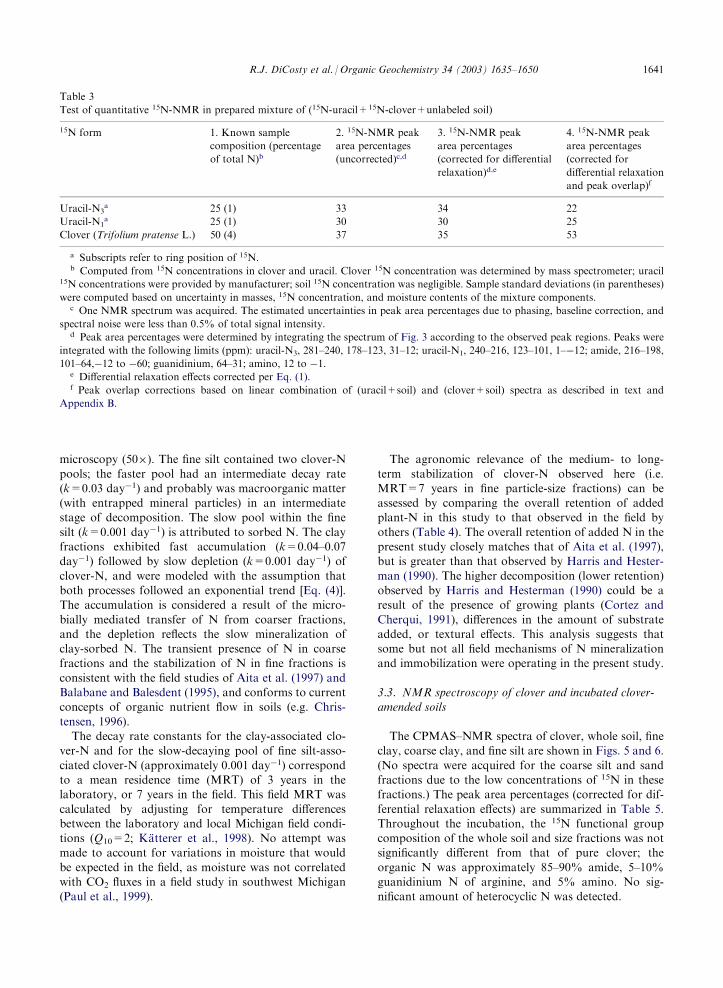
microscopy (50�). The fine silt contained two clover-N
pools; the faster pool had an intermediate decay rate(k=0.03 day�1) and probably was macroorganic matter(with entrapped mineral particles) in an intermediatestage of decomposition. The slow pool within the fine
silt (k=0.001 day�1) is attributed to sorbed N. The clayfractions exhibited fast accumulation (k=0.04–0.07day�1) followed by slow depletion (k=0.001 day�1) of
clover-N, and were modeled with the assumption thatboth processes followed an exponential trend [Eq. (4)].The accumulation is considered a result of the micro-
bially mediated transfer of N from coarser fractions,and the depletion reflects the slow mineralization ofclay-sorbed N. The transient presence of N in coarsefractions and the stabilization of N in fine fractions is
consistent with the field studies of Aita et al. (1997) andBalabane and Balesdent (1995), and conforms to currentconcepts of organic nutrient flow in soils (e.g. Chris-
tensen, 1996).The decay rate constants for the clay-associated clo-
ver-N and for the slow-decaying pool of fine silt-asso-
ciated clover-N (approximately 0.001 day�1) correspondto a mean residence time (MRT) of 3 years in thelaboratory, or 7 years in the field. This field MRT was
calculated by adjusting for temperature differencesbetween the laboratory and local Michigan field condi-tions (Q10=2; Katterer et al., 1998). No attempt wasmade to account for variations in moisture that would
be expected in the field, as moisture was not correlatedwith CO2 fluxes in a field study in southwest Michigan(Paul et al., 1999).
The agronomic relevance of the medium- to long-
term stabilization of clover-N observed here (i.e.MRT=7 years in fine particle-size fractions) can beassessed by comparing the overall retention of addedplant-N in this study to that observed in the field by
others (Table 4). The overall retention of added N in thepresent study closely matches that of Aita et al. (1997),but is greater than that observed by Harris and Hester-
man (1990). The higher decomposition (lower retention)observed by Harris and Hesterman (1990) could be aresult of the presence of growing plants (Cortez and
Cherqui, 1991), differences in the amount of substrateadded, or textural effects. This analysis suggests thatsome but not all field mechanisms of N mineralizationand immobilization were operating in the present study.
3.3. NMR spectroscopy of clover and incubated clover-amended soils
The CPMAS–NMR spectra of clover, whole soil, fineclay, coarse clay, and fine silt are shown in Figs. 5 and 6.
(No spectra were acquired for the coarse silt and sandfractions due to the low concentrations of 15N in thesefractions.) The peak area percentages (corrected for dif-
ferential relaxation effects) are summarized in Table 5.Throughout the incubation, the 15N functional groupcomposition of the whole soil and size fractions was notsignificantly different from that of pure clover; the
organic N was approximately 85–90% amide, 5–10%guanidinium N of arginine, and 5% amino. No sig-nificant amount of heterocyclic N was detected.
Table 3
Test of quantitative 15N-NMR in prepared mixture of (15N-uracil+15N-clover+unlabeled soil)
15N form
1. Known samplecomposition (percentage
of total N)b
2. 15N-NMR peak
area percentages
(uncorrected)c,d
3. 15N-NMR peak
area percentages
(corrected for differential
relaxation)d,e
4. 15N-NMR peak
area percentages
(corrected for
differential relaxation
and peak overlap)f
Uracil-N3a
25 (1) 33 34 22Uracil-N1a
25 (1) 30 30 25Clover (Trifolium pratense L.)
50 (4) 37 35 53a Subscripts refer to ring position of 15N.b Computed from 15N concentrations in clover and uracil. Clover 15N concentration was determined by mass spectrometer; uracil
15N concentrations were provided by manufacturer; soil 15N concentration was negligible. Sample standard deviations (in parentheses)
were computed based on uncertainty in masses, 15N concentration, and moisture contents of the mixture components.c One NMR spectrum was acquired. The estimated uncertainties in peak area percentages due to phasing, baseline correction, and
spectral noise were less than 0.5% of total signal intensity.d Peak area percentages were determined by integrating the spectrum of Fig. 3 according to the observed peak regions. Peaks were
integrated with the following limits (ppm): uracil-N3, 281–240, 178–123, 31–12; uracil-N1, 240–216, 123–101, 1–�12; amide, 216–198,
101–64,�12 to �60; guanidinium, 64–31; amino, 12 to �1.e Differential relaxation effects corrected per Eq. (1).f Peak overlap corrections based on linear combination of (uracil+soil) and (clover+soil) spectra as described in text and
Appendix B.
R.J. DiCosty et al. / Organic Geochemistry 34 (2003) 1635–1650 1641
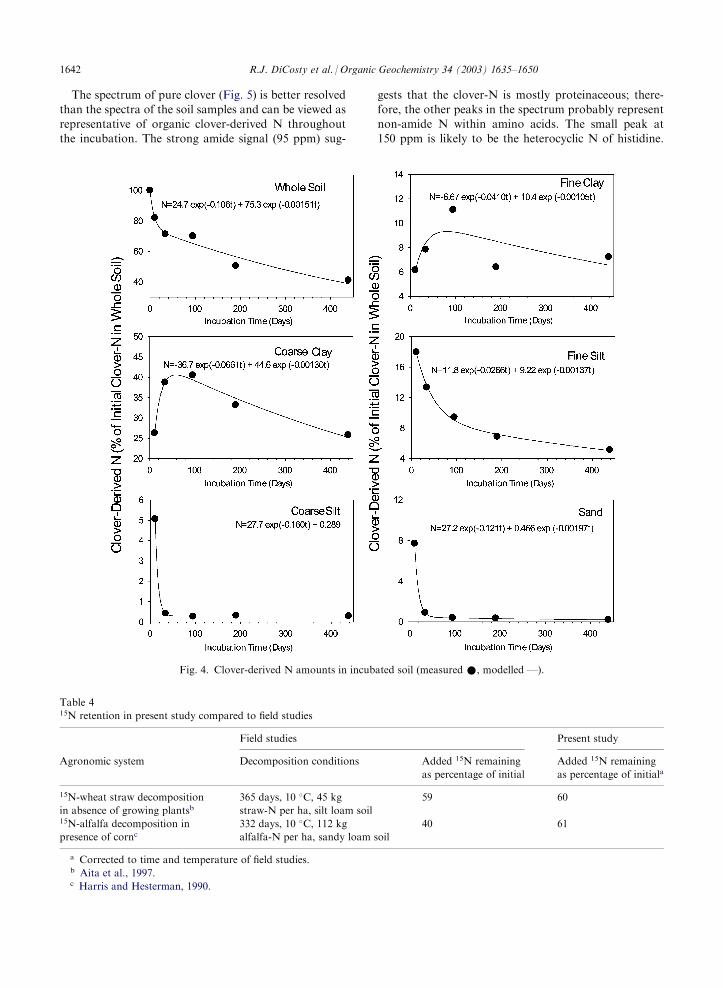
The spectrum of pure clover (Fig. 5) is better resolvedthan the spectra of the soil samples and can be viewed asrepresentative of organic clover-derived N throughoutthe incubation. The strong amide signal (95 ppm) sug-
gests that the clover-N is mostly proteinaceous; there-fore, the other peaks in the spectrum probably representnon-amide N within amino acids. The small peak at150 ppm is likely to be the heterocyclic N of histidine.
Table 415N retention in present study compared to field studies
Field studies
Present studyAgronomic system
Decomposition conditions Added 15N remainingas percentage of initial
Added 15N remaining
as percentage of initiala
15N-wheat straw decomposition
in absence of growing plantsb
365 days, 10 �C, 45 kg
straw-N per ha, silt loam soil
59
6015N-alfalfa decomposition in
presence of cornc
332 days, 10 �C, 112 kg
alfalfa-N per ha, sandy loam soil
40
61a Corrected to time and temperature of field studies.b Aita et al., 1997.c Harris and Hesterman, 1990.
Fig. 4. Clover-derived N amounts in incubated soil (measured *, modelled —).
1642 R.J. DiCosty et al. / Organic Geochemistry 34 (2003) 1635–1650
Stoichiometric considerations strongly suggest that thepeaks at 58 and 45 ppm are the –NH– and –NH2 unitsof the guanidinium group of arginine, respectively. Theratio of the relaxation-corrected peak areas (–NH– :
–NH2=1:2.5, data not shown) was close to the expectedstoichiometric value (1:2) for the guanidinium group.The two peaks in the region �10 to 20 ppm probably
represent the amino groups of free or amino-terminalamino acids (Table 2 and Appendix A).
The overall corrections for differential relaxationeffects were small in the spectra of clover and incubatedsoils; the maximum difference between corrected anduncorrected peak area percentages for each sample cor-
responded to no more than 3% of the total signalintensity. The relaxation model of Eq. (1) fitted the datawell, as evidenced by the generally low ratios of stan-
dard errors to relaxation parameter values (Table 6).The poorer fits for the amino group relative to otherfunctional groups are likely a result of the relatively
small peak area of the amino group as well as peakoverlap (Figs. 5 and 6). The correction factors for dif-ferential relaxation during the contact time were com-
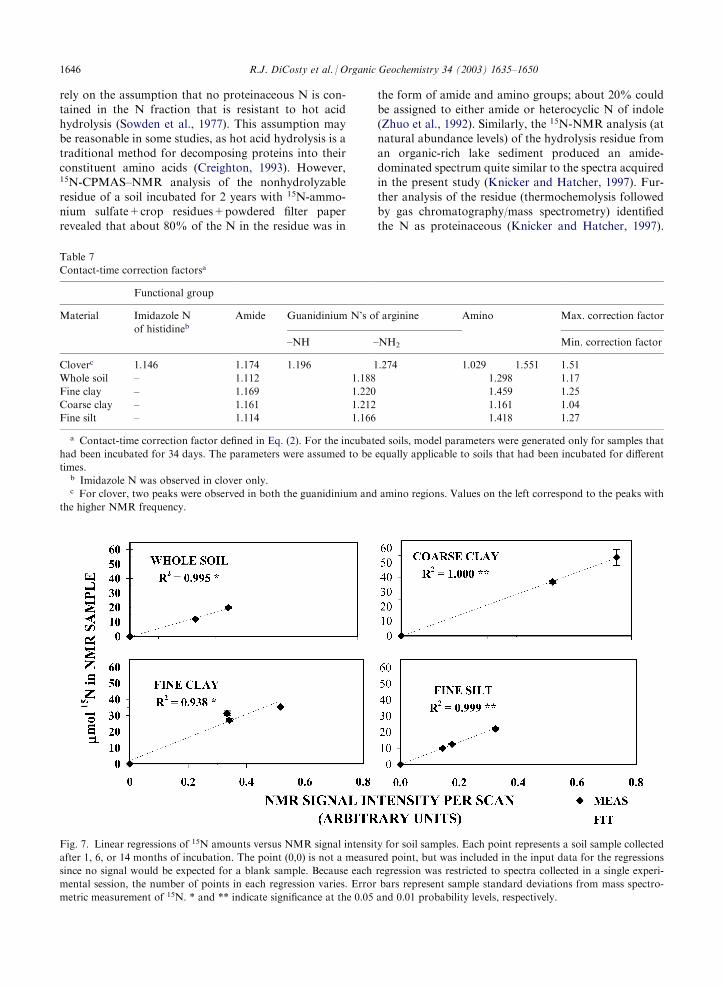
puted from TNH and T1rH [Eq. (2), Table 7]. Withineach sample, the ratio of the maximum to the minimumcorrection factor among the various functional groupsvaried from about 1 to 1.5. (A high maximum:minimum
ratio indicates that differential relaxation effects duringthe contact time may be significant.) The highest cor-rection factor usually corresponded to the amino group,
probably as a result of high TNH values for the aminogroup (Table 6). High TNH values are expected in rela-tively mobile functional groups such as the amino group
(Kinchesh et al., 1995).
Fig. 5. 15N-NMR spectrum of clover. Contact time=0.4 ms,delay time=1 s. *=spinning sideband.
Fig. 6. 15N-NMR spectra of (a) whole soil, (b) fine clay, (c) coarse clay, (d) fine silt. Contact time=0.4 ms (all samples), delay
time=0.5 s (whole soil, fine clay), 0.9 s (coarse clay, 1 month), 1 s (coarse clay, 14 month), 0.75 s (fine silt). *=spinning sideband.
R.J. DiCosty et al. / Organic Geochemistry 34 (2003) 1635–1650 1643
The linear correlation of the NMR spectral intensitieswith the amounts of 15N in the incubated soil samplessupports the quantitative accuracy of CPMAS–NMR
(Fig. 7). Linear regressions were run with 15N amount(from mass spectrometric analysis) and total NMR sig-nal intensity per scan as dependent and independent
variables, respectively. Regressions were run separatelyfor each soil fraction using only spectra that had beencollected in a single NMR session; thus, confounding
effects due to soil fraction (e.g. differential Fe contents)and variation in spectrometer performance were avoi-ded. The correlations for whole soil, fine clay, coarseclay, and fine silt were all significant (P40.05), and the
regression lines for each fraction passed extremely closeto the origin (Fig. 7). If some N (e.g. nonprotonatedheterocycles, see Kelemen et al., 2002) was inherently
undetectable, the regression lines would be expected tointercept the vertical axes in Fig. 7 well above the origin.The lowest R2 value for NMR spectral intensity versus15N concentration was obtained for fine clay, and a plotof detectability (NMR signal intensity per scan per mmol15N) versus incubation time revealed an apparentdecrease in the detectability of 15N with increasing
incubation time (Fig. 8). If it is assumed that the 15N is100% detectable at day 34, Fig. 8 indicates that about30% of the fine-clay 15N may have been undetectable at
day 439. This decrease in detectability suggests that aform of undetectable N, such as nonprotonated hetero-cyclic N or heterocyclic N in slow-relaxing rigid aro-
matic structures (or perhaps clay-sorbed NH4), mayhave slowly formed in the fine clay. This undetectable15N corresponded to about 5% of the remaining 15N in
the whole soil. Overall, the regressions suggest that mostof the 15N was detected by NMR over the 14-monthtime course of this study.
The above analysis of NMR data suggests that very
little, if any, heterocyclic 15N was formed during the soilincubation. It is possible that the broad high-frequency(left-hand) shoulder of the amide peak observed here
(Fig. 6) and in other studies (e.g. Knicker et al., 1993;Knicker and Ludemann, 1995) may be a result ofheterocyclic N. However, comparison of the spectra of15N-clover in the presence and absence of soil (Fig. 9)suggests that the shoulder is simply a consequence ofsoil-induced line broadening (due perhaps to soil iron)
rather than peak overlap between amide-N and apotentially obscured heterocyclic N group. The shoulderdoes obscure a small heterocyclic N signal due to histi-
dine (near 150 ppm), but this signal represents onlyabout 1% of the clover-15N (Table 5).
3.4. Chemical structure of soil organic N as determined
by NMR: a critical analysis
The quantitativeness of NMR was supported through
successful characterization of differential relaxationeffects, analysis of a complex soil-organic mixture withknown composition, and strong correlation of NMR
spectral intensities with 15N concentrations as measuredon a mass spectrometer. The relatively small differentialrelaxation effects observed here should not be general-ized; samples that contain appreciable amounts of both
high-mobility N (e.g. amino) and limited-mobility N(e.g. amide) would be expected to exhibit relatively largedifferential relaxation effects. The analysis of the (15N-
clover+15N-uracil+unlabeled soil) mixture of knowncomposition showed that peak overlap is an importantthough not fatal weakness of the NMR analysis of
soil samples. Nevertheless, peak overlap did not appearsignificant in any of the incubated (15N-clover+soil)samples—the peak area of each functional group was
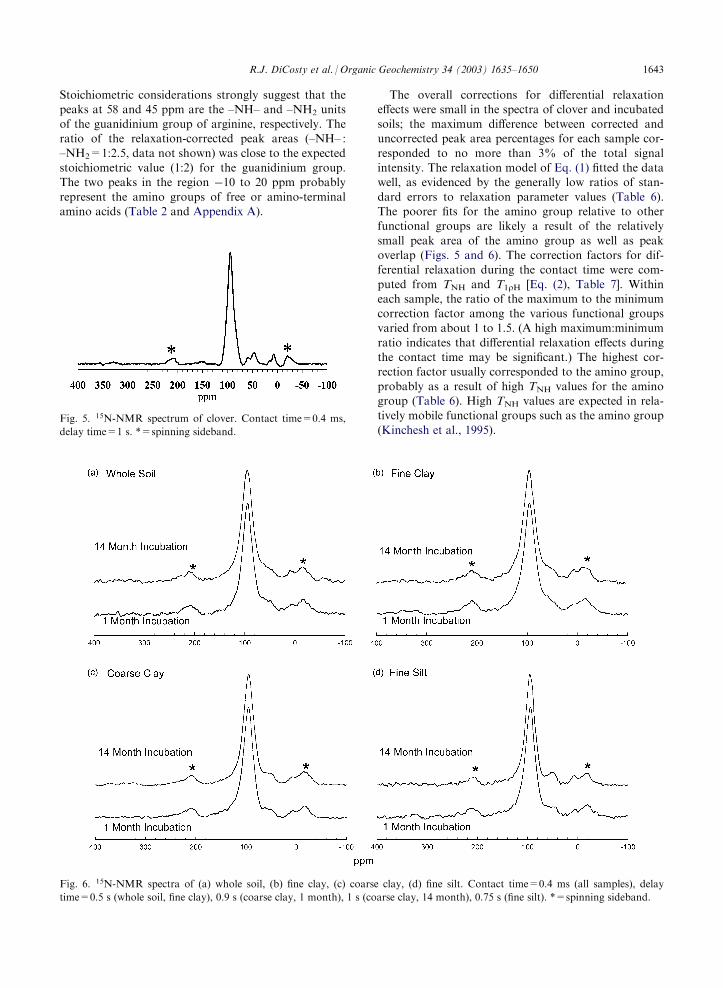
accurate to within about 5% of the total spectral intensity.The composition of 15N in whole soils and particle-
size fractions in this study (85–90% amide, 5–10%guanidinium N of arginine, and 5% amino) is in good
agreement with other 15N-CPMAS–NMR studies of soilbut at variance with the composition of soil N as pro-posed by Schulten and Schnitzer (1998). The composi-
Table 5
NMR peak area percentages for clover and incubated soila,b,c
Material!
Clover Whole soil Fine clay Coarse clay Fine siltIncubation time (d)!
0 34 190 439 34 190 439 34 190 439 34 190 439Aromatic N of histidine
1 0 0 0 0 0 0 0 0 0 0 0 0Amide
85 85 86 85 86 84 86 92 91 90 89 87 88Guanidinium N’s of arginine
8 8 8 9 8 9 8 6 6 7 7 8 7amino
6 7 6 7 6 7 6 3 3 3 3 5 4a Each data point is based on one (unreplicated) spectrum. Each spectrum underwent data processing twice (Fourier transforma-
tion+phasing+baseline correction), and final peak areas were calculated as the means of the two peak areas.b Due to peak overlap, spectral noise, and subjectivity in phasing and baseline correction, differences of less than 5–10% of total
signal intensity are probably not significant.c Data have been corrected for differential relaxation per Eq. (1). These corrections altered the peak area percentages by no more
than 3% of total signal intensity.
1644 R.J. DiCosty et al. / Organic Geochemistry 34 (2003) 1635–1650

tion of soil N per Schulten and Schnitzer is: proteins+peptides+amino acids, 40%; amino sugars, 5–6%;
heterocyclic N, 35%; and NH3, 19%. (NH3 is an oper-ationally defined pool; see Introduction.) Schulten andSchnitzer (1998) argue that the incubation times of 15N-amended soils in studies such as the present one may be
too short for the formation (or selective preservation) ofresistant heterocyclic N. While the long-term formationof heterocyclic N could not be evaluated from the data
of the present study, kinetic analysis indicated that theclover-N in this study had a mean residence time of 3
years in the laboratory, which corresponded toapproximately 7 years in the field. This material thusseems to have at least medium-term stability.
The discrepancy in N chemical composition between
NMR-based studies and the study of Schulten andSchnitzer (1998) may stem from the assumptions usedby Schulten and Schnitzer. Their analysis appears to
Table 6
T1H, TNH, and T1rH values for clover and incubated soilsa
Functional group
Guanidinium N’s of arginine
Material
Aromatic Nof histidine
Amide
–NH –NH2 AminoT1H (s)
Cloverb
0.37 0.53 NAc 0.52 0.97 0.83(0.43)
(0.10) (0.10) (1.56) (0.08)Whole soil
NDd 0.19 NA 0.52(0.01)
(0.17)Fine clay
ND 0.14 NA NA(0.05)
Coarse clay
ND 0.20 NA NA(0.05)
Fine silt
ND 0.18 NA 0.21(0.02)
(0.06)TNH (ms)
Cloverb
0.13 0.059 0.050 0.060 0.061 0.29(0.05)
(0.009) (0.018) (0.006) (0.058) (0.10)Whole soil
ND 0.078 0.089 0.19(0.008)
(0.009) (0.04)Fine clay
ND 0.076 0.085 0.16(0.009)
(0.022) (0.10)Coarse clay
ND 0.062 0.055 0.13(0.004)
(0.022) (0.06)Fine silt
ND 0.072 0.082 0.27(0.005)
(0.011) (0.08)T1�H (ms)
Cloverb
3.15 2.14 1.96 1.41 12.6 1.65(1.48)
(0.28) (0.58) (0.11) (29.3) (0.59)Whole soil
ND 3.24 1.95 1.95(0.33)
(0.19) (0.46)Fine clay
ND 2.15 1.67 0.93(0.23)
(0.40) (0.56)Coarse clay
ND 2.29 1.80 2.83(0.12)
(0.60) (1.42)Fine silt
ND 3.17 2.19 2.60(0.24)
(0.28) (0.88)a Standard error in parentheses. For the incubated soils, model parameters were generated only for samples that had been incu-
bated for 34 days. The parameters were assumed to be equally applicable to soils that had been incubated for different times.b For clover, two peaks were observed in both the guanidinium and amino regions. Values on the left correspond to the peaks with
the higher NMR frequency.c NA=no dependence of signal intensity upon delay time was observed; functional group assumed to be fully relaxed. Minimum
delay values tested were as follows: 1 s (clover), 0.5 s (whole soil, fine clay, coarse clay, and fine silt).d ND=functional group not detected.
R.J. DiCosty et al. / Organic Geochemistry 34 (2003) 1635–1650 1645
rely on the assumption that no proteinaceous N is con-tained in the N fraction that is resistant to hot acidhydrolysis (Sowden et al., 1977). This assumption maybe reasonable in some studies, as hot acid hydrolysis is a
traditional method for decomposing proteins into theirconstituent amino acids (Creighton, 1993). However,15N-CPMAS–NMR analysis of the nonhydrolyzable
residue of a soil incubated for 2 years with 15N-ammo-nium sulfate+crop residues+powdered filter paperrevealed that about 80% of the N in the residue was in
the form of amide and amino groups; about 20% couldbe assigned to either amide or heterocyclic N of indole(Zhuo et al., 1992). Similarly, the 15N-NMR analysis (atnatural abundance levels) of the hydrolysis residue from
an organic-rich lake sediment produced an amide-dominated spectrum quite similar to the spectra acquiredin the present study (Knicker and Hatcher, 1997). Fur-
ther analysis of the residue (thermochemolysis followedby gas chromatography/mass spectrometry) identifiedthe N as proteinaceous (Knicker and Hatcher, 1997).
Fig. 7. Linear regressions of 15N amounts versus NMR signal intensity for soil samples. Each point represents a soil sample collected
after 1, 6, or 14 months of incubation. The point (0,0) is not a measured point, but was included in the input data for the regressions
since no signal would be expected for a blank sample. Because each regression was restricted to spectra collected in a single experi-
mental session, the number of points in each regression varies. Error bars represent sample standard deviations from mass spectro-
metric measurement of 15N. * and ** indicate significance at the 0.05 and 0.01 probability levels, respectively.
Table 7
Contact-time correction factorsa
Functional group
Material
Imidazole Nof histidineb
Amide
Guanidinium N’s of arginine Amino Max. correction factor–NH
–NH2 Min. correction factorCloverc
1.146 1.174 1.196 1.274 1.029 1.551 1.51Whole soil
– 1.112 1.188 1.298 1.17Fine clay
– 1.169 1.220 1.459 1.25Coarse clay
– 1.161 1.212 1.161 1.04Fine silt
– 1.114 1.166 1.418 1.27a Contact-time correction factor defined in Eq. (2). For the incubated soils, model parameters were generated only for samples that
had been incubated for 34 days. The parameters were assumed to be equally applicable to soils that had been incubated for different
times.b Imidazole N was observed in clover only.c For clover, two peaks were observed in both the guanidinium and amino regions. Values on the left correspond to the peaks with
the higher NMR frequency.
1646 R.J. DiCosty et al. / Organic Geochemistry 34 (2003) 1635–1650

Additionally, Zang et al. (2000) combined 15N-labeledprotein extracts with humic acids and found that a sig-nificant portion of the protein in this mixture was resis-
tant to acid hydrolysis.Based on the unchanging proteinaceous NMR sig-
nature of clover-derived N throughout the 14-month
soil incubation, the considerable differences in themineralization/immobilization behavior of clover-Namong the different particle-size fractions appear not to
be linked with chemical functional group. Possiblemechanisms for the stability of proteinaceous N in thefine soil fractions of this study include adsorption ontoclays, entrapment of soil N in pores inaccessible to
microbes, or humification without change of functionalgroup (e.g. cross-linking of large biomolecules orencapsulation of proteinaceous material by other bio-
molecules).Improvements in 15N-NMR spectroscopy of soils
seem possible, but not without conceptual or technical
challenges. Density fractionation leads to isolation offractions low in specific gravity and relatively high inorganic content; such schemes were used in a 13C-NMRstudy by Baldock et al. (1992). However, Christensen
(1992) has questioned some density fractionationschemes, and considers that density fractions of clay andsilt particles may not represent truly distinct pools of
organic matter. Dissolution of mineral matter by HFmay improve NMR spectra (Schmidt et al., 1997), butthis approach would seem to forfeit the advantage of the
noninvasiveness of NMR. Finally, the recently devel-oped technique of high-resolution solid-state 14N-NMRmay help resolve the current controversy surrounding
the chemical structure of native soil organic N (Jeschkeand Jansen, 1998). However, this approach requires
high spinning speeds and further advances in broadbandspectral excitation, and may not be immediately applic-able to soil systems.
Acknowledgements
This material is based upon work supported by theCooperative State Research Service, US Department ofAgriculture, under Agreement No. 94-37107-0387. Any
opinions, findings, conclusions, or recommendationsexpressed in this publication are those of the authorsand do not necessarily reflect the view of the USDepartment of Agriculture. The senior author is grateful
for the financial support of the US Department of Agri-culture (Water Sciences Fellowship) and the MichiganState University Department of Crop and Soil Sciences
(Graduate Office Fellowship). We thank Dr. Karl Bishop,Dr. Utami DiCosty, Dr. Boyd Ellis, Mr. Jason Franti, Dr.Dave Harris, Mr. Kermit Johnson, Ms. Pat Outcalt, Mr.
Bryan Pape, and Dr. Oliver Schabenberger for invaluabletechnical assistance, and we thank three anonymousreviewers for helping to improve the manuscript.
Associate Editor—Klaus Schmidt-Rohr
Fig. 9. NMR spectra of 15N-labeled clover, with and without
soil. In both spectra, contact time=0.2 ms, delay=1 s, line
broadening=120 Hz.
Fig. 8. NMR detectability of fine-clay associated 15N after
various incubation times. NMR detectability is defined as
NMR signal intensity per scan per mmol 15N.
R.J. DiCosty et al. / Organic Geochemistry 34 (2003) 1635–1650 1647

Appendix B. Computation of ‘‘true’’ contributions of
uracil and clover to NMR signal intensity in the
severely overlapped 15N-NMR spectrum of (15N-clo-
ver+15N-uracil+unlabeled soil)
The ‘‘true’’ contributions of uracil-N1, uracil-N3, andclover-N to the NMR spectrum of (15N-clover+15N-
uracil+unlabeled soil) (Fig. 3) were calculated bymodeling the spectrum as a linear combination of thesimpler spectra acquired for (15N-clover+unlabeled
soil) and (15N-uracil+unlabeled soil). This was accom-plished as shown below:
Mathematically, at each NMR frequency � in the spec-
trum, the measured intensity, SCUS,MEAS(�) is modeled as:
SCUS;MODEL �ð Þ ¼ kUSSUS;MEAS �ð Þ
þ kCSSCS;MEAS �ð Þ ð2:1Þ
where SUS,MEAS(�) and SCS,MEAS(�) are the measuredsignals in the (15N-uracil+unlabeled soil) and (15N-clo-
ver+unlabeled soil) spectra, respectively, and kUS andkCS are positive constants. The constants kUS and kCS
were determined by least-squares minimization of w2:
P�R�¼�L
SCUS;MEAS �ð Þ � SCUS;MODEL �ð Þ� �2
VARCUS;MEAS þ VARCUS;MODEL
� �f
ð2:2Þ
where �L and �R are the NMR frequencies of the left andright edges of the spectral region of interest, f is the degreesof freedom (f=number of NMR frequencies in spectral
region of interest minus two),VARCUS,MEAS is the varianceof the measured spectrum of (15N-clover+15N-uraci-l+unlabeled soil) andVARCUS,MODEL is the variance of the
modeled spectrum of (15N-clover+15N-uracil+unlabeledsoil). According to Bevington and Robinson (1992), a suffi-ciently small value of w2 indicates that the two distributions
in the numerator of Eq. (2.2) are not significantly different.The variance of the measured spectrum in Eq. (2.2)
was estimated as the variance in signal intensity in 25
points chosen from a portion of the spectrum withoutpeaks. The variance of the modeled spectrum was basedon the rules of statistical error propagation:
VARCUS;MODEL ¼ k2USVARUS;MEAS
þ k2CSVARCS;MEAS ð2:3Þ
Appendix A. Detailed table of 15N chemical shifts
15N chemical shifts of biologically important molecules
a
Compound Chemical shift (ppm) Ref.Ammonium sulfate or15N-ammonium 14N-nitrate
0
–Free amino acids, amino groups
5–34 (including Gly and Pro) 5 Guanidine–NH2 42–53 1,5 Guanidine–NH- 60–65–NH2 of nucleic acids
76 (C); 59 (A); 53 (G) 2 Tryptophan–NH–(indole) 61 1 Peptide-N 83–116 (including Gly and Pro) 1,595–110 (excluding Gly and Pro)
Uracilb 111 (N1), 139 (N3) 1 Histidine ring N (imidazole) 145–155 cation; 157 & 211 amphiion;173 & 197 anion
1Aromatic N in nucleic acidsc
G3, T3, C1, G1, T1
121–140 2 A9, G9 148 2C3, A3, A1, A7, G7
174–211 2Pyrrole
136 (in DMSO-d6) 4Pyrrole as part of chlorophyll A
173, 175, 192, 233 (in acetone-d6) 1 Flavin (isoalloxazine) 128–140 (N3); 142 (N10, ox.);170–179 (N1); 312-320 (N5, ox.)
1Nitrate
354 3a1. Blomberg and Ruterjans, 1983; 2. Cross et al., 1982; 3. Levy and Lichter, 1979; 4. Thorn and Mikita, 1992; 5.Wuthrich, 1976. bHawkes et al., 1977; as cited by Blomberg and Ruterjans (1983). cA=adenine, C=cytosine,
G=guanine, T=thymine.
1648 R.J. DiCosty et al. / Organic Geochemistry 34 (2003) 1635–1650
where kUS and kCS are the constants from Eq. (2.1), andVARUS,MEAS and VARCS,MEAS are the variances of themeasured spectra of (15N-uracil+unlabeled soil) and (15N-clover+unlabeled soil). VARUS,MEAS and VARCS,MEAS
were computed per the aforementioned 25-point method.The chi-square minimization of Eq. (2.2) yielded
w2=49.41, corresponding to P=1.000; thus the simu-
lated and measured spectra (not shown) were not sig-nificantly different. Therefore, the modeled spectrum wasconsidered statistically valid and the ‘‘true’’ peak area per-
centages of the (15N-clover+15N-uracil+unlabeled soil)sample were calculated as:
PAPU�N3 ¼kUSPAU�N3;US
PATOTAL� 100
PAPU-N1 ¼kUSPAU-N1;US
PATOTAL� 100
PAPCLOV ¼kCSPACLOV;CS
PATOTAL� 100
wherePAPU-N3 and PAPU-N1 are peak area percentages
in the modeled (15N-clover+15N-uracil+unlabeled soil)spectrum due to uracil N at ring positions 3 and 1, respec-tively. PAU-N3,US and PAU-N1,US are peak areas of uracil-
N3 and uracil-N1in the measured (15N-uracil+unlabeledsoil) spectrum, respectively, and were calculated by inte-grating the NMR signal of said spectrum between the
observed peak limits.PAPCLOV is the peak area percentagein the modeled spectrum due to clover, and PACLOV,CS isthe (total) peak area in the measured (15N-clo-ver+unlabeled soil) spectrum. PATOTAL is defined as:
PATOTAL=kUS(PAU-N3,US+PAU-N1,US)+kCS PACLOV,CS
Appendix C. Recovery of mass in ultrasonic particle-
size fractionationsa
Incubation time (days)
Fraction
Expecteddistributionb11
34 95 190 439Fine clay
(<0.2 mm)
3.8�0.6
1.3 3.6 4.3 3.2 4.2Coarse clay(0.2–2 mm)
12.4�0.7
7.9 12.1 12.1 13.4 12.1Fine silt(2–10 mm)
12.0�0.4
13.8 12.4 12.1 11.9 11.6Coarse silt
(10–53 mm)
15.4�2.9
16.2 17.0 16.8 16.9 17.9Sand(53–2000 mm)
56.3�3.1
60.8 54.9 54.7 54.7 54.1Recovery (%)c
– 93 93 93 91 93aData are percent of recovered mass, unless otherwisenoted. bMeans and sample standard deviations from
preliminary study as described in Materials and Meth-ods and Table 1. cRecovery (%)=100�soil mass recov-ered in all fractions/unfractionated soil mass.
References
Aita, C., Recous, S., Angers, D.A., 1997. Short-term kinetics of
residual wheat straw C and N under field conditions: char-
acterization by 13C15N tracing and soil particle size fractio-
nation. European Journal of Soil Science 48, 283–294.
Balabane, M., Balesdent, J., 1995. Medium-term transforma-
tions of organic N in a cultivated soil. European Journal of
Soil Science 46, 497–505.
Baldock, J.A., Oades, J.M., Waters, A.G., Peng, X., Vassallo,
A.M., Wilson, M.A., 1992. Aspects of the chemical structure
of soil organic materials as revealed by solid-state 13C NMR
spectroscopy. Biogeochemistry 16, 1–42.
Bevington, P.R., Robinson, D.K., 1992. Data Reduction and
Error Analysis for the Physical Sciences, second ed.
McGraw-Hill, New York.
Bliss, C.I., 1967. Statistics in Biology, Vol. 1. McGraw-Hill,
New York.
Blomberg, F., Ruterjans, H., 1983. Nitrogen-15 NMR in bio-
logical systems. In: Berliner, L.J., Reuben, J. (Eds.), Biologi-
cal Magnetic Resonance, Vol. 5. Plenum Press, New York,
pp. 21–73.
Brady, N.C., 1990. The Nature and Properties of Soils, tenth
ed. Macmillan Publishing Company, New York.
Catroux, G., Schnitzer, M., 1987. Chemical, spectroscopic, and
biological characteristics of the organic matter in particle size
fractions separated from an Aquoll. Soil Science Society of
America Journal 51, 1200–1207.
Christensen, B.T., 1992. Physical fractionation of soil and
organic matter in primary particle size and density separates.
In: Stewart, B.A. (Ed.), Advances in Soil Science, Vol. 20.
Springer-Verlag, New York, pp. 1–90.
Christensen, B.T., 1996. Matching measurable soil organic
matter fractions with conceptual pools in simulation models
of carbon turnover: revision of model structure. In: Powlson,
D.S., Smith, P., Smith, J.U. (Eds.), Evaluation of Soil
Organic Matter Models Using Existing Long-Term Datasets,
1996. (Eds.), NATO ASI Series I 38. Springer-Verlag, Ber-
lin, pp. 143–159.
Clinton, P.W., Newman, R.H., Allen, R.B., 1995. Immobiliza-
tion of 15N in forest litter studied by 15N CPMAS NMR
spectroscopy. European Journal of Soil Science 46, 551–556.
Cortez, J., Cherqui, A., 1991. Plant growth and the miner-
alization of adsorbed 14C- and 15N-labelled compounds. Soil
Biology and Biochemistry 23, 261–267.
Creighton, T.E., 1993. Proteins: Structures and Molecular
Properties, second ed. WH Freeman and Company, New
York.
Cross, T.A., DiVerdi, J.A., Opella, S.J., 1982. Strategy for
nitrogen NMR of biopolymers. Journal of the American
Chemical Society 104, 1759–1761.
Elonen, P., 1971. Particle-size analysis of soil. Acta Agralia
Fennica 122.
Gee, G.W., Bauder, J.W., 1986. Particle-size analysis. In:
Klute, A. (Ed.), Methods of Soil Analysis, Part 1. Physical
and Mineralogical Methods, second ed, 1986. (Ed.), Agron-
omy Monograph 9. American Society of Agronomy—Soil
Science Society of America, Madison, WI, pp. 383–411.
Harris, G.H., Hesterman, O.B., 1990. Quantifying the nitrogen
contribution from alfalfa to soil and two succeeding crops
using nitrogen-15. Agronomy Journal 82, 129–134.
R.J. DiCosty et al. / Organic Geochemistry 34 (2003) 1635–1650 1649
Hopkins, D.W., Chudek, J.A., Webster, E.A., Barraclough, D.,
1997. Following the decomposition of ryegrass labelled with13C and 15N in soil by solid-state nuclear magnetic resonance
spectroscopy. European Journal of Soil Science 48, 623–631.
Jeschke, G., Jansen, M., 1998. High-resolution 14N solid-state
NMR spectroscopy. Angewandte Chemie International Edi-
tion 37, 1282–1283.
Katterer, T., Reichstein, M., Andren, O., Lomander, A., 1998.
Temperature dependence of organic matter decomposition: a
critical review using literature data analyzed with different
models. Biology and Fertility of Soils 27, 258–262.
Kelemen, S.R., Afeworki, M., Gorbaty, M.L., Kwiatek, P.J.,
Solum, M.S., Hu, J.Z., Pugmire, R.J., 2002. XPS and 15N
NMR study of nitrogen forms in carbonaceous solids.
Energy and Fuels 16, 1507–1515.
Kinchesh, P., Powlson, D.S., Randall, E.W., 1995. 13C NMR
studies of organic matter in whole soils: I. Quantitation pos-
sibilities. European Journal of Soil Science 46, 125–138.
Knicker, H., Frund, R., Ludemann, H.-D., 1993. The chemical
nature of nitrogen in native soil organic matter. Die Nat-
urwissenschaften 80, 219–221.
Knicker, H., Ludemann, H.-D., 1995. N-15 and C-13 CPMAS
and solution NMR studies of N-15 enriched plant material
during 600 days of microbial degradation. Organic Geo-
chemistry 23, 329–341.
Knicker, H., Hatcher, P.G., 1997. Survival of protein in an
organic-rich sediment: possible protection by encapsulation
in organic matter. Die Naturwissenschaften 84, 231–234.
Knicker, H., Rudiger, F., Ludemann, H.-D., 1997. Characteriza-
tion of nitrogen in plant composts and native humic material by
natural-abundance 15N CPMAS and solution NMR spectra.
In: Nanny, M.A., Minear, R.A., Leenheer, J.A. (Eds.), Nuclear
Magnetic Resonance Spectroscopy in Environmental Chem-
istry. Oxford University Press, New York, pp. 272–294.
Knicker, H., Schmidt, M.W.I., Kogel-Knabner, I., 1999. The
structure of organic nitrogen in particle size fractions deter-
mined by 15N CPMAS NMR. In: Berthelin, J., Huang, P.M.,
Bollag, J.-M., Andreux, F. (Eds.), Effect of Mineral-Organic-
Microorganism Interactions on Soil and Freshwater Envir-
onments. , pp. 143–149.
Kuester, J.L., Mize, J.H., 1973. Optimization Techniques with
FORTRAN. McGraw-Hill, New York.
Levy, G.C., Lichter, R.L., 1979. Nitrogen-15 Nuclear Magnetic
Resonance Spectroscopy. John Wiley & Sons, New York.
Mahieu, N., Olk, D.C., Randall, E.W., 2000. Accumulation of
heterocyclic nitrogen in humified organic matter: a 15N-
NMR study of lowland rice soils. European Journal of Soil
Science 51, 379–389.
Morra, M.J., Blank, R.R., Freeborn, L.L., Shafii, B., 1991. Size
fractionation of soil organo-mineral complexes using ultra-
sonic dispersion. Soil Science 152, 294–303.
Nadelhoffer, K.J., 1990. Microlysimeter for measuring nitrogen
mineralization and microbial respiration in aerobic soil incu-
bations. Soil Science Society of America Journal 54, 411–415.
North, P.F., 1976. Towards an absolute measurement of soil
structural stability using ultrasound. Journal of Soil Science
27, 451–459.
Paul, E.A., Harris, D., Collins, H.P., Schulthess, U., Robert-
son, G.P., 1999. Evolution of CO2 and soil carbon dynamics
in biologically managed, row-crop agroecosystems. Applied
Soil Ecology 11, 53–65.
SAS Institute Inc, 1989. SAS/STAT User’s Guide, Version 6,
Volume 2, fouth ed. SAS Institute Inc, Cary, NC.
Schmidt, M.W.I., Knicker, H., Hatcher, P.G., Kogel-Knabner,
I., 1997. Improvement of 13C and 15N CPMAS NMR spectra
of bulk soils, particle-size fractions and organic material by
treatment with 10% hydrofluoric acid. European Journal of
Soil Science 48, 319–328.
Schnitzer, M., 1985. Nature of nitrogen in humic substances.
In: Aiken, G.R., McKnight, D.M., Wershaw, R.L., Mac-
Carthy, P. (Eds.), Humic Substances in Soil, Sediment, and
Water: Geochemistry, Isolation, and Characterization. John
Wiley and Sons, New York, pp. 303–325.
Schulten, H.-R., Hempfling, R., 1992. Influence of agricultural
soil management on humus composition and dynamics: clas-
sical and modern analytical techniques. Plant and Soil 142,
259–271.
Schulten, H.-R., Sorge, C., Schnitzer, M., 1995. Structural
studies on soil nitrogen by Curie-point pyrolysis-gas chro-
matography/mass spectrometry with nitrogen-selective
detection. Biology and Fertility of Soils 20, 174–184.
Schulten, H.-R., Schnitzer, M., 1998. The chemistry of soil organic
nitrogen: a review. Biology and Fertility of Soils 26, 1–15.
Sowden, F.J., Chen, Y., Schnitzer, M., 1977. The nitrogen dis-
tribution in soils formed under widely varying climatic con-
ditions. Geochimica et Cosmochimica Acta 41, 1524–1526.
Stejskal, E.O., Memory, J.D., 1994. High Resolution NMR in
the Solid State. Oxford University Press, New York.
Stevenson, F.J., 1994. Humus Chemistry: Genesis, Composi-
tion, Reactions, second ed. John Wiley and Sons, New York.
Thorn, K.A., Mikita, M.A., 1992. Ammonia fixation by humic
substances: a nitrogen-15 and carbon-13 NMR study.
Science of the Total Environment 113, 67–87.
Whittig, L.D., Allardice, W.R., 1986. X-ray diffraction techni-
ques. In: Klute, A. (Ed.), Methods of Soil Analysis, Part 1.
Physical and Mineralogical Methods. American Society of
Agronomy—Soil Science Society of America, Madison, WI,
pp. 331–362.
Wilson, M.A., Vassallo, A.M., Collin, P.J., Rottendorf, H.,
1984. High-resolution carbon-13 nuclear magnetic resonance
spectroscopy and relaxation behavior of organic solids from
fossil fuels. Analytical Chemistry 56, 433–436.
Wuthrich, K., 1976. NMR in Biological Research: Peptides and
Proteins. North Holland/American Elsevier, Amsterdam/
New York.
Zang, X., van Heemst, J.D.H., Dria, K.J., Hatcher, P.G., 2000.
Encapsulation of protein in humic acid from a histosol as an
explanation for the occurrence of organic nitrogen in soil and
sediment. Organic Geochemistry 31, 679–695.
Zhuo, S.-N., Wen, Q.-X., 1992. Nitrogen forms in humic sub-
stances. Pedosphere 2, 307–315.
Zhuo, S.-N., Wen, Q.-X., Du, L.-J., Wu, S.-L., 1992. The
nitrogen form of nonhydrolyzable residue of humic acid.
Chinese Science Bulletin 37, 508–511.
1650 R.J. DiCosty et al. / Organic Geochemistry 34 (2003) 1635–1650