14n1h hmqc solid-state nmr as a powerful tool to study
TRANSCRIPT

doi.org/10.26434/chemrxiv.12278354.v1
14N1H HMQC Solid-State NMR as a Powerful Tool to Study AmorphousFormulations – an Exemplary Study of Paclitaxel Loaded PolymerMicellesMarvin Grüne, Robert Luxenhofer, Dinu Iuga, Steven P. Brown, Ann-Christin Pöppler
Submitted date: 09/05/2020 • Posted date: 12/05/2020Licence: CC BY-NC-ND 4.0Citation information: Grüne, Marvin; Luxenhofer, Robert; Iuga, Dinu; Brown, Steven P.; Pöppler, Ann-Christin(2020): 14N1H HMQC Solid-State NMR as a Powerful Tool to Study Amorphous Formulations – anExemplary Study of Paclitaxel Loaded Polymer Micelles. ChemRxiv. Preprint.https://doi.org/10.26434/chemrxiv.12278354.v1
We present 14N-1H HMQC MAS NMR experiments in the solid state as a promising tool to study amorphousformulations. Poly(2-oxazoline) based polymer micelles loaded with different amounts of the cancer drugpaclitaxel serve to highlight the possibilities offered by these experiments: While the very similar 15N chemicalshifts hamper a solid-state NMR characterization based on this nucleus, 14N is a very versatile alternative.14N-1H HMQC experiments yield well-separated signals, which are spread over a large ppm range, provideinformation on the symmetry of the nitrogen environment and probe 14N-1H through-space proximities.
File list (1)
download fileview on ChemRxiv14N-1H_HMQCs_of_PTX_formulations.pdf (1.62 MiB)

14N-1H HMQC solid-state NMR as a powerful tool to study amorphous formulations – an exemplary study of paclitaxel loaded polymer micelles
Marvin Grünea, Robert Luxenhoferb, Dinu Iugac, Steven P. Brownc, and Ann-Christin Pöppler*a
a) Institute of Organic Chemistry, University of Würzburg, Am Hubland, 97074 Würzburg, Germany. b) Lehrstuhl für Chemische Technologie der Materialsynthese, University of Würzburg, Röntgenring 11, 97070 Würzburg,
Germany. c) Department of Physics, University of Warwick, Coventry, CV4 7AL, United Kingdom.
Abstract
Amorphous drug-polymer formulations are complex materials and often challenging to characterize,
even more so if the small molecule component itself is increasingly complex. In this work, we present 14N-1H HMQC magic-angle spinning (MAS) NMR experiments in the solid state as a promising tool to
study amorphous formulations. Poly(2-oxazoline) based polymer micelles loaded with different
amounts of the cancer drug paclitaxel serve to highlight the possibilities offered by these experiments:
While the dense core of these polymeric micelles prevents an NMR spectroscopic analysis in solution
and the very similar 15N chemical shifts hamper a solid-state NMR characterization based on this
nucleus, 14N is a very versatile alternative. 14N-1H HMQC experiments yield well-separated signals,
which are spread over a large ppm range, provide information on the symmetry of the nitrogen
environment and probe 14N-1H through-space proximities. In this way, the overall complexity can be
narrowed down to specific N-containing environments. The results from the experiments presented
here represent a valuable puzzle piece, which helps to improve the structural understanding of drug-
polymer formulations. It can be straightforwardly combined with complementary NMR spectroscopic
experiments and other analytical techniques.
Introduction
Paclitaxel (PTX, Scheme 1) is an effective anti-cancer drug for a wide range of tumors, but it exhibits a
very low aqueous solubility of 0.4 µg/mL.1, 2 Therefore, a variety of different formulations for PTX was
developed.3 This includes the protein-based nanoparticle Abraxane®, the polymer-conjugate OpaxioTM
as well as Genexol-PM® and NK105.4, 5 The latter two contain PTX in polymer micelles formed by
polyethylene glycol–polylactic acid (Genexol-PM®) and polyethylene glycol-poly(amino acid) (NK105)
copolymers. In general, the development of formulations and their clinical trials require very long times
with highly uncertain outcomes. The above mentioned formulations have undergone multiple phase
II/III clinical trials over the past decades, e.g. a recently published phase III clinical trial of NK105,6 and
only Abraxane® is successfully marketed with FDA approval since 2007. Furthermore, they are all
characterized by a relatively low PTX loading not exceeding 25 wt.%. In this context, Luxenhofer et al.
reported promising preclinical data for polymer micelles comprising a poly(2-oxazoline) (POx) based
triblock copolymer loaded with up to 50 wt.% of PTX.7, 8 Schulz et. al.9 and Jaksch et al.10 studied their
micellar morphology for different drug loadings using dynamic light scattering, atomic force
microscopy, (cryogenic) transmission electron microscopy, and small-angle neutron scattering (SANS).
They found that the pure polymer self-assembles into wormlike and spherical micelles in aqueous
solution, while incorporation of PTX led to the exclusive formation of spherical particles. Interestingly,
SANS data revealed small, PTX rich domains partly submerged within the micellar core. Apart from
such morphological aspects and to be able to design improved drug delivery systems, it is very
important to also understand the complex structural arrangements in such amorphous drug-polymer

formulations on a molecular level. NMR probes the local environment of molecules and is thus an
excellent tool to report on various possible interactions. This doesn’t necessarily require crystalline or
well-ordered structures, but also gives excellent results for disordered as well as amorphous
samples.11-13
In particular, solid-state NMR has been established as a powerful tool for structure elucidation in
pharmaceutical contexts such as identification of polymorphs or investigation of amorphous solid
dispersions.14-16 The sometimes strongly reduced mobility of encapsulated drugs within drug
formulations can hinder the characterization by NMR in solution due to strong broadening of the
signals, which makes solid-state NMR the corresponding method of choice. Callari et al. as well as
Pöppler et al. recently showcased how solid-state NMR at moderate to fast Magic Angle Spinning
(MAS) helps to obtain loading dependent structural insights into micellar formulations with an
assumed core-shell structure.17, 18 Both groups found that increasing the loading of two different types
of polymeric micelles did not just affect the micellar core but interestingly also the surrounding shell,
which served as a basis to explain their physicochemical and biological properties such as reduced
cellular uptake and inferior dissolution rates. Hirsh et al. have recently also shown how fast 1H MAS
measurements enable the rapid characterization of general pharmaceutical dosage forms.19 The
enormous progress made with respect to hardware development, e.g. MAS frequencies of up to
130 kHz being available now,20 also enables high-resolution detection of protons in the solid state and
longer coherence lifetimes.21-23 The latter are essential prerequisites for sophisticated homonuclear as
well as heteronuclear 2D experiments, which are exciting tools to learn more about the intermolecular
proximities in a large range of materials.
However, for the solid-state NMR spectroscopic characterization of PTX and its formulations as
introduced above, a series of complexities arises: PTX alone with its 51 protons and thus a variety of
strongly overlapping chemical environments already poses a challenge. In addition, crystalline PTX
contains two individual molecules in the asymmetric unit (Z’=2),24 which leads to a doubling of the
expected resonances. Consequentially, up to now, only 13C solid-state NMR data with an assignment
based on comparison with structurally related fragments and calculations has been published,25, 26
while 1H solid-state NMR data of PTX is still missing. Including the polymer component and potential
drug-polymer interactions into the picture further complicates the spectral evaluation and thus
requires narrowing down the search space, e.g. by focusing on specific functionalities. For example,
spectral simplification can be achieved by making use of NMR active heteronuclei.
The frequent involvement of nitrogen atoms in hydrogen bonding in pharmaceuticals makes this
nucleus a promising starting point for a detailed investigation of PTX containing formulations through
2D nitrogen-proton correlation experiments, especially since PTX has only one nitrogen environment
per molecule. There are two NMR-active nitrogen isotopes with low magnetogyric ratios: 15N (I = 1/2)
possesses a low natural abundance of only 0.37 %, whereas 14N has a natural abundance of 99.6 % but
exhibits quadrupole broadening due to its nuclear spin quantum number I = 1. The substantial
disadvantage of the first-order quadrupole interaction, causing a broadening in the range of several
MHz, can be avoided by setting the indirect 14N spectral width of the 2D correlation equal to the
spinning frequency. Tatton et. al. successfully applied this in the form of a 14N-1H heteronuclear
multiple-quantum correlation (HMQC) experiment to study crystalline model compounds,27 hydrogen
bonding in co-crystals as well as attempting a first transfer to amorphous solid dispersions.28 Such
amorphous formulations, in particular, could substantially benefit from the additional 14N second-
order isotropic quadrupolar shifts (see SI for detailed equations) as opposed to the 15N isotropic
chemical shifts alone. The additional 14N second-order isotropic quadrupolar shifts will result in the
spreading of the nitrogen signals over a larger ppm range (hundreds of ppm) and can thus disperse
very similar or even overlapping 15N NMR signals. This could prove to be crucial for the analysis of drug

formulations, either when the nitrogen in both, drug and polymer, is part of the same functional
moiety (e.g. amides in the previously mentioned POx/PTX formulations) or when the distribution of
similar local environments as found in amorphous forms makes the differentiation between peaks
challenging. In solid-state NMR, there are two different ways to create 14N-1H HMQCs, either by
heteronuclear through-bond 14N-1H J-couplings and residual second-order quadrupole-dipolar
couplings or by 14N-1H through-space dipolar couplings.29-31 By varying the recoupling time in the latter
case, it is then possible to obtain different through-space proximities with longer recoupling times
probing longer range intra- and intermolecular N···H distances.27 Combining all aspects, 14N-1H HMQC
experiments represent a very promising tool for the investigation of the complex drug-polymer
assemblies.
Scheme 1: Structural formula of the components used in this study: The amphiphilic block copolymer poly(2-methyl-2-oxazoline)-block-
poly(2-n-butyl-2-oxazoline)-block-poly(2-methyl-2-oxazoline) (POL) encapsulates paclitaxel (PTX) by self-assembly into polymeric micelles
(schematic drawing on the right).
In the present work, we investigate the suitability and potential of 14N-1H solid-state NMR experiments
for the analysis of amorphous polymer-PTX formulations, for which structural information is
challenging to obtain due to the lack of long-range order. Therefore, differently loaded paclitaxel
formulations based on the amphiphilic triblock copolymer poly(2-methyl-2-oxazoline)-block-poly(2-n-
butyl-2-oxazoline)-block-poly(2-methyl-2-oxazoline) (pMeOx-b-pBuOx-b-pMeOx = A-pBuOx-A = POL)
(Scheme 1) serve as the set of samples.8 Complemented by samples of the individual components, the
following points will be addressed: (i) general feasibility of the experimental setup for the individual
components, (ii) exploring the potential of 14N-1H HMQC experiments for the analysis of their
amorphous micellar formulations, (iii) extracting information on 14N-1H proximities for intermolecular
through-space contacts and (iv) their interpretation with respect to (loading dependent) structural
features as a complementary source of information to existing data obtained by techniques such as
SANS.
Experimental Section
Materials
Paclitaxel in its crystalline form was purchased from LC Laboratories and used without further
purification. The ABA triblock polymer poly(2-methyl-2-oxazoline)-block-poly(2-n-butyl-2-oxazoline)-
block-poly(2-methyl-2-oxazoline) (POL) was synthesized according to previously published protocols.32
Subsequent preparation of the differently loaded PTX-POL formulations also followed the literature
known procedures.8, 9 A short description can be found in the supporting information. Resulting drug
loadings were determined using HPLC analysis. The corresponding micellar formulation denoted as
POL-2-PTX, POL-4-PTX and POL-9-PTX contain 17 wt % (10:2), 29 wt % (10:4) and 47 wt % (10:9) PTX.

NMR
14N-1H HMQC experiments were performed using a Bruker Avance III spectrometer at a 1H Larmor
frequency of 850 MHz. A Bruker 1.3 mm triple resonance probe operating in double resonance mode
at a MAS frequency of 60 kHz was used. A pulse sequence diagram is shown in Figure S1. Heteronuclear
dipolar couplings were reintroduced by applying rotary resonance recoupling (R³)33 at the 𝑛 =
2 condition, proposed by Gan et. al.29, using x,-x phase inversion34. Each recoupling block had a length
of 16.67 µs. The durations of the 1H pulses/14N pulses were 1.6 µs/3.2 µs for PTX, 2.50 µs/5.00 µs for
POL-9-PTX, 1.55 µs/3.1 µs for POL-2-PTX, POL-4-PTX, and 1.55 µs/3.2 µs for POL. A four-step nested
phase cycle was used to select changes in coherence order Δ𝑝 = ±1 (on the first 1H pulse, two steps)
and Δ𝑝 = ±1 (on the final 14N pulse, two steps). Magic angle and pulse calibrations were done with
the dipeptide β-AspAla. 14N chemical shifts were referenced to a saturated NH4Cl at –352.9 ppm,
corresponding to a primary reference of CH3NO2 at 0 ppm. 15N experiments recorded at 9.4 T were
referenced to unlabelled α-glycine at –342.0 ppm and those at 20 T were referenced to labelled l-
histidine, which has an NH3+ resonance at –333.1 ppm. Both ways of 15N referencing correspond to a
CH3NO2 reference at 0 ppm. The 13C NMR data were measured with a Bruker Avance III HD 600 MHz
spectrometer and a 3.2 mm double-channel probe. The duration of the 1H pulses was 2.5 µs in the 13C
CP MAS with ramped cross-polarization conditions optimized using a ramp from 90 to 100 with 100
increments and the sample α-glycine. SPINAL-6435 heteronuclear decoupling was applied during an
acquisition period of 23 ms at a 1H rf nutation frequency of 100 kHz, with an optimized pulse length of
4.9-5.1 µs. The 15N data of POL-9-PTX were recorded with a Bruker Avance III spectrometer at a 1H
Larmor frequency of 850 MHz and a duration of the 1H pulses of 2.5 µs with optimized cross-
polarization conditions using histidine. The 15N data of crystalline PTX and POL were performed using
a Bruker Avance Neo 400 MHz spectrometer. The duration of the 1H pulses was 2.5 µs with optimized
cross-polarization conditions using α-glycine. KBr was used for magic angle calibration. 13C Chemical
shifts were referenced to the methylene carbon of adamantane at 38.48 ppm.36
Results
As a starting point for the spectral assignment and further investigation of the three differently loaded
formulations of the poorly water-soluble cancer-drug paclitaxel containing 17 wt.% (POL-2-PTX),
29 wt.% (POL-4-PTX) and 47 wt.% (POL-9-PTX) PTX, NMR experiments in solution were performed
(Chapters SI 4-6). For the assignment of PTX, data from NMR measurements in CDCl3 were used.
However, in aqueous polymer micellar formulations, only extremely broad, unresolved PTX signals can
be observed in the 1H NMR spectra (Chapter SI 6 with Figure S3), underlining the necessity to focus on
solid-state NMR for the analysis of such formulations. Consequently, a set of different solid-state NMR
spectra at moderate to fast MAS spinning frequencies was recorded for the formulations and as-
received PTX, amorphous PTX and the neat polymer.
Both the 13C CP MAS NMR spectra recorded at 24 kHz (Figure 1a) as well as powder X-ray diffraction
data (Figure S4) confirm that the formulations are amorphous materials in agreement with a single
glass transition temperature published in a previous work by one of the authors.9 While crystalline
paclitaxel (black spectrum) shows two sets of carbon resonances due to its two independent molecules
in the asymmetric unit, amorphous PTX and an exemplary formulation (POL-9-PTX, highest PTX
content) (grey and blue spectrum) show broad signals as expected for materials lacking long-range
order and containing a distribution of environments and thus chemical shifts. Consequently, several
moieties of PTX appear as joint signals complicating a straightforward extraction of spectral changes
upon incorporation into the micelles in a similar way as recently shown for related polymer micelles
loaded with curcumin as model compound.18 Moreover, additional difficulties arise from overlap

between PTX and POL resonances as can be seen from comparison with the 13C CP MAS spectrum of
the neat polymer (red spectrum). Note, that for better comparability, the neat polymer was heated
above its glass transition temperature Tg (Tg(POL)=56°C)37 prior to the measurement to account for
similar conditions during the preparation of the formulations. Consequently, the analysis of the carbon
spectra and extraction of reliable structural information is difficult and requires complementary tools
such as quantum chemical calculations, which will be explored in detail in a separate work.
Ideally, for a thorough characterization of the formulations we would like to use the direct information
from 1H NMR data at fast MAS due to the high sensitivity of the 1H nucleus to intermolecular
interactions, through space proximities and subtle changes in the packing arrangement. The 1H MAS
NMR spectra recorded at 60 kHz are depicted as external projection in the corresponding 14N-1H HMQC
spectra in Figure 2 and Figure 3. As can be seen, the spectra are dominated by severe signal overlap
despite being recorded at high magnetic field (20 T). Consequently, spectral simplification is required
and the presence of only one secondary amide moiety per PTX enables this through N-H correlation
experiments. Additionally, the tertiary amide functional groups in the polymer could also serve as
another source of structural information. Therefore, 15N CP MAS spectra were recorded and it is very
interesting to note that the secondary amides from PTX (Z’ = 2, crystal structure in SI 10) and the
tertiary amide of the polymer show resonance in the same spectral region (Figure 1b). For the
formulation POL-9-PTX, only a very broad resonance can be observed, again in a similar spectral region
and thus showing the need for a dispersion of the signals as expected for the quadrupolar 14N nucleus.
Figure 1: a) 13C CP MAS NMR spectra of the pure polymer (purple), an exemplary PTX formulation (blue), amorphous (grey) and crystalline
PTX (black). Partial peak assignment is indicated. All spectra were recorded at 14.1 T and 24 kHz MAS with the following parameters (co-
added transients/recycle delay): 1756 / 2.5 s (purple), 2048 / 2.0 s (blue), 23532 / 2.5 s (grey) and 1756 / 2.5s (black). All measurements were
recorded with a contact time of 2.5 ms. b) Corresponding 15N CP MAS NMR spectra recorded at 9.4 T (PTX, POL) and 20 T (POL-9-PTX) using
a contact time of 2 ms. 82796 (PTX), 16991 (POL) and 25600 (POL-9-PTX) co-added transients were measured with a recycle delay of 5.0 s
(PTX, POL) and 3.0 s (POL-9-PTX). Please note that the 15N NMR spectrum of crystalline PTX is the only dataset, which was recorded on a new
batch of PTX containing two differently hydrated PTX phases and thus showing an additional set of signals. As PTX exists in its amorphous
state in the formulations and is dissolved for preparation, the initial degree of incorporated water in the respective phase is not relevant for
the analysis of the formulations.
14N-1H HMQC MAS NMR experiments are particularly powerful in this context, require only a small
amount of sample and have been applied to study a variety of crystalline compounds.29, 38 Therefore,
in a first step, 14N-1H HMQC spectra of the pure compound were recorded to identify their nitrogen
shifts and ensure sufficient separation of the PTX and polymer nitrogen environments.
Pure compounds
Figure 2 shows 14N-1H HMQC spectra of crystalline PTX as well as of the pure polymer. For PTX,
correlations with two different dipolar recoupling times were measured illustrated in black (133.3 µs)
and green (400.0 µs). Similar recoupling times in the 14N-1H HMQC experiments were first tested for

the dipeptide β-AspAla showing the expected appearance of longer range through space proximities
upon increase of the recoupling time (see Figure S5 and Tatton et. al.27). For PTX, using short recoupling
times and in agreement with the X-ray diffraction data, two cross peaks at 8.8/–30 ppm (N1) and 8.0/–
18 ppm (N2) were observed for the NH groups of the two individual molecules of PTX in the asymmetric
unit. Consequently, one can deduce that N1 is
involved in stronger hydrogen bonding than N2.
Figure S10 shows the unit cell of a hydrous
crystal phase as determined by Vella-Zarb et.
al.24 With a three times higher recoupling time,
two changes of the previous peaks for shorter
recoupling time are noticeable: The intensity of
the peak corresponding to nitrogen N2
increases compared to N1 and two additional
signals around 5 ppm proton chemical shift are
observed. Small changes in the 14N shift could be
caused by a temperature increase in the sample
caused by the longer irradiation through the
recoupling blocks. As the recoupling time for the
dipolar couplings increases, it is possible to
sample longer N∙∙∙H distances through space.
Consequently, the relative signal increase of N2
can be explained by proximities of N1 and N2 to
aromatic protons, whose chemical shifts are
overlapping with the proton attached to N2.
Furthermore, this change could also originate
from a slower dephasing for N2. The additional
peaks at 5.0 and 5.3 ppm could indicate
proximity to the protons at carbon C3’ adjacent
to the NH moiety of PTX.
In a 14N-1H HMQC MAS NMR spectrum of the
neat polymer (Figure 2b) recorded with an
intermediate recoupling time of 266.7 µs (no
direct NH), three cross peaks at a 14N shift of
67 ppm and distinct 1H chemical shifts are
observed. Peak A results from through space
proximity of the nitrogen with the methyl
groups C14 and C21 as well as the methylene
group C16. Peak B indicates proximity to the
CH2 unit of the hydrophobic butyl sidechain
(C17/18) and peak C is related to N···H
proximities including the methyl protons of the
butyl sidechain (C19). Interestingly, no cross
peaks between N and the polymer backbone
CH2 groups could be observed. Overall, the
comparison of the two individual components
shows that their nitrogen environments can be
clearly distinguished in the 14N-1H HMQC
experiment, which is not the case if 15N chemical
Figure 2: a) 14N-1H HMQC spectra (20 T, 60 kHz) of crystalline PTX recorded with recoupling times of τRCPL=133.3 µs (black) and
τRCPL=400.0 µs (green, as an insert), both acquired with 34 t1 FIDs, each with 128 co-added transients for a recycle delay of 1.5 s. The base contour level is at 30% (black), 34% (green) and 22% of the maximum
peak height. The red bars point out the corresponding peak in a 1D 1H one-pulse MAS NMR spectrum. b) A 14N-1H HMQC spectrum of POL recorded with a recoupling time τRCPL=266.7 µs, 16 t1 FIDs, each with 2048
co-added transients for a recycle delay of 1.3 s, and corresponding assignment of the N∙∙∙H cross-peaks. The skyline projections correspond to 1H one-pulse MAS NMR spectra of each sample.

shifts are observed (see Figure 2b and Table 1). Additionally, distinct correlation peaks are obtained in
the 2D NMR spectra significantly reducing the spectral complexity in the 1H dimension. This is an
essential prerequisite for the following analysis of the formulations.
Formulations
Figure 3 depicts 14N-1H HMQC MAS NMR
spectra of two differently loaded
formulations (a) POL-2-PTX and b) POL-4-
PTX, both with their 1H MAS NMR spectra as
external projections. In both spectra, two
different 14N shifts, one at positive and one
at negative ppm values, can be observed
with the cross-peaks at negative values
being more intense than the corresponding
signals at positive 14N shifts. For the
formulation with lowest PTX loading (POL-2-
PTX), all cross-peaks appear in the aliphatic 1H chemical shift region below 2 ppm, the
extracted 14N shifts are –50 and +128 ppm.
With increasing PTX loading of the
formulations, both nitrogen shifts decrease
to –132 and +103 ppm. Taking a closer look
at the characteristic peaks for the medium
loaded formulation, POL-4-PTX, cross-peaks
are again observed in the aliphatic 1H region
and additional cross peaks at a proton
chemical shift of 4.5 and 8.0 ppm can be
clearly distinguished. The higher 1H chemical
shifts values are indicative of aromatic or
hydrogen bonding environments.
To complete the set of differently loaded
formulations and subsequently extract
trends, which might reveal information on
changes of the local environment in the
formulations, 14N-1H HMQC data was also
recorded for POL-9-PTX, a formulation with
almost 50 wt.% PTX loading (Figure 4). Due
to hardware problems (untraceable spikes
appearing in the FIDs) and despite multiple
measurement attempts at different times
(August 2019, November 2019),
unfortunately no artefact free dataset could
be recorded. Therefore, the 14N-1H HMQC
for POL-9-PTX was obtained by addition of
the individual FIDs of several datasets with
recoupling times ranging from 133.3 to
533.3 µs. This averaging clearly results in a
loss of information in the 1H dimension.
Figure 3: 14N-1H HMQC spectra (20 T, 60 kHz) of a) the formulation POL-2-PTX recorded with recoupling times τRCPL=133.3 µs (light blue) and
τRCPL=266.7 µs (green), both acquired with 18 t1 FIDs, each with 1024 co-added transients for a recycle delay of 1.3 s, including tentative assignment of N∙∙∙H proximities. The base contour level is at 34% of the
maximum peak height. The internal overlayed 1H spectrum (purple) is that for POL. b) the formulation POL-4-PTX recorded with a recoupling time τRCPL =266.7 µs (dark blue), 12 t1 FIDs each acquired with 1200 co-added
transients for a recycle delay of 1.3 s. The internal overlayed spectrum (brown) is the extracted slice at a 14N shift of –132 ppm. The base contour level is at 22% of the maximum peak height. The skyline projections
represent the 1H one-pulse MAS NMR spectra of each sample.

However, 14N shifts accessible via this
approach and the extracted values of –273 and
+86 ppm are a consistent continuation of the
decrease in shift upon increasing PTX loading.
All extracted values for both the individual
components and the formulations are
summarized in Table 1, which also includes
selected 15N chemical shifts extracted from the
spectra in Figure 1b. This first examination of
the 14N-1H HMQC spectra of the three
formulations is very promising as two different
nitrogen environments can be distinguished
for each sample, which follow a clear trend of
decreasing 14N shift upon increasing loading.
An analogous trend could not have been
observed based on 15N solid-state NMR data as
indicated by the similarity of the extracted
chemical shifts for the polymer and the
formulation with highest PTX loading.
Discussion
In a next step, the observed trends and key N∙∙∙H proximities have to be analyzed and transferred into
chemical knowledge to improve our understanding of the studied formulations on a molecular level.
To do so, 14N quadrupolar shifts δQiso (detailed explanation see SI 1) can be estimated based on the
hypothesis that the 14N isotropic chemical shift are approximately identical to the 15N isotropic
chemical shifts. Consequently, the quadrupolar shift values can be determined by subtraction giving
the values indicated in Table 1. If available, the corresponding experimental 15N chemical shifts were
used. For all formulations, a 15N value of –263 ppm was used.
Table 1: Overview of the experimentally determined 14N shift values, selected 15N chemical shifts and the resulting, calculated 14N quadrupolar
shifts.
δ14N
neg. ppm
δ14N
pos. ppm
δ15N / ppm δQiso / ppm
Crystalline
PTX
−18 / −30 --- −246 / −260 228 / 230
Amorphous
PTX
−55 / −70 --- 200a / 185a
Pure POL --- +67 −258 /
−263
325 / 330
POL-2-PTX −50 +128 205 / 383
POL-4-PTX −132 +103 123 / 358
POL-9-PTX −273 +86 −263 −10 / 349 (a) Calculated as δ(14N) – δ(15N) using an average 15N chemical shift of -255 ppm.
For as-received and amorphous PTX, relatively large 14N quadrupolar shifts of around 200 ppm are
observed, which is indicative of the more asymmetric environment of the 14N within a secondary
amide. The data for the pure polymer, which only contains tertiary amides, reveals even larger
quadrupolar shifts of above 300 ppm. Interestingly, the resulting quadrupolar shifts of all three
Figure 4: Addition of several 14N-1H HMQC (20 T, 60 kHz) spectra of the
formulation POL-9-PTX. The recoupling times of the measurements vary
from τRCPL=133.3 µs to τRCPL=533.3 µs, always with a recycle delay of 1.0 s.
The base contour level is at 34% of the maximum peak height.

formulations remain similarly sized for the 14N signal observed at positive ppm values, which is
furthermore comparable in size to the neat polymer, while the quadrupolar shift of the 14N signal at
negative ppm values is decreasing with increasing PTX loading. This indicates a more symmetric N-
environment at higher PTX loadings with the very low experimentally determined quadrupolar shift
for POL-9-PTX verging on an almost tetrahedral arrangement. How can this major change in symmetry
be explained?
To approach this question, it is first necessary to discuss the assignment of the two 14N shifts observed
for the formulations. At a first glance, the 2D NMR data of the individual components, PTX and POL,
showing positive as well as negative 14N shifts in a similar region to the two shifts found for the
formulations, suggest an analogous assignment for these two environments. However, for the lowest
PTX loading (POL-2-PTX), only 2.2 % of all nitrogen atoms in the sample belong to PTX, while the
majority of nitrogen atoms originate from the polymer. Furthermore, no intramolecular NH contact
like the one found for pure PTX is observed for the formulation with lowest loading. For POL-4-PTX and
POL-9-PTX, 4.5 % and 10.1 % of the nitrogen atoms in the sample are found in PTX molecules. With
this in mind, we hypothesize that both 14N signals arise from polymeric environments, the more intense
signal at negative ppm values being assigned to amides in close proximity to PTX molecules acting as
hydrogen bond donors and the signal at positive ppm resulting from the remaining amide fragments
of the triblock copolymer. This agrees with the signal at negative ppm gaining in intensity with respect
to the other 14N environment upon increasing the PTX loading. The tertiary amides can act as hydrogen
bond acceptors and in doing so the nitrogen environment gets more symmetric, which results in a
smaller quadrupolar shift. Finally, the formulation with medium loading gives further insights into the
drug-polymer assembly. While the amount of PTX in POL-2-PTX is very low and the 14N-1H HMQC is
dominated by polymer-polymer contacts, distinct NH contacts with protons resonating above 4 ppm
can be observed for the 14N at negative ppm values in the 14N-1H HMQC spectrum of POL-4-PTX. All
these cross-peaks can only arise from intermolecular drug-polymer contacts as the polymer itself does
not show any proton chemical shifts above 3.9 ppm. Specifically, cross-peaks at 8.0, 6.4, 5.6 and
4.5 ppm were observed. In comparison with the NMR spectroscopic data of pure PTX, the cross-peak
above 8 ppm can be assigned to a tertiary amide∙∙∙HN proximities, while the remaining cross-peaks
could result from contacts between the amide and the different OH environments within PTX. This
underlines that 14N-1H HMQC NMR experiments are not only spreading out the nitrogen NMR signals,
but are also a promising tool to study local symmetry and detect key intermolecular interactions in
complex and amorphous drug-polymer formulations.
Summary and Conclusion
In this work, we investigated polymer formulations of the anti-cancer drug paclitaxel. For both the
polymer and the drug, 15N chemical shifts in a very similar spectral area were observed, which results
in significant signal overlap, especially if amorphous samples are involved. Consequently, for this set
of samples, it is very challenging to distinguish small changes in the spectra and extract trends and
information on interactions of specific moieties, e.g. upon increasing drug loading of the formulations.
Therefore, 14N-1H HMQC NMR experiments were investigated as a very valuable tool to disperse signals
due to the additional quadrupolar shift when observing 14N instead of 15N. We could show that such
experiments can be a rich source of information for the characterization of molecular interactions in
amorphous polymer-drug nanoformulations, which is otherwise difficult to obtain. On the one hand,
the 14N signals were dispersed so that two distinct 14N environments could be extracted for each
formulation and the complexity in the 1H dimension could be reduced through this correlation
experiment. Thus, it was possible to extract trends for different drug loadings, distinguish cross peaks
and extract quadrupolar parameters, which together enables us to learn about the local amide
environment and key interaction motifs between the drug and polymer in such complex, amorphous

mixtures. Overall, the 14N-1H HMQC NMR experiment have great potential for the analysis of
disordered and amorphous drug-delivery systems, which can be transferred and should be explored
for other systems. Furthermore, in a next step we intend to combine these experiments with additional
data and complementary calculations to learn more about these PTX formulations and ultimately
derive realistic structural models on a molecular level.
Conflicts of interest
There are no conflicts to declare.
Acknowledgements
We thank Dr. Michael Lübtow for providing the samples and Dr. Matthias Grüne for helpful discussion
and proofreading of the manuscript. Dr. Rüdiger Bertermann kindly measured the 15N data of the
individual components. We further thank Dominik Heuler for his support with the PXRD
measurements. This work was supported by a Newton International Fellowship Alumni Follow on
Funding of the Royal Society (AL\180018). The UK 850 MHz solid-state NMR Facility used in this
research was funded by EPSRC and BBSRC (contract reference PR140003), as well as the University of
Warwick including via part funding through Birmingham Science City Advanced Materials Projects 1
and 2 supported by Advantage West Midlands (AWM) and the European Regional Development Fund
(ERDF). The experimental data for this study are provided as a supporting dataset from WRAP, the
Warwick Research Archive Portal at http …..
Notes and references
1. P. Ma, R. J. Mumper, J. Nanomed. Nanotechnol., 2013, 4, 1000164.
2. T.-H. Wang, H.-S. Wang, Y.-K. Soong, Cancer, 2000, 88, 2619-28.
3. A. M. Sofias, M. Dunne, G. Storm, C. Allen, Adv. Drug Delivery Rev., 2017, 122, 20-30.
4. Y. S. Youn, Y. H. Bae, Adv. Drug Deliv Rev., 2018, 130, 3-11.
5. Z. He, A. Schulz, X. Wan, J. Seitz, H. Bludau, D. Y. Alakhova, et al., J. Controlled Release, 2015,
208, 67-75.
6. Y. Fujiwara, H. Mukai, T. Saeki, J. Ro, Y.-C. Lin, S. E. Nagai, et al., Br. J. Cancer, 2019, 120, 475.
7. Z. He, X. Wan, A. Schulz, H. Bludau, M. A. Dobrovolskaia, S. T. Stern, et al., Biomaterials, 2016,
101, 296-309.
8. R. Luxenhofer, A. Schulz, C. Roques, S. Li, T. K. Bronich, E. V. Batrakova, et al., Biomaterials, 2010,
31, 4972-9.
9. A. Schulz, S. Jaksch, R. Schubel, E. Wegener, Z. Di, Y. Han, et al., ACS Nano, 2014, 8, 2686-96.
10. S. Jaksch, A. Schulz, Z. Di, R. Luxenhofer, R. Jordan, C. M. Papadakis, Macromol. Chem. Phys.,
2016, 217, 1448-56.
11. R. F. Moran, D. M. Dawson, S. E. Ashbrook, Int. Rev. Phys. Chem., 2017, 36, 39-115.
12. S. E. Ashbrook, P. Hodgkinson, J. Chem. Phys., 2018, 149, 040901.
13. P. Florian, F. Fayon. Chapter 12 Disordered Solids. Modern Methods in Solid-state NMR: A
Practitioner's Guide: The Royal Society of Chemistry; 2018. p. 356-90.
14. R. K. Harris, J. Pharm. Pharmacol., 2007, 59, 225-39.
15. H. G. Brittain. Polymorphism in Pharmaceutical Solids, Second Edition: CRC Press; 2009.
16. S. Baghel, H. Cathcart, N. J. O'Reilly, J. Pharm. Sci., 2016, 105, 2527-44.
17. M. Callari, P. L. De Souza, A. Rawal, M. H. Stenzel, Angew. Chem. Int. Ed., 2017, 56, 8441-5.
18. A. C. Pöppler, M. M. Lübtow, J. Schlauersbach, J. Wiest, L. Meinel, R. Luxenhofer, Angew. Chem.
Int. Ed., 2019, 58, 18540-6.
19. D. A. Hirsh, A. V. Wijesekara, S. L. Carnahan, I. Hung, J. W. Lubach, K. Nagapudi, et al., Mol.
Pharmaceutics, 2019, 16, 3121-32.
20. S. K. Vasa, P. Rovó, R. Linser, Acc. Chem. Res., 2018, 51, 1386-95.

21. S. P. Brown, Solid State Nucl. Magn. Reson., 2012, 41, 1-27.
22. R. Zhang, K. H. Mroue, A. Ramamoorthy, Acc. Chem. Res., 2017, 50, 1105-13.
23. Y. Nishiyama, Solid State Nucl. Magn. Reson., 2016, 78, 24-36.
24. L. Vella-Zarb, U. Baisch, R. E. Dinnebier, J. Pharm. Sci., 2013, 102, 674-83.
25. J. K. Harper, D. H. Barich, E. M. Heider, D. M. Grant, R. R. Franke, J. H. Johnson, et al., Cryst.
Growth Des., 2005, 5, 1737-42.
26. E. M. Heider, J. K. Harper, D. M. Grant, Phys. Chem. Chem. Phys., 2007, 9, 6083-97.
27. A. S. Tatton, J. P. Bradley, D. Iuga, S. P. Brown, Z. Phys. Chem., 2012, 226, 1187-204.
28. A. S. Tatton, T. N. Pham, F. G. Vogt, D. Iuga, A. J. Edwards, S. P. Brown, Mol. Pharmaceutics, 2013,
10, 999-1007.
29. Z. Gan, J. P. Amoureux, J. Trebosc, Chem. Phys. Lett., 2007, 435, 163-9.
30. S. Cavadini, Prog. Nucl. Magn. Reson. Spectrosc., 2010, 56, 46-77.
31. S. Cavadini, A. Abraham, G. Bodenhausen, Chem. Phys. Lett., 2007, 445, 1-5.
32. M. M. Lübtow, L. Hahn, M. S. Haider, R. Luxenhofer, J. Am. Chem. Soc., 2017, 139, 10980-3.
33. T. Oas, R. Griffin, M. Levitt, J. Chem. Phys., 1988, 89, 692-5.
34. P. Costa, J. Gross, M. Hong, R. Griffin, Chem. Phys. Lett., 1997, 280, 95-103.
35. B. Fung, A. Khitrin, K. Ermolaev, J. Magn. Reson., 2000, 142, 97-101.
36. C. R. Morcombe, K. W. Zilm, J. Magn. Reson., 2003, 162, 479-86.
37. M. M. Lübtow, M. S. Haider, M. Kirsch, S. Klisch, R. Luxenhofer, Biomacromolecules, 2019, 20,
3041-56.
38. K. Maruyoshi, D. Iuga, O. N. Antzutkin, A. Alhalaweh, S. P. Velaga, S. P. Brown, Chem. Commun.
(Cambridge, U. K.), 2012, 48, 10844-6.

Supporting Information
14N-1H HMQC solid-state NMR as a powerful tool to study amorphous formulations – an exemplary study of paclitaxel loaded polymer micelles
Marvin Grünea, Robert Luxenhoferb, Dinu Iugac, Steven P. Brownc, and Ann-Christin Pöppler*a
a Institute of Organic Chemistry, University of Würzburg, Am Hubland, 97074 Würzburg, Germany
b Lehrstuhl für Chemische Technologie der Materialsynthese, University of Würzburg, Röntgenring 11, 97070 Würzburg, Germany
c Department of Physics, University of Warwick, Coventry, CV4 7AL, United Kingdom

Supporting Information
Content:
SI 1. Calculation of the second-order isotropic quadrupolar shift
SI 2. Pulse Sequence
SI 3. Preparation of the Paclitaxel (PTX)-Polymer Formulations and amorphous Paclitaxel
SI 4. Chemical shifts of the Polymer (POL) in solution
SI 5. NMR characterization of PTX in solution
SI 6. 1H NMR spectra of unloaded and loaded polymer micelles in D2O recorded with a cryoprobe
SI 7. PXRD measurements
SI 8. Solid-state NMR - 14N-1H HMQC of the Dipeptide β-Asp-Ala
SI 9. 14N-1H HMQC of amorphous PTX
SI 10. Crystal structure of PTX
SI 11. References

SI 1: Calculation of the second-order isotropic quadrupolar shift1
For a quadrupolar nucleus, in addition to the isotropic chemical shift, there is an isotropic second-order quadrupolar shift: For the (m, m −1) transition, this is given in ppm as:2, 3
𝛿𝑖𝑠𝑜𝑄 =
{
−
340(𝑃𝑄𝜈𝑂)2
[𝐼(𝐼 + 1) − 9𝑚(𝑚 − 1) − 3]
[𝐼2(2𝐼 − 1)2]
}
× 106
where 𝜈0 is the Lamor frequency in Hz and the quadrupolar product, 𝑃𝑄, is defined as:
𝑃𝑄 = 𝐶𝑄√[1 +𝜂𝑄2
3]
The quadrupolar coupling constant, 𝐶𝑄, and asymmetry, 𝜂𝑄, depend on the principal components of
the electric field gradient tensor that are ordered such that: |𝑉𝑍𝑍| ≥ |𝑉𝑌𝑌| ≥ |𝑉𝑋𝑋|. Specifically, the quadrupolar coupling constant, 𝐶𝑄, (in units of Hz) is given by:
𝐶𝑄 =𝑉𝑍𝑍𝑒𝑄
ℎ=𝑒2𝑞𝑄
ℎ
where 𝑄 is the nuclear quadrupole moment and 𝑞 is the electric field gradient, and 𝑒 and ℎ are the charge of an electron and Planck’s constant, repectively. The asymmetry is defined as:
𝜂𝑄 =𝑉𝑋𝑋 − 𝑉𝑌𝑌𝑉𝑍𝑍
SI 2: Pulse Sequence
Figure S1: 14N-1H HMQC pulse sequence using the R³ rotary resonance sequence to recouple heteronuclear dipolar couplings.1

SI 3: Preparation of the Paclitaxel (PTX)-Polymer Formulations and amorphous Paclitaxel
The three formulations with different drug load were prepared according to existing preparation protocols.4 Throughout this manuscript, the formulations are referred to as POL-2-PTX, POL-4-PTX and POL-9-PTX. The numbers 2,4 and 9 describe the polymer to drug ratio (by weight) of the formulation. The different concentrations used for preparation and the median hydrodynamic radius (literature data) of the micelles are listed in Table S1.
Formulation Ratio (POL/PTX)
(w/w)
% wt Concentration POL (g/L)
Solubilized concentration
PTX (g/L)
Median Hydrodynamic
Radius (Rh)5
P2-2-PTX 10:2 17 % 10 g/L 2 g/L 6 nm
P2-4-PTX 10:4 29 % 10 g/L 4 g/L 8 nm
P2-9-PTX 10:9 47 % 10 g/L 9 g/L 11 nm
All three formulations were produced by combining the appropriate amount of ethanolic polymer and PTX solutions. Ethanol was then evaporated, the resulting thin film dissolved in H2O and lyophilized to give a white powder.
Lyophilization was also used to prepare amorphous PTX. PXRD data shown in figure S4 confirmed the amorphicity.

SI 4: Chemical shifts of the Polymer (POL) in solution
C CDCl3 [ppm]
D2O [ppm]
H of C CDCl3 [ppm]
D2O [ppm]
2,3,6,7 48.1-43.7
46.3, 44.2, 43.0
2,3,6,7 3.49-3.25
3.51-3.47
4,5 47.2, 46.7
4, 5 3.63-3.57
13/20 171.5, 170.9
174.3
14/21 21.3 20.2 14/21 2.14-2.08
2.09-2.02
15 174.0,
173.4
Not
visible
16 32.6 32.3 16 2.37-2.31, 2.27-2.22
2.36-2.26
17 27.4 27.3 17 1.61-1.53
1.51-1.47
18 22.7 22.0 18 1.39-1.30
1.34-1.27
19 14.1 13.3 19 0.93-0.90
0.89-0.85

SI 5: NMR characterization of PTX in solution
Figure S2a: 1H NMR spectrum of pure PTX (as received) in CDCl3, recorded with 16 scans and a recycle delay of 5.8 s. The dataset was recorded on a Bruker Avance III HD 14.1 T spectrometer equipped with a 5 mm BBFO BB/19F-1H/D probe at 295.2 K. The temperature was calibrated using 4% MeOH in MeOD.

Figure S2b: 13C/(1H) NMR spectrum of pure PTX (as received) in CDCl3, recorded with 8192 scans and a recycle delay of 2.8 s. The dataset was recorded on a Bruker Avance III HD 14.1 T spectrometer equipped with a 5 mm BBFO BB/19F-1H/D probe at 295.2 K. The temperature was calibrated using 4% MeOH in MeOD.
For clarity, the following 1H NMR assignment for PTX uses the carbon numbering scheme from above in the way that, for example, C25, indicates the proton bound to carbon C25.
1H-NMR (600.4 MHz, CDCl3): δ = 8.13 (m, 2 H, CH, C23/27 (o)), 7.74 (m, 2 H, CH, C33/35 (m)), 7.61 (m, 1 H, CH, C25 (p)), 7.52-7.47 (m, 5 H, CH, C24/26 (m), C34(p), C38/42 (o)), 7.43-7.40 (m, 4 H, CH, C32/36 (o), C39/41 (m)), 7.35 (m, 1 H, CH, C40 (p)), 6.99 (d, 1 H, NH, 3JC3‘-NH = 8.9 Hz, NH). 6.27 (s, 1 H, CH, C10), 6.23 (m, 1 H, CH, C13), 5.79 (dd, 1 H, CH, 3JC2‘-C3‘ = 2.6 Hz, 3JC3‘-NH = 8.9 Hz, C3‘), 5.67 (d, 1 H, CH, 3JC2-
C3 = 7.0 Hz, C2), 4.95 (dd, 1 H, CH, 3JC5-C6a = 1.9 Hz, 3JC5-C6e = 9.6 Hz, C5), 4.79 (d, 1 H, CH, 3JC2‘-C3‘ = 2.7 Hz, C2‘), 4.40 (dd, 1 H, CH, 3JC7-C6a = 10.9 Hz, 3JC7-C6e = 6.8 Hz, C7), 4.31 (d, 1 H, CH2, 2JC20-C20 = 8.5 Hz, C20), 4.19 (d, 1 H, CH2, 2JC20-C20 = 8.5 Hz, C20), 3.80 (d, 1 H, CH, 3JC2-C3 = 7.0 Hz, C3), 3.57 (s, 3 H, CH3, C2‘-OH), 2.59-2.48 (ddd, 1 H, CH, 2JC6a-C6e = 15.0 Hz, 3JC5-C6e = 9.7 Hz, 3JC7-C6e = 6.7 Hz, C6e), 2.47 (s, 1 H, OH, C7-OH), 2.39 (s, 3 H, CH3, C29), 2.35 (dd, 1 H, CH, 2JC14a-C14e = 15.4 Hz, 3JC13-C14e = 9.0 Hz, C14e), 2.28 (dd, 1 H, CH, 2JC14a-C14e = 15.4 Hz, 3JC13-C14a = 9.0 Hz, C14a), 2.24 (s, 3 H, CH3, C31), 1.92-1.85 (ddd, 1 H, CH, 2JC6a-
C6e = 14.7 Hz, 3JC5-C6a = 2.3 Hz, 3JC7-C6a = 11.0 Hz, C6a), 1.79 (d, 3 H, CH3, 4JC18-C13 = 1.1 Hz, C18), 1.68 (s, 3 H, CH3, C19), 1.24 (s, 3 H, CH3, C16), 1.14 (s, 3 H, CH3, C17) ppm.
13C-NMR (100.6 MHz, CDCl3): δ = 203.8 (1 C, Cq, C9), 172.9 (1 C, Cq, C1‘), 171.4 (1 C, Cq, C30), 170.5 (1 C, Cq, C28), 167.2 (1 C, Cq, C21), 167.2 (1 C, Cq, C4‘), 142.1 (1 C, Cq, C12), 138.1 (2 C, Cq, C37/43), 133.9 (1 C, Cq, C22), 133.7 (1 C, CH, C25 (p)), 133.3 (1 C, Cq, C11), 132.1 (1 C, CH, C34 (p)), 130.4 (2 C, CH, C23/27 (o)), 129.3 (2 C, CH, C38/42 (o)), 129.2 (1 C, CH, C39/41 (m)), 128.88 (1 C, CH, C39/41 (m)), 128.86 (4 C, CH, C24/26 (m), C32/36 (o)), 128.5 (1 C, CH, C40 (p)), 127.2 (2 C, CH, C33/35 (m)), 127.2 (2 C, CH, C38/42 (o)), 84.6 (1 C, CH, C5), 81.3 (1 C, Cq, C4), 79.2 (1 C, Cq, C1), 76.7 (1 C, CH2, C20), 75.7 (1 C, CH, C10), 75.1 (1 C, CH, C2), 73.3 (1 C, CH, C2‘), 72.5 (1 C, CH, C13), 72.3 (1 C, CH, C7), 58.8 (1 C, Cq, C8), 55.2 (1 C, CH, C3‘), 45.7 (1 C, CH, C3), 43.3 (1 C, Cq, C15), 35.8 (1 C, CH2, C14), 35.7 (1 C, CH2, C6), 27.0 (1 C, CH3, C16a), 22.8 (1 C, CH3, C29), 22.0 (1 C, CH3, C17e), 21.0 (1 C, CH3, C31), 15.0 (1 C, CH3, C18), 9.7 (1 C, CH3, C19) ppm.
SI 6: 1H NMR spectra of unloaded and loaded polymer micelles in D2O recorded with a cryoprobe
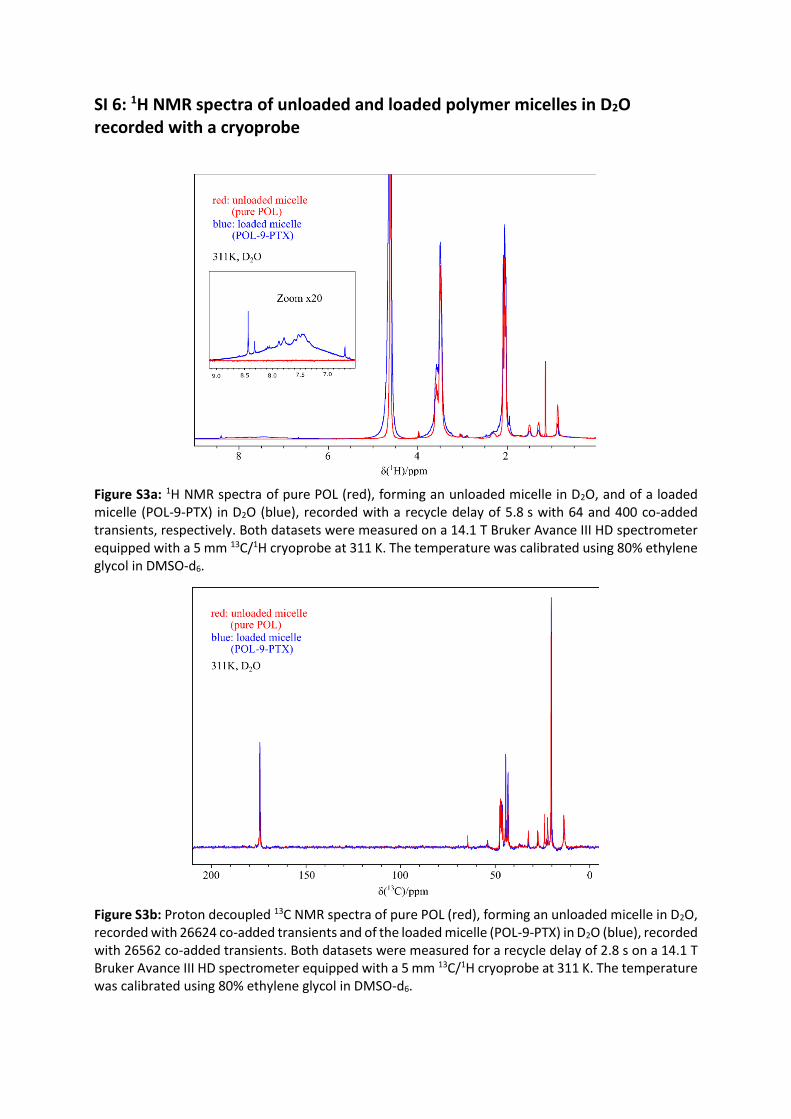
Figure S3a: 1H NMR spectra of pure POL (red), forming an unloaded micelle in D2O, and of a loaded micelle (POL-9-PTX) in D2O (blue), recorded with a recycle delay of 5.8 s with 64 and 400 co-added transients, respectively. Both datasets were measured on a 14.1 T Bruker Avance III HD spectrometer equipped with a 5 mm 13C/1H cryoprobe at 311 K. The temperature was calibrated using 80% ethylene glycol in DMSO-d6.
Figure S3b: Proton decoupled 13C NMR spectra of pure POL (red), forming an unloaded micelle in D2O, recorded with 26624 co-added transients and of the loaded micelle (POL-9-PTX) in D2O (blue), recorded with 26562 co-added transients. Both datasets were measured for a recycle delay of 2.8 s on a 14.1 T Bruker Avance III HD spectrometer equipped with a 5 mm 13C/1H cryoprobe at 311 K. The temperature was calibrated using 80% ethylene glycol in DMSO-d6.

Figure S3a and S3b show 1H and 13C NMR spectra of unloaded as well as of PTX-loaded polymer micelles. All spectra were recorded at 311K to mimic body temperature conditions in blood circulation. In Figure S3a, the aromatic region of the protons (enlarged region) is of particular interest. This region only contains PTX signals. Due to the low signal intensity and the broad line widths, it is challenging to investigate the incorporation of PTX into the micelles via 1H NMR data in solution. Figure S3b demonstrates that even after recording more than 26000 scans for a 13C NMR experiment in solution using a cryoprobe at 14.1 T, no visible signals of the PTX appear between 70 and 150 ppm. In this region, no POL peaks would be expected.
SI 7: PXRD measurements
Figure S4: PXRD data of POL (blue), an exemplary formulation POL-4-PTX (red), crystalline PTX (grey) and amorphous PTX (black). Powder diffraction data was recorded on a Bruker Discover D8 powder diffractometer (Karlsruhe, Germany) using Cu Kα radiation (unsplit Kα1+Kα2 doublet, mean wavelength λ= 154.19 pm) at a power of 40 kV and 40 mA, a focusing Goebel mirror, and a 2.5° axial Soller slit. The scattered X-ray beam went through a receiving slit (3.3°). Detection was achieved with a LynxEye-1D-Detector (Bruker AXS) using the full detector range of 192 channels. Measurements were done in reflection geometry in coupled two theta/theta mode with a step size of 0.025° in the range 2θ of 5° to 45° (black) or 50° (blue, red, grey). The software package DIFFRAC.Suite (V2 2.2.690, BrukerAXS 2009–2011, Karlsruhe, Germany) was used for data collection. The diffraction data was subsequently converted into ASCII format and further handled with Origin (OriginLab, Massachusetts, USA).
POL-4-PTX mainly shows the expected amorphous character. The two peaks between 25-30° correspond to PTX, which still forms some small ordered phases within the formulation. Different PTX batches of the same company yielded slightly different phases, which is further discussed in SI 8.

SI 8: Solid-state NMR - 14N-1H HMQC of the Dipeptide β-Asp-Ala
Figure S5: 14N-1H HMQC spectra recorded at 20 T and a MAS frequency of 60 kHz for the dipeptide β-AspAla using a recoupling time (τRCPL) of 𝑅𝑐 = 133 µ𝑠 (blue) and 𝑅𝑐 = 266 µ𝑠 (red). 64 t1 FIDs increments were acquired, each with 16 co-added transients and a recycle delay of 1.0 s. A 1H one-pulse MAS NMR spectrum of β-AspAla is shown as external projection.
Figure S5 illustrates 14N-1H HMQC test measurements of the dipeptide β-Asp-Ala. By varying the recoupling time, it is possible to observe increasingly longer-range through-space proximities, e.g. longer recoupling times probing longer range intra- and intermolecular N···H proximities (further investigations of this by Tatton et. al.1). Comparison of the red and blue spectra reveals that the increase in recoupling time yields additional N···H contacts and that the signal intensity of the directly bound NH decreases with increasing recoupling time.

SI 9: 14N-1H HMQC of amorphous PTX
Figure S6: 14N-1H HMQC spectra recorded at 20 T and a MAS frequency of 60 kHz for amorphous paclitaxel using a recoupling time (τRCPL) of blue: 𝑅𝑐 = 133.3 µ𝑠, red: 𝑅𝑐 = 266.7 µ𝑠. 34 t1 FIDs increments were acquired using a recycle delay of 2.0 s, each with 240 co-added transients. The corresponding 1H one-pulse MAS NMR spectrum is shown as external projection.

SI 10: Crystal structure of PTX
Figure S10: Unit cell of PTX. Hydrate structure of PTX published by Vella-Zarb et al.6 with the CCDC name RIGKUP and CCDC number 912149. This structure contains two molecules of PTX in the asymmetric unit and six additional water molecules. The original structure was obtained by single-crystal synchrotron XRD data at a temperature of 120.15 K. The two individual PTX molecules in the asymmetric unit are highlighted above.
SI 11: References
1. Tatton A. S., Bradley J. P., Iuga D., Brown S. P., Z. Phys. Chem., 2012, 226, 1187-204. 2. Gan Z., Amoureux J. P., Trebosc J., Chem. Phys. Lett., 2007, 435, 163-9. 3. Samoson A., Chem. Phys. Lett., 1985, 119, 29-32. 4. Luxenhofer R., Schulz A., Roques C., Li S., Bronich T. K., Batrakova E. V., et al., Biomaterials,
2010, 31, 4972-9. 5. Schulz A., Jaksch S., Schubel R., Wegener E., Di Z., Han Y., et al., ACS nano, 2014, 8, 2686-96. 6. Vella-Zarb L., Baisch U., Dinnebier R. E., J. Pharm. Sci., 2013, 102, 674-83.

download fileview on ChemRxiv14N-1H_HMQCs_of_PTX_formulations.pdf (1.62 MiB)