1 h mas nmr spectra including trapdor 29 si mas nmr 27 al 3qmas nmr 27 al mas nmr
DESCRIPTION
Solid-state NMR studies on microporous and mesoporous materials concerning their structure, acidity and catalytic activity. 1 H MAS NMR spectra including TRAPDOR 29 Si MAS NMR 27 Al 3QMAS NMR 27 Al MAS NMR 1 H MAS NMR in the range from 160 K to 790 K. - PowerPoint PPT PresentationTRANSCRIPT
Dieter Freude, Institut für Experimentelle Physik I der Universität Leipzig METU-Center Workshop on Solid State NMR, 1 November 2007
Solid-state NMR studies onSolid-state NMR studies onmicroporous and mesoporous materialsmicroporous and mesoporous materialsconcerning their structure, acidity and concerning their structure, acidity and
catalytic activitycatalytic activity
Solid-state NMR studies onSolid-state NMR studies onmicroporous and mesoporous materialsmicroporous and mesoporous materialsconcerning their structure, acidity and concerning their structure, acidity and
catalytic activitycatalytic activity
1H MAS NMR spectra including TRAPDOR 29Si MAS NMR 27Al 3QMAS NMR 27Al MAS NMR 1H MAS NMR in the range from 160 K to 790 K
11H MAS NMR spectra, TRAPDORH MAS NMR spectra, TRAPDOR11H MAS NMR spectra, TRAPDORH MAS NMR spectra, TRAPDOR
H-ZSM-5 activated at 550 °C
420246 8 10 / ppm
20 468 10 / ppm
4
4.2 ppm 2.9 ppm2.9 ppm
2.2 ppm
1.7 ppm
2.2 ppm1.7 ppm2.9 ppm2.9 ppm
with dephasing
without dephasing
difference spectra
2
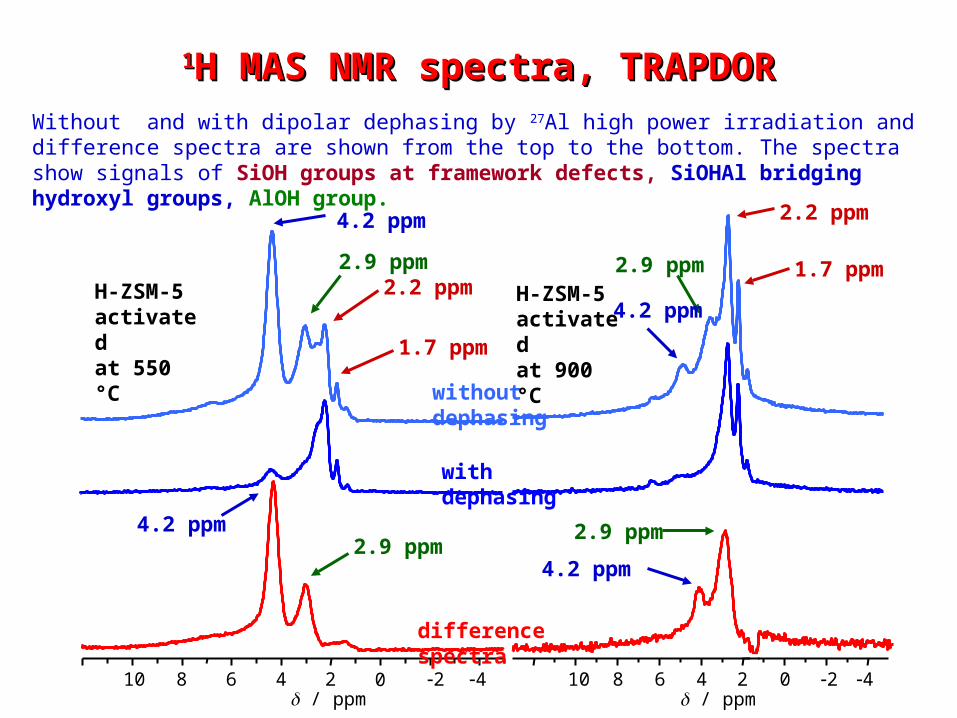
Without and with dipolar dephasing by 27Al high power irradiation and difference spectra are shown from the top to the bottom. The spectra show signals of SiOH groups at framework defects, SiOHAl bridging hydroxyl groups, AlOH group.
H-ZSM-5 activated at 900 °C
4.2 ppm
4.2 ppm
4.2 ppm
11H MAS NMR of porous materialsH MAS NMR of porous materials11H MAS NMR of porous materialsH MAS NMR of porous materials
0 2 4 6 7 5 ppm 3 1
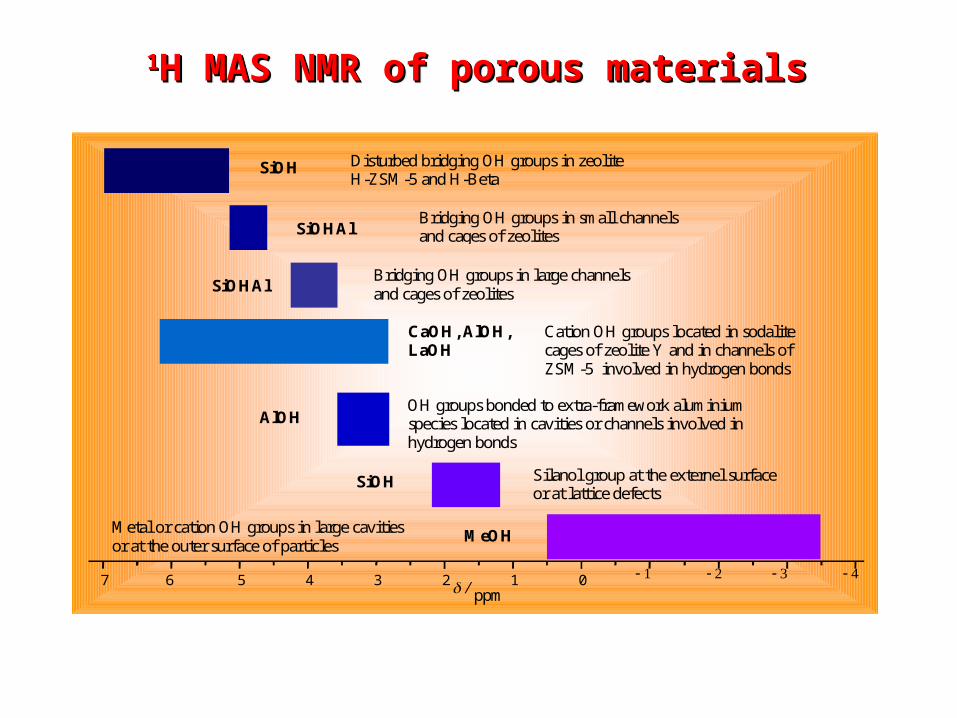
Bridging OH groups in small channels and cages of zeolites
SiOHAl
Disturbed bridging OH groups in zeolite H-ZSM-5 and H-Beta
SiOH
Bridging OH groups in large channels and cages of zeolites SiOHAl
Cation OH groups located in sodalite cages of zeolite Y and in channels of ZSM-5 involved in hydrogen bonds
CaOH, AlOH, LaOH OH groups bonded to extra-framework aluminium species located in cavities or channels involved in hydrogen bonds
AlOH Silanol group at the externel surface or at lattice defects
SiOH
Metal or cation OH groups in large cavities or at the outer surface of particles MeOH
2929Si MAS NMR spectrum of silicalite-1Si MAS NMR spectrum of silicalite-12929Si MAS NMR spectrum of silicalite-1Si MAS NMR spectrum of silicalite-1
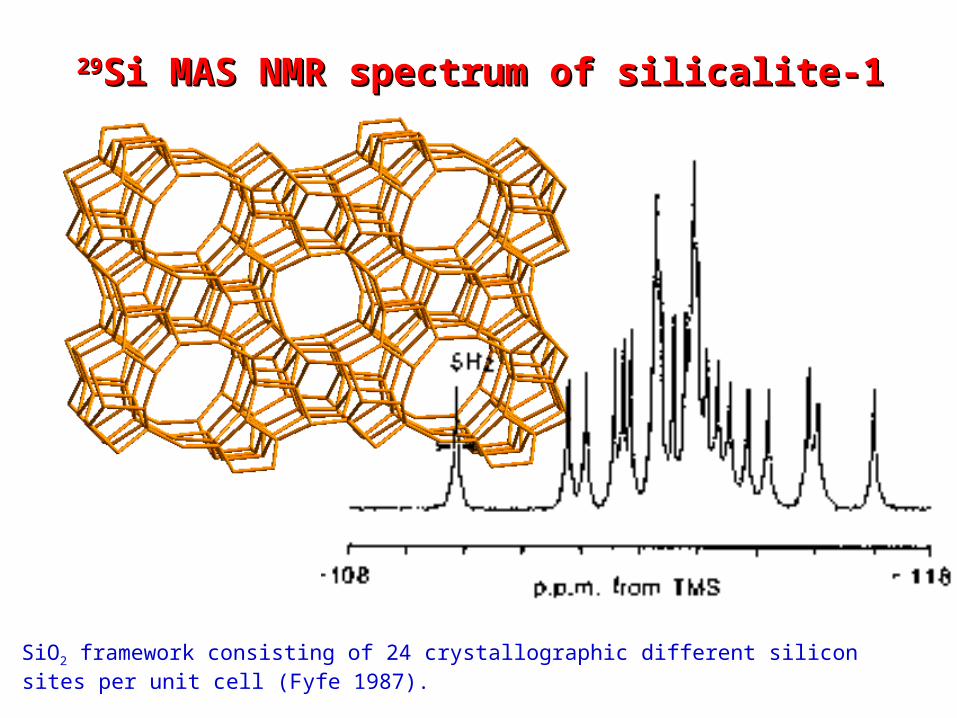
SiO2 framework consisting of 24 crystallographic different silicon sites per unit cell (Fyfe 1987).
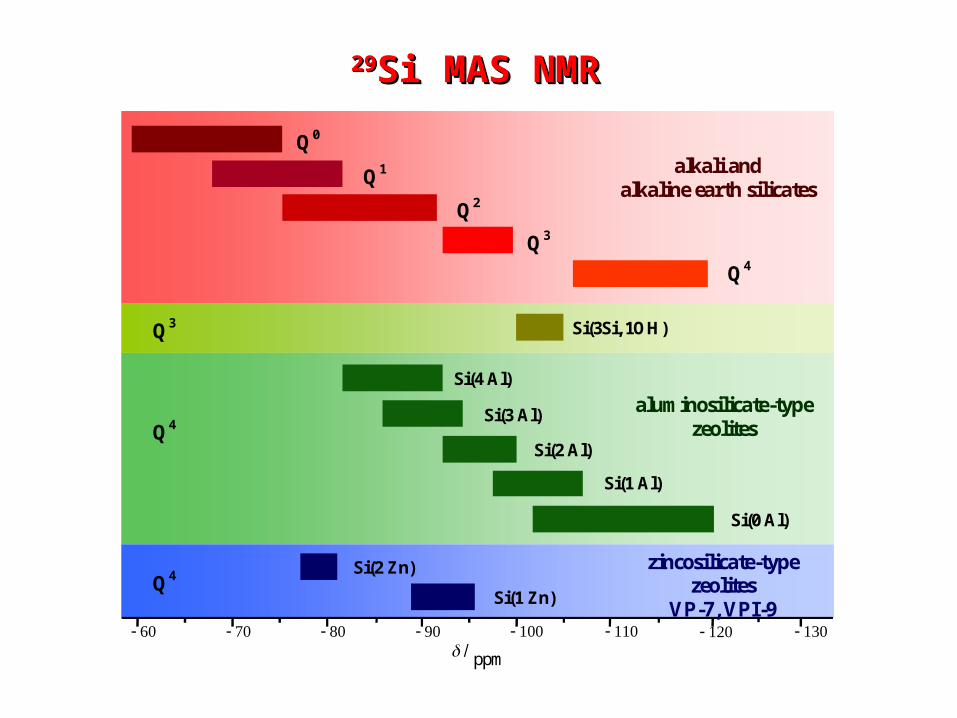
2929Si MAS NMRSi MAS NMR2929Si MAS NMRSi MAS NMR
ppm
Si(1 Zn)
Si(2 Zn) zincosilicate-type zeolites
VP-7, VPI-9 Q4
alkali and alkaline earth silicates
Q0
Q2
Q1
Q4
Si(1 Al)
Si(0 Al)
Si(2 Al)
Si(3 Al)
Si(4 Al)
Si(3Si, 1OH)
aluminosilicate-type zeolites
Q3
Q4
Q3

2727Al 3QMAS NMR study of AlPOAl 3QMAS NMR study of AlPO44-14 -14 2727Al 3QMAS NMR study of AlPOAl 3QMAS NMR study of AlPO44-14 -14
40 30 20 10 0
40
30
20
10
0
1/ ppm
2/ ppm
position 1
position 2
position 3
position 5
AlPO4-14, 27Al 3QMAS spectrum (split-t1-whole-echo, DFS pulse) measured at 17.6 T with a rotation frequency of 30 kHz.
The parameters CS, iso = 1.3 ppm, Cqcc = 2.57 MHz, = 0.7 for aluminum nuclei at position 1, CS, iso = 42.9 ppm, Cqcc = 1.74 MHz, = 0.63, for aluminum nuclei at position 2, CS, iso = 43.5 ppm, Cqcc = 4.08 MHz, = 0.82, for aluminum nuclei at position 3, CS, iso = 27.1 ppm, Cqcc = 5.58 MHz, = 0.97, for aluminum nuclei at position 5, CS, iso = 1.3 ppm, Cqcc = 2.57 MHz, = 0.7 were taken from Fernandez et al.
2277Al MAS NMR spectra Al MAS NMR spectra of a hydrothermally treated zeolite ZSM-5of a hydrothermally treated zeolite ZSM-5
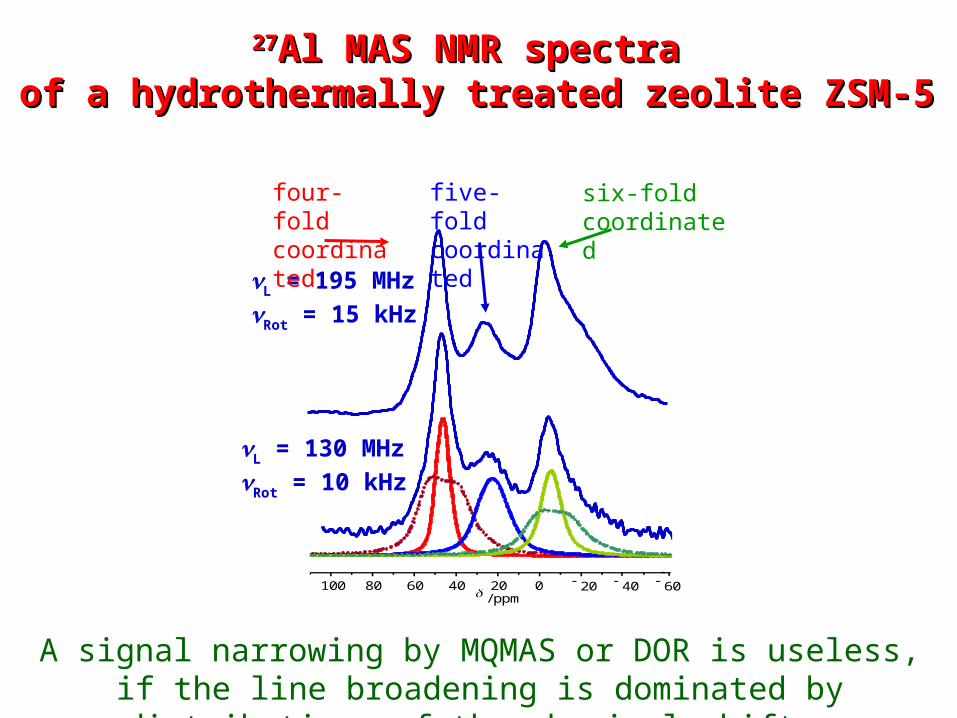
2277Al MAS NMR spectra Al MAS NMR spectra of a hydrothermally treated zeolite ZSM-5of a hydrothermally treated zeolite ZSM-5
L = 195 MHz
Rot = 15 kHz
/ ppm
60 40 20 0 20 40 60 80 100
L = 130 MHz
Rot = 10 kHz
four-fold coordinated
five-fold coordinated
six-fold coordinated
A signal narrowing by MQMAS or DOR is useless, if the line broadening is dominated by distributions of the chemical shifts.
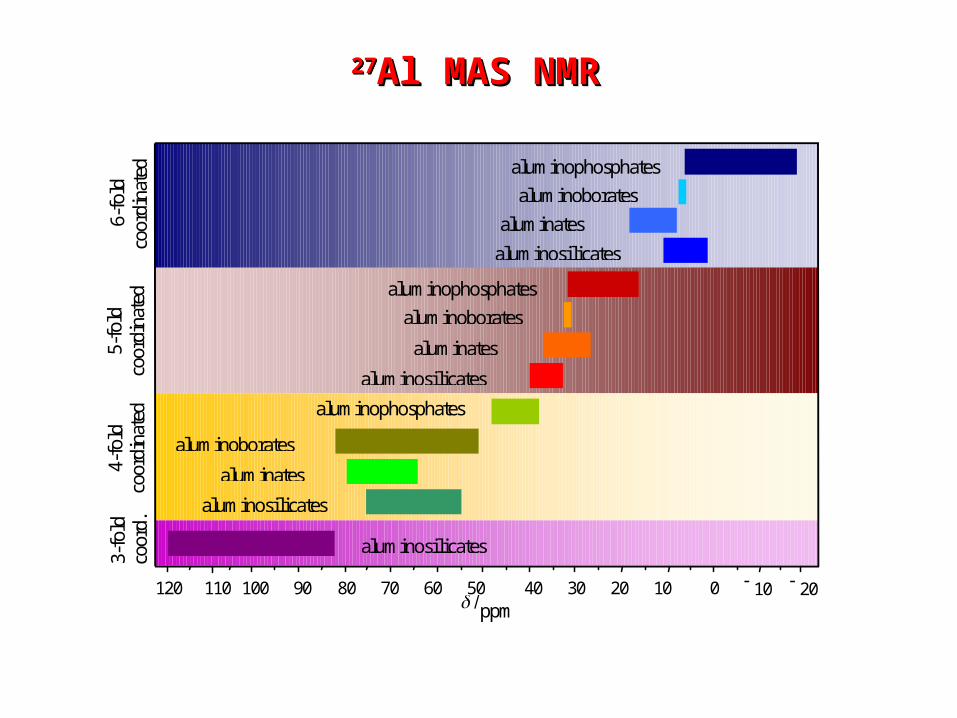
2727Al MAS NMRAl MAS NMR2727Al MAS NMRAl MAS NMR
0 10 20 30 40 50 60 70 80 90 100 10 110 120 ppm
aluminates
aluminosilicates
aluminoborates
aluminophosphates
aluminates
aluminosilicates
aluminoborates
aluminophosphates
aluminates
aluminosilicates
aluminoborates
aluminophosphates
aluminosilicates
3-fo
ld
coor
d.
4-fo
ld
coor
dina
ted
5-fo
ld
coor
dina
ted
6-fo
ld
coor
dina
ted
20
Mobility of the Brønsted sites Mobility of the Brønsted sites and hydrogen exchange in zeolitesand hydrogen exchange in zeolites
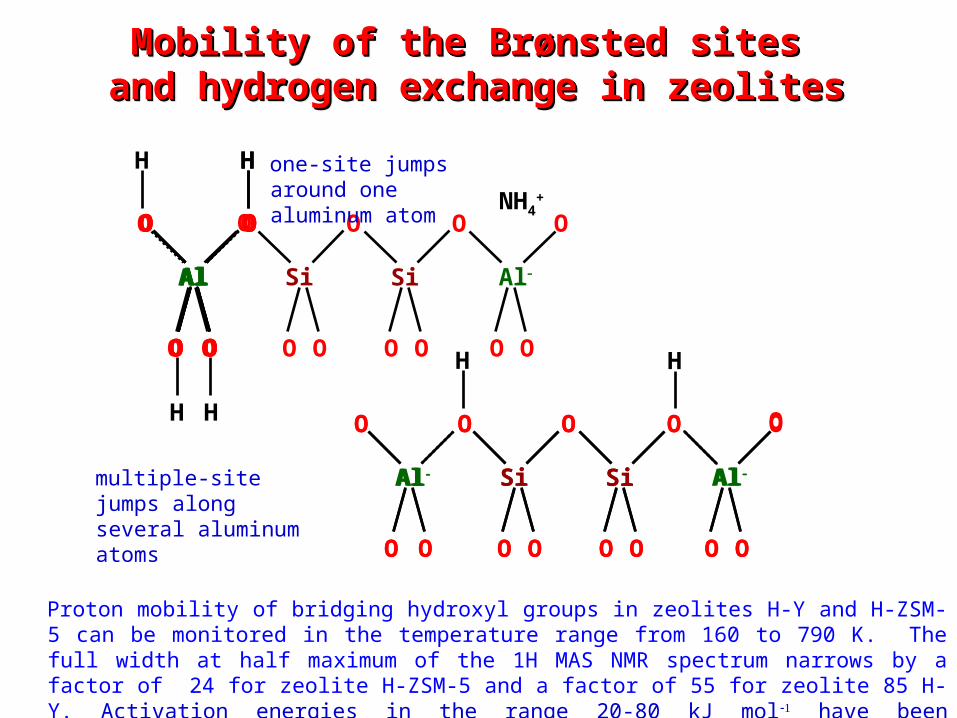
Mobility of the Brønsted sites Mobility of the Brønsted sites and hydrogen exchange in zeolitesand hydrogen exchange in zeolites
O O O OO
OOO OO OO
Al SiSi Al
H
O
NH4+
OO
OO
Al
H
OO
OO
Al
H
OO
OO
Al
H
OO
OO
Al
H O O O OO
OOO OO OO
Al SiSi Al
H
O
Proton mobility of bridging hydroxyl groups in zeolites H-Y and H-ZSM-5 can be monitored in the temperature range from 160 to 790 K. The full width at half maximum of the 1H MAS NMR spectrum narrows by a factor of 24 for zeolite H-ZSM-5 and a factor of 55 for zeolite 85 H-Y. Activation energies in the range 20-80 kJ mol have been determined.
one-site jumps around one aluminum atom
O O O OO
OOO OO OO
Al SiSi Al
H
O
multiple-site jumps along several aluminum atoms

Narrowing onset and correlation timeNarrowing onset and correlation timeNarrowing onset and correlation timeNarrowing onset and correlation time
2,5 3,0 3,5 4,0 4,5 5,0 5,5 6,0
1
10
1000 T 1/ K 1
20
1,5 0,1
1
10
2,0 2,5 3,0 3,5 4,0 4,5 5,0 5,5 1000 T 1/ K 1
fwh
m o
f th
e s
ide
ba
nd
en
velo
pe
/ kH
z
40 °C
120°C
3,2 kHz
17 kHz
The correlation time corresponds to the mean residence time of an ammonium ion at an oxygen ring of the framework.
2H NMR, H-Y: at50 °Cc=5 µs 1H NMR, H-Y: at 40 °C c=20 µs 2H NMR, H-ZSM-5: at 120 °C c=3,8 µs
= rigid/2
rigidc 1
1
= rigid/2
2H MAS NMR, deuterated zeolite H-ZSM-5, loaded with 0.33 NH3 per crossing
1H MAS NMR, zeolite H-Y, loaded with mit 0.6 NH3 per cavity
The correlation time corresponds to the mean residence time of an ammonium ion at an oxygen ring of the framework.
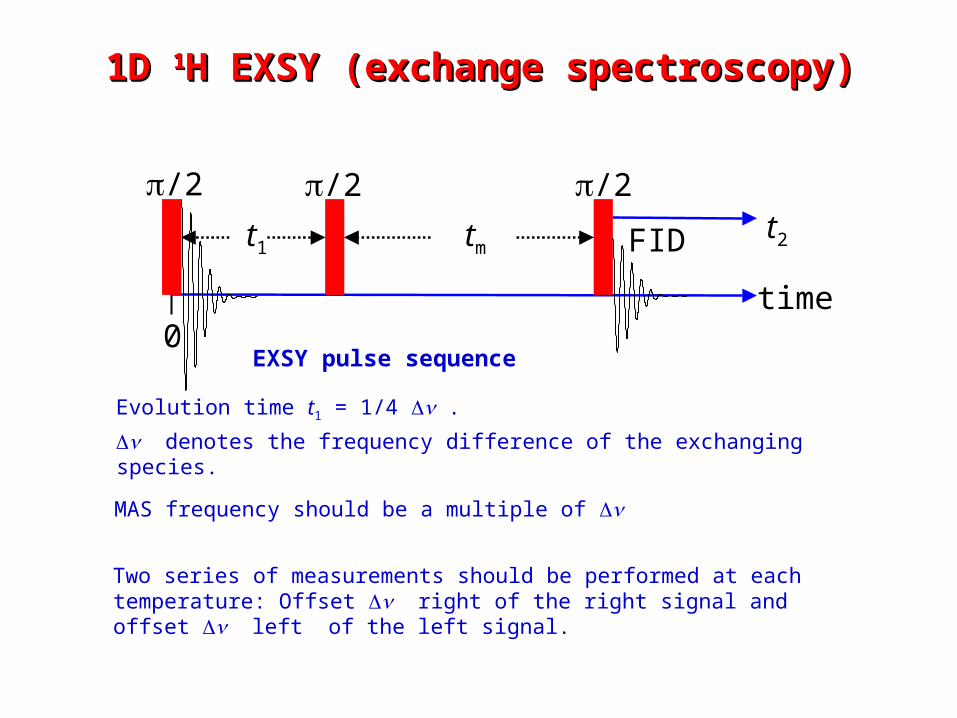
1D 1D 11H EXSY (exchange spectroscopy)H EXSY (exchange spectroscopy)1D 1D 11H EXSY (exchange spectroscopy)H EXSY (exchange spectroscopy)
Evolution time t1 = 1/4 .
denotes the frequency difference of the exchanging species.
MAS frequency should be a multiple of
Two series of measurements should be performed at each temperature: Offset right of the right signal and offset left of the left signal.
0
tm
time
/2
FID t1
/2 /2t2
EXSY pulse sequence

Result of the EXSY experimentResult of the EXSY experimentResult of the EXSY experimentResult of the EXSY experiment
Stack plot of the spectra of zeolite H-Y loaded with 0.35 ammonia molecules per cavity. Mixing times are between tm = 3 s and15 s.
0 2 4 6 8 10 12
ammonium ions
OH
Intensity
0 2 4 6 8 10 12
mixing time tm / s
/ ppm 10 0
97 °C
Intensities of the signals of ammonium ions and OH groups for zeolite H-Y loaded with 1.5 ammonia molecules per cavity. Measured at 87 °C in the field of 9,4 T. The figure on the top and bottom correspond to offset on the left hand side and right hand side of the signals, respectively.
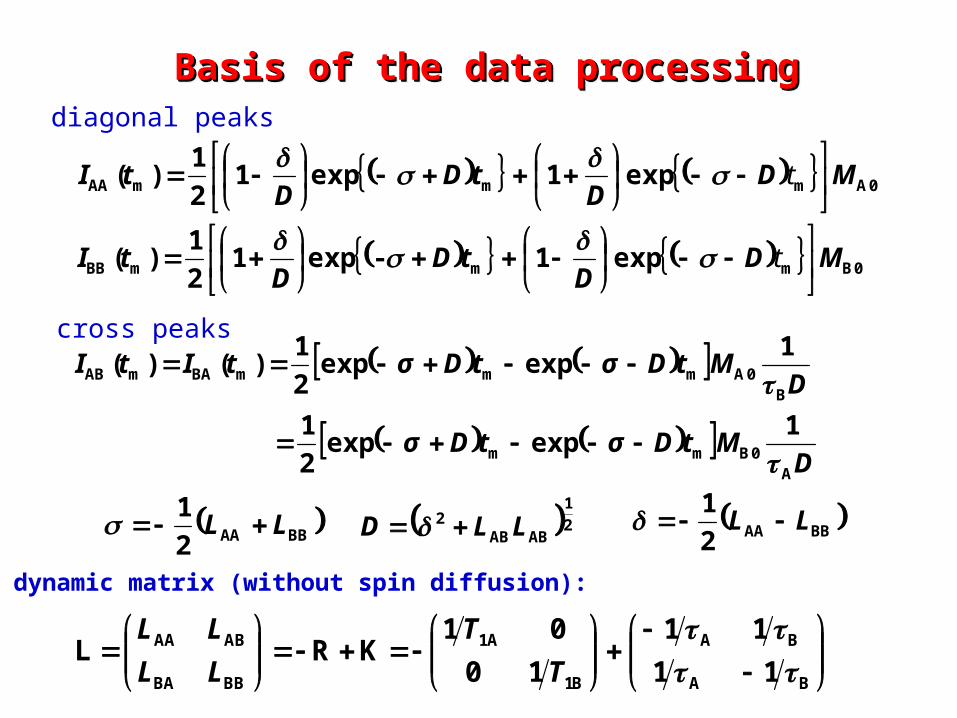
Basis of the data processingBasis of the data processingBasis of the data processingBasis of the data processing
0AmmmAA exp1exp12
1)( MD
DtD
DtI
t
0BmmmBB exp1-exp12
1)( MD
DtD
DtI
t
D
MtDσtDσ
DMtDσtDσtItI
A0Bmm
B0AmmmBAmAB
1expexp
2
1
1expexp
2
1)()(
BBAA2
1LL 2
1
ABAB2 LLD BBAA2
1LL
diagonal peaks
cross peaks
BA
BA
B1
A1
BBBA
ABAA
11
11
10
01KRL
T
T
LL
LL
dynamic matrix (without spin diffusion):
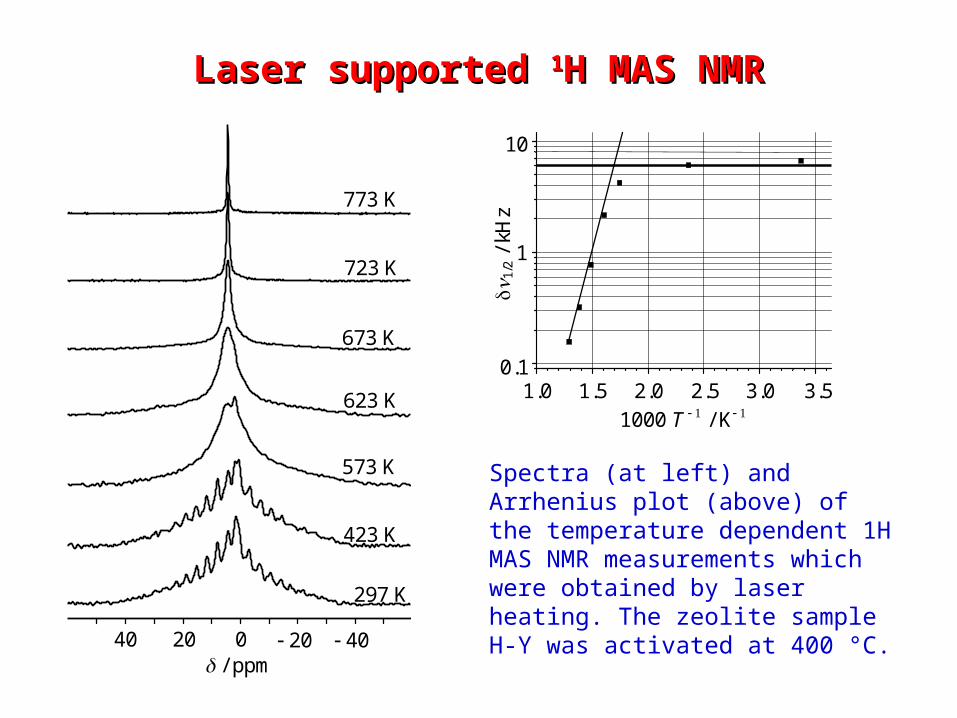
Laser supported Laser supported 11H MAS NMRH MAS NMR
Spectra (at left) and Arrhenius plot (above) of the temperature dependent 1H MAS NMR measurements which were obtained by laser heating. The zeolite sample H-Y was activated at 400 °C.
20 0 20 40 40 / ppm
297 K
723 K
773 K
673 K
423 K
573 K
623 K
1.0 1.5 2.0 2.5 3.0 3.5 0.1
1
10
1000 T / K
1/
2 /
kHz
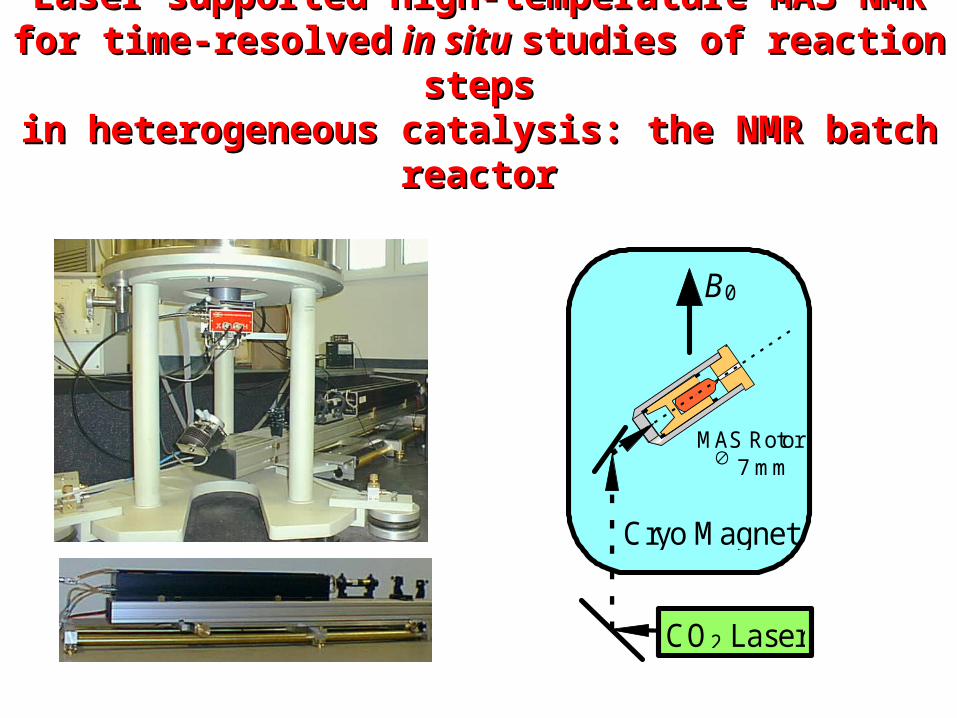
Laser supported high-temperature MAS NMRLaser supported high-temperature MAS NMRfor time-resolvedfor time-resolved in situ in situ studies of reaction stepsstudies of reaction steps
in heterogeneous catalysis: the NMR batch reactorin heterogeneous catalysis: the NMR batch reactor
MAS Rotor 7 mm
CO2 Laser
Cryo Magnet
B0
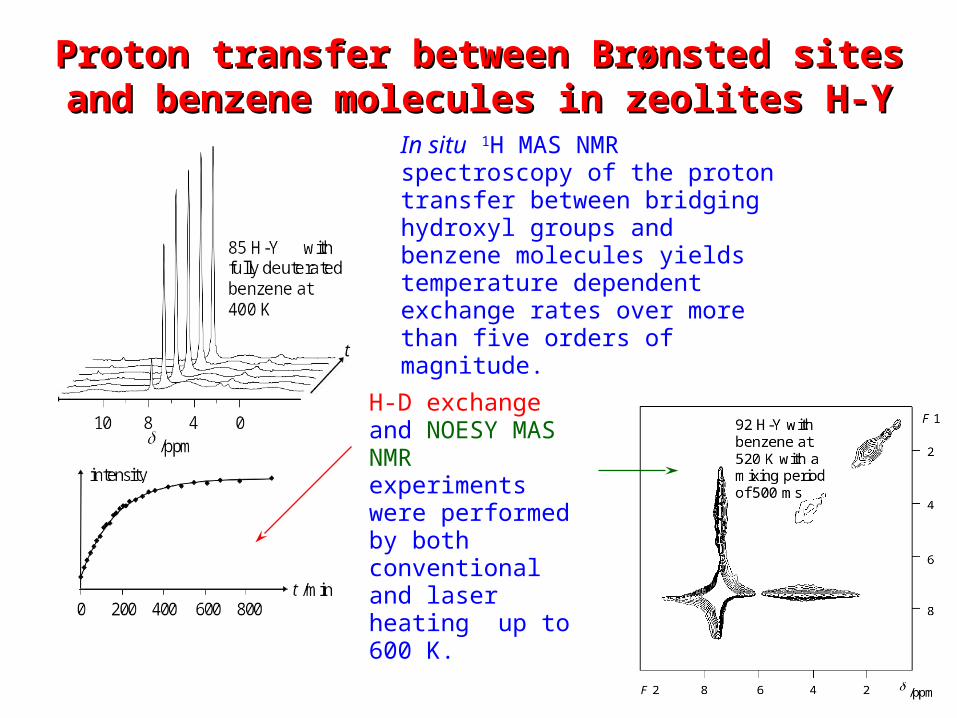
Proton transfer between Brønsted sites and Proton transfer between Brønsted sites and benzene molecules in zeolites H-Ybenzene molecules in zeolites H-Y
In situ 1H MAS NMR spectroscopy of the proton transfer between bridging hydroxyl groups and benzene molecules yields temperature dependent exchange rates over more than five orders of magnitude.
H-D exchange and NOESY MAS NMR experiments were performed by both conventional and laser heating up to 600 K.
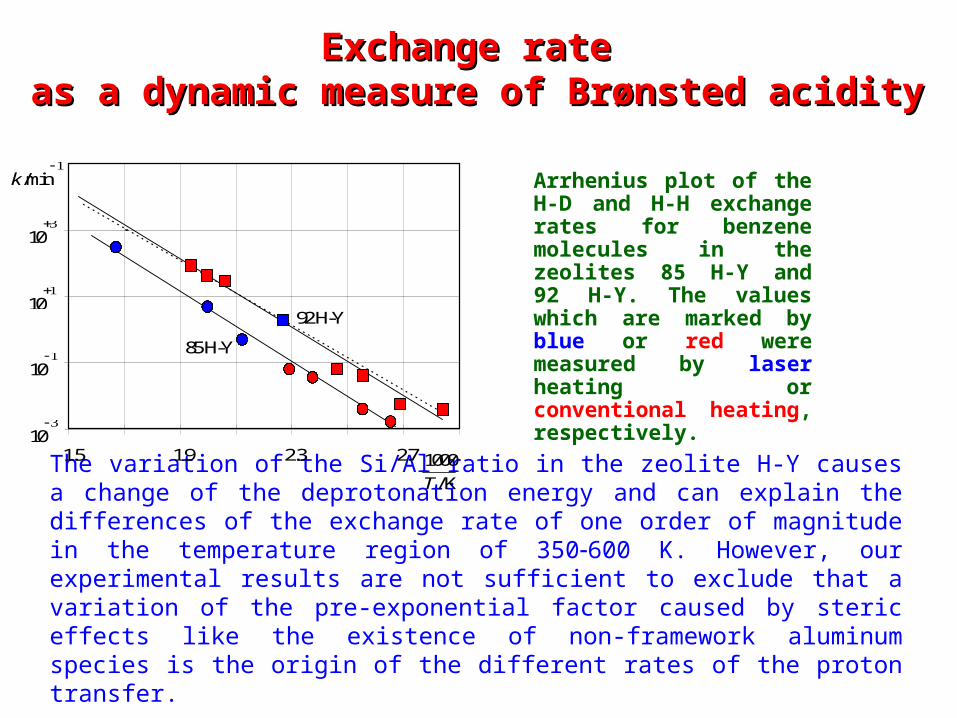
Exchange rate Exchange rate as a dynamic measure of Brønsted acidityas a dynamic measure of Brønsted acidity
Arrhenius plot of the H-D and H-H exchange rates for benzene molecules in the zeolites 85 H-Y and 92 H-Y. The values which are marked by blue or red were measured by laser heating or conventional heating, respectively.
The variation of the Si/Al ratio in the zeolite H-Y causes a change of the deprotonation energy and can explain the differences of the exchange rate of one order of magnitude in the temperature region of 350600 K. However, our experimental results are not sufficient to exclude that a variation of the pre-exponential factor caused by steric effects like the existence of non-framework aluminum species is the origin of the different rates of the proton transfer.
10
10
10
10
1.5 2.71.9 2.3
92 H-Y
85 H-Y
1000
T/K
k /min
I acknowledge support from
Horst ErnstClemens Gottert
Johanna KanellopoulosBernd Knorr
Lutz MoschkowitzDagmar Prager
Denis Schneider
Deutsche ForschungsgemeinschaftMax-Buchner-Stiftung