13+ scholarship examination
TRANSCRIPT
ST EDWARD’S
OXFORD
13+ SCHOLARSHIP EXAMINATION
2018
BIOLOGY: 20 Minutes
Candidate Name
First name……………………………………………………..
Surname…………………………………………………….....
INSTRUCTIONS TO CANDIDATES
Write your name in the box above. Answer all questions. Write your answers in the spaces provided on the question paper. INFORMATION FOR CANDIDATES The number of marks available is given in brackets ( ) at the end of each question or part question. A calculator may be used.
Q1.
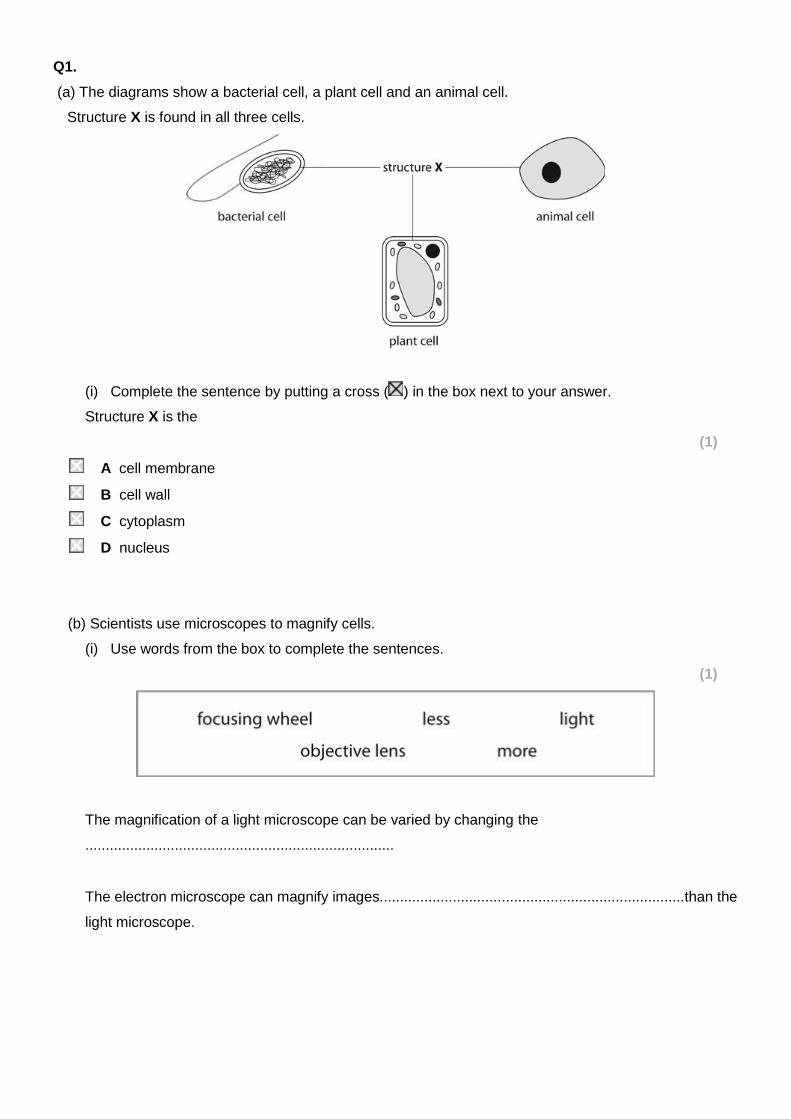
(a) The diagrams show a bacterial cell, a plant cell and an animal cell.
Structure X is found in all three cells.
(i) Complete the sentence by putting a cross ( ) in the box next to your answer.
Structure X is the
(1)
A cell membrane
B cell wall
C cytoplasm
D nucleus
(b) Scientists use microscopes to magnify cells.
(i) Use words from the box to complete the sentences.
(1)
The magnification of a light microscope can be varied by changing the
............................................................................
The electron microscope can magnify images...........................................................................than the
light microscope.
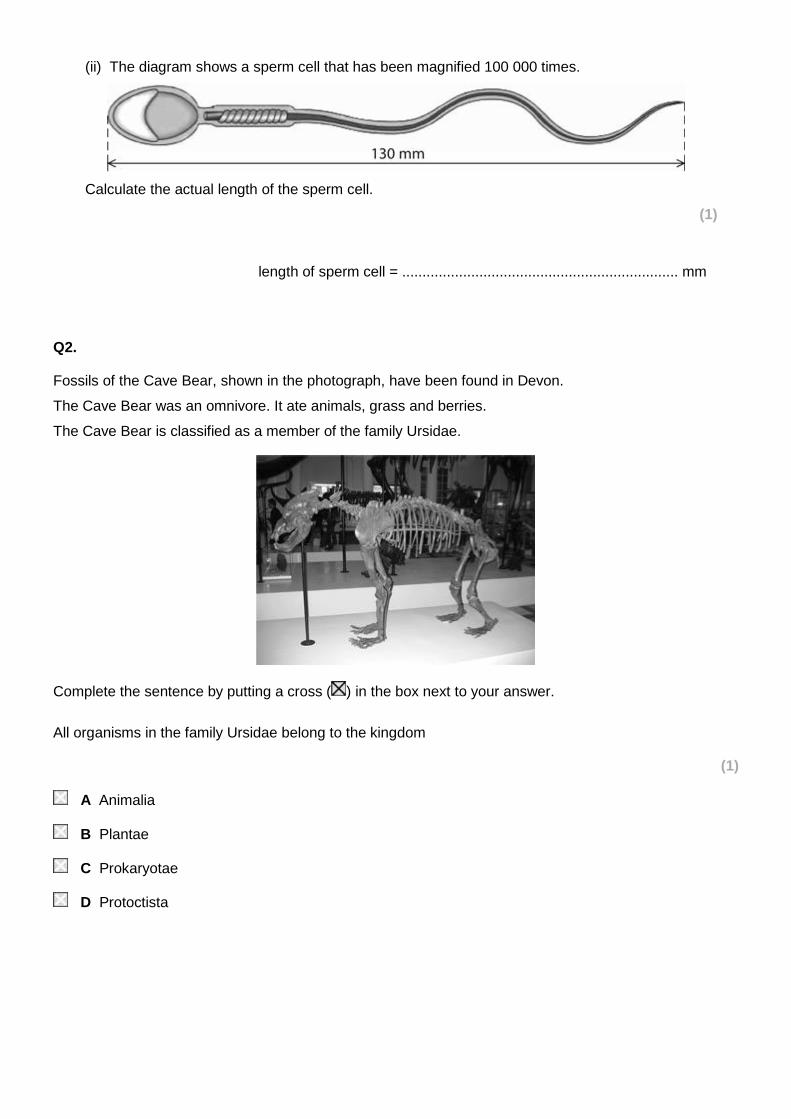
(ii) The diagram shows a sperm cell that has been magnified 100 000 times.
Calculate the actual length of the sperm cell.
(1)
length of sperm cell = .................................................................... mm
Q2.
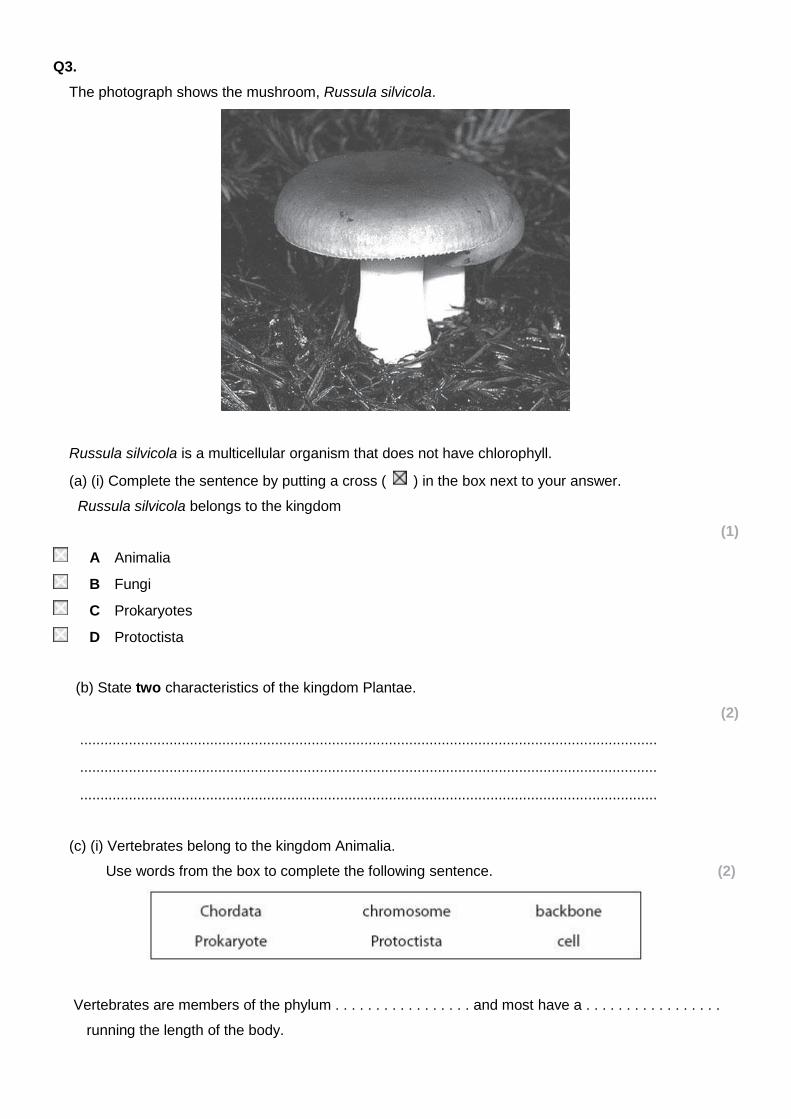
Fossils of the Cave Bear, shown in the photograph, have been found in Devon.
The Cave Bear was an omnivore. It ate animals, grass and berries.
The Cave Bear is classified as a member of the family Ursidae.
Complete the sentence by putting a cross ( ) in the box next to your answer.
All organisms in the family Ursidae belong to the kingdom
(1)
A Animalia
B Plantae
C Prokaryotae
D Protoctista
Q3.
The photograph shows the mushroom, Russula silvicola.
Russula silvicola is a multicellular organism that does not have chlorophyll.
(a) (i) Complete the sentence by putting a cross ( ) in the box next to your answer.
Russula silvicola belongs to the kingdom
(1)
A Animalia
B Fungi
C Prokaryotes
D Protoctista
(b) State two characteristics of the kingdom Plantae.
(2)
..............................................................................................................................................
..............................................................................................................................................
..............................................................................................................................................
(c) (i) Vertebrates belong to the kingdom Animalia.
Use words from the box to complete the following sentence. (2)
Vertebrates are members of the phylum . . . . . . . . . . . . . . . . . and most have a . . . . . . . . . . . . . . . . .
running the length of the body.
(ii) State 2 structures that vertebrate organisms use to absorb oxygen from their surroundings.
(2)
..............................................................................................................................................
..............................................................................................................................................
..............................................................................................................................................
Q4.
Living cells need a constant supply of oxygen and nutrients. Describe how oxygen is transported around
the body by the blood.
(2)
.............................................................................................................................................
.............................................................................................................................................
.............................................................................................................................................
.............................................................................................................................................
.............................................................................................................................................
Q5.
Pectinase is an enzyme that is used to extract juice from apples. In an investigation, 1 cm3 of pectinase
was added to 1 kg of chopped apples. After 20 minutes, the volume of juice produced was measured.
This was repeated using different volumes of pectinase. The table shows the results of this investigation.
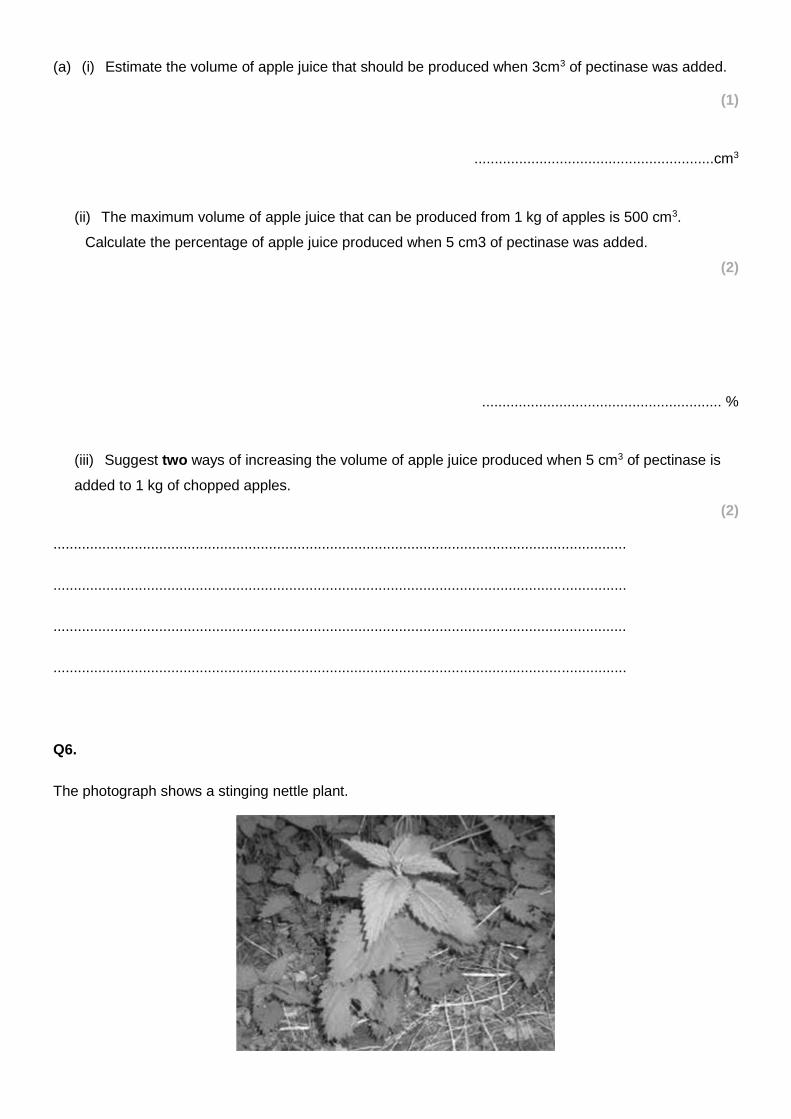
(a) (i) Estimate the volume of apple juice that should be produced when 3cm3 of pectinase was added.
(1)
...........................................................cm3
(ii) The maximum volume of apple juice that can be produced from 1 kg of apples is 500 cm3.
Calculate the percentage of apple juice produced when 5 cm3 of pectinase was added.
(2)
........................................................... %
(iii) Suggest two ways of increasing the volume of apple juice produced when 5 cm3 of pectinase is
added to 1 kg of chopped apples.
(2)
.............................................................................................................................................
.............................................................................................................................................
.............................................................................................................................................
.............................................................................................................................................
Q6.
The photograph shows a stinging nettle plant.
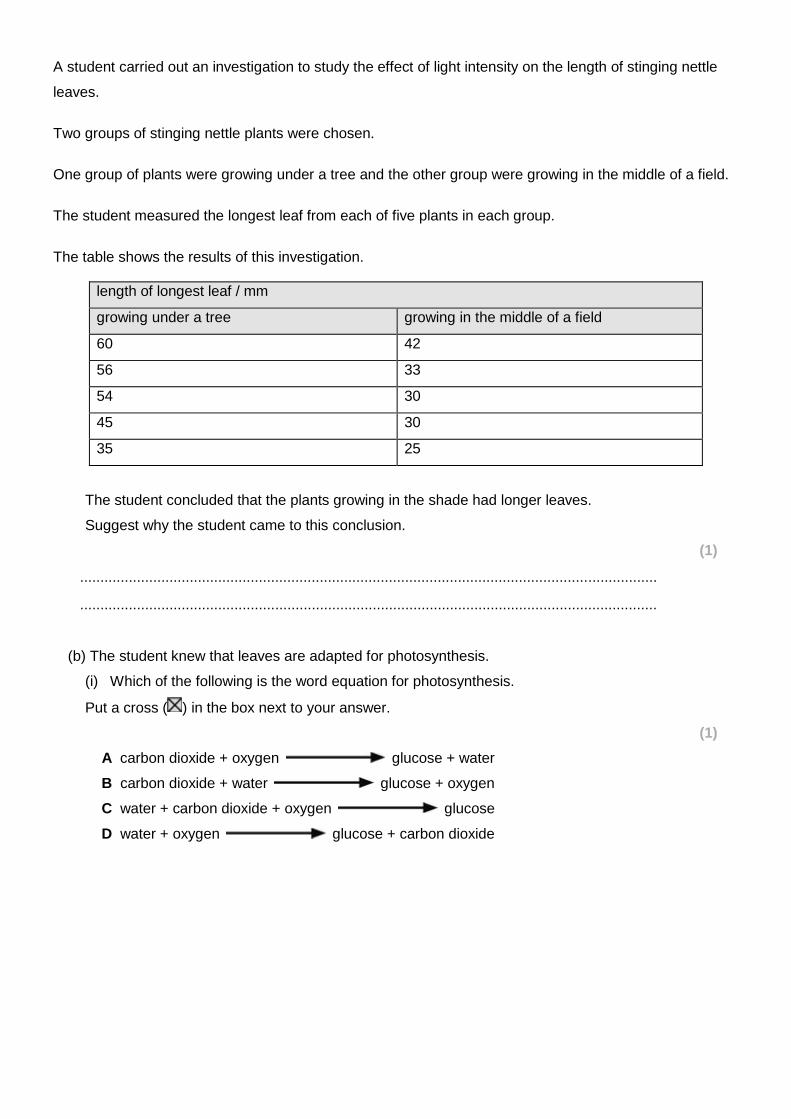
A student carried out an investigation to study the effect of light intensity on the length of stinging nettle
leaves.
Two groups of stinging nettle plants were chosen.
One group of plants were growing under a tree and the other group were growing in the middle of a field.
The student measured the longest leaf from each of five plants in each group.
The table shows the results of this investigation.
length of longest leaf / mm
growing under a tree growing in the middle of a field
60 42
56 33
54 30
45 30
35 25
The student concluded that the plants growing in the shade had longer leaves.
Suggest why the student came to this conclusion.
(1)
..............................................................................................................................................
..............................................................................................................................................
(b) The student knew that leaves are adapted for photosynthesis.
(i) Which of the following is the word equation for photosynthesis.
Put a cross ( ) in the box next to your answer.
(1)
A carbon dioxide + oxygen glucose + water
B carbon dioxide + water glucose + oxygen
C water + carbon dioxide + oxygen glucose
D water + oxygen glucose + carbon dioxide
ST EDWARD’S
OXFORD
13+ SCHOLARSHIP EXAMINATION
2018
CHEMISTRY: 20 Minutes
Candidate Name
First name……………………………………………………..
Surname…………………………………………………….....
INSTRUCTIONS TO CANDIDATES
Write your name in the box above. Answer all questions. Write your answers in the spaces provided on the question paper. INFORMATION FOR CANDIDATES The number of marks available is given in brackets ( ) at the end of each question or part question. A calculator may be used.
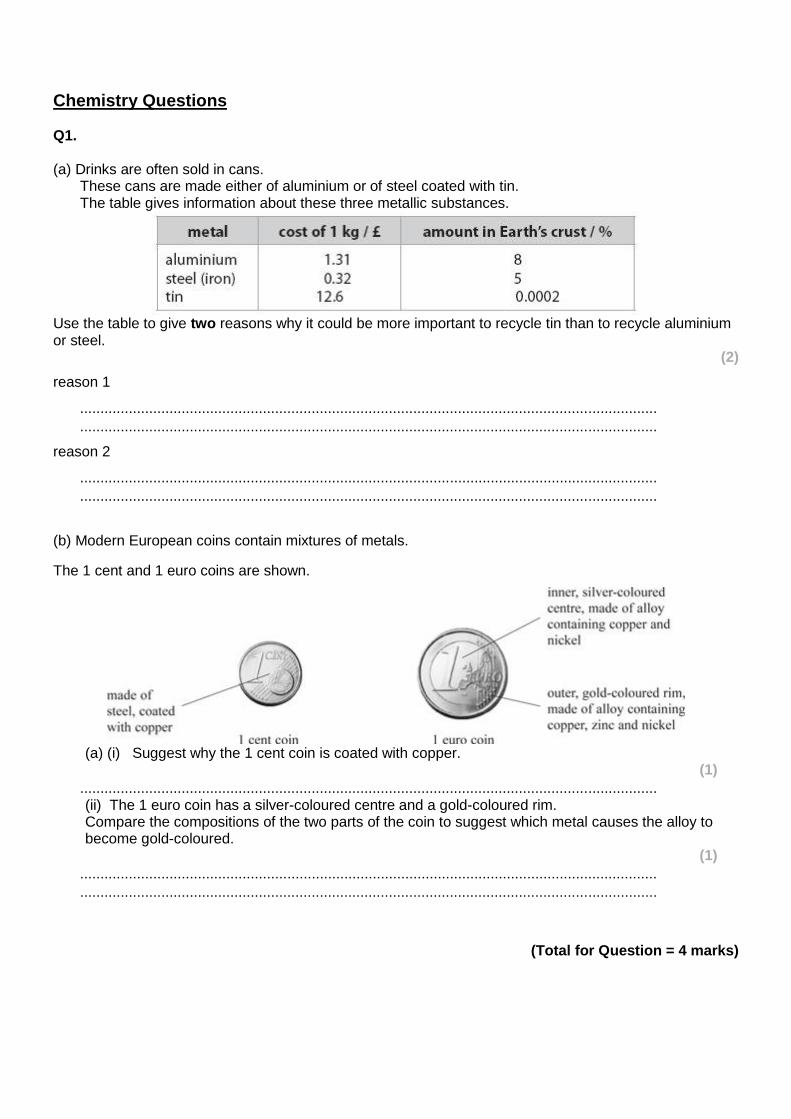
Chemistry Questions Q1. (a) Drinks are often sold in cans. These cans are made either of aluminium or of steel coated with tin. The table gives information about these three metallic substances.
Use the table to give two reasons why it could be more important to recycle tin than to recycle aluminium or steel.
(2)
reason 1
.............................................................................................................................................. ..............................................................................................................................................
reason 2
.............................................................................................................................................. ..............................................................................................................................................
(b) Modern European coins contain mixtures of metals.
The 1 cent and 1 euro coins are shown.
(a) (i) Suggest why the 1 cent coin is coated with copper.
(1)
.............................................................................................................................................. (ii) The 1 euro coin has a silver-coloured centre and a gold-coloured rim. Compare the compositions of the two parts of the coin to suggest which metal causes the alloy to become gold-coloured.
(1)
.............................................................................................................................................. ..............................................................................................................................................
(Total for Question = 4 marks)
(c) In an experiment to find the percentage of oxygen in the air, some copper was heated in 50.0 cm3 of dry air. The word equation for the reaction is
copper + oxygen → copper oxide
All of the oxygen in this sample of air reacted to form copper oxide. After the reaction, the volume of gas remaining was 41cm3. Calculate the percentage of oxygen in this sample of air.
(2)
..............................................................................................................................................
(Total for question = 6 marks)
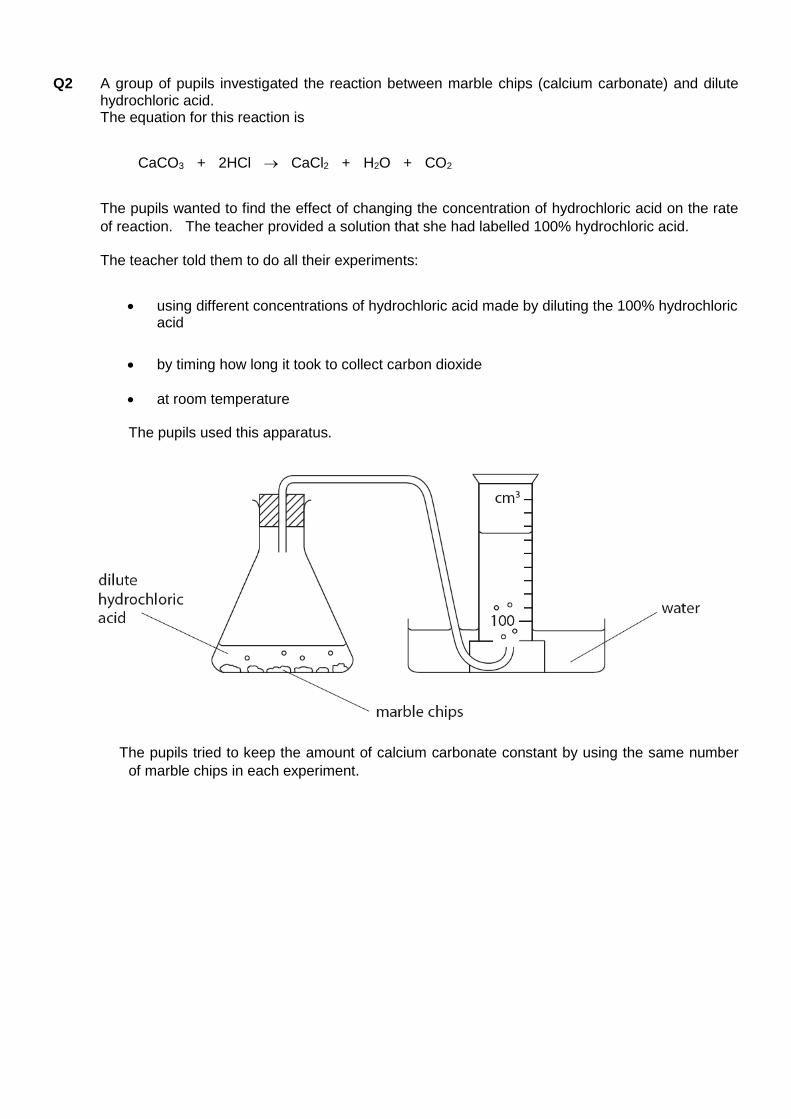
Q2 A group of pupils investigated the reaction between marble chips (calcium carbonate) and dilute
hydrochloric acid. The equation for this reaction is
CaCO3 + 2HCl CaCl2 + H2O + CO2
The pupils wanted to find the effect of changing the concentration of hydrochloric acid on the rate
of reaction. The teacher provided a solution that she had labelled 100% hydrochloric acid.
The teacher told them to do all their experiments:
using different concentrations of hydrochloric acid made by diluting the 100% hydrochloric acid
by timing how long it took to collect carbon dioxide
at room temperature
The pupils used this apparatus.
The pupils tried to keep the amount of calcium carbonate constant by using the same number
of marble chips in each experiment.
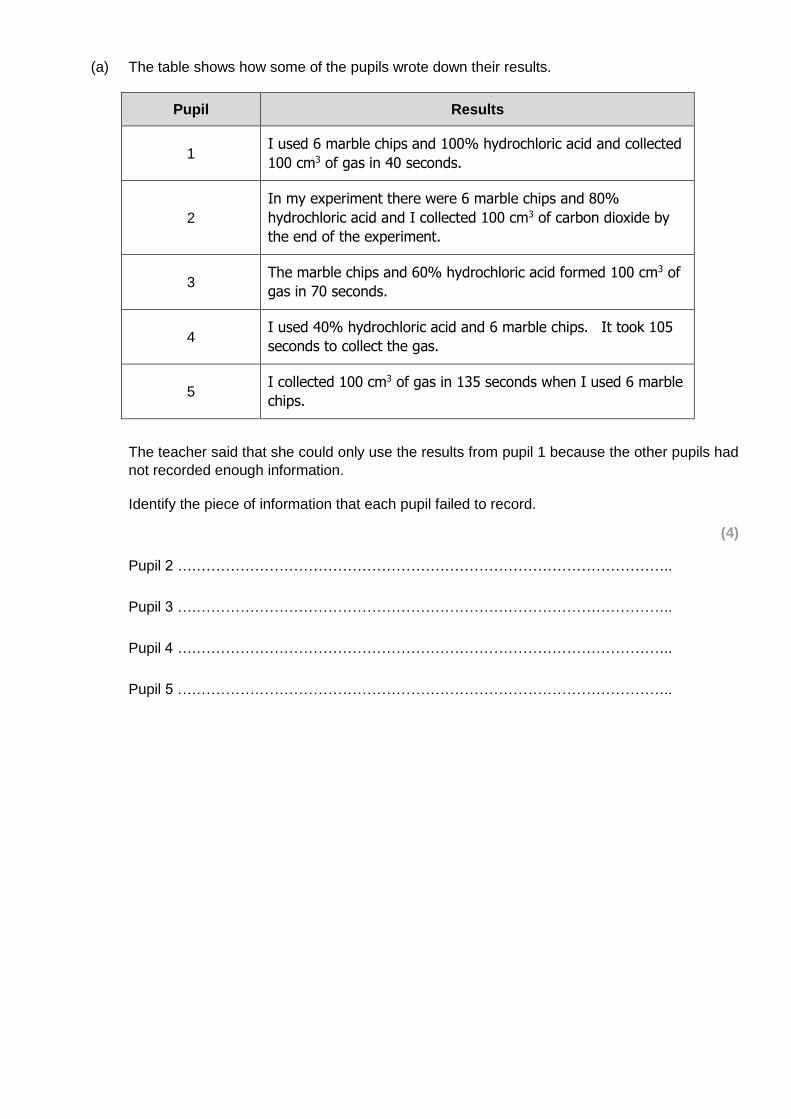
(a) The table shows how some of the pupils wrote down their results.
Pupil Results
1 I used 6 marble chips and 100% hydrochloric acid and collected
100 cm3 of gas in 40 seconds.
2
In my experiment there were 6 marble chips and 80%
hydrochloric acid and I collected 100 cm3 of carbon dioxide by
the end of the experiment.
3 The marble chips and 60% hydrochloric acid formed 100 cm3 of
gas in 70 seconds.
4 I used 40% hydrochloric acid and 6 marble chips. It took 105
seconds to collect the gas.
5 I collected 100 cm3 of gas in 135 seconds when I used 6 marble
chips.
The teacher said that she could only use the results from pupil 1 because the other pupils had
not recorded enough information.
Identify the piece of information that each pupil failed to record.
(4)
Pupil 2 ….……………………………………………………………………………………..
Pupil 3 ….……………………………………………………………………………………..
Pupil 4 ….……………………………………………………………………………………..
Pupil 5 ….……………………………………………………………………………………..
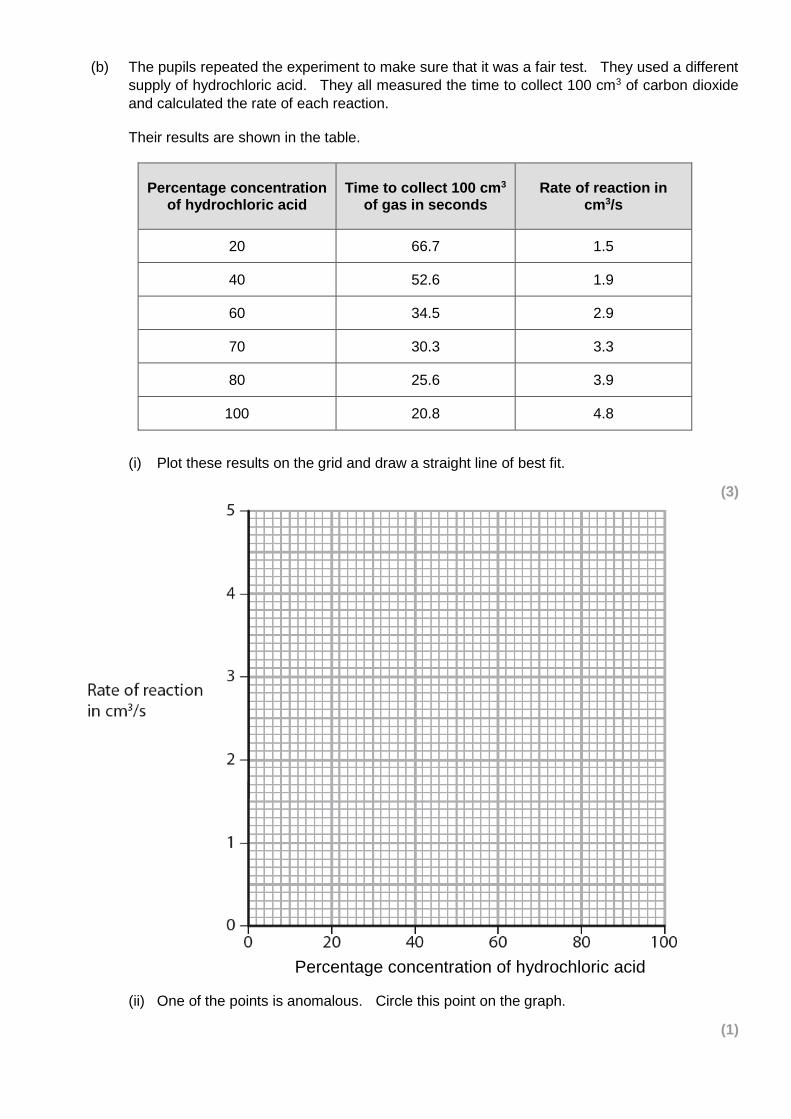
(b) The pupils repeated the experiment to make sure that it was a fair test. They used a different
supply of hydrochloric acid. They all measured the time to collect 100 cm3 of carbon dioxide
and calculated the rate of each reaction.
Their results are shown in the table.
Percentage concentration of hydrochloric acid
Time to collect 100 cm3 of gas in seconds
Rate of reaction in cm3/s
20 66.7 1.5
40 52.6 1.9
60 34.5 2.9
70 30.3 3.3
80 25.6 3.9
100 20.8 4.8
(i) Plot these results on the grid and draw a straight line of best fit.
(3)
Percentage concentration of hydrochloric acid
(ii) One of the points is anomalous. Circle this point on the graph.
(1)
(iii) Suggest two errors in the experiment that could have caused this anomalous result.
(2)
1 …………………………………………………………………………………………………..
……………………………………………………………………………………………………..
2 …………………………………………………………………………………………………..
……………………………………………………………………………………………………..
(iv) Use your graph to estimate the rate of reaction using an acid concentration of 50%.
Show on your graph how you obtained your answer.
(2)
……………………………………………………………………………………………………..
……………………………………………………………………………………………………..
(v) Describe the relationship between rate of reaction and concentration of acid shown by the
graph.
(2)
……………………………………………………………………………………………………..
……………………………………………………………………………………………………..
……………………………………………………………………………………………………..
(Total for Question = 14 marks)
ST EDWARD’S
OXFORD
13+ SCHOLARSHIP EXAMINATION
2018
PHYSICS: 20 Minutes
Candidate Name
First name……………………………………………………..
Surname…………………………………………………….....
INSTRUCTIONS TO CANDIDATES
Write your name in the box above. Answer all questions. Write your answers in the spaces provided on the question paper. INFORMATION FOR CANDIDATES The number of marks available is given in brackets ( ) at the end of each question or part question. A calculator may be used.
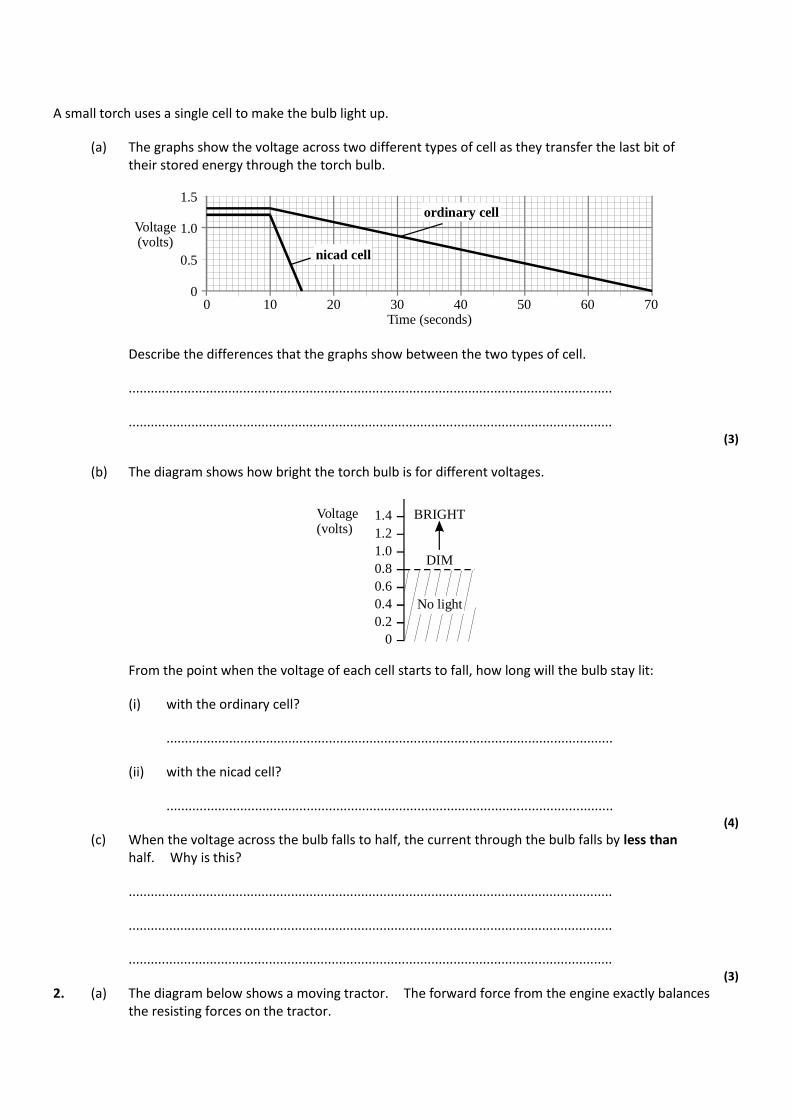
A small torch uses a single cell to make the bulb light up.
(a) The graphs show the voltage across two different types of cell as they transfer the last bit of their stored energy through the torch bulb.
0 10 20 30 40 50 60 70Time (seconds)
1.5
1.0
0.5
0
Voltage(volts)
ordinary cell
nicad cell
Describe the differences that the graphs show between the two types of cell.
...................................................................................................................................
................................................................................................................................... (3)
(b) The diagram shows how bright the torch bulb is for different voltages.
1.4
1.2
1.0
0.8
0.6
0.4
0.2
0
BRIGHT
DIM
Voltage(volts)
No light
From the point when the voltage of each cell starts to fall, how long will the bulb stay lit:
(i) with the ordinary cell?
.........................................................................................................................
(ii) with the nicad cell?
......................................................................................................................... (4)
(c) When the voltage across the bulb falls to half, the current through the bulb falls by less than half. Why is this?
...................................................................................................................................
...................................................................................................................................
................................................................................................................................... (3)
2. (a) The diagram below shows a moving tractor. The forward force from the engine exactly balances the resisting forces on the tractor.
(i) Describe the motion of the tractor.
.........................................................................................................................
(ii) The tractor comes to a drier part of the field where the resisting forces are less. If the forward force from the engine is unchanged how, if at all, will the motion of the tractor be affected?
.........................................................................................................................
......................................................................................................................... (3)
(b) Two pupils are given the task of finding out how fast a tractor moves across a field. As the tractor starts a straight run across the field the pupils time how long it takes to pass a series of posts which are forty metres apart. The results obtained are shown in the table below.
Distance travelled (m)
Time taken (s)
0
0
40
8
80
16
120
24
160
32
200
40
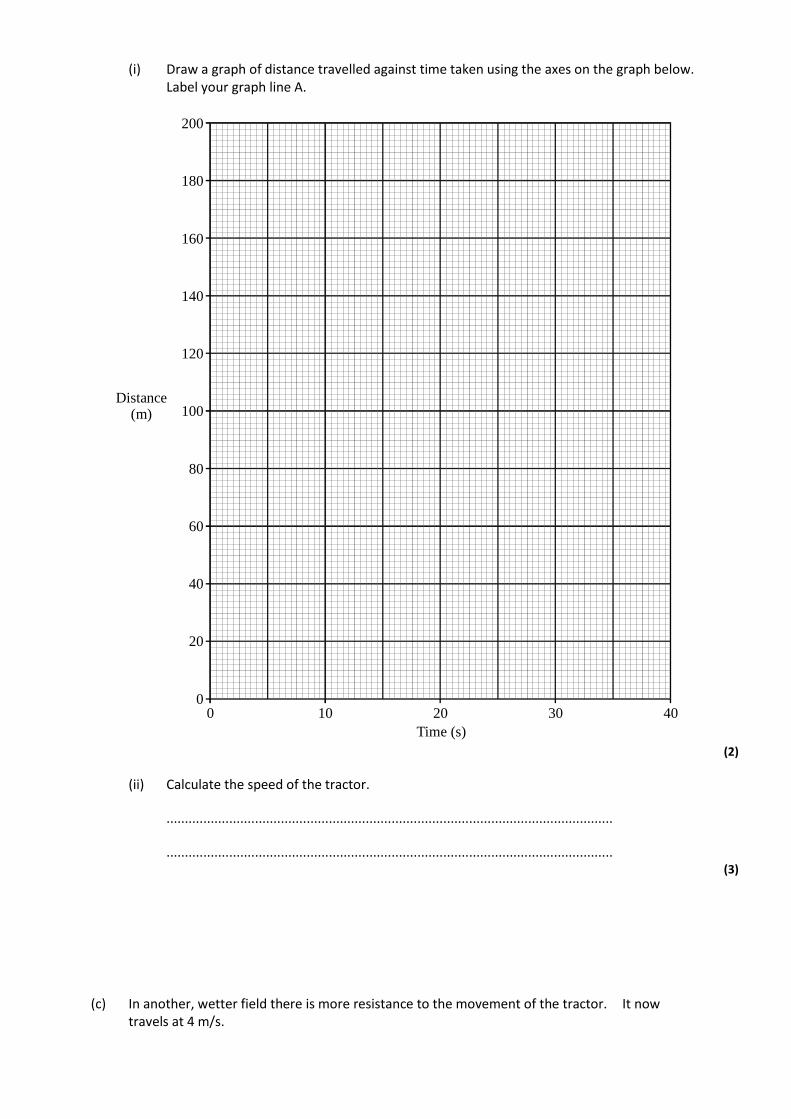
(i) Draw a graph of distance travelled against time taken using the axes on the graph below.
Label your graph line A.
Distance(m)
200
180
160
140
120
100
80
60
40
20
00 10 20 30 40
Time (s) (2)
(ii) Calculate the speed of the tractor.
.........................................................................................................................
......................................................................................................................... (3)
(c) In another, wetter field there is more resistance to the movement of the tractor. It now travels at 4 m/s.
(i) Calculate the time needed to travel 200m.
.........................................................................................................................
.........................................................................................................................
.........................................................................................................................
(ii) On the graph in part (b) draw a line to represent the motion of the tractor across the second field. Label this line B.
(2)
(Total 20 marks)