116664120 swing trading
TRANSCRIPT

7/27/2019 116664120 Swing Trading
http://slidepdf.com/reader/full/116664120-swing-trading 1/14
How To Swing Trade For Profit:
Hedge Fund Manager Secrets To
Capitalize On Market Swings
by
MarketGauge.com

7/27/2019 116664120 Swing Trading
http://slidepdf.com/reader/full/116664120-swing-trading 2/14
MarketGauge.com 2
Getting Started
MarketGauge has been helping professional trading institutions and individual activetraders trade more efficiently and profitably since 1997. We hope this report improvesyour profitability immediately.
The objective of this report and the information that follows it is to accelerate the time ittakes you to reach the level of swing trading expertise to achieve financial freedom andpractice worry free trading.
What Is Swing Trading?
Swing trading is style of trading that profits from the movement of prices over a couple
of days to a few months. The time frame for holding a swing trade is shorter than a buyand hold investor, and longer than a day trader who doesn’t want to hold a position over night.
Markets are constantly moving both up and down, even when they are trending. Swingtraders catch the burst of price movements that occur within larger trends or wider priceranges. A typical swing trader likes to take profits after a market has made a move andbefore it reverses. A typical swing trade may last a couple days to several weeks.
One of the most attractive characteristics of swing trading is that it can be very profitablein bull markets, bear markets and even in trendless, range bound markets!
Overcome Four Common Challenges To Profiting In The Markets
Whether you’re looking for trading to provide you with your sole source of income, asecondary income stream, or a way to build your retirement nest egg - you’ll face avariety of challenges and obstacles.
Some obstacles you can control, others you can’t influence at all, but all obstacles canbe overcome!
The best way to overcome trading challenges is to recognize them upfront and have a
plan to conquer them.
Below are four common trading challenges that many traders face.
1. You can no longer rely on a buy and hold approach to stocks.The last ten years has seen extreme volatility, but the net result of an investmentin the S&P 500 10 years ago is near 0%. Likewise, 2011 experienced incrediblevolatility but closed the year virtually where it began leaving investors

7/27/2019 116664120 Swing Trading
http://slidepdf.com/reader/full/116664120-swing-trading 3/14
MarketGauge.com 3
unrewarded for the year’s risk. 2012 began with the best first quarter in years,only to give back all the gains by June.
2. Big losses can ruin your savings.It only takes a few big losses to set you back years in your savings, and if youare not careful, they can wipe out an account. There is no reason for big losses if
you trade with professional entry and exit rules.
3. A small account size can limit your trading options, BUT this does notprevent you from making money by trading or building your account size up tothe size you desire. You can swing trade with as little as a few thousand dollars.
Please don’t expect to turn a few thousand dollars into a million dollar account ina short amount of time, but don’t assume you can’t make money either. The bestapproach to success in trading is to have the mindset that you will grow richslowly and with consistent returns – no huge losses, and no outrageously riskytrades that attempt to make a killing over night.
4. You don’t need to commit to becoming a full-time trader.You can earn extra income or build your savings and assets as a part-time swingtrader. And “part-time” can mean focusing on the markets only during a certain of time of the day (i.e. the morning), or only trading on days when you’re available.
As a part-time trader you can trade short multi-day trends, or longer multi-weektrends that require only a few minutes a day to manage your positions.
We’ve prepared this report to put you on the path toward overcoming all of thesecommon trading challenges and lead you to the goal of financial freedom andworry free trading.

7/27/2019 116664120 Swing Trading
http://slidepdf.com/reader/full/116664120-swing-trading 4/14
MarketGauge.com 4
Rule #1: Trade the Current Market Phase
“Trade with the Wind at Your Back” This rule is how you overcome the “buy and hold” obstacle. Understandingmarket phases enables you to take advantage of trends that are in your favor, andavoid the risk of holding positions when the trend is against you.
We trade when the opportunities are right, and stay away from the market when the riskis high.
Stocks and markets obviously don’t go straight up or straight down continuously. Theycycle up and down in what we call “Market Phases.” This rule keeps the wind at your
back by trading with the primary trend in the market.
The most obvious application of this concept is that traders want to be long during theup phases, short during the down phases, and out of the market during choppy periods.When a strong up or down phase can be reliably identified you have a real edge in themarket. For most traders, however, it’s not easy to reliably know when a market is in astrong trending phase.
And if you have tried to systematically define which phase a market is in, you probablyfound that there are more than two phases - up and down. Let us help.
Rule #1 is to trade in the direction of the market phase.
This gives you an edge. As you become a more sophisticated trader, you will developspecific trading strategies that do best in specific market phases.
In developing our trading strategies, we’ve done a lot of research and back testing tofigure out a simple and effective method of knowing whether the market is in an upphase, down phase, or a transitional phase.
Start Simple - Assume There Are Only 3 Market Phases
Below is a daily chart of the S&P 500 (as represented by the “SPY” ETF). The timeperiod of this chart was specifically chosen because the trends shift many times makingit a challenging period.
The daily bars are colored so that the days of the Bullish Market Phase are green andBearish Market Phase days are red. White daily bars are transitional market conditionswhere your market bias would be neutral. The transitional period will be explained later.

7/27/2019 116664120 Swing Trading
http://slidepdf.com/reader/full/116664120-swing-trading 5/14
MarketGauge.com 5
Daily Chart The “SPY” ETF with 3 Phases:
The Benefits of Phases Are HUGE, Yet Many Traders Ignore This!
Trading from the long side is MUCH EASIER when the market is in a bullish phase!Shorting is easier when the market is in a bearish phase. Doing the opposite (i.e. goinglong in a bearish phase) is extremely risky, but many traders make this costly mistakeconstantly!
If you don’t have a simple, systematic method to determine the current market phase,stop trading until you get one. This applies to market indexes, ETF’s, and stocks.
Successful traders know what the current market phase is, and they use a strategy thattakes advantage of the characteristics of that market phase.
You do not need a strategy for every phase. Instead you need a market in the phaseyou’re good at trading. You will be best at trading strategies that match your personality,or your natural preference to be bullish, bearish, long-term, short-term, etc. If you onlylike to go long, there are plenty of opportunities to find market trends that are bullish.
Some of these opportunities are ETF’s that go up because the market is going down.
How Many Market Phases Are There? Two, Four, Six?
So far we’ve shown how you can make your life easier by taking these first steps:
o Focus on just three market phases – bullish, bearish and transitional.o Only trade when the phase is clear.

7/27/2019 116664120 Swing Trading
http://slidepdf.com/reader/full/116664120-swing-trading 6/14
MarketGauge.com 6
o Focus your trading on markets in the phase that is in line with your personalityand strategy.
MarketGauge has created a systematic approach to determining the strength anddirection of the market, which categorizes the market into more than 2 market phases. Itis common to think of the markets as having 4 market phases: accumulation
(bottoming), bullish, distribution (topping), and bearish.
Our Swing Trading model identifies 6 different market phases as illustrated below:
Six Market Phases of Stocks, Indexes, and ETFs
The Most Powerful Time to Catch a Market Phase
We would encourage you to look at market activity as having six different marketphases because one of the most powerful times to focus on a stock, index or ETF iswhen it is experiencing a phase change!
Don’t try to pick absolute tops and bottoms, but do know when the market phase isshifting. This is when trends begin and/or accelerate! The easiest way to reliably identify
these powerful shifts in trend is through a simple and systematic approach to trendanalysis.
Look at the chart below to see the power of viewing the market with 6 phases. This isthe same daily chart of the S&P 500 (as represented by the “SPY” ETF) shown above,but this time the days that were previously white and “transitional” are now moreprecisely defined as warning (yellow), distribution (magenta), recovery (light blue),accumulation (dark blue).
7/27/2019 116664120 Swing Trading
http://slidepdf.com/reader/full/116664120-swing-trading 7/14
MarketGauge.com 7
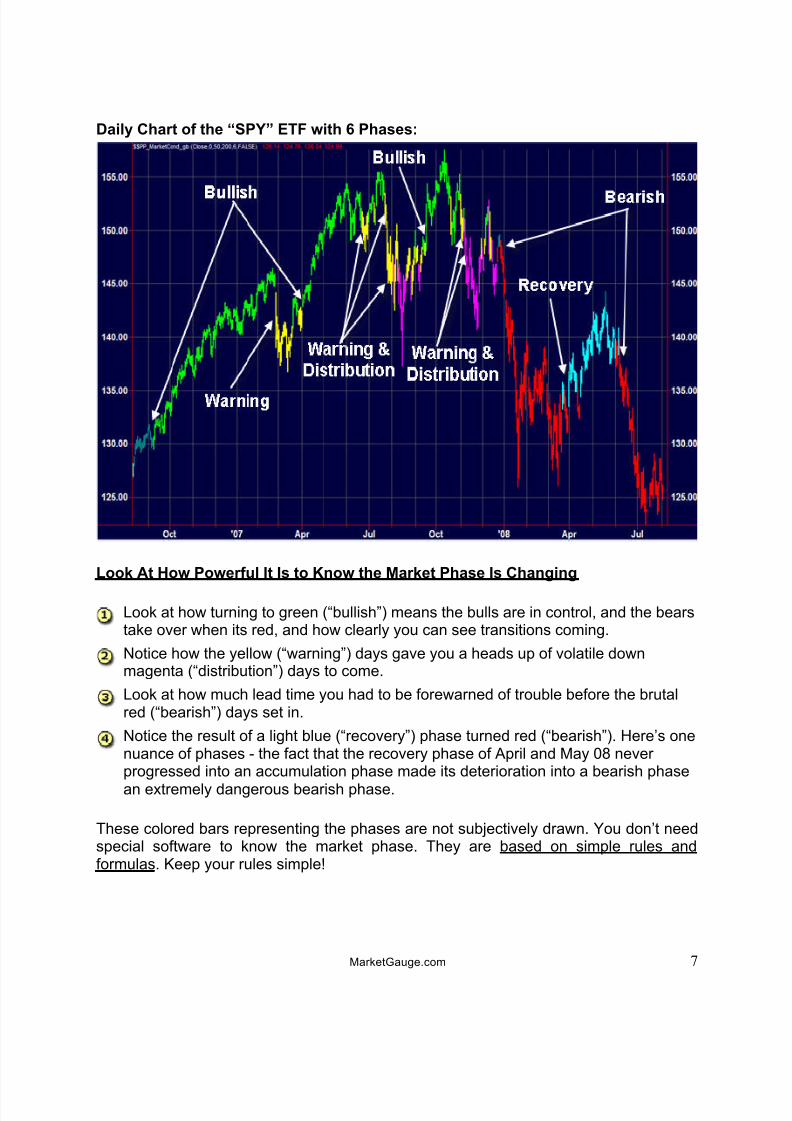
Daily Chart of the “SPY” ETF with 6 Phases:
Look At How Powerful It Is to Know the Market Phase Is Changing
Look at how turning to green (“bullish”) means the bulls are in control, and the bearstake over when its red, and how clearly you can see transitions coming.
Notice how the yellow (“warning”) days gave you a heads up of volatile downmagenta (“distribution”) days to come.
Look at how much lead time you had to be forewarned of trouble before the brutalred (“bearish”) days set in.
Notice the result of a light blue (“recovery”) phase turned red (“bearish”). Here’s onenuance of phases - the fact that the recovery phase of April and May 08 never progressed into an accumulation phase made its deterioration into a bearish phase
an extremely dangerous bearish phase.
These colored bars representing the phases are not subjectively drawn. You don’t needspecial software to know the market phase. They are based on simple rules andformulas. Keep your rules simple!

7/27/2019 116664120 Swing Trading
http://slidepdf.com/reader/full/116664120-swing-trading 8/14
MarketGauge.com 8
These market phases are not limited to market indexes – they hold true for stocksand ETFs too.
Rule #2:
Use Quality Entries & Exits (TIMING)“Be In the Right Place at the Right Time”
We call this principle “The rule of being in the right place at the right time - timing iseverything.”
The rule is how you overcome big losses and create consistent returns!
This rule covers the area of trading that most traders spend all their efforts on – entries
and exits. An entry or an exit is a set of criteria that, when met, constitute your reason tobuy or sell a stock.
Despite the huge focus on this area by traders, huge mistakes are made.
Your Holy Grail Indicator
If you are going to develop a good trading system, the first step is to STOP LOOKINGfor “the perfect entry indicator.” It does not exist. Even good stocks fail, and you don’tneed a perfect indicator to be a successful trader. You need a simple, repeatable,systematic approach to entering and exiting the market.
What is a “Good Quality” Entry or Exit?
This document is not the place to attempt to give you specific entry and exit criteriabecause it’s more important that you get the foundation for creating good quality entryand exits.
Specific entry and exit rules are covered in the trading courses where there is adequatetime to explain the entire premise, risk, and objectives of the trade.
If you already have specific entry and exit criteria, make sure these foundational
concepts are part of your trading plan.
Good quality entries and exits take into consideration the bigger goal – the system.
Don’t focus on perfecting individual trades. Focus on building entries and exitsthat deliver consistent results over a large number of trades – systems lead tosuccess, not individual trades. Here are some guidelines to follow when you defineyour entries and exits

7/27/2019 116664120 Swing Trading
http://slidepdf.com/reader/full/116664120-swing-trading 9/14
MarketGauge.com 9
Characteristics of Good Entries and Exits:
1. Easy to identify and execute: Your entry criteria should be as simple aspossible. If your entry and exit rules are too difficult to identify or act upon, thenyou won’t use them consistently, and that makes your entry and exit rules
ineffective.
2. Easy to repeat consistently: Success in trading comes when you have anapproach, or system that you can execute with consistency. If your criteria aresubject to a lot of interpretation you will not be able to identify the same marketcondition that constitutes a consistent entry. This reinforces the importance of simplicity.
3. Complementary with the trading personality of your market: The tradingpersonality of your market is the way in which a stock trades.
The best way for to illustrate this point is with this example. If a stock generallyexperiences a daily trading range of $10 and has a typical bid-ask spread of $.50to $.75 (i.e. GOOG when it was hot) your entry and exit rules must take thatvolatility and large spread into account. This not a trading personality that isappropriate for stop loss criteria of 0.25 below your entry price. Instead youshould have stop-loss criteria that enable the stock to trade with its normal levelof volatility immediately after your entry without getting stopped out.
4. Complementary with the premise of your trade: When you enter a trade youshould have a plan. You should also have an expectation of what the trade coulddo if it works, and what it might do if it doesn’t work. Good exit criteria will enable
you to stay in the trade until the conditions of the trade “not working” are met.
Common Mistakes Made In Creating Entries and Exits:
1. Not enough emphasis on exits: The most common mistake traders make is tobe too focused on entries while ignoring exits. Successful traders know that exitsare the most important half of your trading decisions! Exits lock in profits andminimize losses - don't ignore them.
2. Entries don’t = exits: Don’t assume that the same indicator or criteria that youare using for your entries should be used to define your exits. In fact, it is likely
that your best rules for exits will be different than those used for entries.
3. More is not better: Using multiple conditions to define an entry or exit isgenerally a good idea, but every time you add criteria you are not necessarilyimproving your system. You may even be making it a lot worse. You areundoubtedly making it less simple.

7/27/2019 116664120 Swing Trading
http://slidepdf.com/reader/full/116664120-swing-trading 10/14
MarketGauge.com 10
These Principles Will Result in Good Timing
If you follow these guidelines when you define your entry and exit criteria you will beforced to create a trading system that is in sync with the market conditions that you liketo trade. When you are in sync with the market good timing just happens.
Rule #3:
Catch Multi-Dimensional MOMENTUM“The Rule That Hits Home Runs”
We call this principle “The Rule that hits home runs” because following Rule #3 putsyou in position to catch the market’s biggest moves.
This rule is perfect for the part-time trader or a small account that you’d like togrow without a lot of active trading.
By multi-dimensional momentum, we mean finding stocks, indexes, or ETF’s that havemore than just daily price & volume momentum. In the most powerful scenarios itmeans earnings, sales, news, market, industry group, and geo-political momentum!Why trade just any good-looking chart when you can just as easily trade a trend thathas more than just the chart as the “reason” for its move to continue? The big money ismade (home runs are hit) when you catch the trends that are driven by momentumother than just price.
You’ll Hit Home Runs With…Skill, Homework, and a Little Luck
Right now you should be asking yourself, “How do I find stocks, indexes and or/ETFswith multi-dimensional momentum?” First you need to know what to look for. This willcome from experience and/or education.
Shortcuts
Just like the technical analysis of charts, analyzing the data that measures other areasof momentum is an art as well as science, and requires homework and research. Here
are a few concepts that are effective short cuts for getting started in honing your multi-dimensional momentum analysis skills.
1. If you are trading stocks, one basic, time-proven, method is to look for companieswith strong earnings and sales trends. It is important to look at past performanceas well as expectations for the future.

7/27/2019 116664120 Swing Trading
http://slidepdf.com/reader/full/116664120-swing-trading 11/14
MarketGauge.com 11
2. The price action, earnings, and sales trends of a stock’s industry group andpeers can provide you with evidence that your stock is in a business that hasunderlying fundamental strength.
3. Inter-market analysis. If you learn which industry groups and indices are highlycorrelated, you will be able to see cause and affect relationships in the markets.
Knowing these relationships will enable you to identify when your trade is part of larger and more significant trends than just that of the individual stocks pricemovement!
How To Make Your Own Luck
Expect that the markets will be full of surprises – good and bad.
But also know that “surprises” can trend! This means that stocks and markets tend toexperience cycles of good news and cycles of bad news. Strong price trends often leadto more good news which then further fuels the price trend. The same self-fulfilling cycle
also occurs in down markets with negative news.
But can a price trend create good news?
No. But what does happen is the interpretation of news trends in a way similar to pricetrends. For example, when the sentiment of a stock is very bullish, almost any newsstory gets interpreted as bullish, and the price trend continues up.
Good traders find trading opportunities where there is momentum in these multi-dimensional areas because it puts them in a position to “get lucky” – to be in a stockthat before the good news hits! You can do this too.
An Example of a Multi-Dimensional Trend You’ve Experienced
The most familiar example of multi-dimensional momentum in recent years is likely tobe Apple.
Apple exemplifies momentum in not just one, but two areas in addition to price –earnings and social change. By “social change” I mean benefiting from widespreadchange in social behavior. In Apple’s case, it actually created the change. In fact, Appleproduced a disruptive change in multiple consumer product segments – music players,cell phones and then tablets!
As is often the case in situations where a company changes or even creates a largeindustry segment, the value of that company quickly becomes evident and the stockprice soars.
This is exactly the point of multi-dimensional momentum – the driving force behind thecompany’s stock move is obvious and shows little sign of slowing down. You don’t needto be a financial analyst to figure out that if you could buy Apple with a proper low risk

7/27/2019 116664120 Swing Trading
http://slidepdf.com/reader/full/116664120-swing-trading 12/14
MarketGauge.com 12
entry price consistent with the qualities described in Rule #2, it would be a trade withenormous potential!
The Price Patterns of Multi-Dimensional Trends
So what does a multi-dimensional trend look like? The chart below shows a weekly time
frame so you can see more history. The moving averages are the 50-day (cyan) and200-day (magenta) moving averages. These are two moving averages we use incalculating the Market Phase discussed in Rule #1.
Notice how there can be large corrections in the trend. In fact from late 2007 to 2009 itsstock was down over 50%. You must consider rules #1 and #2 in conjunction with thisrule so you avoid the big drop and be prepared for the next recovery. As you can see,from 2009 through January of 2012 there are corrections in a strong trend and they tendto offer powerful long set-ups.
Weekly Chart of Apple, Inc.
Trading these strong trends is incredibly rewarding. However, to consistently profit fromthem you must understand that they can change quickly. Some might say “withoutwarning”. This is because often times, the non-price trend (news, earnings, etc.), doesnot change until after the price trend has clearly reversed!
For this reason it is incredibly important and powerful to have a systematicapproach to identifying the changes in phases in a precise way as described inRule #1.
7/27/2019 116664120 Swing Trading
http://slidepdf.com/reader/full/116664120-swing-trading 13/14
MarketGauge.com 13
Conclusion:
Rules Based Trading
These 3 Rules are foundational concepts that we have used to build many tradingsystems. If you review the rules you will find that there are some important overridingthemes within each rule.
Remember to:
• Keep it simple• Trade with rules – have a plan
Improving Your Existing Trading Approach
If you want to start applying these rules immediately, use the short set of questions
below to begin your own process of objectively evaluating the quality of your tradingapproach. The only person who will see your answers is you, so be sure to be specificand honest!
Rule #1:
o What are your rules for determining if a stock, ETF, or market is in the rightcondition for you to trade most successfully?
o Which of your rules warn you of any potential important change in conditions of the market you are trading?
o If you trade stocks, 70% of your stocks intra-day move is driven by the generalmarket conditions. How are you measuring the overall health of the generalmarket?
Rule #2:
o Where do you find trades that have the home run potential of multi-dimensionalmomentum?
o What are your criteria for good candidates for multi-dimensional momentum
trends?
Rule #3:
o Are your entry and exit rules simple enough to execute consistently?

7/27/2019 116664120 Swing Trading
http://slidepdf.com/reader/full/116664120-swing-trading 14/14
MarketGauge.com 14
o How do your entry and exit rules account for the fact that not all stocks or markets trade the same?
o Are your exit rules consistent with the premise of your trading plan?
o Are you making any of the “common mistakes” listed in Rule 3?
__________________________________________
Discover how Swing Trading can catapult your portfolio byregistering for an upcoming complimentary webinar.
Attend the webinar and learn:
How To Read The Market, Anticipate Market Swings,And Ride Them For Maximum Profit.
Register for this special training webinar by going to:
www.marketgauge.com/swing/webinar