10. options for increasing tax - ifs
TRANSCRIPT

10. Options for increasing tax
Stuart Adam and Barra Roantree (IFS)
Summary
• The last five general elections have all been followed by net tax rises of more than £5 billion per year in today’s terms. Although just 2% of the remaining fiscal consolidation is currently planned to come from tax rises, and none of the main political parties is proposing significant tax rises, it would not be surprising to see an incoming government increase taxes in order to limit the scale of public spending cuts required to meet its fiscal targets.
• Of the big three taxes: --- a 1 percentage point rise in all rates of income tax would raise £5.5 billion; --- a 1 percentage point rise in all employee and self-employed National Insurance
contribution (NIC) rates would raise £4.9 billion; and --- a 1 percentage point rise in the main rate of VAT would raise £5.2 billion.
• Increasing any of these would weaken work incentives and hit the rich harder than the poor. The main differences between them are that the VAT rise would be less progressive than the others (as it would affect poor, non-income-tax-paying households) and that the retired and savers would not be affected by a rise in NICs (which only tax the earnings of those below state pension age).
• Increasing rates of corporation tax, council tax, business rates or fuel duties could also raise significant sums, though the recent trend has been to reduce the rates of these taxes.
• Politicians from all main parties have indicated that they think the burden of fiscal consolidation should be focused on the better-off --- though tax payments are already highly concentrated: for example, a quarter of income tax comes from just 0.5% of the adult population and around half comes from 3% of adults. As well as increasing rates of income tax or NICs for high-income individuals, options include increasing inheritance tax or capital gains tax --- though in both cases reducing thresholds might have greater revenue-raising potential than increasing rates. Introducing a separate ‘mansion tax’ would be unnecessarily complicated when council tax could be brought up to date and refocused on higher-value properties.
• All these taxes include costly reliefs. In many cases, removing these reliefs would leave the tax system simpler and more efficient than increasing tax rates --- though policymakers must also decide where they want the burden of tax increases to fall.
• Which, if any, possible tax increases are the best to pursue would depend on a government’s distributional goals and wider priorities, on which we take no stance. But some tax rises should definitely be avoided. Stamp duty land tax is particularly damaging and recent governments’ tendency to turn to it for more revenue should be resisted. And while there are sensible ways to raise more revenue from the taxation of pension saving, the widespread proposal to restrict income tax relief on pension contributions to the basic rate is misguided.
227
© Institute for Fiscal Studies, 2015

The IFS Green Budget: February 2015
10.1 Introduction
The UK’s public finances are still in a weakened state. In 2015–16, the government expects to borrow 3.6% of national income over and above the borrowing that can be expected to disappear as the economy recovers, leading all three main political parties to commit to further fiscal consolidation over the next parliament, albeit to varying extents. As discussed in Chapter 1, the plans set out in the Autumn Statement imply 98% of the remaining fiscal consolidation (from now until 2019–20) coming from net spending cuts and 2% coming from net tax rises. To date, none of the parties has proposed significant further net tax rises. But in the absence of tax rises all the parties’ targets imply a combination of large cuts to spending on social security benefits (discussed in Chapter 9) and/or public services (discussed in Chapter 7).
To limit the scale of such cuts, it would not be surprising if an incoming government were to contemplate raising taxes following the May 2015 general election. Nor would such a scenario be at all unusual. As Figure 10.1 shows, there is a tendency for elections to be followed by substantial tax increases: every general election since 1992 has been followed within 12 months by an announcement of more than £5 billion (in 2015–16 terms) of net tax rises.
This chapter discusses a wide range of options that a future tax-raising government might consider, assessing how much revenue they would raise, who would bear the burden and what economic effects they might have. We draw on the findings of the Mirrlees Review of taxation1 to consider whether the reforms would move the UK towards a more rational tax system. Ultimately, however, we cannot advocate any particular tax-raising measures: who should bear the burden of fiscal consolidation is a value judgement we are not in a position to make. Which, if any, reforms to pursue would depend on a government’s distributional goals and wider priorities.
By way of background, Section 10.2 briefly outlines the level and composition of government revenues. Section 10.3 examines increases in the biggest taxes that would affect large sections of society. Section 10.4 focuses on tax increases that target the well-off and Section 10.5 turns to the potential for raising revenue by scaling back tax reliefs to broaden the base on which taxes are levied. The final set of measures discussed, in Section 10.6, are ‘temptations to resist’ that would increase revenues in particularly damaging ways. Section 10.7 draws all of these strands together, summarises the revenue and distributional effects of the different options and concludes.
Unless otherwise stated, in this chapter reforms’ revenue effects are annual and relate to 2015–16. Where full-year costings are available only for other years, they are adjusted in line with nominal growth in national income to express them in 2015–16 terms.
1 J. Mirrlees, S. Adam, T. Besley, R. Blundell, S. Bond, R. Chote, M. Gammie, P. Johnson, G. Myles and J. Poterba, Tax by Design: The Mirrlees Review, Oxford University Press for the Institute for Fiscal Studies, Oxford, 2011, http://www.ifs.org.uk/publications/5353.
228

Options for increasing tax
Figure 10.1. Taxes and the electoral cycle
Source: Authors’ calculations using HM Treasury Budgets and Pre-Budget Reports between March 1985 and March 2010, and Office for Budget Responsibility ‘Policy measures database’ (available at http://budgetresponsibility.org.uk/data/) subsequently.
-6.0 -7.6
-10.6 -20.1
-10.6 2.7
4.1 -6.9
29.0 19.9
-1.0 -9.8
1.5 9.5
6.5 -4.0
-1.3 -0.7
-1.5 -6.0
0.0 13.9
1.0 0.8 0.5 0.3 0.7 0.9
4.2 1.2
2.9 0.4 1.5
3.5 2.8
9.9 6.1
1.7 7.3
0.0 0.4
-0.5 -0.7 -0.4 -0.8 -1.0
-2.6 0.3
-30 -20 -10 0 10 20 30 40
Spring 1985 Budget Spring 1986 Budget Spring 1987 Budget Spring 1988 Budget Spring 1989 Budget Spring 1990 Budget Spring 1991 Budget Spring 1992 Budget Spring 1993 Budget
Autumn 1993 Budget Autumn 1994 Budget Autumn 1995 Budget Autumn 1996 Budget Summer 1997 Budget
Spring 1998 Budget Spring 1999 Budget
Autumn 1999 PBR Spring 2000 Budget
Autumn 2000 PBR Spring 2001 Budget
Autumn 2001 PBR Spring 2002 Budget
Autumn 2002 PBR Spring 2003 Budget
Autumn 2003 PBR Spring 2004 Budget
Autumn 2004 PBR Spring 2005 Budget
Autumn 2005 PBR Spring 2006 Budget
Autumn 2006 PBR Spring 2007 Budget
Autumn 2007 PBR Spring 2008 Budget
Autumn 2008 PBR Spring 2009 Budget
Autumn 2009 PBR Spring 2010 Budget
June Budget 2010 Autumn Statement 2010
Budget 2011 Autumn Statement 2011
Budget 2012 Autumn Statement 2012
Budget 2013 Autumn Statement 2013
Budget 2014 Autumn Statement 2014
£ billion (2015–16 terms)
229

The IFS Green Budget: February 2015
10.2 Taxation in the UK
Total UK government revenue is forecast to be £670.3 billion in 2015–16, or 35.5% of national income. As Figure 10.2 shows, in recent years this share has fluctuated slightly but not dramatically; there is perhaps a slight downward trend, but forecast revenues in 2015–16 look little different (as a share of national income) from their level when the coalition came to office in 2010–11, despite the net effect of discretionary reforms implemented by the coalition government being to increase taxes by £16.4 billion.2 A slight increase in revenues is expected over the course of the next parliament.
As Figure 10.3 shows, three-fifths of government revenue comes from just three taxes: income tax, National Insurance contributions (NICs) and value added tax (VAT). Not all government revenue comes from taxes: taxes as defined in the National Accounts are forecast to raise £622.9 billion, equivalent to roughly £11,800 for every adult in the UK, or £9,600 per person;3 the remainder is provided by surpluses of public sector industries, rent from state-owned properties and so on.
Figure 10.4 shows that the tax burden in the UK is middling by international standards: similar to the OECD average, it is lower than in most Western European and Scandinavian countries but higher than is typical in Eastern Europe, North America, Ireland, Japan and Australia.
2 See http://election2015.ifs.org.uk/taxes. 3 Source: Office for Budget Responsibility, Economic and Fiscal Outlook December 2014, http://budgetresponsibility.org.uk/economic-fiscal-outlook-december-2014/ and table A1-1 of Office for National Statistics, Principal Population Projections (2012-Based).
230

Options for increasing tax
Figure 10.2. Total government revenue over time
Source: Office for Budget Responsibility ‘Public finances databank (January 2015)’, available at http://budgetresponsibility.org.uk/data/.
Figure 10.3. Composition of UK government revenue, 2015---16
Note: ‘Capital taxes’ includes capital gains tax, inheritance tax, stamp duties and the bank levy. ‘Other [non-tax] receipts’ includes surpluses from publicly-owned companies, interest and dividends, less own resources contribution to the EU. Source: Office for Budget Responsibility, Economic and Fiscal Outlook December 2014, http://budgetresponsibility.org.uk/economic-fiscal-outlook-december-2014/.
34.0%
34.5%
35.0%
35.5%
36.0%
36.5%
37.0%
37.5%
38.0%
19
97
–98
19
98
–99
19
99
–00
20
00
–01
20
01
–02
20
02
–03
20
03
–04
20
04
–05
20
05
–06
20
06
–07
20
07
–08
20
08
–09
20
09
–10
20
10
–11
20
11
–12
20
12
–13
20
13
–14
20
14
–15
20
15
–16
20
16
–17
20
17
–18
20
18
–19
20
19
–20
% o
f na
tio
nal i
nco
me
Income tax 26%
National Insurance
17%
VAT 17%
Fuel duties 4%
Other indirect taxes 8%
Corporation tax 6%
Capital taxes 4%
Business rates 4%
Council tax 4%
Other taxes 3%
Other receipts 7%
231

The IFS Green Budget: February 2015
Figure 10.4. Tax revenues in OECD countries, 2012
Source: OECD.stat, Revenue statistics comparative tables (http://stats.oecd.org/).
10.3 Broad-based tax increases
The simplest way for the government to raise a large amount of additional revenue would be to increase the rates of one of the three taxes that account for most of its revenue: income tax, NICs or VAT.
The four other taxes that stand out as substantial sources of revenue are corporation tax (forecast to raise £42.3 billion in 2015–16), council tax (£28.4 billion), business rates (£27.6 billion) and fuel duties (£27.0 billion). Increases to any of these would run counter to the direction of policy over this parliament: the government has cut headline rates of corporation tax, given incentives to local authorities to freeze council tax, announced several business rate cuts (albeit some only temporary) and made large real cuts to fuel duties.
In this section, we discuss increases to the main rates of all these taxes.
Income tax, NICs and VAT
A 1 percentage point rise in all rates of income tax would, after allowing for some behavioural response, raise an estimated £5.5 billion per year: £4.2 billion from the basic
19.6 21.4
24.4 24.8
26.9 27.3 27.3 27.6 28.1
29.5 29.6
30.7 31.2
32.1 32.1 32.1
33.0 33.0 33.7 33.7 33.8
35.3 36.3 36.5 36.5
38.5 38.5
41.7 42.3 42.3 42.7 42.8
44.0 44.0
47.2
0 10 20 30 40 50
Mexico Chile USA
Korea Switzerland
Australia Ireland Turkey
Slovak Republic Japan Israel
Canada Portugal Estonia Poland
Spain New Zealand
UK Greece
OECD average Czech Republic
Iceland Netherlands
Germany Slovenia Hungary
Luxembourg Austria
Norway Sweden
Italy Finland
Belgium France
Denmark
% of national income
232

Options for increasing tax
rate, £1.2 billion from the higher rate and £0.1 billion from the additional rate.4 A 1 percentage point increase in the main rate of VAT would raise only slightly less (£5.2 billion), while increasing all rates of employee and self-employed NICs by 1 percentage point would again raise almost as much as that (£3.9 billion from the main rate and £1.0 billion from the additional rate that applies above the upper earnings limit / upper profits limit).5 We estimate that a 1 percentage point rise in employer NICs would raise rather less (only £2.5 billion) if employers passed it on to workers via lower wages.6,7
All of these reforms would weaken work incentives, reducing the reward for working in terms of the amount of goods and services that additional earnings can buy after tax. Of these three taxes, increases to NICs would typically be the most damaging to work incentives (per pound raised), then increases in income tax, with increases in VAT the least damaging. Increasing NICs weakens work incentives most because all of the revenue comes from taxing future earnings, whereas part of the revenue from increasing VAT or (to a lesser extent) income tax derives from wealth that has already been accumulated and will be payable regardless of future work behaviour. This is because income tax will be levied on the income derived from existing wealth, while VAT will be levied when the wealth comes to be spent. Furthermore, a VAT rise, unlike the others, would reduce the value of out-of-work incomes as well as in-work incomes, so the relative attractiveness of working would not be reduced as much.8
Each of the three tax rises would also exacerbate other existing tax-induced economic distortions, in different ways:
• Increasing the marginal rate of income tax would discourage saving and would increase the bias towards putting savings in relatively tax-favoured forms such as pensions, ISAs and owner-occupied housing.
4 Revenue from the higher and additional rates of income tax is particularly uncertain and sensitive to behavioural responses. We discuss this further in Section 10.4.
5 These are all HMRC’s estimates of the full-year (2016---17) revenue impacts of reforms introduced in 2015---16, expressed in 2015---16 prices by adjusting in line with forecast nominal GDP growth. Source: HMRC Statistics, https://www.gov.uk/government/statistics/direct-effects-of-illustrative-tax-changes. 6 Source: Authors’ calculations using the IFS tax and benefit microsimulation model, TAXBEN, run on uprated data from the 2012---13 Family Resources Survey. 7 This is significantly less than the revenue from increasing employee NICs since, although both would be initially levied as (broadly speaking) 1% of people’s earnings above a threshold, the reduction in gross earnings as the employer NICs rise was shifted on to workers would lead to an offsetting reduction in income tax and employee NICs liabilities and an increase in some people’s entitlements to means-tested benefits or tax credits, reducing the net yield from the NICs rise. HMRC (op. cit.) reports a figure of £4.7 billion for the yield from an employer NICs rise, apparently assuming that the extra employer NICs burden is not shifted on to workers. This might be true in the short run, but basic economic theory suggests that in the long run earnings should adjust so that the burden of a tax on earnings is felt by the same people regardless of whether it is formally levied on the employer or the employee. In practice, the burden of both employer and employee NICs (and indeed income tax) is probably shared, but if we are going to assume that income tax and employee NICs are ultimately incident on the worker, then it makes sense to assume the same about employer NICs too. Similar considerations might also apply to other taxes: for example, if a VAT increase feeds through into higher prices, then state benefits and public service pensions that are linked to inflation will increase, protecting the real value of these payments and offsetting the increased VAT revenue. 8 Offsetting this reduction in the reward to work (the ‘substitution effect’) is an increase in the need to work (the ‘income effect’): people may decide to work harder in order to make up for the income they have lost through the tax rise. Theoretically, therefore, these tax rises could either increase or reduce the amount people work. However, empirically, income effects tend to be small for many groups; they will often be offset (at least roughly) by income effects going in the opposite direction when the revenue is used to make someone better off; and, strictly speaking, the economic inefficiency (or ‘deadweight loss’) caused by a tax depends only on substitution effects, not on income effects. We therefore ignore income effects in the remainder of this chapter.
233
The IFS Green Budget: February 2015
• Increasing NICs would not have these effects since NICs are not levied on savings income, but for the same reason it would increase the existing incentive to shift the form in which income is taken away from earnings and towards capital income (for example, through setting up a company and taking income as dividends rather than earnings).
• Increasing the main rate of VAT would increase the scale of the distortion towards buying zero- and reduced-rated goods and services instead of standard-rated ones.
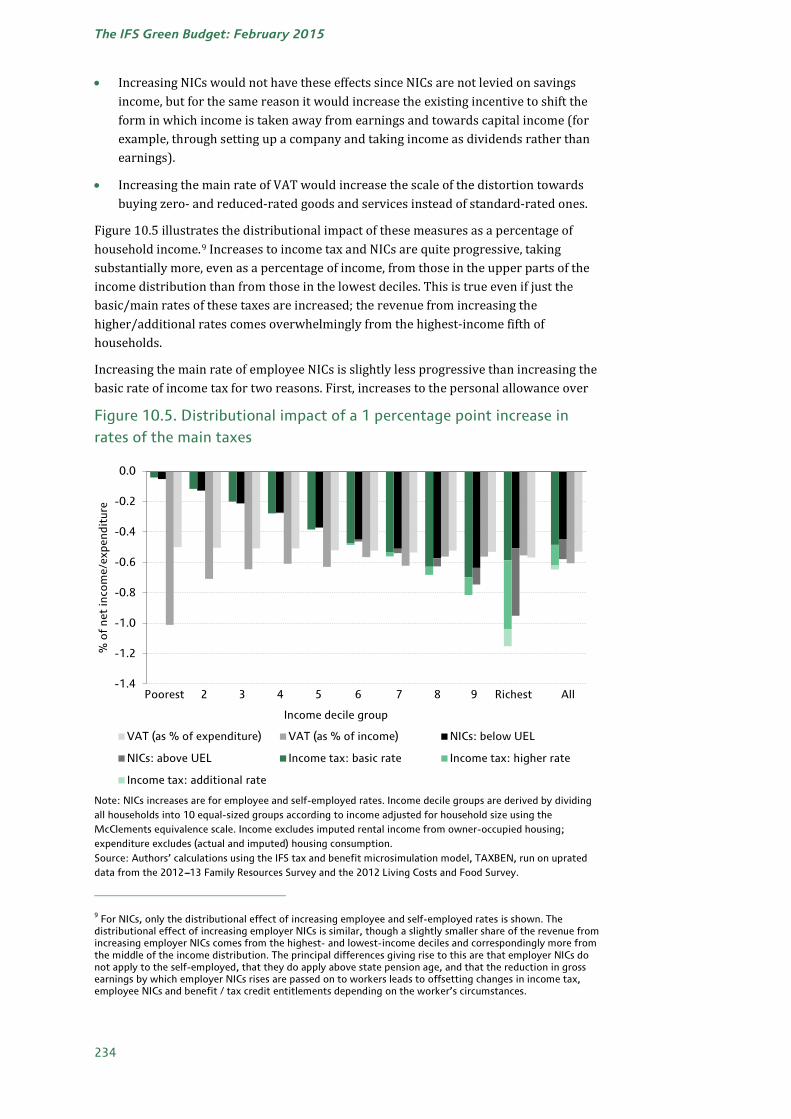
Figure 10.5 illustrates the distributional impact of these measures as a percentage of household income.9 Increases to income tax and NICs are quite progressive, taking substantially more, even as a percentage of income, from those in the upper parts of the income distribution than from those in the lowest deciles. This is true even if just the basic/main rates of these taxes are increased; the revenue from increasing the higher/additional rates comes overwhelmingly from the highest-income fifth of households.
Increasing the main rate of employee NICs is slightly less progressive than increasing the basic rate of income tax for two reasons. First, increases to the personal allowance over
Figure 10.5. Distributional impact of a 1 percentage point increase in rates of the main taxes
Note: NICs increases are for employee and self-employed rates. Income decile groups are derived by dividing all households into 10 equal-sized groups according to income adjusted for household size using the McClements equivalence scale. Income excludes imputed rental income from owner-occupied housing; expenditure excludes (actual and imputed) housing consumption. Source: Authors’ calculations using the IFS tax and benefit microsimulation model, TAXBEN, run on uprated data from the 2012---13 Family Resources Survey and the 2012 Living Costs and Food Survey.
9 For NICs, only the distributional effect of increasing employee and self-employed rates is shown. The distributional effect of increasing employer NICs is similar, though a slightly smaller share of the revenue from increasing employer NICs comes from the highest- and lowest-income deciles and correspondingly more from the middle of the income distribution. The principal differences giving rise to this are that employer NICs do not apply to the self-employed, that they do apply above state pension age, and that the reduction in gross earnings by which employer NICs rises are passed on to workers leads to offsetting changes in income tax, employee NICs and benefit / tax credit entitlements depending on the worker’s circumstances.
Poorest 2 3 4 5 6 7 8 9 Richest All -1.4
-1.2
-1.0
-0.8
-0.6
-0.4
-0.2
0.0
% o
f ne
t in
com
e/ex
pend
itur
e
Income decile group
VAT (as % of expenditure) VAT (as % of income) NICs: below UEL
NICs: above UEL Income tax: basic rate Income tax: higher rate
Income tax: additional rate
234

Options for increasing tax
this parliament mean that in 2015–16 no income tax will be paid on the first £203 per week of earnings, compared with only £155 per week for NICs. Second, NICs apply only to earned income: income tax is levied on other forms of income as well – notably, savings income, which is found disproportionately in the top half of the income distribution. A further difference is that increases in the rates of income tax (and VAT) would affect both working-age and pensioner households, whereas those aged over the state pension age do not pay employee or self-employed NICs and so would be unaffected by an increase in those.
VAT looks regressive as a percentage of income: the lowest income decile in particular would lose 1.0% of its income from a VAT increase, compared with 0.6% for the population as a whole. This impression is misleading, however. It arises mainly because, at any given point in time, low-income households typically spend a lot (and therefore pay a lot of VAT) relative to their incomes. But households cannot spend more than their income indefinitely. Over a lifetime, income and expenditure must be equal (except for bequests given and received and the possibility of dying in debt); households spending a lot relative to their income at any given point in time are often those experiencing only temporarily low incomes and either borrowing or running down their savings in order to maintain their expenditure smoothly at a level more befitting their lifetime resources.10
We can get a clearer picture of the distributional impact of VAT over a lifetime – abstracting from how much people are borrowing or saving at any point in time – by looking at whether VAT is a bigger percentage of expenditure, rather than income, for better-off households. Figure 10.5 therefore shows the impact of a VAT rise as a percentage of expenditure as well as the impact as a percentage of income. On that measure, VAT looks slightly progressive, rising from 0.50% of expenditure for the lowest income decile group to 0.57% of expenditure for the highest income decile group. That arises because the items that are zero- or reduced-rated for VAT, and therefore not affected by a rise in the main rate – food being by far the biggest – take up a larger share of the budgets of poorer households. Over a lifetime, we would expect richer households to devote a larger share of their resources to goods subject to VAT at the main rate and therefore to lose more from such a VAT increase than poorer households: that is what the light grey bars in Figure 10.5 reflect.11 Nevertheless, while a rise in the main rate of VAT is best thought of as being slightly progressive, it is nowhere near as progressive as an income tax or NICs rise, because there is no VAT-free allowance on the first tranche of household expenditure analogous to the allowances in income tax and NICs.
Instead of (or as well as) increasing the rates of these taxes, the government could raise revenue by changing the thresholds at which different rates apply. In the case of the income tax personal allowance, this is of course the opposite of the current government’s direction of travel, and both the Conservatives and the Liberal Democrats are committed to further increasing the allowance to £12,500 by 2020–21. In contrast, reducing the higher-rate threshold would be in keeping with recent and longer-term trends, which (owing to a combination of threshold reductions and income growth) have seen the number of higher- and additional-rate taxpayers increase from 674,000 in 1979–80 to
10 Such temporarily low incomes can arise for a variety of reasons: people who are temporarily unemployed, people with volatile income from self-employment, students, those taking time out of the labour market to raise children, retirees drawing on past savings, and so on. 11 For more analysis of VAT payments by income and expenditure and their relationship to lifetime resources, see S. Adam, D. Phillips and S. Smith (in consortium), A Retrospective Evaluation of Elements of the EU VAT System, European Commission, 2011, http://www.ifs.org.uk/publications/5947.
235

The IFS Green Budget: February 2015
3.3 million in 2010–11 and an estimated 5.0 million in 2014–15.12 At the 2014 Conservative Party conference, the Prime Minister said that he thought this trend undesirable, and proposed to increase the higher-rate threshold to £50,000 by the end of the next parliament rather than reduce it further.13
The principles that apply to changing thresholds are similar to those discussed above for changing rates, and we do not discuss each threshold separately; Table 10.2 and Figure 10.9 at the end of the chapter show the revenue and distributional consequences of some possible reforms. But to get an idea of the revenue at stake, note that freezing all income tax and NICs thresholds for two years from 2015–16 to 2017–18 – a 3.7% real-terms cut, on the OBR’s current inflation forecasts – would raise about £3.7 billion. This would involve a £390 reduction in the personal allowance, for example, reversing only 14% of the £2,835 discretionary increase introduced by the coalition. A freeze for the full five years of the next parliament would be a 9.2% real reduction, raising £9.9 billion and reducing the personal allowance by £980.
Corporation tax
After income tax, NICs and VAT, the UK’s fourth-biggest tax is corporation tax. HMRC estimates that increasing the rate of corporation tax by 1 percentage point would raise £1.5 billion per year – much less than the other main taxes.14 This is partly because it is a smaller tax, but also because the international mobility of corporate profits means that more of the potential revenue from a tax rise would be lost to a shrinking tax base than is the case with the main rates of the other taxes considered here. Increasing the corporation tax rate would also discourage investment and increase the bias towards companies using debt rather than their own funds (or new equity issues) to finance investment.
For all these reasons, increasing the corporation tax rate might seem an unlikely place to look for significant extra revenue. The Labour Party does, however, propose to cancel the fall in the main rate of corporation tax from 21% to 20%, due in April 2015, to pay for a reduction in business rates. In the short run, such a corporation tax increase would reduce company profits, though in the longer run a large part of the burden might be passed on to workers (if companies respond by reducing the wages they pay) or consumers (if companies respond by increasing their prices).
Keeping different rates of corporation tax for different levels of profits would complicate the tax. Labour’s policy now is that it wishes to have – apparently permanently – a rate of 20% on profits below £300,000, a rate of 21.25% on profits between £300,000 and £1,500,000, and a rate of 21% on profits in excess of £1,500,000. Having three separate rates that are so similar to each other simply looks farcical. The simplification of moving to a single rate of corporation tax (whether that is at 20% or some other rate) is a real achievement of the coalition government’s tax policy, and it is one that should not be reversed.
12 HMRC Collection, https://www.gov.uk/government/collections/income-tax-statistics-and-distributions. 13 See http://press.conservatives.com/post/98882674910/david-cameron-speech-to-conservative-party. 14 Source: HMRC Statistics, https://www.gov.uk/government/statistics/direct-effects-of-illustrative-tax-changes.
236

Options for increasing tax
Council tax
A uniform 10% increase in council tax rates would raise £2.3 billion.15 But the overall level of council tax is not directly within the control of central government, with rates set by individual local authorities. Each residential property in Britain is allocated to a council tax band, based (in England and Scotland) on the assessed 1991 value of the property.16 Individual local authorities determine the overall level of council tax, while the ratio between rates for different bands is set by central government (and has not changed since council tax was introduced in 1993). Central government can influence local authorities’ choices, however, by increasing or reducing the grant it provides to them (leaving them to raise less or more of their revenue themselves) and via its choice of threshold above which council tax increases would require approval in a local referendum under the Localism Act 2011.
Council tax is charged at a much lower percentage of property value for high-value properties than for low-value properties. Consequently, a uniform percentage council tax increase would represent a bigger share of income or expenditure for poorer households. This is strongly mitigated by the existence of means-tested council tax support to protect those with low incomes and financial assets. But high levels of non-take-up, combined with cuts to council tax support introduced by local authorities since it was localised (and funding for it reduced) in 2013, mean that the overall pattern is nonetheless somewhat regressive. It is hard to find a good reason why council tax should be less than proportional to property values, and the Mirrlees Review recommended that it should be transformed into a simple percentage of property value. In the process, it could be brought up to date; council tax in England and Scotland is still ludicrously based on the relative values of different properties in 1991. Short of such a thoroughgoing reform, Section 10.4 explores the possibility of focusing council tax increases on properties in the highest bands and Section 10.5 examines the removal of the existing discount for single-occupancy properties.
Business rates
Business rates are a tax on the estimated market rental values of non-residential properties. As such, they combine one of the worst taxes – a tax on the value of business property – with one of the best – a tax on land values.17 There is a strong case against levying a tax on buildings used for business purposes. A basic tenet of the economics of taxation is that intermediate inputs to production – that is, inputs that are themselves the result of an earlier production process, such as buildings – should not be taxed.18 The principal effect of business rates is that economic activity in the UK is artificially skewed away from property development and property-intensive production activities. Land, in contrast, is not the result of a production process: its supply is essentially fixed and taxing
15 Source: Authors’ calculations using the IFS tax and benefit microsimulation model, TAXBEN, run on uprated data from the 2012---13 Family Resources Survey. 16 Since 2005, council tax bandings in Wales are based on assessed 2003 values. Northern Ireland operates a different system, based on point values (subject to a cap) rather than bands. 17 This is a modified quote from William Vickrey; see W. Vickrey, ‘Simplification, progression, and a level playing field’, in K. Wenzer (ed.), Land-Value Taxation: The Equitable and Efficient Source of Public Finance, M. E. Sharpe, Armonk, NY, 1999. 18 P. Diamond and J. Mirrlees, ‘Optimal taxation and public production I: production efficiency’, American Economic Review, 1971, 61, 8---27.
237

The IFS Green Budget: February 2015
it (excluding the value of any buildings on it) would simply make it less valuable to its owners without discouraging any desirable activity.
The Mirrlees Review therefore argued that, if it proved practicable, business rates should be replaced with a land value tax (which could efficiently, though not necessarily fairly, be levied at arbitrarily high rates to raise additional revenue).19 If such a move is deemed too practically or politically difficult, consideration of increasing business rates must weigh the advantages of increasing tax on the land component against the disadvantages of increasing tax on buildings. Each percentage point added to the tax rate would raise around £280 million.20 An unusual additional obstacle to increasing the rate of this tax is that it would require primary legislation since the Local Government Finance Act 1988 stipulates that business rate bills cannot increase by more than the retail price index (RPI) each year.21 Rather than increasing the main rate of the tax, however, the government might consider removing some of the reliefs within business rates; this is discussed in Section 10.5.
Fuel duties
Governments have often cited high oil prices as a justification for reducing fuel duties. It remains to be seen whether precipitous recent falls will be viewed symmetrically as a reason to increase fuel duties, but it is perhaps indicative that in the 2014 Autumn Statement the present government abandoned the ‘fair fuel stabiliser’ policy that it had itself introduced in the 2011 Budget, under which fuel duties were to increase by 1p per litre if the average daily oil price fell below £45 per barrel at the start of a calendar year – as it now has.22
Fuel duties are not regressive overall. Among car owners, fuel duties take up a larger share of poorer households’ budgets, but since higher-income households are much more likely to own a car (or even two) in the first place, the average budget share across all households is broadly constant over the income distribution.
Increasing fuel duties by 10% – adding 7p to the price of a litre of petrol – would raise £2.6 billion per year.23 It would have some environmental benefits, though the evidence is clear that fuel duties are already far higher than can be justified by the carbon emissions from driving and are poorly targeted at reducing congestion, by far the biggest harm done by motoring. The Mirrlees Review argued that it would be better to replace most of fuel duties with a nationwide system of congestion charging. Indeed, without such a shift, revenues from motoring taxation may wither away as cars become ever more fuel-efficient and ultimately, perhaps, electric.24
19 See chapter 16 of Mirrlees et al. (2011, op. cit.). 20 Source: Authors’ calculations based on HM Treasury, Autumn Statement 2014 policy costings document (https://www.gov.uk/government/publications/autumn-statement-documents). 21 In years when properties are revalued, this applies to average bills at the point of revaluation. 22 More precisely, the rise in fuel duties would be triggered if the average daily oil price in both the three months and the week immediately prior to the first working day of February were less than £45 per barrel (Hansard, 21 March 2012, column 58WS, http://www.publications.parliament.uk/pa/cm201212/cmhansrd/cm120321/wmstext/120321m0001.htm). 23 Source: HMRC Statistics, https://www.gov.uk/government/statistics/direct-effects-of-illustrative-tax-changes. 24 See chapter 12 of Mirrlees et al. (2011, op. cit.).
238

Options for increasing tax
10.4 Taxing the better-off25
A relatively small group of very well-off taxpayers already pays a substantial share of tax revenues, reflecting both the structure of the tax system and the unequal distribution of tax bases. Income tax payments are highly concentrated, with a quarter of revenue coming from just 0.5% of the adult population (a quarter of a million individuals) and around half of revenue coming from 3% of adults in 2014–15.26 IFS researchers previously looked at a wider range of taxes, which collectively account for over three-quarters of tax revenue, and showed that, for those taxes, 20% of households contributed 54% of the revenue in 2013–14 and the top half of taxpayers contributed 85% of the revenue.27
The highest-income tenth of households have also seen the biggest tax rises – £112 per week, on average, or 6.2% of their net income – since the fiscal consolidation began in earnest in April 2010.28 On top of the rise in the main rate of VAT from 17.5% to 20% – the coalition’s biggest tax increase – which affected all households, high-income households have been particularly affected by increased NICs rates, reductions in the higher-rate income tax threshold, the introduction of the additional (now 45%) rate of income tax, the withdrawal of the income tax personal allowance once income exceeds £100,000, and restrictions on tax relief on pension contributions.
The share of tax paid by the better-off could be increased further. We take no stance on whether that would be the right direction of travel. Reasonable people can disagree as to what distribution of the tax burden would be fair, and in very broad-brush terms there is a trade-off between redistribution and incentives: crudely, the more the tax (and benefit) system helps the poor and penalises the rich, the more it erodes the incentive for the poor to become rich. Increasing reliance on a very small number of taxpayers for revenue also leaves the public finances more vulnerable to changes in their behaviour. But politicians of all hues have voiced their support for the proposition that the better-off should bear the greatest share of the burden of fiscal consolidation. For example, the Chancellor of the Exchequer, George Osborne, in his speech to the 2012 Conservative Party conference, pledged that ‘the broadest shoulders will continue to bear the greatest burden’. Similarly, Ed Miliband has stated that Labour believes ‘those with the broadest shoulders should bear the greatest burden’. Deputy Prime Minister Nick Clegg told the 2012 Liberal Democrat party conference that ‘the key question we will all have to answer is who will have to tighten their belts the most? Our position is clear. If we have to ask people to take
25 This section draws heavily on S. Adam, C. Emmerson and B. Roantree, ‘Broad shoulders and tight belts: options for taxing the better-off’, in C. Emmerson, P. Johnson and H. Miller (eds), The IFS Green Budget: February 2013, 2013, http://www.ifs.org.uk/publications/6562.
26 Source: Tables 2.4 and 2.5 of HMRC Statistics, https://www.gov.uk/government/collections/income-tax-statistics-and-distributions, with population aged 16 or over at 52.4 million in 2014 from table A1-1 of Office for National Statistics, 2012-Based Principal Population Projections (http://www.ons.gov.uk/ons/rel/npp/national-population-projections/2012-based-projections/rft-table-a1-1-principal-projection---uk-summary.xls), imply that 0.42% of adults paid 24.6% of income tax while 0.57% paid 27.4%, and 2.85% of adults paid 47.7%. 27 See Adam, Emmerson and Roantree (op. cit.).
28 Cuts to benefits, on the other hand, have taken more from low-income households. See J. Browne and W. Elming, ‘The effect of the coalition’s tax and benefit changes on household incomes and work incentives’, IFS Briefing Note BN159, 2015, http://election2015.ifs.org.uk/article/the-effect-of-the-coalition-s-tax-and-benefit-changes-on-household-incomes-and-work-incentives.
239

The IFS Green Budget: February 2015
less out or pay more in, we’ll start with the richest and work our way down, not the other way around’.29
It is rarely clear from such statements exactly which types or groups of individuals or households are considered to possess the broadest shoulders: for example, people with high current incomes do not necessarily have a large stock of wealth, and vice versa. In this section, we discuss a range of measures that raise revenue from groups that might be thought of as ‘well off’ in different senses.
Increasing income tax and NICs rates
If the next government wants to focus tax rises on those with the highest incomes, a straightforward measure would be to increase the additional (45%) or higher (40%) rates of income tax. However, the revenue yield from an increase in the additional rate of income tax, which applies only to taxable incomes in excess of £150,000 per year, is subject to a great deal of uncertainty. The ability of individuals to respond to a change in taxes by, for example, shifting income to another form or time period is likely to be greater for those on high incomes than for those on lower incomes.30 For this reason, HMRC’s estimate – signed off by the Office for Budget Responsibility as reasonable – of the revenue potential of increasing the top rate by 1 percentage point from 45% is only £100 million per year.31
Little is known about the responsiveness of higher-rate taxpayers, but it is unlikely to be as high as that of additional-rate taxpayers. HMRC estimates (which do make an allowance for some behavioural response) suggest that each percentage point on the higher rate of income tax would raise £1.2 billion, while each percentage point on the employee NICs rate above the upper earnings limit (UEL, which in 2015–16 will be aligned with the £42,385 per year higher-rate threshold) – and on the self-employed NICs rate above the upper profits limit (UPL) – would raise £1.0 billion.32 As Figure 10.9 shows, around 80% of the revenue from these increases would come from the highest-income tenth of households, who would also lose the most as a percentage of income.
Increasing the UEL and UPL to £100,000 per year (or the weekly equivalent) would increase employee and self-employed NICs rates on earnings between £42,385 and £100,000 from 2% to 12% and would raise around £10.1 billion – subject to similar uncertainties about behavioural response to those mentioned above. Increases beyond £100,000 would make behavioural response even more of a concern. Once income exceeds £100,000, the income tax personal allowance is reduced by 50p for every £1 of additional income; in combination with higher-rate tax, this in effect creates a marginal income tax rate of 60%. Levying employee NICs at 12% rather than 2% on top of this
29 See http://www.newstatesman.com/blogs/politics/2012/10/george-osbornes-speech-conservative-conference-full-text, http://press.labour.org.uk/post/107208138389/ed-miliband-speech-in-salford and http://www.libdems.org.uk/nick_clegg_s_speech_to_liberal_democrat_autumn_conference_2012.
30 For a fuller discussion of the difficulties involved in determining revenue-maximising top tax rates, see M. Brewer and J. Browne, ‘Can more revenue be raised by increasing income tax rates for the very rich?’, IFS Briefing Note 84, 2009, http://www.ifs.org.uk/bns/bn84.pdf. 31 The analysis underlying this estimate is presented in HMRC, ‘The exchequer effect of the 50 per cent additional rate of income tax’, 2012, http://webarchive.nationalarchives.gov.uk/20140109143644/http://www.hmrc.gov.uk/budget2012/excheq-income-tax-2042.htm. For further discussion, see also M. Brewer, J. Browne and P. Johnson, ‘The 50p income tax rate: what is known and what will be known?’, in C. Emmerson, P. Johnson and H. Miller (eds), The IFS Green Budget: February 2012, IFS Commentary 122, 2012, http://www.ifs.org.uk/publications/6003. 32 Source: HMRC Statistics, https://www.gov.uk/government/statistics/direct-effects-of-illustrative-tax-changes.
240

Options for increasing tax
would yield an eye-watering 72% effective marginal tax rate (or 75.4% if employer NICs are taken into account as well).
Increasing capital gains tax
Capital gains tax (CGT) is charged on the increase in the value of an asset between its acquisition and disposal. It is expected to raise £5.9 billion in 2015–16, though this is highly cyclical and volatile. CGT is highly progressive, disproportionately paid by a small number of taxpayers realising very large gains: in 2012–13, more than half of all individuals’ CGT liabilities came from just 3,000 people who realised gains of more than £1 million.33 This reflects the structure of the tax, which in 2015–16 will exempt the first £11,100 of gains realised each year, in addition to any gains made on people’s main homes and on any assets held in pension funds or ISAs. Above the exempt amount, gains that fall into the basic-rate income tax bracket (counting capital gains as the top slice of income) are taxed at 18% (the ‘lower rate’) while gains above the higher-rate threshold are taxed at 28% (the ‘higher rate’).
However, increasing the headline rates of CGT would probably yield little if any additional revenue: in fact, HMRC’s most recent estimate is that a rise in the lower rate would raise nothing, while any increase in the higher rate would actually reduce revenues slightly.34 As with almost any tax, CGT is subject to a ‘Laffer curve’ effect. As the tax rate rises, people will take more steps to avoid paying it.35 This erodes the yield from additional rises until the point where a further increase in the tax rate actually reduces revenue: after all, in the extreme case, with a 100% tax rate it would not be worthwhile to undertake the taxed activity at all and revenue would be zero. The size of the behavioural responses, and thus the revenue-maximising tax rate, are very difficult to estimate, but evidently the government believes that CGT rates are around their revenue-maximising level.
The case for increasing CGT rates – and the revenue yield from doing so – would be stronger if the rate increase were accompanied (or preceded) by other reforms. The Mirrlees Review proposed introducing a ‘rate-of-return allowance’, a tax allowance for a risk-free rate of return on the purchase cost of an asset that would eliminate the main disincentive effects of CGT. Removing other preferential tax treatments – including, but not limited to, reliefs within CGT itself (discussed in Section 10.5) – would both raise revenue directly and reduce the extent to which people could find tax-efficient ways to rearrange their affairs in response to a rise in CGT rates. In the absence of such wider reforms, HMRC’s revenue estimates would imply that a government seeking to increase CGT revenues cannot rely on increasing headline rates to do so.
Reducing the annual exempt amount from its 2015–16 level of £11,100 seems more promising. HMRC estimates that reducing the exempt amount by £500 would raise about
33 Source: Table 14.2 of HMRC Statistics, https://www.gov.uk/government/statistics/estimated-taxpayer-numbers-gains-and-tax-accruals-by-year-of-disposal-and-size-of-gain. 34 See HMRC Statistics, https://www.gov.uk/government/statistics/direct-effects-of-illustrative-tax-changes. 35 In the case of CGT, this could include --- among other possibilities --- saving less, moving into tax-privileged asset classes, taking income out of a business rather than letting its value build up, spreading out the realisation of gains to take maximum advantage of each year’s exempt amount, transferring assets to a lower-taxed spouse, leaving (or not moving to) the UK, or delaying selling an asset in order to postpone the latent tax liability for as long as possible --- perhaps in the hope that a future government would reduce CGT rates.
241

The IFS Green Budget: February 2015
£20 million per year;36 but larger reductions would raise revenue more than in proportion to this, since small gains are more common than larger gains.37 The losers from such a reform would be all those realising gains above the (reduced) exempt amount on assets other than their main home, pension or ISA. Provided the exempt amount remains significantly above zero, this would still be a relatively well-off group.
Beyond the narrow question of whether the CGT annual exempt amount should be reduced, a more fundamental question is why CGT and income tax have separate allowances at all. Capital gains are a return to saving just like capital income is, and it would make sense to tax them together. Yet, at present, the CGT allowance cannot be set against income and the income tax allowance cannot be set against capital gains. This separation rewards people who, in a given year, have some income and some capital gain, rather than exclusively one or the other. There seems to be little rationale for having large separate allowances. Beyond a de minimis allowance specifically for capital gains (much lower than the current one) to avoid the burden of CGT compliance for those realising trivial gains, it would make much more sense to have a single allowance to set against both income and capital gains.
Increasing inheritance tax
Inheritance tax (IHT) is charged at 40% on transfers of wealth in excess of £325,000 on (or shortly before) death. It was levied on 28,000 estates in 2013–14, representing 4.9% of all deaths.38 Transfers between spouses or civil partners are exempt, and the inheritance tax threshold is increased by any unused proportion of a deceased spouse’s or civil partner’s nil-rate band so that married couples and civil partners can collectively bequeath double the inheritance tax threshold (i.e. £650,000) tax-free even if the first to die leaves their entire estate to the surviving partner.
The Conservatives’ 2010 general election manifesto – and, as recently as October 2014, the Prime Minister39 – expressed a desire to increase the inheritance tax threshold. Yet in fact the threshold has been frozen in cash terms at £325,000 since 2009–10 and the 2013 Budget announced that the freeze would continue through to 2017–18. This eight-year freeze represents a cut of 20% or £64,800 relative to inflation as measured by the consumer price index. Because of this and because of rising asset prices, the number of estates liable for inheritance tax is forecast to rise from 4.9% of deaths in 2013–14 (and just 2.6% in 2009–10, before the threshold freeze) to 9.9% in 2018–19 and revenue from this tax is forecast to rise from 0.20% of national income in 2013–14 (and 0.16% in 2009–10) to 0.27% in 2018–19, its highest level since at least 1973–74.40
36 Source: HMRC Statistics, https://www.gov.uk/government/statistics/direct-effects-of-illustrative-tax-changes. 37 As an extreme illustration, note that simply multiplying up the £20 million number would imply that removing the exempt amount altogether would raise around £440 million, whereas HMRC estimates that the actual cost of having an £11,000 exemption is £3.5 billion (source: table 1.5 of HMRC Statistics, https://www.gov.uk/government/statistics/main-tax-expenditures-and-structural-reliefs). 38 Source: Number of taxpaying death estates in 2013---14 from HMRC Statistics, https://www.gov.uk/government/statistics/numbers-of-taxpayers-and-registered-traders; number of deaths in 2013 from ONS Vital Statistics (http://www.ons.gov.uk/ons/publications/re-reference-tables.html?edition=tcm%3A77-353343) and ONS Mortality Statistics (http://www.ons.gov.uk/ons/publications/re-reference-tables.html?edition=tcm%3A77-327590). 39 See http://www.theguardian.com/money/2014/oct/15/david-cameron-inheritance-tax-threshold.
40 2018---19 forecasts from Office for Budget Responsibility, Economic and Fiscal Outlook: March 2014. For a discussion, see S. Adam and C. Emmerson, ‘Death to the death tax?’, IFS Observation, 2014, http://www.ifs.org.uk/publications/7164.
242

Options for increasing tax
Further reducing the inheritance tax threshold could raise still more revenue. HMRC estimates that a £5,000 reduction would raise £100 million, but the yield from larger reductions would be more than proportional to that as inheritance tax started to affect more densely populated ranges of estate size.41
Increasing the rate of inheritance tax would be more progressive than reducing the threshold, though it probably has less revenue-raising potential. HMRC estimates that each percentage point added to the rate would raise £100 million, so that (say) a rise from 40% to 50% would raise £1.0 billion. A third possibility would be to reduce the threshold but, rather than simply extending the 40% rate downward, impose IHT at a lower rate, say 20%, on an initial band.
However, IHT is ridden with loopholes which, as Kay and King (1990) put it, favour ‘the healthy, wealthy, and well-advised’.42 Removing some of these could raise substantial revenue and is discussed in Section 10.5.
Reducing the limits on tax-free pension saving
Pension saving is tax-privileged, and a simple way to raise money from a well-off group would be to reduce the annual and/or lifetime limits on what can be contributed to a registered pension scheme. This would be very much in keeping with recent reforms, repeating what was done in the June 2010 Budget and the 2012 Autumn Statement. The Liberal Democrats propose a further reduction in the lifetime limit from £1.25 million to £1 million. We are not aware of any estimates of the yield from further reductions in the annual or lifetime limits from the current level; the government estimates that the reduction of the annual limit from £50,000 to £40,000 and the reduction of the lifetime limit from £1.5 million to £1.25 million will together raise £1.1 billion in 2017–1843 and increasing amounts thereafter, but further reductions of the same size would raise significantly more than that because far more people would be affected.
Tightening limits on what can be saved in tax-privileged forms over a lifetime is not the worst way to reduce the generosity of the pension system; in Section 10.6, we discuss a distinctly inferior proposal. But there are better options available, which we discuss in Section 10.5. In particular, rather than preventing people with very large pension pots from saving any more in a registered pension scheme at all, it would be better to let them save in a pension but without the large subsidies they currently receive through the tax-free lump sum and the NICs exemption of employer contributions.
The lifetime limit is currently more generous for those in defined benefit pension schemes than for those in defined contribution schemes.44 This differential is hard to justify. If the government was minded to reduce the lifetime allowance again, it should do so in a way that equalises it for members of defined benefit and defined contribution pension schemes.
41 As an extreme illustration, note that simply multiplying up the £100 million number would imply that abolishing the nil-rate band completely would raise £6.6 billion, whereas HMRC estimates that the total cost of the nil-rate band is £20.5 billion (in 2015---16 terms). Source: HMRC Collection, ‘Tax expenditures, reliefs and ready reckoners statistics’, https://www.gov.uk/government/collections/tax-expenditures-and-ready-reckoners. 42 J.A. Kay and M.A. King, The British Tax System, OUP, Oxford, 1990.
43 Source: table 2.1 of HM Treasury, Autumn Statement 2012, http://cdn.hm-treasury.gov.uk/autumn_statement_2012_complete.pdf. 44 C. Emmerson, ‘Taxation of private pensions’, in C. Emmerson, P. Johnson and H. Miller (eds), The IFS Green Budget: February 2014, http://www.ifs.org.uk/publications/7072.
243

The IFS Green Budget: February 2015
Reducing the annual allowance makes less sense than reducing the lifetime allowance. For a given level of desired lifetime contributions, it is not clear why we would want to penalise making occasional large contributions rather than frequent smaller contributions. In practical terms, too, reducing the annual allowance is more problematic, as valuing annual contributions to defined benefit pension schemes is difficult; the lower the annual limit, the more of these difficult valuations must be done.
Council tax and a ‘mansion tax’
Increasing council tax on high-band properties
As noted in Section 10.3, the council tax rates applied to each band are far from proportional to property value: people occupying more valuable properties pay a smaller percentage of the value of their property than those in less valuable properties. For example, in a local authority setting the 2014–15 average band D rate in England of £1,468,45 someone with a property at the midpoint of band D (£78,000) will pay 1.88% of its 1991 valuation, while someone with a property at the midpoint of band G (£240,000) will pay £2,447, or 1.02% of its 1991 valuation. This unfairly and inefficiently favours more valuable properties, and in particular the most valuable properties.
A simple reform that would raise revenue from households that are relatively well off on average while making council tax more proportional to property value would be to increase the tax rates applied to high-value properties. Figure 10.6 shows the distributional impact of doubling council tax rates for just band H (which would affect the top 0.6% of properties and raise £0.3 billion), for bands G and H (raising £2.0 billion from the top 4.2% of properties), for bands F, G and H (raising £4.2 billion from the top 9.6% of
Figure 10.6. Distributional impact of doubling council tax rates in certain bands
Note: Income decile groups are derived by dividing all households into 10 equal-sized groups according to income adjusted for household size using the McClements equivalence scale. Source: Authors’ calculations using the IFS tax and benefit microsimulation model, TAXBEN, run on uprated data from the 2012---13 Family Resources Survey.
45 Source: https://www.gov.uk/government/statistics/council-tax-levels-set-by-local-authorities-in-england-2014-to-2015.
-1.4
-1.2
-1.0
-0.8
-0.6
-0.4
-0.2
0.0
Poorest 2 3 4 5 6 7 8 9 Richest All
Per
cent
age
chan
ge in
net
inco
me
Income decile group
Band E
Band F
Band G
Band H
244

Options for increasing tax
properties) and for bands E, F, G and H (raising £7.7 billion from the top 19.6% of properties).46
Increasing council tax on high-value properties would certainly hit wealthy households hardest. It would also be progressive across the income distribution, though the losers would also include some who lived in big houses but with low current income and who, for one reason or another, were not protected by means-tested council tax support.47 Of course, only a small fraction of the losers from these reforms would fall into that category. And how offensive one finds the idea that such people should lose out depends in part on whether one views people with high wealth but low current income as rich or poor.
Adding new council tax bands
Instead of (or as well as) increasing council tax on existing bands, the government could add one or more new bands at the top, to focus tax increases even more tightly on just the very highest-value properties – as the Welsh government did when it added a band I (paying 21/3 times the band D rate) to its council tax in 2005.
However, with so few properties in band H, the revenue yield from applying higher rates to only a subset of those would be very small unless the tax increase for each affected household were astronomical. There are currently 136,000 properties in England in band H;48 if, say, half of them were put into a new band H+, those 68,000 properties would have to see their council tax bills increase by nearly £15,000 per year on average (over and above what they are paying already) in order to raise £1 billion from this policy.
A ‘mansion tax’
Labour and the Liberal Democrats both propose to introduce a new ‘mansion tax’ on properties worth more than £2 million.
Like council tax, properties would be put into bands, with all properties in a given band liable for the same tax but properties in higher bands charged more.49 The Labour Party, for example, has said that all properties worth between £2 million and £3 million would be charged £3,000 per year, with a series of higher bands for properties above £3 million attracting successively more tax.50
Nobody knows exactly how many properties in the UK are worth more than £2 million, and therefore how much revenue would be raised by different rates of a mansion tax: the last time all properties in the UK were systematically valued was prior to the introduction of council tax in 1993. However, various estate agents have produced their own
46 Source: authors’ calculations using the IFS tax and benefit microsimulation model, TAXBEN, to apply the 2015---16 tax and benefit system to uprated data from the 2012---13 Family Resources Survey. Number of properties in each band from Valuation Office Agency, council tax valuation lists September 2014, https://www.gov.uk/government/statistics/council-tax-valuation-lists-summary-england-and-wales and Scottish Government, council tax data, http://www.scotland.gov.uk/Topics/Statistics/Browse/Local-Government-Finance/DatasetsCouncilTax. Band H figures include 5,420 band I properties in Wales.
47 This would include those who do not take up their entitlements (which we do not model in the figure) and those who are not entitled to council tax support despite their low current income because they have substantial financial assets (which we do model) or because they live in a local authority that has cut this group’s entitlement since council tax support was localised in 2013 (which we do not model). 48 Source: Valuation Office Agency, council tax valuation lists September 2014, https://www.gov.uk/government/statistics/council-tax-valuation-lists-summary-england-and-wales. 49 Note that this banded structure is different from the Liberal Democrats’ 2010 general election manifesto proposal, which was to charge 1% per year of the value of properties worth over £2 million, paid on the value of the property above that level. 50 See http://www.standard.co.uk/comment/comment/ed-balls-a-mansion-tax-will-be-fair-simple-and-pay-to-save-the-nhs-9805924.html.
245

The IFS Green Budget: February 2015
estimates: Savills suggests the figure is 97,000, Zoopla 108,000 and Knight Frank 110,000; Hometrack, a housing market analyst, puts the figure rather lower, at 58,500.51
Regardless of the size of the tax base, the Labour Party has set a revenue target of £1.2 billion,52 implying that the tax rates on properties worth more than £3 million would be set at whatever levels were required to raise the remainder of this revenue after collecting £3,000 for each £2–3 million property. Thus if there were, for example, a total of 97,000 properties worth more than £2 million and 57,000 of those were worth more than £3 million (Savills’s estimates), that would imply that a £3,000 charge on all £2–3 million properties would raise £120 million and properties above £3 million would face an average tax charge of £19,000 to make up the rest of the revenue. Setting a revenue target does not seem like a sensible way to make policy: it is not clear that the appropriate tax rate on high-value properties should be higher if there turn out to be fewer of them than expected, or vice versa.
In practice, the Labour Party’s policy – and so the rate calculations – is more complicated than this. Labour has said that ‘we will look at asking overseas owners of second homes in the UK to make a larger contribution than people living in their only home’.53 It also said that only higher- and additional-rate income tax payers would be required to pay the tax immediately: others would be allowed to defer the tax (with interest accruing on the deferred liability, sensibly) until the property were next sold or until the owner’s death (at which point the tax would be taken from the deceased’s estate alongside any inheritance tax). Again, it is not known exactly how many properties worth more than £2 million are owned by individuals with an income below £42,385 and would therefore have this option to defer paying the tax. And how attractive deferral would be depends on, among other things, the interest rate charged on deferred liabilities (which is yet to be decided) and how likely homeowners thought it was that a future government opposed to the mansion tax might cancel accrued liabilities before they became payable (which is difficult to guess).
As we argued above, there is a strong case for taxing high-value properties more heavily than at present given that they currently attract lower council tax as a proportion of property value. But it is doubtful that adding a new tax on top of the existing system is the best way to achieve that. As noted above, council tax could be reformed to make tax bills more proportional to (1991) property values. Better still, the government could undertake a long-overdue revaluation of all properties and make council tax more proportional to properties’ current values, as proposed in the Mirrlees Review.54 Alternatively, a mansion tax could be integrated with the annual tax on enveloped dwellings (ATED), which is already charged (in a similar banded structure) on residential properties worth more than £2 million but is currently restricted to properties held
51 Savills figure from http://www.savills.co.uk/_news/article/55328/183956-0/11/2014/prime-housing-market---the-ultimate-political-football-; Zoopla from http://blog.zoopla.co.uk/2014/09/23/labours-mansion-tax-proposal-to-place-heavy-burden-on-south-east/; Knight Frank and Hometrack cited in http://www.bbc.co.uk/news/business-29326057. In 2013, the government released its own estimate that there were 55,000 properties worth more than £2 million (Lords Written Answers 25 July 2013, Hansard, column WA240, http://www.publications.parliament.uk/pa/ld201314/ldhansrd/text/130725w0001.htm). However, this was based on older data and given rapid house price growth at the top end of the market the number is likely to have increased substantially since then. For example, Knight Frank’s estimate at the time was 50,000 (http://content.knightfrank.com/research/500/documents/en/taxing-high-value-homes-mansion-tax-1530.pdf) but a year later its estimate had more than doubled to 110,000. 52 http://www.labour.org.uk/blog/entry/six-things-you-need-to-know-about-labours-mansion-tax. 53 http://www.labour.org.uk/blog/entry/six-things-you-need-to-know-about-labours-mansion-tax. 54 Chapter 16 of Mirrlees et al. (2011, op. cit.).
246

Options for increasing tax
through certain ‘non-natural persons’ such as companies and unit trusts.55 Potentially subjecting high-value properties to three separate annual taxes – council tax, ATED and a mansion tax – seems unnecessarily complicated.
Increasing the remittance basis charge for non-domiciled residents
Since 2008, long-term UK residents who are domiciled elsewhere must pay an annual charge (and give up their income tax personal allowance and CGT annual exempt amount) or else be taxed on foreign income and capital gains kept abroad as well as those brought into the UK.56 The charge is currently £30,000 if the person has lived in the UK for seven years, rising to £50,000 after 12 years. The 2014 Autumn Statement announced that, from April 2015, the latter rate would increase from £50,000 to £60,000 and a new £90,000 rate would apply to those who have lived in the UK for 17 years. These changes are forecast to raise around £100 million a year, suggesting that further increases of the same magnitude (to £70,000 and £180,000 respectively) might raise a further £100 million – though in practice this revenue might be eroded if people decide that the charge is so high that they would rather elect to be taxed on their worldwide income instead or else stop being UK-resident. It looks unlikely that really large additional sums could be raised in this way.
10.5 Scaling back tax reliefs
Most of the UK’s major taxes include a range of exemptions and reliefs with a significant revenue cost. Some of these reliefs exist for good policy reasons, but often they favour some groups or activities over others in ways that are inequitable, distort behaviour and complicate the tax system. This section discusses some of the reliefs that might be promising or high-profile targets for a tax-raising government.
Broadening the VAT base
We noted earlier that increasing the main rate of VAT would increase the scale of the distortion towards buying zero- and reduced-rated goods and services instead of standard-rated ones. Another way for the government to increase VAT revenues that would alleviate this distortion would be to extend its scope to cover those items that are currently zero-rated. Food is by far the biggest of these: the zero-rating of (most) food cost the government £17.5 billion in 2014–15. The other main ones and their costs are listed in Table 10.1. The government could also increase the VAT rate on those items that are currently taxed at the lower 5% rate (principally domestic fuel and power) towards the standard rate. As well as reducing the distortion to households’ spending patterns, moving towards a more uniform VAT regime would simplify the system.
55 While ATED currently applies only to properties worth more than £2 million, smaller amounts are due to become payable on properties worth more than £500,000 by April 2016. Further increasing ATED itself could itself be a way to increase revenues from high-value property. The 2014 Autumn Statement increased ATED rates by 50% above normal inflation uprating from April 2015, taking the charge on affected properties in the £2---5 million bracket, for example, to £23,350 instead of £15,600 and raising around £100 million per year. A further increase of the same magnitude could raise a similar sum, but it is clear that only modest additional revenue is available from this source. 56 By default, a person’s domicile is simply the domicile of his or her father (or mother if they were unmarried at the time of birth), though one can change domicile by settling permanently in another country.
247

The IFS Green Budget: February 2015
Table 10.1. Estimated costs of zero-rating, reduced-rating and exempting goods and services for VAT, 2014---15
Estimated cost (£m)
Zero-rating of:
Food 17,450
Construction of new dwellings* 8,300
Domestic passenger transport 4,450
International passenger transport* 300
Books, newspapers and magazines 1,650
Children’s clothing 1,850
Water and sewerage services 2,250
Drugs and supplies on prescription 3,300
Supplies to charities* 300
Certain ships and aircraft 700
Vehicles and other supplies to disabled people 850
Cycle helmets* 10
Reduced rate for:
Domestic fuel and power 4,800
Women’s sanitary products 45
Contraceptive products 10
Children’s car seats 20
Smoking cessation products 20
Energy-saving materials* 40
Certain residential conversions and renovations* 300
Exemption of:
Rent on domestic dwellings* 4,350
Supplies of commercial property* 400
Private education* 3,800
Health services* 2,950
Postal services 200
Burial and cremation 300
Finance and insurance* 4,500
Betting and gaming and lottery duties* 1,850
Exemption for cultural admission charges* 35
Small traders below the turnover limit for VAT registration* 1,900
Total 66,930 * These figures are particularly tentative and subject to a wide margin of error. Note: The figures for all reduced-rate items are estimates of the cost of the difference between the standard rate of VAT and the reduced rate of 5%. Source: HMRC Collection, ‘Tax expenditures, reliefs and ready reckoners statistics’, https://www.gov.uk/government/collections/tax-expenditures-and-ready-reckoners.
248

Options for increasing tax
Figure 10.7. Distributional impact of extending the main rate of VAT to most zero- and reduced-rated items and of raising the same revenue from increasing the main rate of VAT
Note: Income decile groups are derived by dividing all households into 10 equal-sized groups according to income adjusted for household size using the McClements equivalence scale. Expenditure excludes (actual and imputed) housing consumption. Source: Authors’ calculations using the IFS tax and benefit microsimulation model, TAXBEN, run on uprated data from the 2012 Living Costs and Food Survey.
Figure 10.7 shows the distributional impact of extending the main (20%) VAT rate to most of the zero- and reduced-rated goods listed in Table 10.1,57 alongside the distributional impact of raising the same amount of revenue – some £39.0 billion (in 2015–16 terms), or 2.1% of national income – via an increase in the main rate of VAT from 20% to 27.5%. Unlike increasing the main rate of VAT, levying VAT (or more VAT) on those goods currently zero- or reduced-rated would be regressive: poorer households typically devote a larger share of their budgets to these items. However, as Figure 10.7 shows, it is richer households that lose the most in cash terms: although it is a smaller proportion of their budget, they still spend more on these items in cash terms than poorer households. This implies that it would be possible to use some of the revenue raised to compensate poorer households and still have revenue left over. Since this change would raise 2.1% of national income, the government could spend (say) 1.1% of national income on increasing benefits and tax credits to ensure that the poorest did not lose disproportionately or indeed at all (at least on average), and still have reduced the deficit by 1% of national income.
The main disadvantage of such a policy is its effect on work incentives. As discussed in Section 10.3, increasing VAT weakens work incentives since higher prices reduce the value of additional earnings. If the compensation for poorer households takes the form of
57 Note that we do not consider extending the standard rate of VAT to new houses, the portion of international passenger transport that takes place in the UK, and ships and aircraft above a certain size. We consider imposing VAT on goods that are currently classified as exempt (such as insurance and financial services) later.
-6
-5
-4
-3
-2
-1
0
-60
-50
-40
-30
-20
-10
0
Lowest 2 3 4 5 6 7 8 9 Highest All
% o
f ex
pend
itur
e
£ p
er w
eek
Income decile group
Broaden base, £ p.w. (left axis) Increase main rate, £ p.w. (left axis)
Broaden base, % of spending (right axis) Increase rate, % of spending (right axis)
249

The IFS Green Budget: February 2015
increases to means-tested benefits and tax credits, the negative effects on work incentives would be exacerbated. The Mirrlees Review illustrates one way in which it is possible to broaden the VAT base, protect (on average) households that are poor over their lifetimes, and maintain work incentives; sadly, that reform does not raise any net revenue, but its other advantages mean that it would still be very worthwhile.58
Obviously, a move to charging VAT at the full rate of 20% on almost all goods and services would be a huge and controversial change – whether or not accompanied by a substantial compensation package. Clearly, there are smaller steps one could take along the way. For example, imposing a VAT rate of 5% on everything currently zero-rated could raise £8.5 billion (before any offsetting compensation package). Or the government could focus first on one or two cases that look particularly pressing: most notably, recent falls in oil and gas prices might make it an opportune time to end the favourable VAT treatment of domestic fuel and power (again with a suitable compensation package), an effective subsidy which is particularly unwelcome from an environmental point of view.
In addition to the zero- and reduced-rating of goods mentioned above, there are also a number of exemptions from VAT. Exemptions differ from zero rates in that exempt producers cannot reclaim VAT paid on inputs they buy. Exemptions share all the disadvantages of zero rates but are even more damaging because the inability to deduct input tax distorts production patterns in a whole host of ways, from encouraging vertical integration to distorting competition between exempt and non-exempt bodies and between exempt bodies in different countries. Financial services are perhaps the most prominent exemption, costing the exchequer an estimated £4.5 billion in 2014–15. VAT exemptions are mostly mandated at the EU level, so the UK could not unilaterally remove them while remaining an EU member. However, this is an area where reform should be sought at an EU level. In the absence of EU-wide reform, it is less clear whether the UK would be able to impose a regime that is economically equivalent to VAT but levied in a different way.59
Abolishing the transferable income tax allowance for married couples
The Conservatives’ 2010 election manifesto proposed to make part of the income tax allowance transferable for some married couples and civil partners. In April 2015, such an allowance will be introduced, allowing individuals to transfer up to 10% (£1,050 in 2015–16) of their personal allowance to their spouse or civil partner, provided that neither partner is a higher- (40%) or additional- (45%) rate taxpayer. 4.2 million married couples stand to gain from it: one in three married couples or one in four of all couples. The government expects this to cost £515 million in 2015–16, rising to £820 million by 2018–19 as take-up increases.60
A future government could choose to reduce this allowance or to abolish it entirely. This would simplify the tax system, removing the need for taxpayers to understand this relief
58 See chapter 9 of Mirrlees et al. (2011, op. cit.). 59 For a discussion of alternative ways to achieve the same economic outcome as applying VAT to financial services, see chapter 8 of Mirrlees et al. (2011, op. cit.). 60 Number of gainers and costs from pages A5 and A6 of HM Treasury / HMRC, ‘Overview of tax legislation and rates’, March 2014, https://www.gov.uk/government/uploads/system/uploads/attachment_data/file/294190/OOTLAR_19_March_2014__1_.pdf; proportions of married couples and of all couples are authors’ calculations using the IFS tax and benefit microsimulation model, TAXBEN, run on uprated data from the 2012---13 Family Resources Survey.
250
Options for increasing tax
and for HMRC to administer it and removing the £210 jump in tax liability at the higher-rate threshold that means some people can be worse off after a tax rise. The losers would be married couples and civil partners comprising one basic-rate taxpayer and one non-taxpayer. Since couples with two taxpayers or a higher-rate taxpayer do not benefit from the transferable allowance, reducing it would hit low-income families harder on average than a reduction in the personal allowance that raised the same revenue. Indeed, this is the only reform considered in this chapter from which a majority (in fact two-thirds) of the revenue would come from the bottom half of the income distribution – though the losses are not large (at most £210 per year) and are concentrated among lower-middle-income couples rather than the very poorest, since the latter do not have enough income to pay income tax in any case.
Increasing self-employed NICs rates to match rates on employees
The self-employed currently face a far less onerous NICs regime than employees. Whereas employees pay NICs at a rate of 12% on earnings between £153 and £805 per week, the self-employed pay 9% on the corresponding band of earnings plus a flat charge of £2.75 per week.61 More importantly, earnings from self-employment are not subject to employer NICs (paid at 13.8% on employees’ earnings) at all.
This advantage is partly offset by lower entitlements to some state benefits. But HMRC estimates that, even after allowing for these lower entitlements, the net benefit to the self-employed relative to the treatment of employees is some £2.7 billion in 2015–16.62 Since total self-employed NICs revenue in 2015–16 is expected to be £2.6 billion,63 the self-employed as a group are paying less than half of what would put them on a par with employees. Furthermore, the disparity is increasing, as a major reason for the self-employed’s lower benefit entitlements is being removed: they do not accrue state second pension entitlement under the present system, but from April 2016 the basic state pension and state second pension are to be replaced by the single-tier state pension, to which both employees and the self-employed will accrue entitlement. And the exchequer cost of preferential treatment is probably rising as self-employment becomes more prevalent, a trend discussed in Chapter 2.
Increasing NICs rates on self-employment earnings has obvious advantages. It seems unfair to favour the self-employed as the current system does, and inefficient to distort what should be a personal or commercial decision as to whether to enter employment or self-employment.64
On its own, however, it has considerable disadvantages too. It would discourage investment by unincorporated businesses. And it might not be an efficient way to raise
61 Both employee and the self-employed also pay 2% of earnings above the upper earnings limit / upper profits limit. 62 Source: HMRC Statistics, https://www.gov.uk/government/statistics/main-tax-expenditures-and-structural-reliefs, uprated to 2015---16 terms in line with nominal growth in national income. 63 Source: appendix 4 of Government Actuary’s Department, Report by the Government Actuary on the Draft Social Security Benefits Up-Rating Order 2015, the Welfare Benefits Up-Rating Order 2015 and the Draft Social Security (Contributions) (Re-Rating and National Insurance Funds Payments) Order 2015, 2015, https://www.gov.uk/government/uploads/system/uploads/attachment_data/file/396524/46187_GAD_s_Up-rating_Report_accessible_v0.2.pdf. 64 Arguments for preferential tax rates, and counterarguments, are discussed in S. Adam, ‘Taxing employees, the self-employed and small companies’, in E. Wallis (ed.), New Forms of Work, Fabian Policy Report, 2012, http://www.fabians.org.uk/publications/new-forms-of-work-2/ and in C. Crawford and J. Freedman, ‘Small business taxation’, in J. Mirrlees et al. (eds), Dimensions of Tax Design: The Mirrlees Review, Oxford University Press for the Institute for Fiscal Studies, Oxford, 2010, http://www.ifs.org.uk/publications/7184.
251

The IFS Green Budget: February 2015
revenue because self-employment income seems relatively sensitive to tax rates, not least because the self-employed can respond by setting up companies and taking most of their income as dividends, which is generally even more tax-advantaged.65 Increasing tax rates on self-employment would bring them more into line with the taxation of employment, but further out of line with the taxation of companies. Both margins are relevant; their relative importance is an unresolved empirical question.
The Mirrlees Review argued for aligning tax rates between employment and self-employment as part of a wider set of reforms that would also align rates on virtually all sources of income (including, for example, increasing tax rates on dividends and capital gains to bring overall tax rates on corporate-source income into line with those on earnings) and providing more generous allowances for capital investment (a rate-of-return allowance and an allowance for corporate equity) to minimise the discouragement to investment from high tax rates. In the absence of such a wide-ranging reform, increasing tax rates on self-employment income still has considerable appeal but is not unambiguously desirable.
Scaling back pension tax subsidies
A good starting point for the taxation of private pensions would be a system in which contributions to private pensions are free of tax, no tax is levied on any investment returns within the fund, but tax is paid on all pension income when it is received. Such a system would not distort individual decisions over whether to spend or save and would tax income when it was enjoyed rather than when it happened to accrue.
That is very broadly how pension saving (up to the limits discussed in Section 10.4) is currently treated for income tax. But at present, pension saving is subsidised relative to this benchmark in two ways:
• Up to a quarter of a private pension can be withdrawn free of income tax. Since money paid out of a pension fund is generally subject to income tax in return for tax relief on contributions paid into the fund, this quarter of the fund is money that escapes income tax altogether: it is taxed neither when it is earned nor when it is withdrawn from the pension.
• Employer (though not employee) pension contributions are excluded from earnings for both employer and employee NICs, while the pension income they generate is not subject to NICs either. Employer pension contributions are the only major form of employee remuneration that escapes NICs entirely.
The existence of these subsidies is usually defended as being compensation for the fact that pensions are a highly inflexible form of savings, available only after a certain age. If, for reasons of public policy, we want people to lock money away for long periods, we are likely to have to provide them with a good reason for doing so.
This argument looks weaker now that the government is removing many of the restrictions on how accumulated pension savings can be used. But it was never clear that this argument could justify subsidies of this magnitude, or a design that subsidises
65 From April 2015, the uniform corporation tax rate will be 20%, like the basic rate of income tax, and for higher-rate taxpayers dividend taxation brings the total tax rate on distributed profits into line with the higher rate of income tax; but there are no NICs (or equivalent) at all on remuneration taken as distributed profits, a major tax advantage of corporate form. The analysis is somewhat more complicated where there are capital gains.
252

Options for increasing tax
additional pension saving among those who already have a £1 million fund, encourages lump-sum withdrawals rather than annuitisation and treats employer contributions much more favourably than employee contributions. There are at least two possible reforms that could help to address these design flaws while raising significant amounts of revenue.66
First, there is a powerful case for introducing a cash limit on the amount that can be withdrawn from a pension tax-free, at a level considerably below £312,500 (the current level, simply 25% of the £1.25 million lifetime limit on registered pension saving).67 Unfortunately, no reliable current estimate exists of the revenue that this would raise.68
Second, NICs relief on employer pension contributions could be reduced or eliminated. A lot of revenue is at stake here: roughly three-quarters of pension contributions are made by employers, and the government estimates that NICs relief on these contributions cost it £15.2 billion in 2012–13.69 It would be more difficult to levy employee NICs than employer NICs on these pension contributions,70 but an approximation might be attempted; or even levying only employer NICs would have raised an estimated £11.0 billion in 2014–15.71
While this reform would be a major improvement on the current system, the Mirrlees Review argued that, in principle, it would be even better to move towards providing NICs relief on all pension contributions and levying NICs on all pension income, so that NICs treated pensions in the same way as income tax does (with the added advantage of moving further towards the integration of income tax and NICs). One step in that direction would be to start levying some NICs on pension income: each percentage point of NICs levied would raise an estimated £350 million.72 Levying NICs on pension income could compensate retrospectively for the excessively generous NICs relief on employer pension contributions. However, on its own it would imply double taxation of employee pension contributions, levying NICs on both pension contributions and the pension income they generate. This would undermine the legitimate expectations of those who have saved up to now, and would make future employee pension contributions an unattractive option. In the long run, NICs on pension income should be accompanied by NICs relief on employee (as well as employer) pension contributions. The best way to
66 These reforms are discussed more fully in Mirrlees et al. (2011, op. cit.) and in C. Emmerson, ‘Taxation of private pensions’, in C. Emmerson, P. Johnson and H. Miller (eds), The IFS Green Budget: February 2014, http://www.ifs.org.uk/publications/7072. 67 To prevent charges of retrospective taxation, the government could consider exempting pension savings already in place that would exceed the cap. 68 The government previously estimated the total cost of the tax-free lump sum at around £2.5 billion (it was formerly in HMRC Statistics table 7.9, as cited in, for example, footnote 20 of M. Lloyd and C. Nicholson, ‘A relief for some: how to stop lump sum tax relief favouring the wealthy’, Centre Forum, 2011, http://www.centreforum.org/assets/pubs/a-relief-for-some.pdf) but it no longer produces an estimate. Note that this £2.5 billion figure assumed that no one would change their behaviour in response to the reform and that the tax-free lump sums would otherwise be taxed at 20%. Based on this £2.5 billion figure, Lloyd and Nicholson (op. cit.) estimated that restricting the tax-free lump sum to the then higher-rate threshold of £42,475 would raise £0.5 billion per year. 69 Source: HMRC Statistics table PEN6, https://www.gov.uk/government/statistics/registered-pension-schemes-cost-of-tax-relief. 70 The difficulty arises because employer pension contributions would need to be allocated to individual employees, which is difficult for defined benefit pension schemes.
71 Source: HMRC Statistics, ‘Main tax expenditures and structural reliefs’, https://www.gov.uk/government/statistics/main-tax-expenditures-and-structural-reliefs. 72 Page 29 of S. Adam, J. Browne and P. Johnson, ‘Pensioners and the tax and benefit system’, IFS Briefing Note BN130, 2012, http://www.ifs.org.uk/bns/bn130.pdf.
253

The IFS Green Budget: February 2015
mitigate the double taxation problem would be to start providing relief for employee contributions immediately and gradually increase NICs rates on pension income over an extended period. But while this would generate significant revenue in the long run, it would actually cost money up front.
Eliminating capital gains tax reliefs
There are a number of reliefs and exemptions from CGT that a future government seeking to raise money might look towards.
Entrepreneurs’ relief
Entrepreneurs’ relief applies a reduced CGT rate of 10% to capital gains (up to a lifetime limit of £10 million) on certain eligible assets:
• shares in a trading company (or holding company of a trading group) of which the shareholder has been a full-time employee or director, owned at least 5% of the shares and had at least 5% of the voting rights, all for at least a year;
• an unincorporated business (or distinct part of a business), or business assets sold after the individual stops carrying on the business.
HMRC estimates that increasing the CGT rate on qualifying gains by 1 percentage point would raise £60 million.73 In total, entrepreneurs’ relief reduces overall tax liabilities by an estimated £3.3 billion per year, although HMRC argues that abolishing it would yield substantially less than this as people would change their behaviour in response.74 Notwithstanding this caveat, the figure is strikingly large relative to the £200 million estimated cost of entrepreneurs’ relief when it was first introduced in 200875 – partly because the lifetime limit has been gradually increased to £10 million from its initial level of £1 million.
Entrepreneurs’ relief adds complexity to the tax system and creates a range of distortions.76 It is also arguably unfair.77 More generally, the justification for applying lower tax rates to people who own their own business than to the rest of the population seems far from clear.78 In isolation, abolishing entrepreneurs’ relief would weaken the
73 Source: HMRC Statistics, https://www.gov.uk/government/statistics/direct-effects-of-illustrative-tax-changes. 74 Source: HMRC Statistics, ‘Main tax expenditures and structural reliefs’, https://www.gov.uk/government/statistics/main-tax-expenditures-and-structural-reliefs. 75 http://webarchive.nationalarchives.gov.uk/+/http://www.hm-treasury.gov.uk/newsroom_and_speeches/press/2008/press_05_08.cfm. 76 First, it encourages owner-managers of companies to retain profits in the company rather than take them out as dividends or salary, regardless of whether (in the absence of tax considerations) they would rather spend the money or could invest it more profitably elsewhere. Second, it provides a strong incentive to set up a business in which to retain profits, putting pressure on anti-avoidance rules, which attempt to define when companies are ‘artificial’ avoidance devices. Third, it gives companies an artificial incentive to ensure that any individual employee shareholdings are above 5%, rather than below that threshold. And fourth, it gives self-employed individuals and partnerships a large incentive not to sell assets of the business until they are ready to stop doing business altogether, regardless of whether the assets could be more profitably used by others and whether the proceeds of a sale could be more profitably used in other ways. 77 The distortions outlined in the footnote above mean that entrepreneurs’ relief discriminates against owner-managers who cannot afford to retain profits in their business, against self-employed people who choose (or need) to sell business assets before giving up the business altogether and against employees who have shareholdings of less than 5% in the company for which they work. 78 For a fuller development of this argument in a related context, see S. Adam, ‘Taxing employees, the self-employed and small companies’, in E. Wallis (ed.), New Forms of Work, Fabian Policy Report, 2012, http://www.fabians.org.uk/publications/new-forms-of-work-2/.
254

Options for increasing tax
incentive for people to start a business and invest in it. However, it is doubtful that entrepreneurs’ relief is the best way to pursue these goals in any case.79
Forgiveness of CGT at death
Another major CGT relief is ‘forgiveness’ at death. The deceased’s estate is not liable for CGT on any increase in the value of assets prior to death, and those inheriting the assets are deemed to acquire them at their market value at the date of death, so any rise in value that occurs before death escapes tax completely. This cost the exchequer an estimated £490 million in 2012–13 and is highly distortionary.80 It encourages people to hold on to assets that have risen in value, even if in the absence of tax considerations it would be preferable to sell them and use the proceeds in some other way before death. If people expect to be able to bequeath assets on death, it also encourages them to buy assets that yield returns in the form of capital gains and to convert income into capital gains where possible.
Exemption of principal private residences
Rises in the value of principal private residences – people’s main homes – are exempt from CGT. This is by far the biggest relief in CGT: it reduces annual CGT liabilities by an estimated £13.8 billion – more than twice total expected CGT revenue – although the government argues that abolishing it would yield substantially less than this as people changed their behaviour in response.81
As with CGT in general, CGT on principal private residences involves a trade-off. On the one hand, imposing CGT would discourage people from saving – in this case, buying a (bigger) house. On the other hand, it would enable the government to capture a share of any large capital gains and it would reduce distortions between similar assets.82
Like CGT in general, imposing CGT on main homes would generate a ‘lock-in’ effect: people would be artificially discouraged from selling a home that had risen in value, since only when it was sold would a CGT liability be triggered. Discouraging property transactions that would otherwise be mutually beneficial is undesirable, as we discuss in Section 10.6 in the context of stamp duty land tax. This lock-in effect would be exacerbated by the massive political backlash that would almost certainly follow the introduction of CGT on people’s main homes, since if people believed that the policy would be reversed (perhaps by a future government) then they would have an enormous incentive to hold on to the property until this happened. As well as being a distortion in its own right, this could seriously undermine the revenue yield of the reform – further adding to the pressure to reverse the policy.
79 The Mirrlees Review argued that investment can be best encouraged by providing relief for amounts invested, rather than reduced tax rates on actual investment returns: see chapter 15 of Mirrlees et al. (2011, op. cit.). 80 This figure came from a previous version of HMRC Statistics, ‘Main tax expenditures and structural reliefs’. However, HMRC has now stopped providing an estimate and has moved CGT forgiveness at death onto its list of ‘tax reliefs of unknown cost’. 81 Source: HMRC Statistics, ‘Main tax expenditures and structural reliefs’, https://www.gov.uk/government/statistics/main-tax-expenditures-and-structural-reliefs. 82 Most importantly, in this case, imposing CGT on main homes would reduce --- though not eliminate --- the current tax bias in favour of owner-occupation versus rental property, since landlords are subject to both CGT on their properties and income tax on the rent (net of costs) they receive. It is hard to find a coherent rationale for levying CGT on main homes without also levying income tax on the imputed rental income from owner-occupation, the other component of the return to buying a house. Only if this imputed rental income were also taxed --- as it was under Schedule A income tax until 1963 --- would the tax treatment of owner-occupation be brought into line with that of the rental sector.
255

The IFS Green Budget: February 2015
There is a case for reforming the taxation of housing, and the Mirrlees Review argued that the ideal solution in principle would be to introduce a rate-of-return allowance for all housing and fully tax returns to housing investment that exceeded that allowance. But for owner-occupied housing, even that would be difficult in the short run.83 For now, the income tax and CGT treatment of owner-occupied housing is probably better left unchanged.
Widening the inheritance tax net
A case can be made for abolishing inheritance tax completely. But there is also a case for taxing transfers of wealth to the next generation, and if we are to levy such a tax it could be better designed than the existing inheritance tax.
At present, agricultural land and unquoted business assets are exempt from inheritance tax, at a cost to the exchequer of £440 million and £590 million per year respectively.84 While there might conceivably be a case for allowing tax payments to be spread over time where assets received are illiquid and are to be retained by the recipient, it is hard to see any justification for the wholesale exemption of these assets. These reliefs create just the sort of non-neutrality the tax system ought to try to avoid, pushing up the price of agricultural land and of certain offerings on the AIM market, and providing a large incentive to keep businesses going and in the family even if there are good financial reasons for disposing of them sooner – as well as providing an open invitation for people to buy what might otherwise be wholly inappropriate assets purely as a way to avoid inheritance tax (albeit with a minimum holding period of the assets to qualify for relief).
The principal reason that inheritance tax is forecast to raise only £4.2 billion in 2015–16 is that it can be circumvented by the simple expedient of passing on wealth during one’s lifetime. Transfers in the seven years before death are taxed on a sliding scale (from zero for transfers more than seven years before death to the full 40% rate for transfers less than three years before death), but gifts made before that are not taxed at all.85 Those who are able – often the wealthiest – are encouraged to pass on their wealth at a time dictated by the tax system.
A simple option would be to lengthen the seven-year window before death during which lifetime transfers are taxable. For example, in 2007, the Liberal Democrats proposed that only transfers made more than 15 years before death should be exempt, though this was not ultimately adopted for their 2010 general election manifesto.86 Since there are no data on wealth transfers occurring more than seven years before death, we cannot know how much this would raise.
More radically, this could be taken further and inheritance tax reformed to apply at the same rate to transfers made at any time in life, not just at or near death, and to be levied on individuals’ lifetime receipts rather than on the amount an individual gives or bequeaths. The Mirrlees Review argued that, if concern for equality of opportunity justifies taxing transfers to the next generation, a more logical approach than the current
83 See section 16.2.2 of Mirrlees et al. (2011, op. cit.). 84 Source: HMRC Statistics, ‘Main tax expenditures and structural reliefs’, https://www.gov.uk/government/statistics/main-tax-expenditures-and-structural-reliefs. Some types of business and agricultural property are taxed half the normal rate rather than exempt entirely. 85 Certain lifetime transfers into trusts are taxed. 86 Liberal Democrats, Reducing the Burden, Policy Paper 81, 2007.
256

Options for increasing tax
one – albeit with practical challenges of its own – would be to tax individuals at progressive rates on the total amount of gifts and inheritances that they receive over their lifetime.
Abolishing the single occupant’s council tax discount
At present, one-adult households receive a 25% council tax discount. From an economic efficiency point of view, offering a 25% council tax discount to single-person households is distortionary, leading to inefficient use of the housing stock as single-adult households occupy bigger properties, and other households smaller properties, than they otherwise would.
Abolishing the single person’s discount altogether across England, Scotland and Wales (policy on this is a devolved matter) would raise £1.4 billion per year.87 The revenue from reducing or abolishing it would initially go to local authorities in the form of higher council tax yields, though central/devolved governments could choose to appropriate some or all of that by reducing grants to local authorities at the same time.
Scaling back business rate reliefs for small businesses, empty properties and agricultural property
At the moment, business rates are levied at a lower percentage rate on properties with lower estimated market rental values. This is done through a combination of different tax rates for small and large properties and an explicit small business rates relief scheme.88
The rationale for this is not clear. Certainly, there is not a strong distributional argument. Redistributing from firms that occupy large buildings to firms that do not is not necessarily ‘progressive’ in the way that redistributing from rich people to poor people is. Businesses are not people; ultimately, the burden of all taxes is felt by households, and it is not obvious that businesses owning or occupying more valuable premises have shareholders (or, for that matter, employees or customers) who are individually better off than firms with smaller premises. The people whose pension funds invest in Tesco might not be richer than the owner-manager of a corner shop.
Lower business rates for properties with low rateable values is a distortion towards production patterns involving more low-value properties and fewer high-value properties than commercial considerations would dictate in a free market. One could make an argument that, relative to what a free market might produce, there is an additional benefit to wider society from having lots of small business properties rather than fewer large properties. This could be to promote competition in the local market, or because people simply value the existence of (say) a variety of high-street shops even though they would rather shop in a big supermarket (note that if enough people actually preferred to buy things from smaller businesses, the firms should be commercially viable even without preferential tax treatment). But it is not clear whether such concerns are important in practice and, if they are, whether a tax reduction linked specifically to low-value premises is the appropriate tool to address them. Unless the government has a
87 Authors’ calculations using the IFS tax and benefit microsimulation model, TAXBEN, to apply the 2015---16 tax and benefit system to uprated data from the 2012---13 Family Resources Survey. 88 The details vary across Britain and are described in S. Adam and H. Miller, ‘Business rates’, in C. Emmerson, P. Johnson and H. Miller (eds), The IFS Green Budget: February 2014, http://www.ifs.org.uk/publications/7072.
257
The IFS Green Budget: February 2015
clear and powerful argument for preferential taxation of low-value properties, which it has not yet stated, it would be simpler and more efficient to move to a single rate for all properties. Eliminating lower rates and reliefs for low-value properties in England would increase business rates revenues by around £640 million per year.89
At the moment, most empty business properties in England are exempt from business rates for three months and charged full business rates thereafter.90 Empty property relief cost the government £1.0 billion in 2014–15.91 The three-month exemption reduces the incentive to bring properties back into use, while on the other hand charging business rates thereafter encourages the demolition of empty properties. The problem ultimately arises because land without buildings on it is untaxed. That inevitably creates a boundary where business rates start to be charged, leaving governments with an unpalatable choice between creating an incentive to demolish empty properties (if empty properties are taxed) or a disincentive to use properties (if empty properties are exempt). Faced with this choice, it is debatable whether removing this relief would be a good idea. The ideal long-term solution, as the Mirrlees Review argued, would be to tax land value irrespective of what, if anything, is built on it.92
It is hard to see any economic case for exempting agricultural property from business rates. It distorts land use towards agricultural rather than other purposes. The exemption seems to exist for purely political rather than economic reasons and should be ended. But the revenue cost of the exemption is unknown, and the relatively low value of agricultural land means that the tax at stake might not be large.
10.6 Temptations to resist
There are many ill-designed ways in which governments could potentially raise revenue, ranging from an annual wealth tax to a turnover tax, and we do not have space in this chapter to consider them all. In this section, we restrict attention to two possibilities that have been adopted in recent years by the main political parties when in office.
Increasing stamp duty land tax
In 1997, stamp duty was charged on property sales of more than £60,000 at a single rate of 1% (not just the part of the price above £60,000). Both the current coalition government and its Labour predecessor have repeatedly turned to increasing stamp duty land tax (SDLT) as a revenue raiser. Although the restructuring announced in the 2014
89 This long-run effect excludes a further £500 million revenue from ending the supposedly temporary doubling of small business relief that was introduced in October 2010 and has been repeatedly extended since (it is currently due to expire in April 2016). Note that these figures are for business rates receipts; since business rates are a deductible expense for corporation tax and (in the case of unincorporated businesses) income tax, the overall revenue impact would be somewhat smaller than this. Source: Authors’ calculations based on table 2 of DCLG Statistics, ‘Non-domestic rates collected by local councils in England: forecast for 2014 to 2015’, https://www.gov.uk/government/statistics/non-domestic-rates-collected-by-local-councils-in-england-forecast-for-2014-to-2015 and Valuation Office Agency, ‘Central & local rating lists: non-domestic rating in England & Wales’, https://www.gov.uk/government/statistics/central-local-rating-lists-non-domestic-rating-in-england-wales. 90 Industrial premises are exempt for six months, while listed buildings and those with a rateable value below £2,600 are exempt as long as they are empty.
91 Source: DCLG Statistics, ‘Non-domestic rates collected by local councils in England: forecast for 2014 to 2015’, https://www.gov.uk/government/statistics/non-domestic-rates-collected-by-local-councils-in-england-forecast-for-2014-to-2015. 92 See chapter 16 of Mirrlees et al. (2011, op. cit.).
258
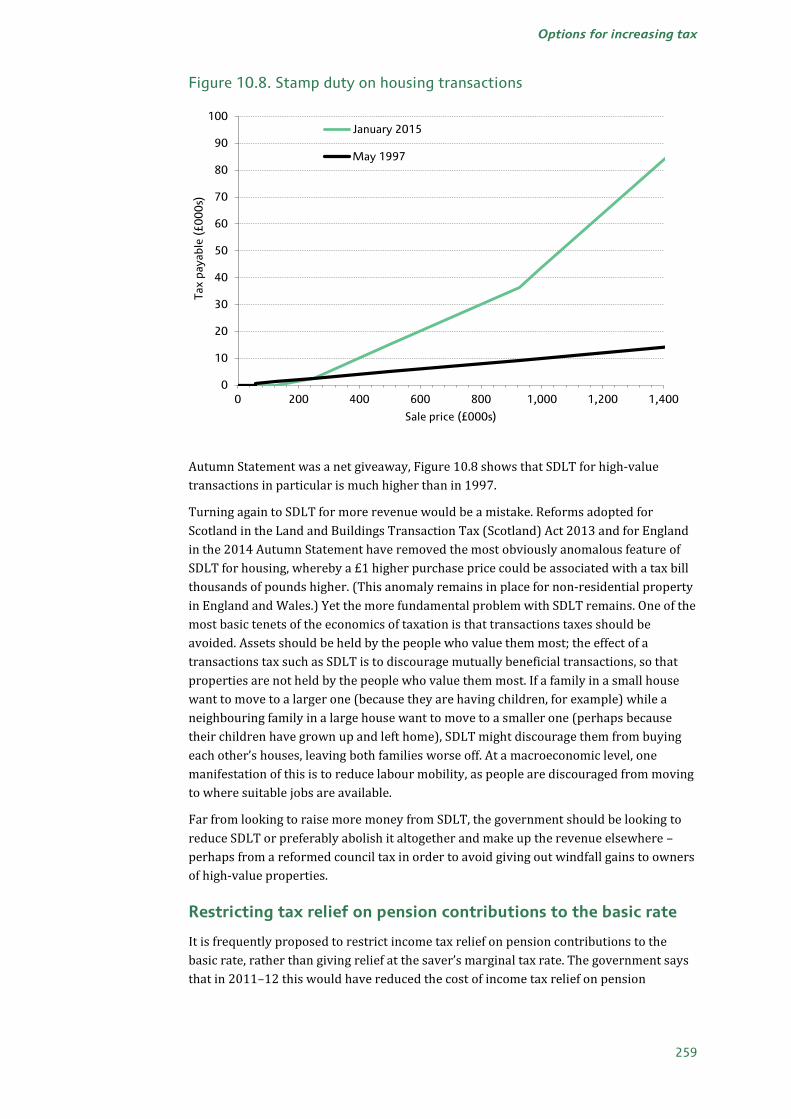
Options for increasing tax
Figure 10.8. Stamp duty on housing transactions
Autumn Statement was a net giveaway, Figure 10.8 shows that SDLT for high-value transactions in particular is much higher than in 1997.
Turning again to SDLT for more revenue would be a mistake. Reforms adopted for Scotland in the Land and Buildings Transaction Tax (Scotland) Act 2013 and for England in the 2014 Autumn Statement have removed the most obviously anomalous feature of SDLT for housing, whereby a £1 higher purchase price could be associated with a tax bill thousands of pounds higher. (This anomaly remains in place for non-residential property in England and Wales.) Yet the more fundamental problem with SDLT remains. One of the most basic tenets of the economics of taxation is that transactions taxes should be avoided. Assets should be held by the people who value them most; the effect of a transactions tax such as SDLT is to discourage mutually beneficial transactions, so that properties are not held by the people who value them most. If a family in a small house want to move to a larger one (because they are having children, for example) while a neighbouring family in a large house want to move to a smaller one (perhaps because their children have grown up and left home), SDLT might discourage them from buying each other’s houses, leaving both families worse off. At a macroeconomic level, one manifestation of this is to reduce labour mobility, as people are discouraged from moving to where suitable jobs are available.
Far from looking to raise more money from SDLT, the government should be looking to reduce SDLT or preferably abolish it altogether and make up the revenue elsewhere – perhaps from a reformed council tax in order to avoid giving out windfall gains to owners of high-value properties.
Restricting tax relief on pension contributions to the basic rate
It is frequently proposed to restrict income tax relief on pension contributions to the basic rate, rather than giving relief at the saver’s marginal tax rate. The government says that in 2011–12 this would have reduced the cost of income tax relief on pension
0
10
20
30
40
50
60
70
80
90
100
0 200 400 600 800 1,000 1,200 1,400
Tax
paya
ble
(£0
00
s)
Sale price (£000s)
January 2015
May 1997
259

The IFS Green Budget: February 2015
contributions by around one-third and that in 2012–13 the total cost of relief on pension contributions was £28.0 billion, implying a yield of about £9.3 billion.93 However, as the government notes, this ignores the substantial change in behaviour that this reform would be likely to engender. In fact, if people’s main response was to reduce their pension contributions, this would tend to increase the yield in the short run by saving the cost of basic-rate relief as well as higher-rate relief, but in the long run this would be offset by reduced revenue from taxing pension income.
Giving everyone the same rate of relief, rather than giving more relief to higher-rate taxpayers, is superficially attractive but fundamentally misguided. The error stems from looking at the tax treatment of pension contributions in isolation from the tax treatment of the pension income they finance. Pension contributions are excluded from taxable income precisely because pension income is taxed when it is received: in effect, the tax due on earnings paid into a pension is deferred until the money (plus any returns earned in the interim) is withdrawn from the fund. It is hard to see how it can be unfair for higher-rate taxpayers to receive 40% relief when basic-rate taxpayers receive 20% relief, yet at the same time not be unfair for higher-rate taxpayers to pay 40% tax on their pension income when basic-rate taxpayers pay only 20%. In more practical terms, restricting the tax relief would also be complicated as it would require the valuation of pension promises made by employers through defined benefit schemes.94
Proponents of the restriction point out that many of those receiving relief at the higher rate will only pay basic-rate tax in retirement.95 The arguments here are more complex. The current system certainly provides an additional incentive for higher-rate taxpayers to save in a pension if they expect to be basic-rate payers in retirement. But, in effect, such individuals are simply smoothing their taxable income between high-income and low-income periods, undoing the ‘unfairness’ that an annually-assessed progressive tax schedule creates by taking more tax from people whose incomes are volatile than from people whose incomes are stable. But even if receiving higher-rate relief and then paying basic-rate tax is seen as unfair, that does not diminish the case for accompanying any restriction of tax relief on contributions with a restriction of the tax on pension income. The tax system should treat pension contributions and pension income in a symmetric way.
The Labour Party proposes to restrict relief to the basic rate only for people with incomes above £150,000. This has the merit of limiting a bad policy to a smaller group of people, and would raise correspondingly less revenue: roughly £1.5 billion, according to HMRC.96
93 Source: total cost of pension tax relief from HMRC Statistics table PEN6, https://www.gov.uk/government/statistics/registered-pension-schemes-cost-of-tax-relief; yield from restricting relief from Written Answer by David Gauke MP to a Parliamentary Question, 6 July 2011 --- ‘If relief on pension contributions were limited to the basic rate of tax, the amount of this relief would fall by approximately one third. This estimate does not take account of behavioural effects, which are likely to be large’ (Hansard, column 1249W, http://www.publications.parliament.uk/pa/cm201011/cmhansrd/cm110706/text/110706w0002.htm). 94 These arguments are developed in more detail in C. Emmerson, ‘Taxation of private pensions’, in C. Emmerson, P. Johnson and H. Miller (eds), The IFS Green Budget: February 2014, http://www.ifs.org.uk/publications/7072. 95 Though the snapshot statistics of the income tax rates facing current pension savers and current retirees often used to illustrate the point are somewhat misleading --- those currently contributing may not necessarily face the same tax rates in retirement as current retirees, not least because of ongoing fiscal drag. 96 The Labour Party itself says that the House of Commons Library puts the revenue yield at between £0.9 billion and £1.3 billion (see http://press.labour.org.uk/post/79110402681/next-labour-government-will-guarantee-starter-jobs). HMRC’s costing of the policy is at https://www.gov.uk/government/uploads/system/uploads/attachment_data/file/391716/Opposition_costing_-_restricting_pensions_tax_relief_for_higher_earners.pdf.
260

Options for increasing tax
But it has even less of a coherent rationale than a more general limit on tax relief: it is hard to see why it should be unfair for those above £150,000 to get tax relief at their marginal rate, but not for other higher-rate taxpayers to do so. Indeed, these very-highest-income individuals are less likely to be only basic-rate taxpayers in retirement, removing one of the principal arguments for restricting relief.97
The Liberal Democrats propose to ‘establish a review to consider the case for, and practical implications of, introducing a single rate of tax relief for pensions, which would be designed to be simpler and fairer and which would be set more generously than the current 20% basic rate relief’.98 The revenue implications of this would obviously depend on the rate of relief chosen. But whatever the rate, it is hard to see how this could be administratively simpler than the current system, and hard to see how it would be fair to give everybody (say) 25% or 30% relief on their pension contributions yet charge some people 20%, some 40% and some 45% income tax on the pension income that is generated.
In summary, then, restricting the rate of income tax relief on pension contributions would be expensive to administer, be unfair and inappropriately distort behaviour. As shown earlier in this chapter, there are far better ways to raise money from well-off people, or to reduce the generosity of pensions taxation, or even to do both at once.
10.7 Conclusion
Table 10.2 summarises the estimated revenue yield (where known) in 2015–16 of the various reforms discussed in this chapter. It also includes a number of other, mostly smaller, measures which space constraints prevent us from discussing fully; these include increases to alcohol and tobacco duties, environmental levies, North Sea taxation and the bank levy, amongst others.
Figure 10.9 shows – for the subset of measures we can model using TAXBEN, the IFS tax and benefit microsimulation model – what share of the revenue raised is contributed by each income decile group, along with each decile group’s share of total income (a useful comparator when looking at income-based taxes) and total expenditure (more useful for looking at expenditure tax reforms). We can see, for example, that the top half of the UK income distribution accounts for 70% of all income but would contribute around 85% of the revenue from an increase in the basic rate of income tax. The figure also shows that, for all measures except the abolition of the transferable income tax allowance for married couples, the highest-income 10% of households would provide more than 10% of the revenue and the higher-income half would provide more than half the revenue. This reflects the fact that almost all taxes and tax increases are paid predominantly by better-off households.
97 This proposal mirrors a policy originally announced in the then Labour government’s 2009 Budget, but never implemented because it was dropped by the incoming coalition government in favour of a reduction to annual and lifetime allowances designed to raise the same amount of money. Labour’s 2009 proposal is discussed in more detail in C. Emmerson, ‘A response to the Treasury consultation on restricting pensions tax relief’, IFS Press Release, 1 March 2010, http://www.ifs.org.uk/publications/4773. 98 See pages 34---5 of https://d3n8a8pro7vhmx.cloudfront.net/libdems/pages/6272/attachments/original/1409941645/Pre-Manifesto_3_Sep_2014.pdf?1409941645.
261

The IFS Green Budget: February 2015
Table 10.2. Revenue yield of possible tax rises in 2015---16
Measure Revenue raised
(£ million) Income tax and NICs
Increase basic rate of income tax by 1 percentage point (ppt) 4,200a
Increase higher rate of income tax by 1ppt 1,200a
Increase additional rate of income tax by 1ppt 100a
Increase main employee and self-employed NICs rates by 1ppt 3,900a
Increase upper employee and self-employed NICs rates by 1ppt 1,000a
Increase employer NICs rate by 1ppt 2,500a,b
Reduce income tax personal allowance by £1,000 p.a. 5,500
Reduce employee and self-employed NICs thresholds by £10 p.w. 1,400
Reduce employer NICs threshold by £10 p.w. 1,400
Reduce personal allowance (and employee NICs threshold) to match employer NICs threshold
14,200
Reduce higher-rate threshold (and UEL) by £5,000 p.a. 3,800
Increase UEL and UPL to £100,000 p.a. 10,100
Freeze all income tax and NICs thresholds for two years 3,700
Freeze all income tax and NICs thresholds for five years 9,900
Apply NICs regime for employees to self-employed 2,700
Apply employee and self-employed NICs above state pension age 890
Abolish NICs employment allowance 1,400
Abolish income tax transferable allowance for married couples 520c
Abolish 0% starting rate of income tax for savings income 140
Double April 2015 increase in non-domiciled residents’ remittance basis charge
100
Indirect and environmental taxes
Increase VAT main rate by 1ppt 5,200a
Increase VAT reduced rate by 1ppt 310a
Increase VAT zero rate by 1ppt 1,700a
Apply VAT main rate to most zero- and reduced-rated goods 39,000
Introduce VAT (or equivalent) on financial services 4,700
Increase insurance premium tax rates by 1ppt 500a
Increase alcohol and specific tobacco duties by 10% 1,100a
Increase fuel duties by 10% 2,600a
Increase vehicle excise duty by 10% 390a
Increase air passenger duty by 10% 240a
Increase climate change levy by 10% 50a
Increase landfill tax by 10% 100a
Corporation tax
Increase rate by 1ppt 1,500a
Increase North Sea supplementary charge by 1ppt 20a
Business rates
Increase by 1ppt 280a
Abolish reduced rates and reliefs for low-value properties 620
Abolish empty property relief 990
Abolish agricultural property exemption Unknown
262

Options for increasing tax
Measure Revenue raised
(£ million) Bank levy
Double rates 2,800a
Pensions taxation
Reduce annual or lifetime limit Unknown
Restrict tax relief on pension contributions to the basic rate 10,000
Restrict relief to basic rate for those with incomes >£150,000 1,500
Abolish 25% tax-free lump sum Unknownd
Extend NICs to employer pension contributions 17,300
Charge 1% employee NICs on pension income 350a
Capital gains tax
Increase lower rate by 1ppt 0
Reduce [sic] higher rates by 1ppt 30
Reduce annual exempt amount Up to 3,500e
Merge annual exempt amount with income tax allowance Unknown
Abolish forgiveness of CGT at death Unknownf
Charge CGT on sale of main homes 13,800
Increase entrepreneurs’ relief rate by 1ppt 60a
Abolish entrepreneurs’ relief 3,300
Inheritance tax
Increase rate by 1ppt 100a
Reduce nil-rate band Up to 20,500g
Abolish business assets exemption 590
Abolish agricultural land exemption 440
Extend 7-year rule Unknown
Housing taxation
Increase council tax rates by 10% 2,300a
Double band H rates 280a
Double band G and H rates 2,000a
Double band F, G and H rates 4,200a
Double band E, F, G and H rates 7,700a
Abolish single occupants’ council tax discount 1,400
Introduce a ‘mansion tax’ in line with Labour Party proposal 1,200
Increase ATED on properties worth >£2m by a further 33% 100a
Increase all residential SDLT rates by 1ppt 1,600a a These revenue estimates can be scaled (within reason) to estimate the yield of larger or smaller changes. b See footnote 7 for details. c Rising to £820 million by 2018---19. d The government previously estimated the yield at £2.5 billion but no longer publishes an estimate. e A £500 reduction raises £20 million but the yield from larger reductions will be more than proportional. f The government previously estimated the yield at £490 million but no longer publishes an estimate. g A £5,000 reduction raises £100 million but the yield from larger reductions will be more than proportional. Note: Revenue estimates for other years adjusted in line with nominal growth in national income where appropriate to express in 2015---16 terms. Revenue estimates from different sources vary in what, if any, allowance is made for behavioural response. See text for further details. Source: See the next page.
263

The IFS Green Budget: February 2015
Source to Table 10.2 Authors’ calculations using: HMRC’s ‘Tax expenditures, reliefs and ready reckoners statistics’, https://www.gov.uk/government/collections/tax-expenditures-and-ready-reckoners; various HM Treasury Budget documents; DCLG, ‘National non-domestic rates collected by local authorities in England 2014 to 2015’, https://www.gov.uk/government/statistics/non-domestic-rates-collected-by-local-councils-in-england-forecast-for-2014-to-2015; Valuation Office Agency, ‘Central & local rating lists: non-domestic rating in England & Wales’, https://www.gov.uk/government/statistics/central-local-rating-lists-non-domestic-rating-in-england-wales; S. Adam, J. Browne and P. Johnson, ‘Pensioners and the tax and benefit system’, IFS Briefing Note BN130, 2012, http://www.ifs.org.uk/bns/bn130.pdf; HM Treasury’s opposition policy costings, https://www.gov.uk/government/publications/hm-treasurys-opposition-policy-costings; and the IFS tax and benefit microsimulation model, TAXBEN, run on uprated data from the 2012---13 Family Resources Survey.
Should the next government decide to follow the well-trodden path of increasing taxes following the general election, the simplest way to raise a large amount of revenue would be to increase rates of the three main taxes – income tax, NICs and VAT. Small increases in these taxes could raise relatively large sums, because they are spread across a lot of people. Of these, increasing VAT would be the least progressive (while still somewhat progressive, contrary to popular perception), but also the least damaging to work incentives. Each of these would also involve exacerbating another existing distortion in the tax system – to savings decisions, to the troublesome labour/capital distinction or to consumption patterns. Increasing rates of corporation tax, council tax, business rates or fuel duties also offers the potential to raise significant sums, though the recent trend has been to reduce rates of these taxes.
A relatively small number of high-income households already provide a large share of tax revenue, reflecting tax structures as well as unequally distributed resources, and have also experienced the biggest tax rises from the fiscal consolidation to date. If the next government wants to continue to target tax increases on the best-off, a straightforward way to do so would be to increase rates of income tax, NICs or CGT for those with high incomes. Yet the fact that these changes affect small and relatively responsive groups of individuals means that raising a given amount of revenue would entail much bigger increases in tax rates – and more damage to incentives – among those affected than increases in broader-based taxes. Extending high tax rates to a broader section of society might therefore have greater revenue-raising potential while still hitting mostly the well-off.
Raising inheritance tax, reducing the limits on tax-free pension saving and introducing a ‘mansion tax’ on high-value properties would also be options. Yet there exist better alternatives to each of these measures with a similar underlying rationale. If the government believes that bequests ought to be taxed, it is not clear why gifts made throughout life should not be treated in the same way. Further reducing the amount that can be saved in a registered pension scheme is inferior to reducing the large and ill-designed subsidies that pension saving currently receives even among those who already have large pension funds. Finally, introducing a separate ‘mansion tax’ would be unnecessarily complicated when council tax could be brought up to date and refocused on higher-value properties.
Almost all the UK’s major taxes include costly reliefs which often (though not always) favour some groups or activities over others in ways that are inequitable, distort behaviour and complicate the tax system. These include zero and reduced rates of VAT on certain goods; preferential NICs treatment of self-employment income and employer pension contributions; inheritance tax and business rates reliefs for agricultural
264

Options for increasing tax
Figure 10.9. Distributional impact of possible tax rises
Note: NICs ‘employee’ rate increases are for employee and self-employed rates. Income decile groups are derived by dividing all households into 10 equal-sized groups according to income adjusted for household size using the McClements equivalence scale. Income excludes imputed rental income from owner-occupied housing; expenditure excludes (actual and imputed) housing consumption. See text for further details. Source: Authors’ calculations using the IFS tax and benefit microsimulation model, TAXBEN, run on uprated data from the 2012---13 Family Resources Survey and the 2012 Living Costs and Food Survey.
0% 10% 20% 30% 40% 50% 60% 70% 80% 90% 100%
Share of income
Share of expenditure
IT: increase basic rate
IT: increase higher rate
IT: increase additional rate
NICs: increase employee main rates
NICs: increase employee upper rates
NICs: increase employer rate
IT: reduce personal allowance (£1,000 p.a.)
NICs: reduce employee threshold (£10 p.w.)
NICs: reduce employer threshold (£10 p.w.)
NICs: raise UEL/UPL to £100,000 p.a.
Cut higher-rate threshold and UEL (£5,000 p.a.)
Reduce personal allowance to NICs threshold
Freeze all IT & NICs thresholds for 2 years
Freeze all IT & NICs thresholds for 5 years
NICs: tax self-employed as employees
NICs: apply above state pension age
IT: abolish transferable allowance
VAT: increase main rate
VAT: increase reduced rate
VAT: increase zero rate
Increase insurance premium tax rate
Increase alcohol & tobacco duties
Increase fuel duties
Increase vehicle excise duty
Council tax: increase all rates
Council tax: increase band H rate
Council tax: increase band G and H rates
Council tax: increase band F, G and H rates
Council tax: increase band E, F, G and H rates
Council tax: cut single-occupancy discount
Proportion of revenue contributed
Poorest 2 3 4 5 6 7 8 9 Richest
265

The IFS Green Budget: February 2015
property; capital gains tax relief for owner-managed businesses and for assets bequeathed at death; reduced business rates for low-value properties; and a council tax discount for sole occupants. In most cases, removing these reliefs would leave the tax system simpler and more efficient than simply increasing tax rates – though policymakers must also decide where they want the burden of any tax increases to fall.
Without making distributional value judgements of our own, we cannot say what would be the best way to raise additional revenue. But we can highlight some tax rises that should definitely be avoided. Stamp duty land tax is a particularly damaging tax and recent governments’ tendency to turn to it for more revenue should be resisted. And while there are sensible ways to raise more revenue from the taxation of pension saving, the widespread proposal to restrict income tax relief on pension contributions to the basic rate is misguided.
If a future government does decide to raise taxes, much attention will doubtless focus on the size of the increase. But the design of taxes matters hugely. How the government chooses to raise a given amount of additional revenue would affect both the distribution of the burden across the population and the pattern of economic activity. Tax rises could exacerbate the weaknesses of the current tax system or begin to eliminate them. The consequences of tax increases depend on their quality as well as their quantity.
266