options for taxing the better-off1 - ifs
TRANSCRIPT

245
© Institute for Fiscal Studies, 2013
9. Broad shoulders and tight belts:
options for taxing the better-off1
Stuart Adam, Carl Emmerson and Barra Roantree (IFS)
Summary
A stated aim of many government ministers is to ensure that the well-off bear the
greatest burden of fiscal consolidation. They tend to be less forthcoming about who
they consider to be ‘rich’ or ‘well-off’. Are they referring to a judgement about
people’s wealth or their income?
Tax payments are already very concentrated on those with the highest incomes, and
the fiscal consolidation so far has hit those right at the top of the income
distribution (though not the remainder of the top half) harder than those in the
bottom half.
The burden of increases in all rates of income tax, National Insurance contributions
(NICs) or (to a lesser extent) VAT would fall disproportionately on those in the top
half of the income distribution. Such increases would affect many of those in the
upper-middle of the income distribution who have so far been spared much of the
pain of tax and benefit reforms introduced as part of the fiscal consolidation.
The most obvious way of targeting a tax rise at higher-income individuals would be
to increase the higher rate of income tax or the additional rate of NICs. Either could
raise significant amounts, with the losses concentrated among those in the highest-
income tenth of the population.
Many unattractive alternatives exist that could raise revenue from those with high
incomes and/or high wealth. A wealth tax would have major economic and practical
disadvantages. Restricting income tax relief on pension contributions would be
expensive to administer, be unfair and inappropriately distort behaviour. Stamp
duty land tax (SDLT) is wholly ill-conceived and increasing it makes it worse.
There are, however, more attractive options. Forgiveness of capital gains tax (CGT)
at death and inheritance tax (IHT) reliefs for business assets, agricultural land and
gifts made more than seven years before death are highly distortionary. The tax-
free lump sum on private pensions is badly targeted, and the NICs treatment of
employer pension contributions is excessively generous. Proposals for a ‘mansion
tax’ have a sensible logic underpinning them, but it would be better to make council
tax proportional to up-to-date property values.
Many of the existing taxes examined in this chapter – CGT, IHT SDLT and council tax
– could be improved in a way that both makes them more efficient and, if so
desired, raises more revenue from the rich. It would be sensible to look at reforming
these taxes before considering the introduction of new ones.
1 The Green Budget 2013 is funded by the Nuffield Foundation

The IFS Green Budget: February 2013
246
9.1 Introduction
The way in which the burden of fiscal consolidation should be distributed across the
population is a central theme in current political discourse. The Chancellor of the
Exchequer, George Osborne, in his speech to the 2012 Conservative Party conference,
pledged that ‘the broadest shoulders will continue to bear the greatest burden’.2 Deputy
Prime Minister Nick Clegg, in his speech at last year’s Liberal Democrats party
conference, said, ‘the key question we will all have to answer is who will have to tighten
their belts the most? Our position is clear. If we have to ask people to take less out or pay
more in, we’ll start with the richest and work our way down, not the other way around’.3
However, it is rarely clear from such statements which types or groups of individuals or
households are considered as possessing the broadest shoulders. An important
distinction frequently missed in such discussions is that between wealth and income.
Wealth is a ‘stock’ measure, the total amount of assets held at a particular point in time.
Income, on the other hand, is a ‘flow’ measure, an amount received in a particular period
of time. It is entirely possible for a wealthy individual to have a low current income or for
someone with a high current income to have little wealth.
The absence of a clear statement of intent as to what types of people the government feels
should be bearing the greatest burden makes it hard to identify the most appropriate
policy measures. In terms of scale, taking £10 billion a year from 10% of households
would imply an average increase in tax of £3,800 per year among those affected. Such
large potential amounts highlight the importance of using a sensibly-designed, well-
targeted tax instrument, since otherwise there is considerable scope for undesirable and
unnecessary distortions and for households being affected (or unaffected)
inappropriately.
This chapter discusses the ways in which more revenue can be raised from the better-off
in society, however defined, and the complications and trade-offs that arise. Section 9.2
describes the current distribution of income and wealth. Section 9.3 provides some
details of the extent to which the tax system currently takes from those with higher
incomes. Section 9.4 outlines how the burden of fiscal consolidation has been borne so
far. The chapter then turns to examine different measures that would take, on average,
more from the better-off than from other groups. Section 9.5 looks at options using
broad-based increases in the three main taxes on income and spending. Section 9.6
examines increases in the rates of income tax and National Insurance contributions
targeted at those on higher incomes. Section 9.7 examines capital gains tax, Section 9.8
considers the tax treatment of private pensions and Section 9.9 examines possible taxes
on wealth and housing. Section 9.10 concludes.
9.2 How much do the better-off have?
This section provides a description of the distributions of income and wealth and outlines
how the composition of that income and wealth varies across their respective
distributions.
2 http://www.cpc12.org.uk/Speeches/George_Osborne.aspx.
3http://www.libdems.org.uk/speeches_detail.aspx?title=Nick_Clegg%E2%80%99s_speech_to_Liberal_Democ
rat_Autumn_Conference&pPK=8e54e7cf-41d4-4476-b393-fd4cdf7e2d40.

Broad shoulders and tight belts: options for taxing the better-off
247
Income
Figure 9.1 divides households into 10 equal-sized groups (decile groups) according to
their income after direct taxes and benefits adjusted for household size. The solid line
shows the estimated average household income of each decile group of the income
distribution after adding all state benefit entitlements and deducting tax liabilities
including indirect taxes on what they spend. The bars in the figure decompose this
measure of household income into gross earnings, other private income, state pensions
and other benefits, and, as a negative number, taxes.
Figure 9.1. The distribution and composition of household income,
2013–14
Notes: Income decile groups are derived by dividing all households into 10 equal-sized groups according to
income after direct taxes and benefits, adjusted for household size using the McClements equivalence scale.
Assumes full take-up of benefits and tax credits. ‘Taxes’ includes income tax, employee National Insurance
contributions, VAT, excise duties and council tax; it excludes most ‘business taxes’ (notably corporation tax,
business rates and employer National Insurance contributions) and capital taxes (notably inheritance tax,
capital gains tax and stamp duties).
Source: Authors’ calculations using the IFS tax and benefit microsimulation model, TAXBEN, to apply the
2013–14 tax and benefit system to uprated data from the 2010 Living Costs and Food Survey.
Across all households, average gross (i.e. private) income is around £592 per week. The
highest-income tenth of households have an average gross income of more than three
times this, £1,869 per week (almost £100,000 per year); they receive nearly a third of
total private income. Indeed, the private income of the top decile is 80% higher than that
of the second-highest decile group. While earnings from employment and self-
employment make up, on average, 56% of gross income for the population as a whole
(£331) – the remainder coming primarily from private pensions, other savings and
investment income, and maintenance payments – that figure is a little higher for the
highest-income decile group, at 62%. The highest-income tenth, of course, pay much
more than average in taxes (£740 per week rather than £247) and receive much less in
state pensions and other benefits (£39 rather than £135). So, after accounting for all
these taxes and benefits, the average income after (direct and indirect) taxes and benefits
of the highest-income decile group is £1,167 per week (just over £60,000 per year), a
little under two-and-a-half times the average for all households (£479 per week).
-£1,000
-£500
£0
£500
£1,000
£1,500
£2,000
£2,500
Poorest 2 3 4 5 6 7 8 9 Richest All
£ p
er
we
ek
Income decile group
Taxes
State pensions & other benefits
Other private income
Gross earnings
Income after all taxes and benefits

The IFS Green Budget: February 2013
248
Table 9.1. Weekly net income amounts required for example household
types to be in each income decile
Lower weekly net income limit
Income decile group
Couple without children
Couple with two
children aged 8–10
Single person without children
Lone parent with two
children aged 8–10
2 £270 £395 £165 £289
3 £319 £466 £195 £342
4 £363 £530 £221 £388
5 £406 £592 £247 £434
6 £461 £673 £281 £493
7 £525 £766 £320 £562
8 £608 £888 £371 £651
9 £721 £1,053 £440 £772
Richest £929 £1,357 £567 £994
Note: Based on the McClements equivalence scale.
Source: As Figure 9.1.
There is also considerable income inequality within the top decile of the income
distribution. Because of a small number of extremely high-income households, the
average (mean) income in the top decile group (adjusted for household size) is 14%
higher than that of the middle household in that decile group and 41% higher than that of
the lowest-income household in the group.
Because the income deciles used in Figure 9.1 are based on household incomes adjusted
for household size, the income required to be in each decile group depends on household
size. The minimum income required to be in each decile of the income distribution are
shown for some example household types in Table 9.1. To be in the highest-income tenth
of the population, a couple without children would need an income (after direct taxes and
benefits) of £929 per week (£48,300 a year). The equivalent figures are £1,357 per week
for a couple with two children, £567 per week for a single person without children and
£994 per week for a lone parent with two children. This means that a single person on
gross earnings of more than £41,000 per year would be in the top decile, whereas for a
one-earner couple with two children aged 8–10 the equivalent figure is £119,000.4 This
highlights the extent to which hitting households in the highest-income tenth of the
population would be affecting groups that might not be considered very rich or,
equivalently, that measures focused on the super-rich would hit fewer households than
might be expected.
Wealth
Wealth is more unequally distributed than income. The wealthiest tenth of households
own an estimated £4.5 trillion between them, 44% of the nation’s aggregate household
wealth; the bottom half put together own barely £1 trillion.5,6 Figure 9.2 shows that, while
4 Assumes no income except earnings, and living in a band D property in a local authority setting the England
and Wales average band D council tax rate of £1,429 per year.
5 Source: authors’ calculations from figure 3 of ONS Wealth in Great Britain Wave 2, 2008-2010 (Part 2)
(http://www.ons.gov.uk/ons/rel/was/wealth-in-great-britain-wave-2/2008-2010--part-2-/report--chapter-2--total-wealth.html).

Broad shoulders and tight belts: options for taxing the better-off
249
on average household wealth is £420,000, among the wealthiest tenth the average wealth
holding is 4.4 times higher, at £1,820,000. Figure 9.2 also shows that wealth holdings are
dominated by pensions and housing, which together account for four-fifths of household
wealth. Across the whole population, pension wealth is 46% of the total and net housing
wealth a further 33%: the middle 40% of households (the 4th to 7th decile groups) have
more net housing wealth than pension wealth, on average, but the richest decile group’s
pension rights are more than twice as valuable as their housing.
Figure 9.2. The distribution and composition of net household wealth,
2008–10
Note: Deciles are derived by dividing all households into 10 equal-sized groups according to their wealth.
Source: Figure 3 of ONS Wealth in Great Britain Wave 2, 2008-2010 (Part 2)
(http://www.ons.gov.uk/ons/rel/was/wealth-in-great-britain-wave-2/2008-2010--part-2-/report--chapter-2-
-total-wealth.html), divided by number of households from volume 1, page 4 of the Wealth and Assets Survey
User Guide (http://www.ons.gov.uk/ons/guide-method/method-quality/specific/economy/wealth-and-assets-
survey/wealth-and-assets-survey---user-guidance/index.html).
Much of the difference in wealth between households is simply a result of their being at
different stages of their lives. People typically save during their working life and then run
down their assets in retirement. This would create the appearance of substantial cross-
sectional inequality of wealth even if there were no inheritances and everyone followed
the same earnings and spending trajectories over their lives. Indeed, of those households
in the top decile group of the wealth distribution, nearly two-thirds (64.7%) are headed
by an adult aged 45 to 64, while half (51.6%) of households in the bottom half of the
wealth distribution are headed by someone aged under 45.7 Figure 9.3 provides further
evidence that households do indeed reach their peak wealth in the run-up to retirement,
with households headed by someone aged 55–64 having mean wealth of £709,600 and
6 The measure of wealth used here includes private pension wealth, housing wealth (net of mortgages),
financial wealth (net of debts) and physical wealth (cars, jewellery, household goods, etc.). This excludes some forms of wealth that one might arguably want to include: accrued state pension rights, expected future inheritances, and most importantly ‘human capital’, which will be the most valuable asset of many younger people.
7 Source: http://www.ons.gov.uk/ons/rel/was/wealth-in-great-britain-wave-2/wealth-of-the-wealthiest--
2008-10/wealth-of-the-wealthiest-households--great-britain--2008-10.html#tab-The-South-East-has-biggest-share-of-the-wealthiest-households.
-£500,000
£0
£500,000
£1,000,000
£1,500,000
£2,000,000
Poorest 2 3 4 5 6 7 8 9 Richest All
Wealth decile group
Private pension wealth
Physical wealth (cars, jewellery, household goods, etc.)
Financial wealth (net)
Property wealth (net)

The IFS Green Budget: February 2013
250
median wealth of £430,800.8 But it also shows substantial wealth inequality even within
age groups: among households in the 55–64 age bracket, for example, a quarter have
more than £881,000 of net assets while a quarter have less than £172,000.
Figure 9.3. Distribution of net household wealth by age, 2008–10
Note: Includes private pension wealth but excludes state pension rights. The authors would like to thank the
ONS for providing these data.
Source: Office for National Statistics, using data from the Wealth and Assets Survey 2008–10 (data request
reference 001035, available from http://www.ons.gov.uk/ons/about-ons/what-we-do/publication-
scheme/published-ad-hoc-data/economy/january-2013/index.html).
9.3 How much do the better-off pay in tax?
Underlying any informed discussion of what additional contribution to fiscal
consolidation might be made by the better-off in society is some idea of how much they
already contribute.
One tax on which detailed statistics are available is income tax. HMRC estimates that, in
2012–13, 55% of all income tax will be paid by the top 10% of income tax payers and
24% will be paid just by the top 1% of taxpayers.9 Since income tax payers make up less
than three-fifths of the UK’s adult population,10 these contributions are actually coming
from the top 5.8% and 0.58% of individuals respectively. This extreme concentration of
income tax payments among a small number of people is partly a reflection of the
progressivity of the income tax system and partly a reflection of the fact that private
income is very unequally distributed, as shown in Figure 9.1. The degree to which income
tax revenues come from a small percentage of individuals has grown over time: the top
10% of income tax payers have seen their share of total liabilities grow from 35% to 55%
between 1978–79 and 2012–13, while the top 1% of taxpayers have seen their share
8 Variation in the distribution of wealth by age may also reflect differences between cohorts in the
distributions of earnings, inheritance and gifts at a given age. Separating these out would require tracking the wealth of the same people over the course of their life cycle.
9 Source: HMRC Statistics table 2.4 (http://www.hmrc.gov.uk/statistics/tax-statistics/table2-4.pdf).
10 There are forecast to be 29.7 million taxpayers in 2012–13 (HMRC Statistics table 1.4,
http://www.hmrc.gov.uk/statistics/taxpayers/table1-4.pdf) while the total number of individuals aged 16 or over in 2012 is projected to be 51.4 million (ONS national population projections, http://www.neighbourhood.statistics.gov.uk/HTMLDocs/2010-based_NPP_downloadable_tables.html).
£0
£100,000
£200,000
£300,000
£400,000
£500,000
£600,000
£700,000
£800,000
£900,000
£1,000,000
16–24 25–34 35–44 45–54 55–64 65–74 75–84 85+
Age of household head
Mean
3rd quartile
1st quartile
Median

Broad shoulders and tight belts: options for taxing the better-off
251
increase from 11% to 24% over the same period.11 These developments are particularly
notable given that top tax rates have fallen substantially since the 1970s, when the top
rate stood at 83%.
But while income tax is the government’s single biggest revenue raiser, forecast to bring
in £154 billion in 2012–13, it still accounts for barely a quarter of total revenues.12 And
since it is much more progressive than the other two big taxes – National Insurance
contributions (NICs) and VAT – focusing on income tax alone can give a misleading
impression of how much tax revenue is contributed by the richest.
Figure 9.4 shows the shares contributed to a much wider range of taxes, which together
make up over three-quarters of total tax revenue.13 The solid green line shows the
cumulative shares of total taxes paid by households ranked from richest to poorest in
terms of income. Thus the highest-income 20% of households together pay just under
half of these taxes, and the higher-income half of households contribute just over three-
quarters.
The dashed green line instead ranks households by the amount of tax they pay. This
shows that the top 20% of taxpayers of these taxes contribute 54% of the revenue raised
from these taxes and that the top half of taxpayers contribute 85% of the revenue.14
Figure 9.4. Cumulative shares of tax liability with and without deducting
benefit entitlements, 2013–14
Note: As Figure 9.1, with taxes paid also including employer NICs.
Source: As Figure 9.1.
11 1978–79 figures from Inland Revenue Statistics 1994.
12 Source: table 4.6 of Office for Budget Responsibility, Economic and Fiscal Outlook, December 2012
(http://cdn.budgetresponsibility.independent.gov.uk/December-2012-Economic-and-fiscal-outlook23423423.pdf).
13 These taxes are income tax, employer and employee NICs, VAT, excise duties and council tax. By far the
biggest taxes omitted are corporation tax and business rates, which are difficult to allocate to particular households, while most capital taxes (capital gains tax, inheritance tax and stamp duties) are also excluded.
14 Note that the dashed green line can never be below the solid line – by definition, the 30% (say) biggest
taxpaying households must be paying at least as much as the 30% highest-income households (or any other 30% of households) – but the fact that the two lines are so close together indicates that the highest-income households in fact correspond quite closely to the highest-taxpaying households.
0%
20%
40%
60%
80%
100%
120%
140%
160%
Top 10%
20% 30% 40% 50% 60% 70% 80% 90% 100% (all)
Cu
mu
lati
ve
pe
rce
nta
ge
co
ntr
ibu
ted
Percentage of households (classification varies by line)
% of tax paid by highest-income households
% of tax paid by biggest taxpayers
% of tax-minus-benefits paid by highest-income households
% of tax-minus-benefits paid by biggest net taxpayers

The IFS Green Budget: February 2013
252
The solid and dashed grey lines look at taxes net of benefit entitlements. They show that,
for example, the highest-income 20% of households contribute over 80% of these tax
revenues net of benefits, while the 20% of households that pay most tax (net of benefits)
contribute 98% of these tax revenues net of benefit receipt.15 In total, at any one time,
two-thirds of households pay more in these taxes than they receive in benefits with one-
third receiving more in benefits than they pay in these taxes (many of whom will be
pensioners receiving the state pension and not paying any NICs).
Figure 9.4 tells us about the share of tax revenue that comes from high-income
households. Unfortunately, data limitations mean that little is known about the share that
comes from high-wealth households. We must also be careful in how we interpret a
snapshot of how taxes paid at a particular point in time relates to income at that point in
time. Ideally, we would like to know how lifetime taxes relate to lifetime incomes, but
those are not directly observable. A snapshot measure of taxes by income is a particularly
poor guide to lifetime distributional effects in the case of indirect taxes: some people with
low current incomes will nevertheless have high lifetime incomes and might therefore
feel they can afford to spend a lot (paying a lot in VAT and other indirect taxes) at the
same time that their income is low.
The analysis above does not include all taxes. Some of the smaller taxes omitted are very
much concentrated on the better-off. In 2009–10 (the latest year for which detailed data
are available), more than two-thirds of inheritance tax was paid by the 3,500 estates
(equivalent to 0.6% of deaths) valued at more than £1 million; in 2010–11, more than half
of all individuals’ capital gains tax liabilities came from just 3,000 people who realised
gains of more than £1 million.16 There is also a bigger set of taxes for which the burden is
very hard to assign to particular households at all, such as corporation tax, business rates
and stamp duty on shares. In addition, a comprehensive assessment of the distributional
impact of government policy would need to consider who benefits from spending on
public services and by how much.
9.4 How much have the better-off contributed to the
fiscal consolidation to date?
Chapter 7 gives a detailed assessment of the distributional impact of the tax and benefit
reforms introduced since the start of 2010 as part of the ongoing fiscal consolidation. As
the authors show, those in the highest-income tenth of the population have, on average,
been hardest hit by consolidation measures as a percentage of income. This is due to
measures such as increases to NIC rates, real-terms cuts to the higher-rate income tax
threshold and the withdrawal of Child Benefit from families with a higher-income
individual. In addition, some of those on the highest incomes will have lost considerably
from the introduction of the 45% top income tax rate (via 50%) on incomes above
15 Note that, since benefit entitlements can exceed tax payments, these measures can go above 100%: thus
the highest-paying 60% of households contribute 147% of net revenues (and the highest-income 60% contribute 118%) in order to pay for the other four decile groups being net recipients from the state on average.
16 Sources: HMRC Statistics tables 12.3 (inheritance tax;
http://www.hmrc.gov.uk/statistics/inheritance/table12-3.pdf) and 14.2 (capital gains tax; http://www.hmrc.gov.uk/statistics/capital-gains-tax/table14-2.pdf); number of deaths from ONS Vital Statistics: population and health reference tables, winter 2012 update (http://www.ons.gov.uk/ons/publications/re-reference-tables.html?edition=tcm%3A77-283563).

Broad shoulders and tight belts: options for taxing the better-off
253
£150,000, the withdrawal of the personal allowance for those with an income in excess of
£100,000 and reductions in the amount that can be contributed tax-free to a pension.
Once we look beyond the highest income decile, however, it does not appear that those
with the broadest shoulders have borne the greatest burden. The remainder of the top
half of the income distribution (the 6th to 9th decile groups) have lost much less as a
percentage of income than the bottom half. These upper-middle income groups have been
less affected by benefit cuts than those in the bottom half of the income distribution. They
have also been the primary beneficiaries from successive increases in the income tax
personal allowance. As noted by Browne (2012) at the time that one of these increases
was announced, ‘the common assertion that increasing the personal allowance is
progressive is true if one considers the gains across individual income tax payers. It is not
true if one considers the gains across all families as relatively few of the poorest families
contain a taxpayer and two-earner couples gain twice as much in cash terms as one-
earner families’.17
9.5 Options: broad-based tax increases on income
and spending
If the government wanted to increase the amount of revenue raised from relatively well-
off households, one straightforward approach would be to increase the rates of the main,
broad-based taxes. This could raise significant sums. HMRC estimates that a 1 percentage
point rise in all income tax rates would raise £5.7 billion, a 1 percentage point rise in all
rates of employee and self-employed NICs would raise £4.7 billion and a 1 percentage
point rise in the main rate of VAT would raise £5.3 billion.18 Figure 9.5 illustrates the
distributional impact of each of these as a percentage of household income. While such
changes may not be among those normally considered when thinking about taxing ‘the
rich’, it is clear from the figure that, for income tax and NICs at least, simple changes such
as these take much more, even as a percentage of income, from those in the upper parts of
the income distribution than from others. While the biggest losses would be among the
top decile, such changes would also affect many of those in the upper-middle of the
income distribution, who have so far been spared much of the pain of tax and benefit
reforms introduced as part of the fiscal consolidation.
Increasing income tax rates is clearly the most progressive of the three. Because the first
£9,440 of income will be tax-free in 2013–14, around a quarter of households will not
contain anyone with income high enough to pay income tax, and so would not lose at all
from an income tax rise.19 And of those households that do contain an income tax payer,
those with higher incomes would lose a larger percentage of their income because a
larger share of their income would fall above the personal allowance and so be taxable.
17 J. Browne, ‘A £10,000 personal allowance: who would benefit, and would it boost the economy?’, IFS
Observation March 2012 (http://www.ifs.org.uk/publications/6045).
18 Source: HMRC Statistics table 1.6 (http://www.hmrc.gov.uk/statistics/expenditures/table1-6.pdf).
19 The reason that the poorest two decile groups in Figure 9.5 contain some losers (despite a quarter of
households not losing from the reform) is that the figure ranks households by their overall net income and adjusted for household size. A household containing a taxpayer may be considered poorer than a household containing no taxpayers if, say, the taxpaying household receives less (or nothing) in benefits and tax credits or if their income must stretch to cover more household members.

The IFS Green Budget: February 2013
254
Figure 9.5. Distributional impact of a 1 percentage point increase in all
rates of income tax, all rates of employee and self-employed NICs and the
main rate of VAT, 2013–14
Note: Income decile groups are derived by dividing all households into 10 equal-sized groups according to
disposable income adjusted for family size using the McClements equivalence scale.
Source: Authors’ calculations using the IFS tax and benefit microsimulation model, TAXBEN, to apply the
2013–14 tax and benefit system to uprated data from the 2010–11 Family Resources Survey and the 2010
Living Costs and Food Survey.
Increasing NICs rates has similar distributional effects, but is slightly less progressive, for
two reasons. First, only the first £149 per week of earnings will be free of NICs: the
coalition’s ambition to raise the income tax allowance towards £10,000 (£192 per week)
apparently does not extend to NICs. And second, NICs apply only to earned income:
income tax is levied on other forms of income as well, notably savings income, which is
found disproportionately in the top half of the income distribution. A further difference is
that increases in the rates of income tax and VAT would both affect working-age and
pensioner households, whereas those aged over the State Pension Age would be
unaffected by an increase in the rate of NICs as they do not pay employee or self-
employed NICs.
VAT rises look regressive as a percentage of income: the lowest income decile in
particular would lose 1.1% of its income from a VAT increase, compared with 0.7% for
the population as a whole. This impression is misleading, however. It arises mainly
because, at any given point in time, low-income households typically spend a lot (and
therefore pay a lot of VAT) relative to their incomes. But households cannot spend more
than their income indefinitely. Over a lifetime, income and expenditure must be equal
(except for bequests given and received and the possibility of dying in debt); households
spending a lot relative to their income at any given point in time are often those
experiencing only temporarily low incomes and either borrowing or running down their
savings in order to maintain their expenditure smoothly at a level more befitting their
lifetime resources.20
20 Such temporarily low incomes can arise for a variety of reasons – people who are temporarily unemployed,
people with volatile income from self-employment, students, those taking time out of the labour market to raise children, retirees drawing on past savings, and so on.
-1.4%
-1.2%
-1.0%
-0.8%
-0.6%
-0.4%
-0.2%
0.0%
Poorest 2 3 4 5 6 7 8 9 Richest All
Lo
ss a
s %
of
inco
me
/exp
en
dit
ure
Income decile group
1p on income tax (as % of income)
1p on employee and self-employed NICs (as % of income)
1p on main rate of VAT (as % of income)
1p on main rate of VAT (as % of expenditure)
Broad shoulders and tight belts: options for taxing the better-off
255
We can get a clearer picture of the distributional impact of VAT over a lifetime –
abstracting from how much people are borrowing or saving at any point in time – by
looking at whether VAT is a bigger percentage of expenditure, rather than income, for
better-off households. Figure 9.5 therefore shows the impact of a VAT rise as a
percentage of expenditure as well as the impact as a percentage of income. On that
measure, VAT looks slightly progressive, rising from 0.55% of expenditure for the lowest
income decile group to 0.63% of income for the highest income decile group. That arises
because the items that are zero- or reduced-rated for VAT, and therefore not affected by a
rise in the main rate – food being by far the biggest – take up a larger share of the budgets
of poorer households. Over a lifetime, we would expect richer households to devote a
larger share of their resources to goods subject to VAT at the main rate and therefore to
lose more from such a VAT increase than poorer households: that is what the dark green
bars in Figure 9.5 reflect.21 Nevertheless, while a rise in the main rate of VAT is best
thought of as being slightly progressive, it is nowhere near as progressive as an income
tax or NICs rise, because there is no VAT-free allowance on the first tranche of household
expenditure analogous to the allowances in income tax and NICs.
Distributional effects are not the only criterion for evaluating reforms, however. All three
of these reforms would weaken work incentives, reducing the reward for working in
terms of the amount of goods and services that additional earnings can buy after tax. Of
these three taxes, increases to NICs would typically be the most damaging to work
incentives (per pound raised), then increases in income tax, with increases in VAT the
least damaging. Increasing NICs weakens work incentives most because all of the revenue
comes from taxing future earnings, whereas part of the revenue from increasing VAT or
(to a lesser extent) income tax derives from wealth that has already been accumulated
and will be payable regardless of future work behaviour. This is because income tax will
be levied on the income derived from existing wealth, while VAT will be levied when the
wealth comes to be spent. Furthermore, a VAT rise, unlike the others, would reduce the
value of out-of-work incomes as well as in-work incomes, so the relative attractiveness of
working would not be reduced as much.22
Each of the three tax rises would exacerbate other existing tax-induced economic
distortions, in different ways:
Increasing the marginal rate of income tax would discourage saving and would
increase the bias towards putting savings in relatively tax-favoured forms such as
pensions, ISAs and owner-occupied housing.
Increasing NICs would not have these effects since NICs are not levied on savings
income, but for the same reason it would increase the existing incentive to shift the
form in which income is taken away from earnings and towards capital income (for
example, through setting up a company and taking income as dividends rather than
earnings).
21 For more analysis of VAT by income and expenditure and their relationship to lifetime resources, see S.
Adam, D. Phillips and S. Smith (in consortium), A Retrospective Evaluation of Elements of the EU VAT System, European Commission, 2011 (http://www.ifs.org.uk/publications/5947).
22 Offsetting this reduction in the reward to work (the ‘substitution effect’) is an increase in the need to work
(the ‘income effect’): people may decide to work harder in order to make up for the income they have lost through the tax rise. Theoretically, therefore, these tax rises could either increase or reduce the amount people work. However, empirically, income effects tend to be small; they will often be offset (at least roughly) by income effects going in the opposite direction when the revenue is used to make someone better off; and, strictly speaking, the economic inefficiency (or ‘deadweight loss’) caused by a tax depends only on substitution effects, not on income effects. We therefore ignore income effects in the remainder of this chapter.

The IFS Green Budget: February 2013
256
Increasing the main rate of VAT would increase the scale of the distortion towards
buying zero- and reduced-rated goods and services instead of standard-rated ones.
Broad-based tax rises could be used to increase the contribution of households in the top
half of the income distribution. In the remainder of this chapter, we focus on measures
targeted on narrower groups of richer households.
9.6 Options: increasing income tax and NIC rates for
higher earners
If the government wants to focus tax rises on those with the highest incomes, it may want
to restrict attention to the higher and additional rates of income tax and NICs. Since the
government decided to reduce the additional rate of income tax from 50% to 45% from
April 2013, it is unlikely to increase that. In any case, there are good reasons to be
cautious about the potential for increases in the additional rate to raise additional
revenue. The ability to respond to a change in taxes by, for example, shifting income to
another form or time period is likely to be greater for those on high incomes than for
those on lower incomes.23 For this reason, the official costing – signed off by the Office for
Budget Responsibility as reasonable – is that the cut in the additional rate from 50% to
45% will cost just £100 million annually.24 The revenue potential of increasing the top
rate from 45% is doubtful (though still hugely uncertain) even if there were any chance
the government might contemplate it.
Little is known about the responsiveness of higher-rate taxpayers, but it is unlikely to be
as high as that of additional-rate taxpayers. HMRC estimates (which do make an
allowance for some behavioural response) suggest that each percentage point on the
higher rate of income tax would raise £1.1 billion, while each percentage point on the
employee NICs rate above the upper earnings limit (UEL, which in 2013–14 is aligned
with the higher rate threshold at £41,450) – and on the self-employed NICs rate above the
upper profits limit – would raise £0.8 billion.25 Figure 9.6 illustrates the distributional
impact of raising the higher rate of income tax and the rate of NICs above the UEL by 1
percentage point, ignoring behavioural responses entirely. The distributional effects of
these two changes are very similar, restricted to the top half of the income distribution
and very much concentrated in the top decile group. An individual earning £50,000 (with
no other taxable income) would pay an extra £85.50 a year in income tax or NICs under
either reform, while an individual earning £100,000 a year would pay an extra £585.50 a
year.
The distortionary effects of the measures are similar to those discussed above: a
weakening of work incentives, distortions to saving decisions (in the case of an income
tax increase) and incentives to convert labour earnings into capital income (in the case of
23 For a fuller discussion of the difficulties involved in determining optimal top tax rates, see M. Brewer and J.
Browne, Can More Revenue Be Raised by Increasing Income Tax Rates for the Very Rich?, IFS Briefing Note 84, 2009 (http://www.ifs.org.uk/bns/bn84.pdf).
24 See HMRC, ‘The exchequer effect of the 50 per cent income tax rate of income tax’, 2012
(http://www.hmrc.gov.uk/budget2012/excheq-income-tax-2042.htm). For further discussion, see also M. Brewer, J. Browne and P. Johnson ‘The 50p income tax rate: what is known and what will be known?’, in C. Emmerson, P. Johnson and H. Miller (eds), The IFS Green Budget: February 2012, IFS Commentary 122, 2012 (http://www.ifs.org.uk/budgets/gb2012/12chap9.pdf).
25 Source: HMRC Statistics table 1.6 (http://www.hmrc.gov.uk/statistics/expenditures/table1-6.pdf).

Broad shoulders and tight belts: options for taxing the better-off
257
a NICs increase). When focusing specifically on higher earners, one other effect is worthy
of attention.
Since 2010–11, the income tax personal allowance has been withdrawn above incomes of
£100,000. The allowance is reduced by 50p for every pound of income above £100,000,
gradually reducing it to zero for those with incomes above £118,880 in 2013–14. Losing
50p of personal allowance means that 50p becomes taxable at the individual’s marginal
income tax rate of 40%, and therefore 20p more income tax to pay alongside the 40p that
would ordinarily be payable on an extra pound of income. Thus between £100,000 and
£118,880, people face paying 60p more in income tax for each extra £1 of income: in
effect, the marginal income tax rate in that range is 60%. Figure 9.7 shows the resulting
marginal rate schedule for income tax and employee NICs combined.
Figure 9.6. Distributional impact of a 1 percentage point increase in the
higher rate of income tax and the additional rate of NICs, 2013–14
Notes: As Figure 9.5.
Source: Authors’ calculations using the IFS tax and benefit microsimulation model, TAXBEN, to apply the
2013–14 tax and benefit system to uprated data from the 2010–11 Family Resources Survey.
Figure 9.7. Combined income tax and employee NICs schedule, 2013–14
-0.5%
-0.4%
-0.3%
-0.2%
-0.1%
0.0%
Poorest 2 3 4 5 6 7 8 9 Richest Total
Pe
rce
nta
ge
ch
an
ge
in
ne
t in
com
e
Income decile group
1p on higher rate of income tax
1p on NICs above the UEL
0
10
20
30
40
50
60
70
0 10 20 30 40 50 60 70 80 90 100 110 120 130 140 150 160 170 180 190 200
Ma
rgin
al ra
te o
f in
com
e t
ax +
NIC
s
Gross annual income (£000s)

The IFS Green Budget: February 2013
258
Increasing the higher rate of income tax would make losing 50p of personal allowance
even more costly: with a higher rate of 41%, 50p of personal allowance would be worth
20.5p instead of 20p. A 1 percentage point increase in the higher rate of income tax would
thus increase the effective 60% income tax rate – already rather high – by more than 1
percentage point, to 61.5%. Similarly, an increase in the higher rate from 40% to 50%
would mean a rise from 60% to 75% in the £100,000 to £118,880 band. The same would
not be true of an increase in NICs.
While the presence of the effective 60% income tax rate has implications for the choice
between raising income tax and NICs rates, it raises more fundamental issues in its own
right. The most basic is that of transparency. Few people understand how the withdrawal
of the personal allowance works. If the rate schedule in Figure 9.7 is really what the
government wants to achieve, then it should describe it openly as a 60% income tax rate:
as the Mirrlees Review of the tax system put it, ‘this peculiar mechanism serves no
purpose except to obscure what the tax system is actually doing’.26
If the rate schedule in Figure 9.7 were less opaque, however, its absurdity – rising and
falling seemingly at random – would be likely to attract more attention. While making the
60% rate more transparent would be an improvement, the government should consider
removing it entirely and making up the revenue – or, indeed, raising more revenue – from
elsewhere, most obviously through a modest increase in the higher rate of income tax.
9.7 Options: capital gains tax
Capital gains tax (CGT) is expected to raise £3.7 billion in 2012–13.27 It is a tax on the
increase in the value of an asset between its acquisition and disposal. Broadly speaking,
this means its sale price minus its purchase price, though assets that are acquired or
disposed of in other ways (for example, gifts) are assigned a market value. Capital gains
made on people’s main homes, and on any assets held in pension funds or ISAs, are tax-
exempt. CGT revenue therefore comes mostly from shares held outside pensions and ISAs
(including owner-managed businesses) and from housing that is not the owner’s main
residence.
The first £10,600 of capital gains realised each year are tax-free. Above that, gains that fall
into the basic-rate income tax bracket (counting capital gains as the top slice of income)
are taxed at 18% while gains above the higher-rate threshold are taxed at 28%. Gains on
certain kinds of business assets, though, are eligible for entrepreneurs’ relief, which
reduces the tax rate to 10%.
The £10,600 annual exempt amount and the complete exemption of ISAs, pensions and
main homes together mean that CGT is highly progressive. People realising gains of more
than £10,600 in a single year are generally – though not invariably – very well off.
The simplest ways to raise more revenue from CGT would be to reduce the annual
exempt amount from its current level of £10,600 or to increase the headline rates.
26 Page 106 of J. Mirrlees et al., Tax by Design, OUP for IFS, Oxford, 2011
(http://www.ifs.org.uk/mirrleesreview/design/ch4.pdf).
27 Source: table 4.6 of Office for Budget Responsibility, Economic and Fiscal Outlook, December 2012
(http://cdn.budgetresponsibility.independent.gov.uk/December-2012-Economic-and-fiscal-outlook23423423.pdf).

Broad shoulders and tight belts: options for taxing the better-off
259
HMRC estimates that reducing the exempt amount by £500 would raise about £20 million
per year;28 but larger reductions would raise revenue more than in proportion to this,
since small gains are more common than larger gains.29 The losers from such a reform
would be all those realising gains above the (reduced) exempt amount on assets other
than their main home, pension or ISA. Provided the exempt amount remains significantly
above zero, this would still be a relatively well-off group. But the reform is clearly less
progressive than increasing the headline rates of CGT. The people newly brought into
CGT would, on average, be less well off than those who pay it at the moment; and among
existing CGT payers, all would lose the same cash amount (18% of the amount by which
the exempt amount is reduced) rather than in proportion to the size of their taxable gain.
Beyond the narrow question of whether the CGT annual exempt amount should be
reduced, a more fundamental question is why CGT and income tax have separate
allowances at all. Capital gains are a return to saving just like capital income is, and it
would make sense to tax them together. Yet, at present, the CGT allowance cannot be set
against income and the income tax allowance cannot be set against capital gains. This
separation rewards people who, in a given year, have some income and some capital gain,
rather than exclusively one or the other. There seems to be little rationale for having
large separate allowances. Beyond a de minimis allowance specifically for capital gains
(much lower than the current one) to avoid the burden of CGT compliance for those
realising trivial gains, it would make much more sense to have a single allowance to set
against both income and capital gains.
Instead of (or as well as) changing the annual exempt amount, the government could
simply increase the headline rates of CGT. On its own, increasing the lower rate from its
current level of 18% would raise very little: the government estimates that each
percentage point on the rate would yield only £5 million.30 In contrast, each percentage
point added to the higher (28%) rate would yield £80 million. The vast majority of
taxable capital gains are subject to the higher rate.31
In setting CGT rates, policymakers face a dilemma. On the one hand, they would like to
avoid discouraging saving and investment, which would suggest keeping CGT rates low or
even zero. On the other hand, they would like to capture a share of large capital gains and
to minimise the scope for avoiding tax by converting income into capital gains, which
would point towards higher CGT rates (at least aligned with income tax rates).
Historically, policymakers have tended to compromise with an in-between rate that fulfils
neither objective very well.
The Mirrlees Review proposed a better solution to this dilemma: to introduce a Rate of
Return Allowance (RRA) for assets held outside pensions and ISAs. An RRA is an amount
equal to a ‘normal’ (risk-free) return on the purchase cost of the asset, which could be
28 Source: HMRC Statistics table 1.6 (http://www.hmrc.gov.uk/statistics/expenditures/table1-6.pdf).
29 As an extreme illustration, note that simply multiplying up the £20 million number would imply that
removing the exempt amount altogether would raise around £420 million, whereas HMRC estimates that the actual cost of having a £10,600 exemption is £2.6 billion (source: HMRC Statistics table 1.5, http://www.hmrc.gov.uk/statistics/expenditures/table1-5.pdf).
30 Figures in this paragraph are from HMRC Statistics table 1.6
(http://www.hmrc.gov.uk/statistics/expenditures/table1-6.pdf).
31 Although most people paying CGT have income below the higher-rate threshold, the gains they are realising
are typically much smaller than those of higher-income people, especially after deducting the £10,600 tax-free allowance. More importantly, even if someone’s income is below the higher-rate threshold, part of the gain may still fall into the higher-rate band, especially if the gains are large. As noted in Section 9.3, people realising capital gains of more than £1 million accounted for over half of CGT revenue in 2010–11.

The IFS Green Budget: February 2013
260
deducted from actual returns on the asset – either capital gains or investment income –
with any remaining ‘excess’ returns then subject to taxation at full labour income tax
rates. Properly designed, the RRA has a number of desirable properties. It would reduce
or eliminate disincentives to save and distortions to the choice between different assets,
while at the same time capturing a share of any unusually high returns earned and
minimising incentives to convert income into capital gains. Importantly, for complicated
reasons, it would also reduce or eliminate problems caused by the failure to index CGT for
inflation and the ‘lock-in effect’ whereby the levying of CGT when assets are sold, rather
than when the rise in value occurs, gives an incentive to hold on to assets for as long as
possible before selling them.32
Introducing an RRA would cost money (because it effectively reduces the tax base),
though on the other hand increasing the statutory rate applied to ‘excess’ returns would
raise money: it is not clear what the net revenue effect would be. The Mirrlees Review
argued that it would be worth finding money from elsewhere to pay for this if need be.
Short of introducing an RRA, reintroducing indexation of CGT for inflation (as existed
before 1998), so that only real gains were taxed, would be an improvement on the
current position.
However, in the absence of an RRA (or even indexation for inflation), the pros and cons in
terms of economic efficiency of increasing CGT rates towards income tax rates look more
finely balanced. It would discourage saving in taxed assets such as investment property
and ordinary shares; on the other hand, it would reduce the bias towards taking capital
gains rather than income.33 Yet perhaps the biggest opportunity for converting income
into lightly-taxed capital gains in the current system is not the low headline rates of CGT
but entrepreneurs’ relief, which applies an even lower rate to a group that has relatively
good opportunities to exploit the discrepancy.
Reduce or abolish entrepreneurs’ relief
Entrepreneurs’ relief applies a reduced CGT rate of 10% to capital gains (up to a lifetime
limit of £10 million) on certain eligible assets:
shares in a trading company (or holding company of a trading group) of which the
shareholder has been a full-time employee or director, owned at least 5% of the
shares and had at least 5% of the voting rights, all for at least a year;
an unincorporated business (or distinct part of a business), or business assets sold
after the individual stops carrying on the business.
HMRC estimates that entrepreneurs’ relief reduced total tax liabilities by £1.7 billion in
2012–13, though it argues that abolishing it would yield substantially less than this as
people would change their behaviour in response.34 Notwithstanding this caveat, the
32 These properties are demonstrated in P. Sørensen, ‘Neutral taxation of shareholder income’, International
Tax and Public Finance, 2005, 12, 777–801. For a discussion, see chapters 13 and 14 of J. Mirrlees et al., Tax by Design, OUP for IFS, Oxford, 2011 (http://www.ifs.org.uk/mirrleesreview/design/ch13.pdf, http://www.ifs.org.uk/mirrleesreview/design/ch14.pdf).
33 While it is generally true that increasing CGT rates would reduce distortions, that is not always the case. In
particular, for basic-rate taxpayers, capital gains on shares are already taxed more heavily than dividends. Dividends are in effect subject to a zero basic rate of income tax, reflecting the fact that they are paid out of corporate profits that have already been subject to corporation tax. The Mirrlees Review pointed out that it would be logical for CGT too to be levied at a lower rate on shares than on other assets, reflecting corporation tax already paid, as dividend taxation does. One possibility for raising revenue might therefore be to increase CGT rates other than on shares.
34 Source: HMRC Statistics table 1.5 (http://www.hmrc.gov.uk/statistics/expenditures/table1-5.pdf).

Broad shoulders and tight belts: options for taxing the better-off
261
figure is strikingly large relative to the £200 million estimated cost of entrepreneurs’
relief when it was first introduced in 200835 – partly because the lifetime limit has been
gradually increased to £10 million from its initial level of £1 million.
Entrepreneurs’ relief adds complexity to the tax system and creates a range of
distortions.36 It is also arguably unfair.37 More generally, the justification for applying
lower tax rates to people who own their own business than to the rest of the population
seems far from clear.38
In isolation, abolishing entrepreneurs’ relief would weaken the incentive for people to
start a business and invest in it. However, it is far from clear that entrepreneurs’ relief is
the best way to pursue these goals in any case. The Mirrlees Review argues that
investment can be best encouraged by providing relief for amounts invested, rather than
reduced tax rates on actual investment returns: this could be achieved by the
introduction of an RRA as described above, and is also the approach embodied in the
annual investment allowance in the current tax system. In the absence of these kinds of
wider reforms to the tax base, abolishing entrepreneurs’ relief would undoubtedly have
downsides as well as upsides. But the complexity, inefficiency and unfairness of the
current system make maintaining the status quo an unattractive option. On balance,
entrepreneurs’ relief should probably be abolished.
End ‘forgiveness’ of CGT on death
At present, CGT is ‘forgiven’ at death.39 The deceased’s estate is not liable for CGT on any
increase in the value of assets prior to death, and those inheriting the assets are deemed
to acquire them at their market value at the date of death, so any rise in value that occurs
before death escapes tax completely. This costs the exchequer an estimated £490 million
in 2012–13.40
Forgiveness of CGT at death reflects the presence of inheritance tax (IHT): politicians
understandably baulk at the idea of imposing (say) 28% CGT on top of 40% inheritance
tax. But that is a weak argument. CGT exemption does not, and should not, offset the
impact of inheritance tax.
35 http://webarchive.nationalarchives.gov.uk/+/http://www.hm-
treasury.gov.uk/newsroom_and_speeches/press/2008/press_05_08.cfm.
36 First, it encourages owner-managers of companies to retain profits in the company rather than take them
out as dividends or salary, regardless of whether (in the absence of tax considerations) they would rather spend the money or could invest it more profitably elsewhere. Second, it provides a strong incentive to set up a business in which to retain profits, putting pressure on anti-avoidance rules, which attempt to define when companies are ‘artificial’ avoidance devices. Third, it gives companies an artificial incentive to ensure that any individual employee shareholdings are above 5%, rather than below that threshold. And fourth, it gives self-employed individuals and partnerships a large incentive not to sell assets of the business until they are ready to stop doing business altogether, regardless of whether the assets could be more profitably used by others and whether the proceeds of a sale could be more profitably used in other ways.
37 The distortions in the footnote above mean that entrepreneurs’ relief discriminates against owner-managers
who cannot afford to retain profits in their business, against self-employed people who choose (or need) to sell business assets before giving up the business altogether and against employees who have shareholdings of less than 5% in the company for which they work.
38 For a fuller development of this argument in a related context, see S. Adam, ‘Taxing employees, the self-
employed and small companies’, in New Forms of Work, Fabian Policy Report (http://www.fabians.org.uk/wp-content/uploads/2012/10/New-Forms-of-Work_WEB1.pdf).
39 This subsection draws heavily on pages 364–5 of J. Mirrlees et al., Tax by Design, OUP for IFS, Oxford, 2011
(http://www.ifs.org.uk/mirrleesreview/design/ch15.pdf).
40 Source: HMRC Statistics table 1.5 (http://www.hmrc.gov.uk/statistics/expenditures/table1-5.pdf).

The IFS Green Budget: February 2013
262
In purely practical terms, the current system does not eliminate double taxation or zero
taxation.41 More fundamentally, IHT and CGT serve different purposes. CGT is a tax on
returns to savings, inheritance tax a tax on transfers of wealth. ‘Double taxation’ of wealth
that was already taxed as income (or will be taxed as expenditure) is inherent to wealth
transfer taxation. Coexistence of CGT with wealth transfer taxation would merely make
this double taxation more explicit.42 If policymakers do not accept the argument for
taxing transfers, then they should not tax them: simply abolish inheritance tax. But if
there is an argument for taxing transfers, that must be on top of the regime for taxing
returns to capital.
The regime for taxing returns to savings and the regime for taxing gifts and bequests
should each be designed appropriately on its own merits. Forgiveness of CGT at death
looks like a half-hearted reluctance to adopt a principled position. But it is highly
distortionary. It encourages people to hold on to assets that have risen in value, even if in
the absence of tax considerations it would be preferable to sell them and use the proceeds
in some other way before death (at which point other assets, including the proceeds from
selling the original assets, could be passed on instead) and even if it would be preferable
to pass on the assets (or the proceeds from selling them) immediately. If people expect to
be able to bequeath assets on death, it also encourages them to buy assets that yield
returns in the form of capital gains and to convert income into capital gains where
possible.
Whatever kind of tax on gifts and bequests one does (or does not) want, there is no case
for forgiveness of CGT on death.
End the exemption of principal private residences
Rises in the value of principal private residences – people’s main homes – are exempt
from CGT. This is by far the biggest relief in CGT: the government estimates that it will
reduce CGT liabilities by £9.9 billion in 2012–13 – more than two-and-a-half times total
expected CGT revenue – although it argues that abolishing it would yield substantially
less than this as people changed their behaviour in response.43
Property is an asset as well as a consumption good, and it should be thought of within the
framework of savings taxation.
As with CGT in general, CGT on principal private residences involves a trade-off. On the
one hand, imposing CGT would discourage people from saving – in this case, buying a
(bigger) house. On the other hand, it would enable the government to capture a share of
any large capital gains and it would reduce distortions between similar assets.44
41 Assets transferred in the seven years before death can still attract both inheritance tax and CGT. Conversely,
CGT is forgiven even when estates are below the inheritance tax threshold and so no inheritance tax would be paid anyway. And the two taxes exempt different asset classes: people’s main homes are exempt from CGT, while agricultural property and unquoted businesses are not (though entrepreneurs’ relief does provide a reduced rate for owner-managed businesses).
42 Note also that ending forgiveness of CGT at death need not necessarily mean that CGT would be payable at
the same time as IHT. If an asset were retained by the recipient, the system could be designed so that CGT liability was triggered only on sale of the asset, with the base price deemed to be the original purchase price rather than the market value when the asset changed hands. That is how inter vivos transfers between spouses and civil partners are already treated for CGT purposes.
43 Source: HMRC Statistics table 1.5 (http://www.hmrc.gov.uk/statistics/expenditures/table1-5.pdf).
44 Most importantly, in this case, imposing CGT on main homes would reduce – though not eliminate – the
current tax bias in favour of owner-occupation versus rental property, since landlords are subject to both CGT on their properties and income tax on the rent (net of costs) they receive. It is hard to find a coherent rationale

Broad shoulders and tight belts: options for taxing the better-off
263
Like CGT in general, imposing CGT on main homes would generate a ‘lock-in’ effect:
people would be artificially discouraged from selling a home that had risen in value, since
only when it was sold would a CGT liability be triggered. Discouraging property
transactions that would otherwise be mutually beneficial is undesirable, as we discuss in
Section 9.9 in the context of stamp duty land tax. This lock-in effect would be exacerbated
by the massive political backlash that would almost certainly follow the introduction of
CGT on people’s main homes, since if people believed that the policy would be reversed
(perhaps by a future government) then they would have an enormous incentive to hold
on to the property until this happened. As well as being a distortion in its own right, this
could seriously undermine the revenue yield of the reform – further adding to the
pressure to reverse the policy.
There is a case for reforming the taxation of housing, and the Mirrlees Review argued that
the ideal solution in principle would be to introduce an RRA for all housing. But for
owner-occupied housing, even that would be difficult in the short run.45 For now, the
income tax and CGT treatment of owner-occupied housing is probably better left
unchanged.
9.8 Options: taxation of private pensions
At present, private pension contributions up to an annual limit of £50,000 (due to fall to
£40,000 from 2014–15) are subject to income tax relief at the taxpayer’s marginal rate,
and relief from both employee and employer NICs as well in the case of employer pension
contributions. The total amount that can be accumulated in a private pension is capped at
£1.5 million (due to fall to £1.25 million from 2014–15). Investment returns are tax-free
while money remains in the pension fund (although share purchases are subject to stamp
duty and there is corporation tax on the profits that give rise to equity returns). Pension
income withdrawn from the fund is then subject to income tax (but not NICs) at the
taxpayer’s marginal rate, except that up to 25% of the fund can be withdrawn as a tax-
free lump sum.
For people facing the same marginal tax rate when contributing as when they retire,
giving relief for contributions and then taxing pension income would be broadly
equivalent (in present-value terms) to not relieving contributions and not taxing pension
income: both would give the same effective tax rate of zero on the normal return to
saving. The tax-free lump sum and (in the case of employer contributions) NICs relief
provide a significant subsidy. People whose marginal tax rate is lower in retirement than
when contributing will find pension saving even more attractive.
The fact that pension saving inherently involves long-term planning means that this is an
area where policy stability is at a particular premium. Sadly, such stability has been
lacking: the 2012 Autumn Statement announcement that the annual and lifetime limits
were to be reduced represented the third new announcement on pension taxation in four
years, and the previous history is no more glorious. There is therefore a strong case for
eschewing any further reform, flawed though the current system is. However, if the
for levying CGT on main homes without also levying income tax on the imputed rental income from owner-occupation, the other component of the return to buying a house. Only if this imputed rental income were also taxed – as it was under Schedule A income tax until 1963 – would the tax treatment of owner-occupation be brought into line with that of the rental sector.
45 See section 16.2.2 of J. Mirrlees et al., Tax by Design, OUP for IFS, Oxford, 2011
(http://www.ifs.org.uk/mirrleesreview/design/ch16.pdf).

The IFS Green Budget: February 2013
264
Chancellor does wish to raise more revenue in this area, there are several possibilities
available – some of which would improve the system, some of which would make it worse
– and in some cases the improvements might be big enough to make it worth accepting
further upheaval.
Reduce the annual or lifetime allowance
The simplest way to raise more money would be to reduce the annual and/or lifetime
limits on what can be contributed to a pension tax-free. This would be very much in
keeping with recent reforms, repeating what was done in the June 2010 Budget and the
2012 Autumn Statement. We are not aware of any estimates of the yield from further
reductions; the government estimates that the reduction of the annual limit from £50,000
to £40,000 and the reduction of the lifetime limit from £1.5 million to £1.25 million will
together raise £1.1 billion in 2017–1846 and rise thereafter, but further reductions of the
same size would raise significantly more than that because far more people would be
affected.
To get a feel for how big a £1.25 million pension pot is, note that a single man with a
pension pot that size could, at current annuity rates, take a tax-free lump sum of
£312,500 and receive an RPI-linked annual pension of about £30,000 (or an annual
pension fixed in cash terms of about £50,000).47 For someone in a defined benefit pension
arrangement, a £312,500 lump sum and an annual RPI-linked pension of £46,875 is
deemed to be equivalent to a pension pot of £1.25 million (since defined benefit pension
schemes are deemed to have a pot size twenty times the annual pension).
Tightening limits on what can be saved in tax-privileged forms over a lifetime is not the
most unreasonable way to raise revenue. But there are better options available, which we
discuss below. In particular, rather than preventing people with very large pension pots
from saving any more in a registered pension scheme at all, it would be better to let them
save in a pension but without the large subsidies they currently receive through the tax-
free lump sum and the NICs exemption of employer contributions.
Reducing the annual allowance makes less sense than reducing the lifetime allowance.
For a given level of desired lifetime contributions, it is not clear why we would want to
penalise making occasional large contributions rather than frequent smaller
contributions. In practical terms, too, reducing the annual allowance is more problematic,
as valuing annual contributions to defined benefit pension schemes is difficult; the lower
the annual limit, the more of these difficult valuations must be done. The way that defined
benefit pension rights accrue also means that high-sounding annual allowances can affect
people who are well off but perhaps not quite as rich as one might imagine: for example,
an employee earning £38,000 a year with 30 years’ membership of a final salary pension
scheme who saw their pay rise to £55,000 in four years’ time could be affected by the
£40,000 limit due to be introduced in 2014–15.
46 Source: table 2.1 of HM Treasury, Autumn Statement 2012 (http://cdn.hm-
treasury.gov.uk/autumn_statement_2012_complete.pdf).
47 Source: http://pluto.moneyadviceservice.org.uk/annuities calculation based on a non-smoking single man
born in 1948 living in Ipswich.

Broad shoulders and tight belts: options for taxing the better-off
265
Restrict income tax relief to the basic rate
It is frequently proposed (including in the Liberal Democrats’ 2010 general election
manifesto) to restrict income tax relief on pension contributions to the basic rate.
The government says that this would reduce the cost of tax relief on pension
contributions by around one-third. HMRC estimates that the total cost of tax relief on
pension contributions was £26.0 billion in 2010–11, which would therefore imply a yield
of about £8.6 billion. However, the £26.0 billion total cost of relief is likely to change,
owing to a combination of changes to pension contributions and the reduction in the top
rate of income tax from 50% to 45%; and the government notes that this saving of one-
third ignores the substantial change in behaviour that this reform would be likely to
engender.48 In fact, if people’s main response were to reduce their pension contributions,
this would tend to increase the yield in the short run by saving the cost of basic-rate relief
as well as higher-rate relief (though in the long run this would be offset by reduced
revenue from taxing pension income).
It is often argued that it is ‘unfair’ that despite only one-in-seven income tax payers
paying income tax at the higher or additional rate, between them they receive over half of
the total cost of pension tax relief. It perhaps looks less unfair when put in the context
that, despite this tax relief, they still pay over half of all income tax.49
More fundamentally the idea that income tax relief should be restricted to the basic rate
is misguided. The error stems from looking at the tax treatment of pension contributions
in isolation from the tax treatment of the pension income they finance. Pension
contributions are excluded from taxable income precisely because pension income is
taxed when it is received: in effect, the tax due on earnings paid into a pension is deferred
until the money (plus any returns earned in the interim) is withdrawn from the fund. It is
hard to see how it can be unfair for higher-rate taxpayers to receive 40% relief when
basic-rate taxpayers receive 20% relief, yet at the same time not be unfair for higher-rate
taxpayers to pay 40% tax on their pension income when basic-rate taxpayers pay only
20%. If somebody is a higher-rate taxpayer throughout their adult life, it seems unfair for
the tax relief on their pension contributions to be restricted to 20% and for them then to
pay 40% tax on their pension income.
Proponents of the restriction point out that many of those receiving relief at the higher
rate will only pay basic-rate tax in retirement.50 It is arguable whether that is really
unfair: in effect, such individuals are simply smoothing their taxable income between
high-income and low-income periods, undoing the ‘unfairness’ that an annually-assessed
progressive tax schedule creates by taking more tax from people whose incomes are
volatile than from people whose incomes are stable. But even if receiving higher-rate
relief and then paying basic-rate tax is seen as unfair, that does not diminish the case for
48 Sources: total cost of pension tax relief from HMRC Statistics table PEN6
(http://www.hmrc.gov.uk/statistics/pension-stats/pen6.pdf); yield from restricting relief from Written Answer by David Gauke MP to a Parliamentary Question, 6 July 2011 – ‘If relief on pension contributions were limited to the basic rate of tax, the amount of this relief would fall by approximately one third. This estimate does not take account of behavioural effects, which are likely to be large’ (Hansard, column 1249W, http://www.publications.parliament.uk/pa/cm201011/cmhansrd/cm110706/text/110706w0002.htm).
49 Sources: HMRC Statistics tables 2.1 and 2.5 (http://www.hmrc.gov.uk/statistics/tax-statistics/table2-1.pdf,
http://www.hmrc.gov.uk/statistics/tax-statistics/table2-5.pdf) and paragraph 1.179 of HM Treasury, Autumn Statement 2012, Cm 8480 (http://cdn.hm-treasury.gov.uk/as2012_chapter_1c.pdf).
50 Though the snapshot statistics of the income tax rates facing current pension savers and current retirees
often used to illustrate the point are somewhat misleading – those currently contributing may not necessarily face the same tax rates in retirement as current retirees, not least because of ongoing fiscal drag.

The IFS Green Budget: February 2013
266
accompanying the restriction of tax relief on contributions with a restriction of the tax on
pension income (perhaps with transitional arrangements so that those who have
received higher-rate relief in the past do not pay only basic-rate tax in retirement). If
relatively few individuals pay higher-rate tax on their pension income, that merely
suggests that such a policy would be cheap. The tax system should treat pension
contributions and pension income in a symmetric way.
Restricting tax relief on pension contributions would obviously reduce incentives for
higher-rate taxpayers to save in a pension. It would also be complicated, for the same
reason as reducing the annual allowance would be. It would require the valuation of
pension promises made by employers through defined benefit schemes. And this
requirement would be much more widespread if it applied to all higher-rate taxpayers
rather than just people making exceptionally large pension contributions. The compliance
costs alone of this measure would likely be so high as to make it a highly inefficient way
to raise revenue from higher-rate taxpayers.
The Labour Party has recently revived a proposal originally made in the then Labour
government’s 2009 Budget, but never implemented because it was dropped by the
incoming coalition government in favour of a reduction to annual and lifetime allowances
designed to raise the same amount of money. The proposal is to restrict tax relief on
pension contributions to the basic rate, but only for those with incomes (before deducting
pension contributions) above £150,000. While this has the merit of limiting a bad policy
to a smaller group of people, it has even less of a coherent rationale. It is hard to see why
it should be unfair for those above £150,000 to get tax relief at their marginal rate, but
not for other higher-rate taxpayers to do so. Indeed, these very highest earners are less
likely to be only basic-rate taxpayers in retirement, removing one of the principal
arguments for restricting relief. The proposal also involves much additional complexity in
defining a new income threshold and gradually restricting relief as income rises, and a
‘cliff-edge’ in tax liability at income (excluding pension contributions) of £130,000.51
In summary, then, restricting the rate of income tax relief on pension contributions would
be expensive to administer, be unfair and inappropriately distort behaviour. There are far
better ways to raise money from well-off people, or to reduce the generosity of pensions
taxation, or even to do both at once.
Cap the tax-free lump sum
Under current rules, part of a pension can be taken as a tax-free lump sum – a quarter of
the accumulated balance in a defined contribution scheme. (A roughly equivalent rule
applies for defined benefit schemes.) This is money that escapes income tax altogether: it
is taxed neither when it is earned nor when it is withdrawn from the pension.
The existence of such a ‘bonus’ is usually defended as being compensation for the fact
that pensions are constructed to be a highly inflexible form of savings, available only after
a certain age. If, for reasons of public policy, we want people to lock money away for long
periods, we are likely to have to provide them with a good reason for doing so.
That is a strong argument, but it has its limits. At the moment, the size of the lump sum
that can be taken tax-free is limited only by the lifetime limit on the size of a pension pot:
with a £1.25 million lifetime allowance, this means that £312,500 can be taken tax-free.
51 See C. Emmerson ‘A response to the Treasury consultation on restricting pensions tax relief’, IFS Press
Release, March 2010 (http://www.ifs.org.uk/publications/4773).
Broad shoulders and tight belts: options for taxing the better-off
267
While there are good reasons that we might actively encourage people to save a certain
amount for their retirement, it is less clear that people who already have, say, a £1 million
pension fund ought to be subsidised for saving yet more, at the expense of other
taxpayers. There is therefore a powerful case for introducing a cash limit on the amount
that can be taken as a tax-free lump sum, at a level considerably below £312,500.52
Unfortunately, no reliable current estimate exists of the revenue that this would raise.53
More fundamentally, while the case for providing a ‘bonus’ for saving in a pension is
strong, a tax-free lump sum seems like a singularly ill-designed form for such an
inducement to take. Encouraging withdrawal of a tax-free lump sum seems a perverse
way of encouraging people to build up a pension if one of its main purposes is to provide
a regular retirement income (and keep people off means-tested benefits). The current
system also provides a significantly bigger bonus for higher-rate taxpayers than for basic-
rate taxpayers. As the Mirrlees Review notes, there are many alternative ways of
incentivising pension saving that do not have these features.54 For example, the
government could simply top up pension funds at the point of annuitisation, again subject
to a cap: a 5% top-up would be broadly equivalent in value to the tax-free lump sum for a
basic-rate taxpayer (20% of 25%).
Levy NICs on employer contributions
The NICs regime for pensions is quite different from the income tax regime. The
treatment of employee pension contributions is broadly sensible: there is no NICs relief
on contributions, and no NICs are payable on pension income either. However, employer
pension contributions are treated extremely generously: they are excluded from earnings
for both employer and employee NICs – total NICs relief of 22.7% for those earning below
the UEL55 – while the pension income they generate is not subject to NICs either.
Employer pension contributions are the only major form of employee remuneration that
escapes NICs entirely. The government estimates that the NICs exemption of employer
pension contributions cost it £13.0 billion in 2010–11.56
Some might argue that encouraging saving through workplace pensions is a particularly
effective way of raising personal saving. But it is not clear that this warrants net saving
incentives of the magnitude currently in the tax code, or such a large bias towards
contributions coming (formally) from employers rather than employees: a pension
52 To prevent charges of retrospective taxation, the government could consider exempting pension savings
already in place that would exceed the cap.
53 The government previously estimated the total cost of the tax-free lump sum at around £2.5 billion (it was
formerly in HMRC Statistics table 7.9, as cited in, for example, footnote 20 of M. Lloyd and C. Nicholson, ‘A relief for some: how to stop lump sum tax relief favouring the wealthy’, Centre Forum Report, 2011, http://www.centreforum.org/assets/pubs/a-relief-for-some.pdf) but no longer produces an estimate. Note that this £2.5 billion figure assumed that no-one would change their behaviour in response to the reform and that the tax-free lump sums would otherwise be taxed at 20%. Based on this £2.5 billion figure, Lloyd and Nicholson (op. cit.) estimated that restricting the tax-free lump sum to the then higher-rate threshold of £42,475 would raise £0.5 billion per year.
54 Pages 340–1 of J. Mirrlees et al., Tax by Design, OUP for IFS, Oxford, 2011
(http://www.ifs.org.uk/mirrleesreview/design/ch14.pdf).
55 If an employer pays out £100 in pension contributions, that is the amount that goes into the employee’s
pension. A salary payment that costs the employer the same amount would leave the employee with only £77.32, 22.7% less: paying a nominal wage of £87.87 would cost the employer £100 because of 13.8% employer NICs on top of the £87.87, while the employee would lose 12% of the £87.87 in employee NICs, leaving only £77.32. [22.7% is employee NICs of 12% plus employer NICs of 13.8% divided by total employer cost of (100% + 13.8%).]
56 Source: HMRC Statistics table PEN6 (http://www.hmrc.gov.uk/statistics/pension-stats/pen6.pdf).

The IFS Green Budget: February 2013
268
contribution that costs an employer £100 to make would cost him nearly £130 if it comes
instead from an employee earning below the UEL,57 which helps to explain why HMRC
records (income tax relief on) employer contributions as more than three times as great
as employee contributions.58
The obvious solution would be to start charging NICs on employer pension contributions,
so that they are treated like any other form of remuneration. Employer NICs are already
virtually flat rate (other than the earnings threshold) and could readily be charged at a
flat rate on any contributions made by the employer. This solution would, however, be
harder to implement with respect to charging employee NICs on employer pension
contributions. The non-flat-rate structure of employee NICs would require employer
contributions to be allocated to individuals; as mentioned above, that is difficult for
defined benefit pension schemes.
While charging NICs on employer contributions would be a major improvement on the
current system, the Mirrlees Review argued that, in principle, it would be even better to
move towards providing NICs relief on all pension contributions and levying NICs on all
pension income, so that NICs treated pensions in the same way as income tax does (with
the added advantage of moving further towards the integration of income tax and NICs).59
But to avoid retrospective double taxation – levying NICs on pension income despite
having already levied NICs on employee contributions to that pension, undermining the
legitimate expectations of those who have saved up to now – careful transition
arrangements would be needed. However, such a transition could take decades, opening
up the political risk that future governments might not follow through with the plan. And
the transitional arrangements would mean that, while the reform generated significant
revenue in the long run, it would actually cost money up front.
So a government concerned with short-term costs and wary of a difficult transition might
find the less radical option of introducing up-front NICs on employer pension
contributions more palatable. This would be an improvement on the current situation
and would raise an estimated £9.2 billion in 2012–13 even if only charged at the
employer flat rate.60 But it would be a move away from the ideal long-term solution of
providing relief from income tax and NICs on all pension contributions and levying both
these taxes on pension income.
9.9 Options: taxes on wealth and housing
The options considered so far in this chapter relate to taxing flows of income and
expenditure, contributions to savings and the return to savings. We now turn to look at
taxes that are (broadly speaking) more related to measures of wealth. We first examine
the idea of a tax on wealth per se and then consider inheritance tax, which aims to
capture wealth as it is transferred between people. Finally, we look at the taxation of
57 For an employee to contribute £100 to a pension requires earnings of £113.64 (since 12% employee NICs is
taken out of the £113.64), which costs the employer £129.32 (since 13.8% employer NICs is levied on the £113.64).
58 Ibid.
59 Pages 339–40 of J. Mirrlees et al., Tax by Design, OUP for IFS, Oxford, 2011
(http://www.ifs.org.uk/mirrleesreview/design/ch14.pdf).
60 Source: HMRC Statistics table 1.5 (http://www.hmrc.gov.uk/statistics/expenditures/table1-5.pdf).

Broad shoulders and tight belts: options for taxing the better-off
269
housing, focusing on stamp duty land tax – which is a tax on the transfer of property – and
council tax, which is a tax on domestic property.
A wealth tax
If the government wants to raise more tax from the wealthy, the most obvious and direct
route would be to introduce a wealth tax. A tax based on people’s total assessed wealth
could be applied to a sizeable fraction of the population or could be restricted to a very
small number of the super-rich, depending on the size of tax-free allowance that were
chosen. The implications of this choice range from the revenue potential of the tax to its
distributional effects, the nature of the wealth holdings to be taxed (principally ordinary
life-cycle savings or principally amounts that may have been inherited and are unlikely to
be spent in a single lifetime?), the practicalities (is the challenge to value everybody’s
home or to track complex cross-border asset portfolios?) and the politics. Many of the
economic and practical considerations, however, would be similar.
Beyond any superficial attraction, levying a recurrent (for example, annual) tax on stocks
of wealth is not appealing. To limit avoidance and distortions to the way that wealth is
held, as well as for reasons of fairness, the base for such a tax would have to be as
comprehensive a measure of wealth as possible. But many forms of wealth are difficult or
impractical to value, from personal effects and durable goods to future pension rights and
overseas assets – not to mention ‘human capital’. These are very serious practical
difficulties.
Even in principle, however, the case for an annual wealth tax is weak. If all savings earned
the same rate of return, a tax on the stock of savings would in fact be exactly equivalent to
a tax (at a higher rate) on the return to savings. If the rate of return is 5%, then either a
1% tax on wealth or a 20% tax on the return to saving will raise £1 for each £100 of
savings (1% of the £100 wealth or 20% of the £5 return, respectively). The difference in
principle between a tax on assets and a tax on asset returns therefore lies entirely in how
they treat assets that yield unusual returns. To continue the above example, if I am lucky
enough that my £100 earns a 10% return, then a 20% tax on that return will raise £2
from me, whereas a 1% wealth tax will still raise £1 regardless of the return I earn. It is
hard to think of any reason that we would not want to levy more tax on assets that yield
higher returns: such high-return assets are precisely the ones that people will buy even if
they are more heavily taxed, so focusing the tax on those assets would be less
distortionary. A wealth tax discourages me from saving, but it taxes me no more if I
manage to earn extremely high returns on my savings. It is therefore inferior to a tax on
asset returns. Indeed, as noted above, the Mirrlees Review goes further: it argues in
favour of exempting a ‘normal’ return to savings but taxing ‘excess’ returns (for example,
through the Rate of Return Allowance proposal mentioned above). A wealth tax would
therefore be a move in exactly the wrong direction.
A one-off wealth tax would raise somewhat different issues. If it were credibly one-off
and based on a measure of wealth that was fixed before the policy was announced (or
before people began to believe it might happen), then – like any other retrospective
windfall tax – it should have no effect on people’s behaviour and cause no economic
inefficiency.61 This would be true even if the tax were based on a partial and incomplete
61 People’s behaviour could change because of an ‘income effect’: simply being worse off might make people
decide they want (or need) to take action to restore some of their lost wealth. As noted in footnote 22, however, this kind of response is not associated with any economic inefficiency.

The IFS Green Budget: February 2013
270
measure of wealth, provided there was nothing people could do to change their assessed
wealth once they realised the tax was coming. There would be obvious attractions to
raising revenue from the very richest if it could be done without creating economic
distortions – especially if it were felt that much of their wealth had been inappropriately
under-taxed when it was earned and/or inherited. However, a one-off wealth tax of this
kind would still have several disadvantages:
A tax based on a partial measure of wealth might still be viewed as unfair and
discriminatory, penalising people who hold their assets in taxable forms relative to
equally wealthy people whose wealth is in untaxed forms. The difficulty of devising a
practical, comprehensive measure of wealth is therefore still pertinent.
It might also be questioned whether a one-off tax on a snapshot of people’s wealth at
a particular point in time is fair at all. It penalises people who happen to have a great
deal of wealth at that time. There is an arbitrariness inherent in a one-off tax: why
should wealth this year be a better target for taxation than wealth next year, or
indeed wealth last year? As we noted in Section 9.2, people’s wealth holdings at any
given time depend a great deal on what stage of their life cycle they are at, not just on
their lifetime resources. Insofar as it falls on life-cycle savings (rather than wealth
being passed down through successive generations), therefore, a one-off wealth tax
would be very harsh on the cohort that is approaching retirement age when it is
levied.
As with other windfall taxes, it is questionable whether its one-off nature would
really be credible. Once such a tax had been levied, it would be very tempting for
future governments to repeat the exercise: why would the attractions seem less
compelling to a government 10 years later? If people believed – rightly or wrongly –
that this was a possibility, it would discourage them from saving, and encourage
them to take steps to avoid future taxes, in much the same way as a recurrent wealth
tax (to a degree that would depend on how likely and how frequent people perceived
such recurrences to be). Individuals might also expect alternative windfall taxes to be
more likely, which could distort behaviour in other harmful ways. Increasing
uncertainty over the future tax system is highly undesirable.
Whether one-off or annual, therefore, introducing a wealth tax would be fraught with
considerable difficulties.
Inheritance tax
Inheritance tax is probably the UK’s clearest example of a tax aimed squarely at the well-
off. It is charged at 40% on transfers of wealth on (or shortly before) death in excess of
£325,000 – some 19,000 estates in 2011–12, representing only a little over 3% of all
deaths.62 Transfers between spouses or civil partners are exempt, and the inheritance tax
threshold is increased by any unused proportion of a deceased spouse’s or civil partner’s
nil-rate band so that married couples and civil partners can collectively bequeath double
the inheritance tax threshold (i.e. £650,000) tax-free even if the first to die leaves their
entire estate to the surviving partner.
62 Source: Number of taxpaying death estates from HMRC Statistics table 1.4
(http://www.hmrc.gov.uk/statistics/taxpayers/table1-4.pdf); number of deaths from ONS Vital Statistics: population and health reference tables, winter 2012 update (http://www.ons.gov.uk/ons/publications/re-reference-tables.html?edition=tcm%3A77-283563).
Broad shoulders and tight belts: options for taxing the better-off
271
Inheritance tax is hugely – perhaps surprisingly – unpopular: despite the fact that so few
estates are actually liable to pay it, a 2001 study found that around half the population
believed the tax should be abolished altogether.63 This is partly a matter of principle: the
merits, and even the legitimacy, of taxing bequests is a matter on which views tend to be
polarised and often vehemently held. Viewed from the perspective of the donor, it seems
hard to justify: why should I be encouraged to spend my money before I die rather than
providing for my children? Yet viewed from the perspective of the recipient, it can seem
anomalous to tax people on money they have earned while exempting from taxation
money that comes to them through no effort of their own (except perhaps the effort
expended in being kind to elderly loved ones). This perspective emphasises equality of
opportunity: taxing inherited wealth serves (alongside many other policies such as public
expenditure on schooling) to temper differences in life chances that arise purely from
fortunate or unfortunate circumstances of birth, i.e. how wealthy one’s family happens to
be.
But the unpopularity of inheritance tax also reflects perceived inequities in how it
operates in practice. The tax is ridden with loopholes which, as Kay and King (1990) put
it, favour ‘the healthy, wealthy, and well-advised’.64 It tends to fall on the moderately
wealthy, often with their wealth tied up in a house and no idea how to circumvent the tax,
as often as the very richest. Even when the intention is applauded, therefore, the outcome
is frequently condemned.
Raise rate or reduce nil-rate band
The most straightforward ways to increase revenue from inheritance tax would be to
increase the rate (currently 40%) or to reduce the nil-rate band (currently £325,000).
HMRC estimates that each percentage point added to the rate would raise £80 million, so
that (say) a rise from 40% to 50% would raise £0.8 billion. Reducing the nil-rate band by
£5,000 would raise £50 million, but the yield from larger reductions would be more than
proportional to that as inheritance tax started to affect more densely populated ranges of
estate size.65 Reducing the nil-rate band probably has greater revenue-raising potential
than increasing the rate. But it would be less progressive, since it would take the same
cash amount (40% of the amount by which the nil-rate band was reduced) from all
estates liable to tax, rather than taking an amount proportional to the part of estates that
fell above the threshold.
Even for those who support the idea of taxing inheritance, there are better options than
simply increasing the rate or reducing the nil-rate band of an unreformed tax. Increasing
an unreformed inheritance tax would increase the incentive for people to avoid the tax,
whether by transferring assets several years before death, ensuring that wealth is held in
tax-exempt forms before being passed on or some more complicated method; the
plentiful opportunities to do so undermine the revenue yield from the reform as well as
the perceived (in)justice of the outcome. A better approach would be to raise revenue by
addressing some of the loopholes that make inheritance tax so easy to avoid.
63 A. Hedges and C. Bromley, Public Attitudes towards Taxation: The Report of Research Conducted for the
Fabian Commission on Taxation and Citizenship, Fabian Society, London, 2001.
64 J.A. Kay and M.A. King, The British Tax System, OUP, Oxford, 1990.
65 As an extreme illustration, note that simply multiplying up the £50 million number would imply that
abolishing the nil-rate band completely would raise £3.25 billion, whereas HMRC estimates that the total cost of the nil-rate band in 2012–13 was £12.8 billion. Source: HMRC Statistics tables 1.5 and 1.6 (http://www.hmrc.gov.uk/statistics/expenditures/table1-5.pdf, http://www.hmrc.gov.uk/statistics/expenditures/table1-6.pdf).

The IFS Green Budget: February 2013
272
Remove exemption of business assets and agricultural land
At present, agricultural land and unquoted business assets are exempt from inheritance
tax, at a cost to the exchequer of £340 million and £365 million per year respectively.66
While there might conceivably be a case for allowing tax payments to be spread over time
where assets received are illiquid and are to be retained by the recipient, it is hard to see
any justification for the wholesale exemption of these assets. These reliefs create just the
sort of non-neutrality the tax system ought to try to avoid, pushing up the price of
agricultural land and of certain offerings on the AIM market, and providing a large
incentive to keep businesses going and in the family even if there are good financial
reasons for disposing of them sooner – as well as providing an open invitation for people
to buy what might otherwise be wholly inappropriate assets purely as a way to avoid
inheritance tax (albeit with a minimum holding period of the assets to qualify for relief).
Extend taxation to more lifetime transfers
The principal reason why inheritance tax is forecast to raise only £3.3 billion in 2013–
1467 is that it can be circumvented by the simple expedient of passing on wealth during
one’s lifetime. Transfers in the seven years before death are taxed on a sliding scale (from
zero for transfers more than seven years before death to the full 40% rate for transfers
less than three years before death), but gifts made before that are not taxed at all.68 Those
who are able – often the wealthiest – are encouraged to pass on their wealth at a time
dictated by the tax system.
A simple option would be to lengthen the seven-year window before death during which
lifetime transfers are taxable. For example, in 2007, the Liberal Democrats proposed that
only transfers made more than 15 years before death should be exempt, though this was
not ultimately adopted for their 2010 general election manifesto.69 Since there are no
data on wealth transfers occurring more than seven years before death, we cannot know
how much this would raise.
More radically, this could be taken further and inheritance tax reformed to apply at the
same rate to all lifetime transfers and for the tax to be levied on individuals’ lifetime
receipts, rather than on the amount an individual gives or bequeaths. For the most part,
arguments in favour of taxing wealth transferred at death – most notably the ‘equality of
opportunity’ argument for tempering differences in life chances that arise purely from
fortunate or unfortunate circumstances of birth, i.e. how wealthy one’s family happens to
be – apply equally to lifetime transfers. Again, there is no way of knowing how much this
reform would raise, since there are no data on lifetime transfers. This points to a practical
difficulty: it would be hard to monitor lifetime wealth acquisition, so the tax would have
to rely on self-reporting. International mobility would also present practical challenges.
And since there are bound to be ways of providing for children in particular that cannot
easily be taxed – such as the provision of housing, material goods and private education –
one consequence could be to distort decisions in favour of greater provision of untaxed
support rather than taxed wealth transfers. Finally, without a solid political consensus
66 Source: HMRC Statistics table 1.5 (http://www.hmrc.gov.uk/statistics/expenditures/table1-5.pdf). Some
types of business and agricultural property are taxed half the normal rate rather than exempt entirely.
67 Source: table 4.6 of Office for Budget Responsibility, Economic and Fiscal Outlook, December 2012
(http://cdn.budgetresponsibility.independent.gov.uk/December-2012-Economic-and-fiscal-outlook23423423.pdf).
68 Certain lifetime transfers into trusts are taxed.
69 Liberal Democrats, Reducing the Burden, Policy Paper 81, 2007.
Broad shoulders and tight belts: options for taxing the better-off
273
behind such a reform, people might decide to await the next change of government in
anticipation of a more favourable regime. Such formidable practical difficulties mean that
such a reform should not be undertaken lightly, and perhaps not at all. But it is worth
bearing in mind just how unsatisfactory the current halfway house is, and that justifies
paying attention to this more radical option and how far the challenges can be overcome.
It is a very long time since a thorough review of the system of wealth transfer taxation
was carried out. It is surely time to devote some serious resources to determining the
feasibility of taxing lifetime transfers.
Taxing housing
We noted in Section 9.2 that pensions and housing are by far the biggest components of
household wealth. We have already discussed the taxation of pensions in Section 9.8; the
taxation of housing might be another logical place to seek more revenue from those with
the broadest shoulders. In the absence of income tax or CGT on owner-occupied housing
(as discussed in Section 9.7), the UK levies two main taxes on residential property –
stamp duty land tax and council tax. We look at each of these below and then turn briefly
to consider the possibility of adding a new property tax – a ‘mansion tax’ – to the existing
set.
Stamp duty land tax
Both the current coalition government and its Labour predecessor have repeatedly
turned to increasing stamp duty land tax (SDLT) as a revenue raiser. Charged at a flat rate
of 1% on property sales above £60,000 (half of all sales) when Labour came to power in
1997, it is now charged on sales above £125,000 (just over half of sales) at rates rising
from 1% on sales up to £250,000 to 7% on sales above £2 million.70 This transformation
of stamp duty is illustrated in Figure 9.8. While still providing only a small share of
revenues, that share has grown dramatically, pushed by rapid property price rises up to
2007 as well as rate increases. Stamp duty revenue from residential property alone rose
from £0.8 billion (0.26% of total government revenue) in 1997–98 to a peak of
£6.7 billion (1.22% of revenue) in 2007–08, and in 2011–12 stood at £4.2 billion (0.74%
of revenue).71 Might this be a place to turn yet again in search of more revenue from the
well-off?
Table 9.2 shows HMRC’s estimates (which do make an allowance for some behavioural
response) of how much could be raised by increasing the existing SDLT rates on
residential and non-residential property transactions. Increasing all SDLT rates by 1
percentage point would raise £2.3 billion while still leaving the lower-value half of
property transactions free of tax. Each percentage point added to the SDLT rate just for
residential property transactions above £1 million would raise nearly £300 million.
Appealing though it might sound to raise significant sums from those owning high-value
properties (the burden of the tax increase would be felt primarily by the existing owners,
since the need to pay the tax would reduce the amount that potential future buyers would
70 Proportion of sales liable to stamp duty from HMRC Statistics table 16.5
(http://www.hmrc.gov.uk/statistics/transactions/table16-5.pdf; 1997–98 figure from archived version at http://webarchive.nationalarchives.gov.uk/20070108133141/http://www.hmrc.gov.uk/stats/survey_of_prop/table16-5.pdf).
71 Source: Residential stamp duty revenues from HMRC Statistics table 15.2
(http://www.hmrc.gov.uk/statistics/stamp-duty/table15-2.pdf); total public sector receipts from HM Treasury, Public finances databank December 2012 (http://www.hm-treasury.gov.uk/psf_statistics.htm).

The IFS Green Budget: February 2013
274
Figure 9.8. Stamp duty land tax rates
Table 9.2. Revenue yield from stamp duty land tax increases
One percentage point increase in: Revenue (in 2014–15)
1% rate (£125,001a–£250,000 sales) £670 million
3% rate (£250,001–£500,000 sales) £700 million
4% rate (£500,001–£1,000,000 sales) £620 million
5% rate (£1,000,001–£2,000,000 sales)b £130 million
7% rate (sales above £2,000,000)b £160 million
All rates £2,280 million a The threshold is £150,000 for residential properties in certain designated disadvantaged areas and varies for
non-residential properties depending on leasing arrangements. b Applies to residential property transactions in these ranges. Non-residential transactions above £1,000,000
are subject to the 4% rate and are included within that figure.
Source: HMRC Statistics table 1.6 (http://www.hmrc.gov.uk/statistics/expenditures/table1-6.pdf).
be willing to pay), such a course of action would be a mistake. SDLT is a strong contender
for the UK’s worst-designed tax.
One of the most basic tenets of the economics of taxation is that transactions taxes should
be avoided. Assets should be held by the people who value them most: the effect of a
transactions tax such as SDLT is to discourage mutually beneficial transactions, so that
properties are not held by the people who value them most. If a family in a small house
want to move to a larger one (because they are having children, for example) while a
neighbouring family in a large house want to move to a smaller one (perhaps because
their children have grown up and left home), SDLT might discourage them from buying
each other’s houses, leaving both families worse off. At a macroeconomic level, one
manifestation of this is to reduce labour mobility, as people are discouraged from moving
to where suitable jobs are available. The introduction of a 7% SDLT rate on transactions
above £2 million has taken the discouragement of mutually beneficial transactions to new
heights of absurdity: the average SDLT bill for sales subject to this rate was expected to
be around £270,00072 – more than the UK average house price. In other words, if the two
72 Budget 2012 estimated that the introduction of the 7% rate would raise £235 million in the absence of
behavioural response (page 23 of http://cdn.hm-treasury.gov.uk/budget2012_policy_costings.pdf) and that ‘there are currently around 3,000 residential property transactions per annum at over £2 million’
£0
£20,000
£40,000
£60,000
£80,000
£100,000
£120,000
£140,000
£160,000
£180,000
£200,000
£0 £500,000 £1,000,000 £1,500,000 £2,000,000 £2,500,000
Sta
mp
du
ty l
iab
ilit
y
Sale price
February 2013
May 1997
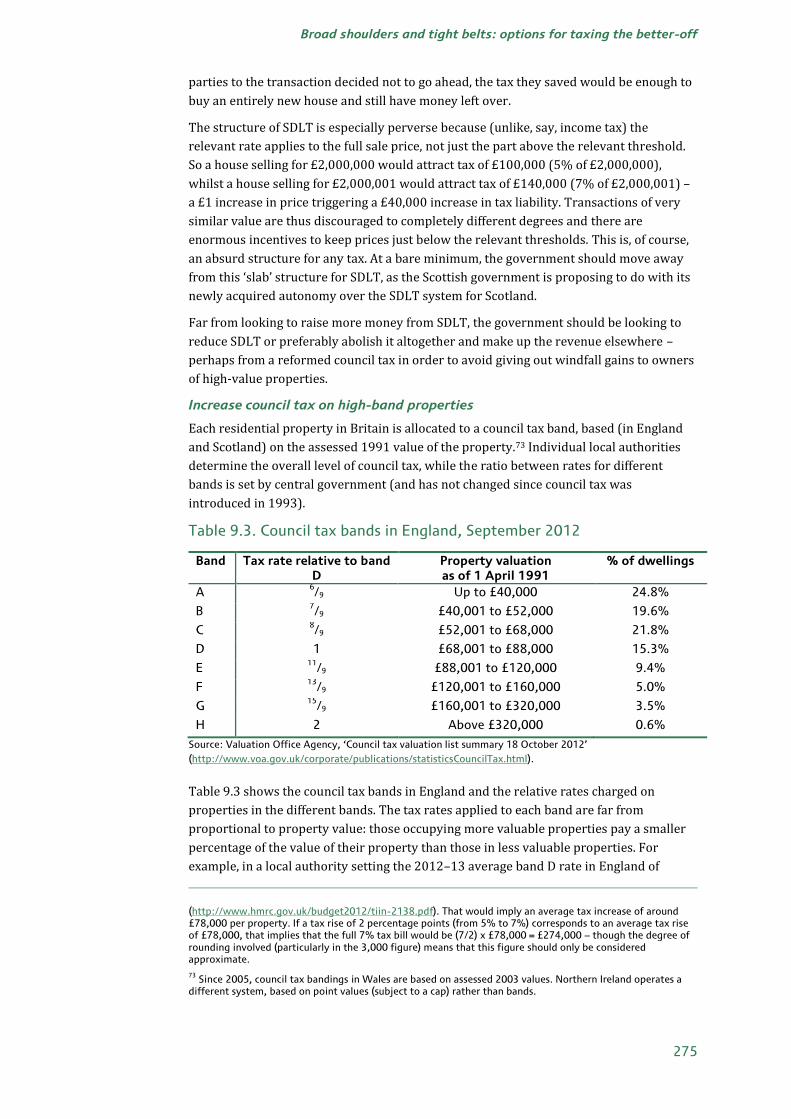
Broad shoulders and tight belts: options for taxing the better-off
275
parties to the transaction decided not to go ahead, the tax they saved would be enough to
buy an entirely new house and still have money left over.
The structure of SDLT is especially perverse because (unlike, say, income tax) the
relevant rate applies to the full sale price, not just the part above the relevant threshold.
So a house selling for £2,000,000 would attract tax of £100,000 (5% of £2,000,000),
whilst a house selling for £2,000,001 would attract tax of £140,000 (7% of £2,000,001) –
a £1 increase in price triggering a £40,000 increase in tax liability. Transactions of very
similar value are thus discouraged to completely different degrees and there are
enormous incentives to keep prices just below the relevant thresholds. This is, of course,
an absurd structure for any tax. At a bare minimum, the government should move away
from this ‘slab’ structure for SDLT, as the Scottish government is proposing to do with its
newly acquired autonomy over the SDLT system for Scotland.
Far from looking to raise more money from SDLT, the government should be looking to
reduce SDLT or preferably abolish it altogether and make up the revenue elsewhere –
perhaps from a reformed council tax in order to avoid giving out windfall gains to owners
of high-value properties.
Increase council tax on high-band properties
Each residential property in Britain is allocated to a council tax band, based (in England
and Scotland) on the assessed 1991 value of the property.73 Individual local authorities
determine the overall level of council tax, while the ratio between rates for different
bands is set by central government (and has not changed since council tax was
introduced in 1993).
Table 9.3. Council tax bands in England, September 2012
Band Tax rate relative to band D
Property valuation as of 1 April 1991
% of dwellings
A 6/9 Up to £40,000 24.8%
B 7/9 £40,001 to £52,000 19.6%
C 8/9 £52,001 to £68,000 21.8%
D 1 £68,001 to £88,000 15.3%
E 11
/9 £88,001 to £120,000 9.4%
F 13
/9 £120,001 to £160,000 5.0%
G 15
/9 £160,001 to £320,000 3.5%
H 2 Above £320,000 0.6%
Source: Valuation Office Agency, ‘Council tax valuation list summary 18 October 2012’
(http://www.voa.gov.uk/corporate/publications/statisticsCouncilTax.html).
Table 9.3 shows the council tax bands in England and the relative rates charged on
properties in the different bands. The tax rates applied to each band are far from
proportional to property value: those occupying more valuable properties pay a smaller
percentage of the value of their property than those in less valuable properties. For
example, in a local authority setting the 2012–13 average band D rate in England of
(http://www.hmrc.gov.uk/budget2012/tiin-2138.pdf). That would imply an average tax increase of around £78,000 per property. If a tax rise of 2 percentage points (from 5% to 7%) corresponds to an average tax rise of £78,000, that implies that the full 7% tax bill would be (7/2) x £78,000 = £274,000 – though the degree of rounding involved (particularly in the 3,000 figure) means that this figure should only be considered approximate.
73 Since 2005, council tax bandings in Wales are based on assessed 2003 values. Northern Ireland operates a
different system, based on point values (subject to a cap) rather than bands.

The IFS Green Budget: February 2013
276
£1,444,74 someone with a property at the midpoint of band D (£78,000) will pay 1.85% of
its 1991 valuation, while someone with a property at the midpoint of band G (£240,000)
will pay £2,406, or 1.00% of its 1991 valuation. This unfairly and inefficiently favours
more valuable properties, and in particular the most valuable properties.
A simple reform that would raise revenue from households that are relatively well-off on
average while making council tax more proportional to property value would be to
increase the tax rates applied to high-value properties. Figure 9.9 shows the
distributional impact of doubling council tax rates for just band H (which would affect the
top 0.6% of properties and raise £0.3 billion), for bands G and H (raising £2.0 billion from
the top 4.1% of properties), for bands F, G and H (raising £4.1 billion from the top 9.1% of
properties) and for bands E, F, G and H (raising £7.3 billion from the top 18.5% of
properties).75
Figure 9.9. Distributional impact of doubling council tax rates in certain
bands
Notes: As Figure9.5.
Source: As Figure 9.6.
Increasing council tax on high-value properties would certainly hit wealthy households
hardest. It would also be progressive across the income distribution. But there are some
people living in big houses but with low current incomes. Households of this kind would
be protected from council tax rises if they were receiving Council Tax Benefit; but those
who do not take up their entitlements (which we do not model in the figure) and those
who are not entitled to Council Tax Benefit despite their low current income because they
have substantial financial assets (which we do model) would lose out from the reform. Of
course, only a small fraction of the losers from these reforms would fall into that category.
And how offensive one finds the idea that such people should lose out depends in part on
whether one views people with high wealth but low income as rich or poor.
74 Source: https://www.gov.uk/government/publications/council-tax-levels-set-by-local-authorities-in-
england-2012-to-2013-revised.
75 Source: authors’ calculations using the IFS tax and benefit microsimulation model, TAXBEN, to apply the
2013–14 tax and benefit system to uprated data from the 2010–11 Family Resources Survey. Assumed that council tax rates are frozen in nominal terms in 2013–14.
-1.4%
-1.2%
-1.0%
-0.8%
-0.6%
-0.4%
-0.2%
0.0%
Poorest 2 3 4 5 6 7 8 9 Richest Total
Pe
rce
nta
ge
ch
an
ge
in
ne
t in
com
e
Income decile group
Band E
Band F
Band G
Band H

Broad shoulders and tight belts: options for taxing the better-off
277
A practical advantage of adjusting the band ratios of the existing council tax is that, unlike
the reforms considered below, it would not require any new property valuations.
However, before putting too much weight on that consideration, it is worth remembering
quite how out-of-date valuations now are. It is absurd that we tax people on what their
properties were worth (or would have been worth) 22 years ago; it is surely unthinkable
that this should be allowed to continue so that we are still using 1991 values in another
22 years’ time. Any property tax requires regular revaluations. One is long overdue in
England and Scotland, and the process should begin as soon as possible even if no other
reforms were to happen. However, a revaluation would also provide a welcome
opportunity to move towards a tax that is fully proportional to property values more
accurately than can be done by adjusting the band ratios in an otherwise unreformed
council tax.
Adding new council tax bands
Instead of (or as well as) increasing council tax on existing bands, the government could
add one or more new bands at the top, to focus tax increases even more tightly on just the
very highest-value properties – as the Welsh government did when it added a band I
(paying 21/3 times the band D rate) to its council tax in 2005.
Subdividing band H in this way would require a revaluation, but that could be a much
smaller exercise than a full revaluation as only those 0.6% of properties that are currently
in band H would need to be valued.
However, with so few properties in band H, the revenue yield from applying higher rates
to only a subset of those would be very small unless the tax increase for each affected
household were astronomical. There are currently 133,000 properties in England in band
H;76 if, say, half of them were put into a new band H+, those 66,500 properties would have
to see their council tax bills increase by over £15,000 per year on average (over and
above what they are paying already) in order to raise £1 billion from this policy.
A ‘mansion tax’
The 2010 Liberal Democrat general election manifesto proposed a new ‘mansion tax’ at a
rate of 1% per year on properties worth over £2 million, paid on the value of the property
above that level. No firm costings are available for such a tax, but the Liberal Democrat
manifesto estimated that that particular variant would raise £1.7 billion per year, with a
tax bill averaging £24,000 on 70,000 affected properties.77
Introducing a ‘mansion tax’ would entail some additional administrative cost in
estimating the value of those properties that it is thought might be worth more than £2
million. (The Liberal Democrats proposed to value only properties in the top council tax
band, which would miss only a few properties that have grown enormously in value since
1991 to reach £2 million.)
The ‘mansion tax’ has a sensible logic underpinning it: if property is to be taxed, it makes
sense to levy such a tax in proportion to property value and to base it on up-to-date
valuations, as we argued above. However, this raises the question, ‘why not follow the
logic of the mansion tax through to its conclusion?’: rather than add a mansion tax on top
of an unreformed and deficient council tax, it would be better to reform council tax itself
76 Source: Valuation Office Agency, ‘Council tax valuation list summary 18 October 2012’
(http://www.voa.gov.uk/corporate/publications/statisticsCouncilTax.html).
77 For more analysis, see S. Adam, M. Brewer, J. Browne and D. Phillips, Taxes and Benefits: The Parties’
Plans, IFS Election Briefing Note 13, 2010 (http://www.ifs.org.uk/bns/bn100.pdf).

The IFS Green Budget: February 2013
278
to be (like the proposed mansion tax) proportional to up-to-date property values. A
sensibly reformed council tax, increased to make up the revenue from abolishing SDLT,
would make for a much more coherent system for taxing property.
9.10 Conclusions
The extent of redistribution embodied in the tax and benefit system is a political choice
for governments and electorates, and we take no stance on it. But the government’s own
statements suggest that it wants the largest burden of fiscal consolidation to fall on the
best-off in society. If the government decides that it wants to raise more tax revenue from
those with the broadest shoulders, it should be clear first of all what it means by that.
Does it mean those with high incomes or those with a lot of wealth? Those are two
different groups. It also matters a great deal whether they want to target those in the top
half of the income/wealth distribution, or focus more narrowly on the top 10% or even
1%. It is important for the public debate to recognise first that to be in the top 10% of the
income distribution, a single person needs an after-tax income of under £600 a week and
a couple a combined income of less than £1,000 a week. These people may or may not be
considered ‘rich’ but they are certainly not ‘super-rich’. It is also important to understand
that those on higher incomes already pay a large proportion of total tax. And the very
richest have borne a bigger share of the burden of fiscal consolidation than have other
income groups, although the remainder of the top half of the income distribution have
not.
The policies that would target each of these groups – top half, top 10% or top 1%, by
income or by wealth – are somewhat different. But whichever is the target group, it is
vital that any additional revenue be raised from them as efficiently as possible,
minimising administrative costs and economic distortions and moving the tax system
towards, rather than away from, being a rational and coherent system as a whole.
Table 9.4 summarises the estimated revenue yield of various reforms discussed in this
chapter for which the likely yield is estimated with some confidence, while Table 9.5
shows those for which revenue yields are unknown or highly uncertain.
If the goal is to raise revenue primarily from the better-off half of households, with the
better-off paying more, then the government could simply increase the rates of one of the
main broad-based taxes – income tax, NICs or VAT. Small increases in the main rates of
these taxes could raise relatively large sums, because they are spread across a lot of
people. Of these, increasing VAT would be the least progressive (while still somewhat
progressive, contrary to popular perception), but also the least damaging to work
incentives. Each of these would also involve exacerbating another existing distortion in
the tax system – to savings decisions, to the troublesome labour/capital distinction or to
consumption patterns.
The government could target the highest-income 10% of the population more closely by
restricting increases to the higher rate of income tax or the additional rate of NICs. But
the fact that these affect so many fewer people means that raising a given amount of
revenue would entail much bigger increases in tax rates – and much more damage to
work incentives – among those affected than using all rates of these taxes.
If the government wants to target savings and wealth rather than earnings, it should start
with a clear view as to how it wants savings to be taxed. It is hard to identify any set of
objectives that could justify the current system.

Broad shoulders and tight belts: options for taxing the better-off
279
Table 9.4. Summary of possible reforms for which revenue yield
estimated with relative confidence
Reform Revenue yield (2014–15 unless otherwise stated)
Broad-based taxes on income and spending
Increase all rates of income tax by 1p £5.7 billion
Increase all rates of NICs by 1p £4.7 billion
Increase main rate of VAT by 1p £5.3 billion
Income tax and NICs rates for higher earners
Increase higher rate of income tax by 1p £1.1 billion
Increase additional rate of NICs by 1p £0.8 billion
Capital gains tax
Increase lower rate of CGT by 1p Negligible
Increase higher rate of CGT by 1p £0.1 billion
Taxes on wealth and housing
Increase inheritance tax rate by 1p £0.1 billion
Increase all SDLT rates by 1p £2.3 billion
Increase SDLT rates above £1 million by 1p £0.3 billion
Double council tax for bands G and H £2.0 billiona
Double council tax for bands E to H £7.3 billiona
a 2013–14 estimate.
Notes: These revenue estimates can be scaled (within reason) to estimate the yield of larger or smaller
changes. See text for further details and sources.
There may be good reasons to encourage people to save a certain amount in a pension,
but it is hard to justify the extraordinarily generous NICs treatment of employer pension
contributions and hard to see why people with very large pension pots should be able to
draw a lump sum of as much as £312,500 tax-free. Reforming either of these reliefs could
make the taxation of pensions more coherent. In contrast, restricting the rate of tax relief
on pension contributions undermines the entire logic of pension taxation and would be
complex, unfair and inefficient.
The Mirrlees Review argued that the introduction of a Rate of Return Allowance for
savings outside pensions and ISAs would enable the system to fit together as a whole and
dissipate many of the problems that plague capital gains tax in its current form. But even
without an RRA, it is difficult to justify the generosity of entrepreneurs’ relief and
impossible to justify the forgiveness of CGT on death.
If the government believes that bequests ought not to be taxed, then inheritance tax
should be abolished. Otherwise, it should consider whether there is any reason not to tax
inter vivos gifts in the same way. Less radically, the government should look at the reliefs
for business and agricultural property, which create harmful distortions and provide an
open door to tax avoidance.
The taxation of housing is a mess. There is no good argument for taxing housing
transactions, as stamp duty land tax does. There are good arguments for levying a tax on
property values – but not for charging a lower percentage tax rate on high-value
properties and basing it on valuations that are 22 years out of date, as council tax does.
Increasing council tax rates for high-band properties would go some way towards making
council tax more proportional to property values, but it would be better to conduct a full

The IFS Green Budget: February 2013
280
revaluation and make a reformed tax fully proportional to those up-to-date valuations,
preferably replacing the revenue from an abolished SDLT in the process.
Finally, the government could consider introducing an entirely new tax, such as a wealth
tax or a ‘mansion tax’. But many of the existing taxes examined in this chapter – CGT, IHT
SDLT and council tax – could be improved in a way that both makes them more efficient
and, if so desired, raises more revenue from the rich. It would be sensible to look at
reforming these taxes before considering the introduction of new ones.
Table 9.5. Summary of possible reforms for which revenue yield unknown
or highly uncertain, with no allowance for behavioural response
Reform Approximate revenue yield (year varies)
Capital gains tax
Reduce/abolish CGT annual exempt amount Up to £2.6 billion.a A £500 reduction
would raise £20 million (allowing for some behavioural response) but that
figure cannot be scaled up.
Merge income tax and CGT allowances Unknown
Abolish CGT entrepreneur’s relief Up to £1.7 billiona
Abolish forgiveness of CGT at death £0.5 billion
Abolish CGT exemption of main homes Up to £9.9 billiona
Taxation of private pensions
Reduce annual or lifetime pension contribution cap
Unknown
Restrict pension tax relief to the basic rate £8.6 billion
Cap the tax-free lump sum in pensions Unknown, but previous HMRC estimate suggested up to £2.5 billion
Introduce employer NICs on employer pension contributions
£9.2 billion
Introduce employer and employee NICs on employer pension contributions
£13.0 billion
Taxes on wealth and housing
Introduce a wealth tax Unknown
Reduce/abolish inheritance tax nil-rate band Up to £12.8 billiona. A £5,000 reduction
would raise £50 million (allowing for some behavioural response) but that
figure cannot be scaled up.
Abolish inheritance tax exemption of business assets
£0.4 billion
Abolish inheritance tax exemption of agricultural land
£0.3 billion
Extend 7-year rule in inheritance tax Unknown
Extend inheritance tax to all lifetime transfers
Unknown
Add new, higher council tax band(s) Unknown
Introduce a ‘mansion tax’ Unknown a Figure shown is the estimated amount by which the total relief reduces tax liabilities.
Note: See text for further details and sources.