strategies and options for increasing and sustaining...
TRANSCRIPT

Strategies and Options for Increasing and Sustaining Fisheries and Aquaculture Production
to Benefit Poorer Households in Asia
The WorldFish Center
APPENDICES

182 Strategies and Options for Increasing and Sustaining Fisheries and Aquaculture Production to Benefit Poorer Households in Asia
Appendices available on CD
Appendix 1: 185
National project team composition for the nine DMCS, ADB-RETA 5945
Appendix 2 189
Table 1 Summary of fisheries laws and regulations in the selected countries
Table 2 Land tenure and water-use rights in the selected countries
Table 3 Co-management, community-based management, and decentralization in the
selected countries
Table 4 Roles of local organizations, private sector and NGOs in the selected countries
Table 5 International involvement in fisheries in the selected countries
Appendix 3 204
Source of data on the demand side
Econometric approaches to demand
Model and estimation procedure for the study
Data tables
Table 1 Summary of consumption data sources for the selected countries
Table 2 Summary of production data sources in the selected countries
Table 3 Supply parameter estimates by production system and fish type in nine
DMCs
A.1 Supply parameters for inland cultured fish, Bangladesh
A.2 Supply parameters for inland captured fish, Bangladesh
A.3 Supply parameters for brackishwater cultured shrimp, Bangladesh
B.1 Supply parameter for marine captured fish, Malaysia
B.2 Supply parameters for brackishwater aquaculture fish, Malaysia
B.3 Supply parameters for freshwater aquaculture fish, Malaysia
C.1 Supply parameters for municipal captured fish, Philippines
C.2 Supply parameters for aquaculture fish, Philippines
D.1 Supply parameters for marine captured fish, Thailand
D.2 Supply parameters for coastal aquaculture fish, Thailand
D.3 Supply parameters for freshwater aquaculture fish, Thailand
E.1 Supply parameters for cultured carp, Vietnam
E.2 Supply parameters for cultured catfish, Vietnam
E.3 Supply parameters for cultured tilapia, Vietnam
E.4 Supply parameters for cultured shrimp, Vietnam
Table 4 Fish supply and input demand elasticity estimates by production system
and fish type in nine DMCs
A.1 Elasticities for inland cultured fish, Bangladesh
A.2 Elasticities for inland captured fish, Bangladesh
A.3 Elasticities for brackishwater cultured shrimp, Bangladesh
B.1 Elasticities for aquaculture fish, China
B.2 Elasticities for captured fish, China

183
C.1 Elasticities for aquaculture fish, India
C.2 Elasticities for marine captured fish, India
D.1 Elasticities for marine captured, marine cultured, inland captured and
inland cultured fish, Indonesia
E.1 Elasticities for marine captured fish, Malaysia
E.2 Elasticities for brackishwater aquaculture fish, Malaysia
E.3 Elasticities for freshwater aquaculture fish, Malaysia
F.1 Elasticities for municipal captured fishery, Philippines
F.2 Elasticities for aquaculture fish, Philippines
G.1 Elasticities for marine captured fish, Sri Lanka
G.2 Elasticities for municipal captured fish, Sri Lanka
G.3 Elasticities for aquaculture fish, Sri Lanka
H.1 Elasticities for marine captured fish, Thailand
H.2 Elasticities for coastal aquaculture fish, Thailand
H.3 Elasticities for freshwater aquaculture fish, Thailand
H.4 Elasticities for inland captured fish, Thailand
I.1 Elasticities for cultured carp, Vietnam
I.2 Elasticities for cultured catfish, Vietnam
I.3 Elasticities for cultured tilapia, Vietnam
I.4 Elasticities for cultured shrimp, Vietnam
Appendix 4 234
Table 1 Supply and demand elasticities by types of fish in nine DMCs
A.1 Supply elasticities by types of fish, Bangladesh
A.2 Demand elasticities by types of fish, Bangladesh
B.1 Supply elasticities by types of fish, China
B.2 Demand elasticities by types of fish, China
C.1 Supply elasticities by types of fish, India
C.2 Demand elasticities by types of fish, India
D.1 Supply elasticities by types of fish, Indonesia
D.2 Demand elasticities by types of fish, Indonesia
E.1 Supply elasticities by types of fish, Malaysia
E.2 Demand elasticities by types of fish, Malaysia
F.1 Supply elasticities by types of fish, Philippines
F.2 Demand elasticities by types of fish, Philippines
G.1 Supply elasticities by types of fish, Sri Lanka
G.2. Demand elasticities by types of fish, Sri Lanka
H.1 Supply elasticities by types of fish, Thailand
H.2 Demand elasticities by types of fish, Thailand
I.1 Supply elasticities by types of fish, Vietnam
I.2 Demand elasticities by types of fish, Vietnam

184 Strategies and Options for Increasing and Sustaining Fisheries and Aquaculture Production to Benefit Poorer Households in Asia
Appendix 5 242
Twelve articles from Aquaculture Economics and Management volume 9 (issue 1 and 2)
January 2005
Aquaculture—food and livelihoods for the poor in Asia: A brief overview of the issues
Status and economics of freshwater aquaculture in selected countries of Asia
Technical efficiency of freshwater pond polyculture production in selected Asian countries:
estimation and implication
Economic feasibility of community-based fish culture in seasonally flooded rice fields in
Bangladesh and Vietnam
Fish consumption and food security: a disaggregated analysis by types of fish and classes of
consumers in selected Asian countries
Disaggregated analysis of fish supply, demand, and trade in Asia: baseline model and
estimation strategy
Demand for fish in the Philippines: a disaggregated analysis
The effects of export prices on the demand and supply for fish in the Philippines
China’s accession to the WTO and its implications for the fishery and aquaculture sector
Food safety standards and regulatory measures: implications for selected fish exporting Asian
countries
Inland aquaculture in India: past trend, present status and future prospects
The farming practices and economics of aquaculture in Thailand

185Appendix 1
International team
Name Institution
1. Dr Madan Mohan Dey The WorldFish Center
2. Dr Mahfuz Ahmed The WorldFish Center
3. Dr Roehlano M. Briones The WorldFish Center
4. Mr Paraguas J. Ferdinand The WorldFish Center
5. Ms Rowena Valmonte-Santos The WorldFish Center
6. Ms Roslina Kamaruddin The WorldFish Center
7. Ms Lay Hooi The WorldFish Center
8. Ms Yap Poh Peng The WorldFish Center
9. Ms Noraini Yaacob The WorldFish Center
10. Ms Chen Oai Li The WorldFish Center
Bangladesh
Name Institution
1. Mr Nasir Uddin Ahmed Department of Fisheries
2. Dr Mokammel Hossain Department of Fisheries
3. Prof Muhammad Sirajul Haque University of Chittagong
4. Dr Md. Belayat Hossain University of Chittagong
5. Prof Rezaul Karim TalukderBangladesh Agricultural University, Mymensingh
6. Prof Shamsul Alam Bangladesh Agricultural University
Appendix 1
NATIONAL PROJECT TEAM COMPOSITION FOR THE NINE DMCS, ADB-RETA 5945

186 Strategies and Options for Increasing and Sustaining Fisheries and Aquaculture Production to Benefit Poorer Households in Asia
China
Name Institution
1. Dr Jikun Huang Center for Chinese Agricultural Policy (CCAP)
2. Dr Luping Li Center for Chinese Agricultural Policy (CCAP)
3. Ms Haomiao Liu Center for Chinese Agricultural Policy (CCAP)
4. Dr Miao Weimin Freshwater Fisheries Research Center ( FFRC)
5. Mr Yuan Yongming Freshwater Fisheries Research Center ( FFRC)
India
Name Institution
1. Dr Mruthyanjaya Indian Council of Agricultural Research
2. Dr P. K. Joshi Indian Council of Agricultural Research
3. Dr Anjani Kumar Indian Council of Agricultural Research
4. Dr Praduman Kumar Indian Agricultural Research Institute (IARI)
5.Dr Narayana Pillai Gopalakrishna Pillai
Indian Council of Agricultural Research
6. Dr Pradeep K. Katiha Indian Council of Agricultural Research
7. Dr Ramachandra Bhatta University of Agricultural Sciences (UAS)
8. Dr R.L. Shiyani Gujrat Agricultural University
Indonesia
Name Institution
1. Dr Widodo Farid Ma’ruf Ministry of Marine Affairs and Fisheries
2. Dr Sonny Koeshendrajana Ministry of Marine Affairs and Fisheries
3. Mr Subhechanis Saptanto Ministry of Marine Affairs and Fisheries
4. Dr Purwanto Ministry of Marine Affairs and Fisheries
5. Dr Ismayanti Ministry of Marine Affairs and Fisheries
6. Dr Indah Susilowati Fakultas Ekonomi Universitas, Diponegoro
7. Dr Achmad Fauzy Syam Institut Pertanian Bogor
8. Dr Fatuhri Sukadi Ministry of Marine Affairs and Fisheries

187Appendix 1
Malaysia
Name Institution
1. Dr Ishak Hj. Omar Universiti Putra Malaysia (UPM)
2. Prof Nik Mustapha Raja Abdullah Universiti Putra Malaysia (UPM)
3. Dr Tai Shzee Yew Universiti Putra Malaysia (UPM)
4. En Kusairi Mohd. Noh Universiti Putra Malaysia (UPM)
5. En Alias Radam Universiti Putra Malaysia (UPM)
6. Ms Munira Asran Department of Fisheries
7. Dr Kamaruzaman Hj. Salim Department of Fisheries
8. Ms Lim Chai Fong Department of Fisheries
9. Ms Tan Gaik Hong Department of Fisheries
10. Mr Azmi Othman Lembaga Kemajuan Ikan Malaysia (LKIM)
11. Mr Tuan Haji Amir Bin Taib Lembaga Kemajuan Ikan Malaysia (LKIM)
Philippines
Name Institution
1. Dr Yolanda T. Garcia University of the Philippines at Los Banos
2. Dr Achilles Costales University of the Philippines at Los Banos
3. Mr U-Primo Rodriguez University of the Philippines at Los Banos
4. Dr Reynaldo L. Tan University of the Philippines at Los Banos
5. Ms Sheryl Ma. M. Navarez University of the Philippines at Los Banos
6. Dr Nelson Lopez Bureau of Fisheries and Aquatic Resources
7. Dr Jonathan O. Dickson Bureau of Fisheries and Aquatic Resources
Sri Lanka
Name Institution
1. Dr G. Piyasena Department of Fisheries and Aquatic Resources (DFAR)
2. Ms A H. S. Ediriweera Department of Fisheries and Aquatic Resources (DFAR)
3. Dr Rekha Maldeniya National Aquatic Resources Research And Development Agency (NARA)
4. Dr R.M.U.D. Push Pakumara
National Aquaculture Development Authority (NAQDA)

188 Strategies and Options for Increasing and Sustaining Fisheries and Aquaculture Production to Benefit Poorer Households in Asia
5. Mr Athula SenaratneNational Aquaculture Development Authority (NAQDA)
6. Mr J. A. D. Jayasooriya Department of Fisheries and Aquatic Resources (DFAR)
7. Dr P. P. G. S. N. Siriwardane Department of Fisheries and Aquatic Resources (DFAR)
8. Dr Sunil Jayakody Department of Fisheries and Aquatic Resources (DFAR)
Thailand
Name Institution
1. Dr Somying Piumsombun Department of Fisheries
2. Dr Pongpat Boonchuwongse Department of Fisheries
3. Ms Nartaya Srichantuk Department of Fisheries
4. Dr Ayut Nissapa Prince of Songkhla University
5. Dr Somsak Boromthanarat Prince of Songkhla University
Vietnam
Name Institution
1. Dr Ha Xuan Thong Institute of Fisheries Economics and Planning
2. Mr Phung Giang Hai Institute of Fisheries Economics and Planning
3. Dr Dao The Anh Vietnam Agricultural Science Institute
4. Ms Dao Kim Mien Vietnam Agricultural Science Institute
5. Dr Nyugen Van Hao Research Institute for Aquaculture No. 2 (RIA2)
6. Prof Nguyen Tri Khiem An Giang University

189Appendix 2
Appendix 2
Country Formal rules Informal rules Level of enforcement
Bangladesh− Four sets of formal laws− Law prohibits collecting of hilsha juveniles
- At grass-root level, especially in the hill tribe area where there are informal rules
− Insufficient enforcement
− Corruption
China
− Renewal of land contract system in 1994/95 Fisheries Law (2000)
− No-catch season has enhanced fishery resources since 1995− MOA revised the regulation for issuing fish license, fry and
fingerling collection in 1997 − Free market of aquatic products have gradually emerged in
China since mid-1980s− Agriculture law (1993)− Fisheries law (1986, amended in 2000)− Marine environmental protection law (1982)− Agricultural technology extension law (1993)− Reproduction and preservation of aquatic resources, issued by
the state council in 1979− Regulation on no-catch season (1995, amended in 1998),
issued by MOA− Regulation on reservoir safety and preservation of aquatic
resources (1979), issued by state council− Protection zone for young fish (1981) issued by state council− Transportation safety in fishing port waters (1989), issued by
state council− Protection of aquatic wild animals (1993), issued by MOA− Management of marine fishing vessels (1983), MOA− Resolution on further accelerating the development of
fisheries (1997), state councils− Water pollution prevention law (1994, amended in 1996)− Fishing license (1989, amended in 1997), MOA− Provision of fishmeal production (1984), MOA− Management of fry and fingerling (1992, amended in 1997),
MOA− Regulation on verification of pedigree and high quality
varieties of aquatic species (1993), MOA− Management of frozen fish and cold storage firms (1979), State
Fisheries Bureau− Regulation on wholesale wet market (1996), MOA, and State
Industry and Commerce Administration− Regulation on restricted marine fishing intensity (1997)
- Locally specific and limited formal acceptance
- Most effective in the centralized administration
Appendix 2, Table 1 Summary of Fisheries Laws and Regulations in the Selected Countries

190 Strategies and Options for Increasing and Sustaining Fisheries and Aquaculture Production to Benefit Poorer Households in Asia
Country Formal rules Informal rules Level of enforcement
India
− Wildlife Protection Act (1972)− Prevention of Food Adulteration Act (1954)− Fishery Act − Maritime Zone Act (1975)− All maritime states have similar laws for fishing and other
related activities − Environmental Protection Act (1986)− Land Reform Act (1997)− Court Directive to establish a Coastal Zone Management
Authority− The Supreme Court of India has banned intensive shrimp
farming within 500 meters from coast. Extensive and improved extensive production systems are allowed.
− Constitution of Aquaculture Authority to issue license for traditional and improve traditional aquaculture within CRZ (1997)
− GOI Notification (2002) on the use of certain chemicals.
- Not recognized in the formal institutions
− Due to vast magnitude, institutional and authority systems are under the open access regime
− Poor enforcement of laws and regulations
Indonesia
− Constitution of Indonesia (1945)− Fisheries Act (1985) or Act No.9 (1985) deals with many aspects
of fisheries− Act No. 5 (1983) deals with EEZ of UNCLOS− Regulation No. 15 (1984) provides detailed regulations on
fishing activities in the EEZ− Regulation No. 15 (1990) deals with licensing, fish business− Regulation No. 46 (1993) deals with allocation of fees to
the central and provincial governments. Currently the GOI is drafting government regulation on fishery resource management and fisheries infrastructure on the basis of Act No.9 (1985)
− Ministry Decree No. 473 (1985) total allowable catch in IEEZ− Ministry Decree No. 475 (1985) on permit for persons and
foreign legal entities engaged in fishing in IEEZ− Ministry Decree No. 476 (1985) on the reporting requirements
for fishing vessels permitted to fish in IEEZ− Ministry Decree No. 477(1985) on the fishing fees imposed on
foreign persons or legal entities with further amendments by the Minister Decree No. 438 of 1986 and no. 477 of 1988
− Ministry Decree No. 277 (1986) on fishing permits in Indonesian waters and EEZ
- Traditional fisheries management or indigenous knowledge such as Sasi, Panglima Laut, Lubuk Larangan, Lebak Lebung, Maawu Dfanau, Ikan Larangan, I kan Diniatkan, Suaka Perikanan, etc.
- Fairly effective in the local and specific conditions

191Appendix 2
Country Formal rules Informal rules Level of enforcement
Indonesia (continued)
−Agriculture Ministerial Decree No. 607 (1976) on coastal fishing zones
− Agriculture Ministerial Decree No. 608 (1976) on fishing zones of the government-owned company’s vessels
− Presidential Decree No. 39 (1980) on banning all trawlers from waters off Java and Sumatra
− Presidential Instruction No. 11 (1982) on extending the trawl ban throughout Indonesia
−Government Regulation No. 20 (1990) concerning water pollution control
− Act No. 24 (1992) concerning spatial planning− Act No. 4 (1982) concerning the management of environment− Government Regulation No. 19 (1994) concerning the
management of dangerous and poisonous wastes− Agriculture Ministerial Decree No. 2 (1995) concerning
the technical guidelines for analysis of the environmental impact of the agriculture activities and business
− Agriculture Ministerial Decree No. 752 (1994) concerning the technical guidelines for effort of environmental management and monitoring of the agriculture activities and businesses (This decree requires environmenta management and monitoring plans for a farm that cultivates shrimps on a pond area of 5 ha - < 50 ha adopting semi-intensive production intensities with a processing unit or intensive production intensities)
− Autonomy Act No. 22 (1999) providing greater authority to provincial and district governments in managing and conserving marine resources (0-4 nautical miles managed by district government, 4-12 miles by provincial government, and > 12 miles by the central government)
− Act No. 11 (1974) concerning irrigation− Government Regulation No. 22 (1982) concerning water
resource utilization control− Government Regulation No.20 (1990) concerning water
pollution control− Act No. 24 (1992) concerning the management of dangerous
and poisonous wastes− Presidential Decree No. 39 (1980) concerning trawl ban− Presidential Decree No. 23 (1982) concerning the development
of mariculture in Indonesian waters− Agriculture Ministerial Decree No. 473 (1982) concerning the
guidelines for the implementation of the development of mariculture in Indonesian waters
− Presidential Decree No. 18 (1984) concerning the project on nucleus estate and small holders system in brackishwater pond culture

192 Strategies and Options for Increasing and Sustaining Fisheries and Aquaculture Production to Benefit Poorer Households in Asia
Country Formal rules Informal rules Level of enforcement
Malaysia
− The Malaysian Constitution− National Land Code (1965)− Town and Country Planning Act (1974, amended in 1994)− Land Conservation Act (1960)− Fisheries Act (1963, amended 1985)− Fisheries Act (1993) (amendment)− Fisheries Development Authority Act (LKIM) (1971)− Fisheries Ordinance (1909)− Fisheries (Maritime) Regulation (1967)− The Fisheries Regulations (1964)− Fisheries (Maritime) Regulation (Sarawak) (1976)− Fisheries (prohibition of Methods of Fishing) Regulation (1980)− Fisheries (Licensing of local fishing vessels) Regulations (1985)− Fisheries (Conservative and culture of cockles) Regulations
(1964)− Fisheries (Marine culture system) Regulations (1990)− Fisheries (Prohibition of Import, etc. of Fish) − Fisheries (Prohibited areas) Rantau Abang Regulations (1991)− Marine Parks and Marine Reserves Order (1994)− Fisheries (Prohibited area) Regulations (1994)− Fisheries (Closed season for the catching of grouper fry)
Regulation (1996)− Fisheries (Prohibited fishing methods for the catching of
grouper fry) Regulation (1996)− Fisheries (Control of endangered species of fish) Regulation
(1999)− Fishermen Association Act (1971, revised in 1978 and 1999)− Merchant Shipping Ordinance (1952)− Merchant Shipping Ordinance (1960) (Sabah)− Merchant Shipping Ordinance (1960) (Sarawak) aiming to
control pollution from shipping− Environmental Quality Act (1974, amended in 1985)− Environmental Quality (prescribed activities) (Environmental
Impact Assessment Order (1987) providing guidelines on EIA for fisheries)
− National Forestry Act (1984, amended 1993)− Mineral Development Act (1994)− Continental Shelf Act (1966)− Promotion of Investment Act (1986)
- Insignificant informal and customary laws exist.
- Effective, as people\ are aware of resources; and there are other more attractive alternatives for livelihoods in terms of income.

193Appendix 2
Country Formal rules Informal rules Level of enforcement
Philippines
− There are laws prohibiting commercial encroachment and the use of illegal fishing methods.
− Comprehensive Agrarian Reform Law (CARL)(1987) - the provision for a 5-hectare retention limit to land ownership is waived on fish ponds and other aquaculture activities, but there is an exception to the general rule on retention limits.
− The Local Government Code (LGC)(1991) extending the limits of the municipal waters to 15 km from the shoreline, thus prohibiting commercial fishers to fish in this 15-km limit
− Agriculture and Fisheries Modernization Act (AFMA)(1997)− The Philippines Fisheries Code (PFC)(1998)− The AFMA and Fisheries Code are closely related; the AFMA
prescribes the urgent measures the government should undertake, while the Fisheries code consolidates all fisheries laws, explicitly providing for the development, management and conservation of the fisheries and aquatic resources, integrating all pertinent laws thereto.
− On the use of artisanal fishing gear such as distance from the entrance of fish corrals, limited number of fish corrals, new owners’ permission from the existing owners, and removal of gill net
− The informal rules depend on the area.
- Integration of law enforcement is a problem.
- Revision of laws should be made after 5 years of implementation.
Sri Lanka
− No new shrimp farming is allowed in the North Western Provinces (NWP), but can be extended to new areas on the basis of zonal plan
− Fisheries and Aquatic Resources Act (1996) principal legal instrument, issued based on historical laws and ordinances such as Chank Fisheries Act, Pearl Fisheries Ordinance and the Whaling Ordinance. Under this Act, 23 regulations have been imposed.
− Fisheries and Aquatic Resources Act (1996), under which Fish Products (Exports) Regulations (1998) were issued
− Coast Conservation Act (1981), initiating coast protection and survey and coastal zone management programs
− The Fauna and Flora Protection Act (1949, last amended in 1993) indicating protected fish species and the establishment of marine reserves
− National Environment Act (amended 1988)− Forest Act (last amended in 1979)− The Fishermen’s Pension and Social Security Benefit Scheme
(1990)− Marine Pollution Prevention Act
− Informal and customary laws specific to socioeconomic and geographic conditions exist.
− MOFAR limits its role to planner, facilitator, advisor, and promoter, rather than direct implementer. At present, it plays contradictory roles.

194 Strategies and Options for Increasing and Sustaining Fisheries and Aquaculture Production to Benefit Poorer Households in Asia
Country Formal rules Informal rules Level of enforcement
Thailand
− Constitution of the Kingdom of Thailand (1997) − Forest Act (1941)− Forest Reserve Act (1992)− Local Administration Act (1914)− Public Administration Act (1991)− Fisheries Act (1947, amended in 1985)− Wild Animal Protection and Reserve Act (1992)− Provincial Administrative Organization Act (1997)− Sub-district Council and Sub-district Administrative Organization Act (1994)− Enhancement and Conservation of National Environmental Act (1992)− Land Code (1965)− Civil and Commercial Code− Navigation in Thai Water Act (1913)− Decentralization of Public Administration Act (1999)− Several other regulations on fisheries and aquaculture
− Informal and customary laws in specific areas take priority over formal laws.
− Many fishing communities manage their own resources, and are supported by law.
− Effectiveness is subject to compromise between formal and informal laws. Evidences of violation are visible.
Vietnam
− Constitution of Vietnam (1992) stating that provinces and cities are directly under the central authority− Declaration of its territorial waters, contiguous zones, EEZ and continental shelf on 12 May 1997− Ordinance on the Conservation and Development of Marine Resources (1989)− Many Decisions, Resolutions and Decrees issued by the Vietnamese Government and MOF to guide activities in the fisheries sector
- There exists a long-standing, traditional set of informal laws, to which the formal laws needs to adjust.
− Effectiveness is still questionable.
− There are levels of compromise and negotiation based on family relationships.

195Appendix 2
Country Rights and characteristics Institutional involvementFormal and legal
supportInformal support
Bangladesh
- Fishery resources except ponds in
private land are state property.
− MOL and district
administration
− DOF under the MOFL
− Ministry of Establishment
leases out large
waterbodies and
oversees enforcement of
laws.
- Ministry of
Establishment used
to assign fishing
rights to individuals,
but now to co-
operatives.
- Local communities
provide informal
supports in
conjunction
with NGOs and
international
donors.
China
− Land remains collectively owned.
− Policy-makers design user rights
to encourage farmers to invest in
agriculture.
− Joint ownership is encouraged in
aquaculture. In general, the village has
ownership of fish ponds and rent them
out to individual farm households,
from which the village collects rent
and fees.
- Local and central
governments
- Laws support
collective
ownership of
land.
- Limited informal
supports
India
− Rivers are common property;
reservoirs are state property; ponds
and tanks, if natural, are common
property, but if man-made on private
lands are private property; estuaries
are mostly open access; floodplain
lakes are mostly state property.
− State Fisheries Departments lease
ponds and tanks to co-operatives.
− Aquaculture is largely practiced in
private waterbodies and leased public
waterbodies.
− State DOF
− Irrigation Department
and State DOF
− FFDA and private owners
− Laws guarantee the
specified rights.
− The informal
supports of rights
are disappearing.
Indonesia
− All waterbodies are publicly owned.
− Within 0-4 miles, fisheries are under
the responsibility of local government.
− Coastal areas 4-12 miles from shore are
under provincial government; areas
beyond 12 miles are under the central
government.
- Local, provincial and
central governments
- MOMAF
- Rights
guaranteed by
law
- Rights supported by
informal structures
Malaysia- All water surfaces, except on the
private lands, are state owned.- DOF
- Rights
guaranteed by
law
- Rights supported by
informal structures
Appendix 2, Table 2 Land Tenure and Water-use Rights in the Selected Countries

196 Strategies and Options for Increasing and Sustaining Fisheries and Aquaculture Production to Benefit Poorer Households in Asia
Country Rights and characteristics Institutional involvementFormal and legal
supportInformal support
Philippines
- Mostly inland and coastal
waterbodies are publicly owned,
except some in private hands.
- LGUs
- DA-BFAR
- Rights
guaranteed by
law
- Rights supported by
informal structures
Sri Lanka
− Fishers have inherited rights
− License for fishing is required
− Consumer rights for food safety
recognized
− Fishing right of inland fishers in
irrigation reservoir is protected and
safeguarded in consultation with
authorities concerned.
- DOFAR
- Traditional
fishing rights
of coastal
fishers are
protected.
- Informal supports
are limited to the
local communities.
Thailand
− Waterbodies are publicly owned,
except in private hands.
− A small fee is collected for water usage
for capture fisheries
− The government under the asset
capitalization scheme plans to lease
out to aquaculture (shellfish sea
ranching and cage aquaculture) for a
minimum of 3 years.
− Department of Land
− Department of Water
Transports
− Department of Fisheries
− Royal Forest Department
- Rights
guaranteed
by law, e.g.,
Land Code,
Fisheries Act, and
others
− Communities play
a role in allocating
use rights to
cage aquaculture,
and location of
stationary gears.
− Informal
allocations are
strongly protected
by communities.
Vietnam
- Water surface and land, in principle, are
state-owned. User rights are assigned,
can be transferred, renewed, and
inherited. Use rights in agriculture
involve long-term contracts (25-50
years).
- Capture fisheries resources are public
access, but fishers (both small and
large-scale) need registration.
- Land Registration Office
- Ministry of Environment
and Natural Resources
- Contract to use resources
is done at village or
district levels.
- Provincial Fishery
Resources Protection
Office of the MOF
monitors public property.
- There are laws
specifying land
rights classification,
and other laws with
specific rights to the
resources.
- There are limited
supports of
rights by informal
arrangements.

197Appendix 2
Country Decentralization policy Co-management practicesCommunity-based management
practices
Bangladesh
− No laws, but there are local government
bodies at the union level.
− There are co-operatives dealing with local
matters.
- Co-management models
are being tested with
cooperations from donors,
governmental and non
governmental organizations.
- Community-based fisheries
management models are being
tested, similar situation to that in the
co-management practices.
China- Still under centralization policy
- Community-based fisheries
management is practiced informally
at the local level.
India
− Laws and Constitution (1993) guarantee
decentralization policy.
− Indication that small tank management
by the local authority is a success story
- A few cases available- A few cases available
Indonesia
− For the past five years the national
development has shifted from the
centralized to decentralized system,
formalized in the National Act (1999 and
2000) – giving the local government more
autonomy in managing its resources.
− Central and local governments have
mandates to develop rural aquaculture
including formulation of aquaculture
development policies and strategies,
technologies and management ability.
- Co-management practices in a
form of waste management in
aquaculture, i.e., the operation
of inlet and outlet canals,
incoming and drainage water
− Traditional community-based
system of fisheries management
such as Sasi, Panglima Laut, etc.
− Set of practices guiding shares of
the catch between crew members
and its owners, captain and master
fishers
Malaysia - Being explored- Co-management practices are
implicitly available
- Traditional community-based
management is practiced to a
limited extent.
Philippines
− The Local Government Code (1991)
devolves a significant portion of the
functions of the national agencies such as
DA-BFAR to the Municipal Government,
i.e., the management, development,
exploitation and protection of the
fisheries and aquatic resources.
− Local governments manage the coast
up to 15 km from shore; the remainder is
under the jurisdiction of the DA-BFAR, the
Coast Guard, and the Navy.
− Co-management works
at different levels of
implementation.
− There are composite teams
in co-management practices
including local government
units, coast guards, DA-BFAR
and fisher communities.
− The community-based management
and co-management practices are
considered interdependent.
− These two practices fit well with
the decentralization policy and
the creation of local management
councils.
− Civil society organization is
developing its roles.
Appendix 2, Table 3 Co-management, Community based Management, and Decentralization in the Selected Countries

198 Strategies and Options for Increasing and Sustaining Fisheries and Aquaculture Production to Benefit Poorer Households in Asia
Country Decentralization policy Co-management practicesCommunity-based management
practices
Sri Lanka - Not currently practiced
- MOFAR upon using the Fisheries
and Aquatic Resources Act
designate areas for fisheries
management, including
designating fisheries
committees of registered
fishers in the fisheries
management area. The tasks
are to assist fishers with
management programs, fishing
inputs, social infrastructure,
or other activities approved
by the DG. The minister can
order the merging of fisheries
committees.
- Traditional and community-based
fisheries management practices
exist.
Thailand
− The Kingdom’s Constitution stresses local
administration of natural resources.
− There are laws on the decentralization
of public administration authority, e.g.,
decentralization laws of 1999.
− Co-management models are
being tested.
− Application in fisheries is
limited in a few communities;
there is no extensive network.
- Traditional and community-based
fisheries management practices
exist. There is a more extensive
network of these practices than the
co-management.
Vietnam
- Decentralization of public administration
is not currently available, however; the
policies direction is to provide support to
local fisheries communities to establish
their local fisheries management plans.
− Not yet officially approved
by the Central Government,
but already applied in several
coastal areas under different
styles
− The Model is rather effective,
especially in resource
protection.
− Support is provided by
international donors such as
DANIDA, CIDA, UNDP, FAO, WB,
WFC, ADB, JICA.
− Ministry of Fisheries is trying
to bring the concept into the
Fisheries Law.
- Research and development to
support the concept of CBM have
been carried out at selected sites.

199Appendix 2
Country Local organization Private sector NGOs
Bangladesh
- Registered Fisher Organizations
have their exclusive rights to
auction the use of waterbodies.
- Increasingly involved, especially in
aquaculture, seafood export and mechanized
fishing boats, and trade.
- NGOs play dominant
roles in all aspects of
fisheries management.
China
− The 5-year plan indicates the
promotion of incentives for farmers
and local government to invest in
agriculture.
− Fishery Bureau at each level
administratively manages the
wholesale market of aquatic
products.
− Industry and commercial
administration supervise
commercial transactions of the
wholesale market.
- The private sector increasingly plays
important role in fisheries and aquaculture
investment.
- NGO role is limited.
India
− There is an establishment of
fisheries industrial estate at the
local level.
− Local co-operatives are given
water-use lease at the highest
priority.
− Private sector involved in marketing,
transportation, storage, processing, credit
facilitation, quality controls and inspection
services
− Strong controls from the government and
communities exercised, especially with
respect to environmental issues
− NGOs provide
education and training.
− NGOs focus on social
and environmental
issues, not on the
technical aspects of
fisheries.
Indonesia
The following are active in fishing
and marketing activities:
− Fish Farmers’ Cooperatives
− Fish-farmer Groups
− Women Groups of Fish- farmers
− Youth Fish Farmers
− Joint Aquaculture Groups (KUB)
− Muslim Boarding Schools
− Private associations and federations are
a collection of scholars and business
people who give advice to the government
regarding fisheries trade and other related
fisheries issues; these associations include
Association of Indonesia Fisheries Scholars
(ISPIKANI), Federation of Indonesian Fisheries
Entrepreneurs (GAPPINDO), Association of
Indonesian Fishers (HNSI), Federation of
Indonesian Fisheries Cooperatives (IKPI),
National Fisheries Society (MPN).
− The private sector plays a dominant role in
fisheries.
− The private sector supplies information
concerning aquaculture development for
businesses, undertakes construction of
aquaculture facilities.
- NGOs play some
roles in fisheries
management
Appendix 2, Table 4 Roles of Local Organizations, Private Sector and NGOs in the Selected Countries

200 Strategies and Options for Increasing and Sustaining Fisheries and Aquaculture Production to Benefit Poorer Households in Asia
Country Local organization Private sector NGOs
Malaysia
- Fishers’ associations at the area
(Area Fishers’ Association - AFA),
(State Fishers’ Association – SFA)
and federal levels (NEKMAT)
− Private sector investment in aquaculture
emphasized in national plans, medium and
large-scale companies or entities to venture into
large-scale fish culture, production of feed and
seed
− Private sector dominating fish business from
production to retail
− Trade associations, both privately and publicly
supported, protect business interests (e.g.,
Marine Product Association, Ipoh Wholesale
Merchant’s Club, KL Fish wholesalers’
Association). Oligopolistic tendencies have been
noted.
- NGOs play some roles in
fisheries management.
Philippines
− Local government units are very
strong in fisheries management.
− Aquatic Resources Management
Council (1995) at all levels (village
to national) still follows the policies
of the government.
− The private sector is strong in fisheries trade and
joint ventures.
− The private sector is considered dominant in the
fisheries sector.
− The Philippine Fisheries Development Authority
is working in close co-operation with the private
sector.
− DA-BFAR works in strong partnership with the
private sector.
− NGOs are heavily involved
in fisheries management;
work with government,
in contrast to past
opposition (partly owing
to the shift to democracy).
− The NGOs work as
committee, and they are
open to government
involvement.
− The role of NGOs is limited
to small communities and
significant when there are
conflicts.

201Appendix 2
Country Local organization Private sector NGOs
Sri Lanka
− A handful of co-operatives with
three-tier structure, primary
societies, secondary unions and
an apex federation. There are 943
village-level fisheries cooperatives
societies.
− Fisheries Co-operative Banks, and
high performance fisheries co-
operative societies ready to be
elevated to fisheries co-operative
banks
− Local communities involved with
private sector in shrimp out-
growers
− Local government bodies and
MOFAR to develop village-level
fish landing sites for facilities
management
− Fishers’ organizations and
cooperatives will be assisted and
encouraged in implementing
village level projects.
− The fishing industry has always been
dominated by the private sector (including
fishers).
− Every fishing household that owns a fishing
craft is treated as a small business entity.
− The private sector takes lead in aquaculture
development under facilitation and
guidelines of the MOFAR.
− The private sector is supported and
encouraged in new aquaculture activities.
− The private sector and local communities
are encouraged participate in aquaculture
activities with BOI incentives.
− The private sector is encouraged to produce
ornamental fish with research inputs from
the National Aquatic Resources Research
Development Agency (NARA) and the
National Aquaculture Development Authority
(NAQDA).
− The private sector is in partnership with
CFHC to operate shore facilities and invest in
shore facilities.
− Policy in December 2002 encouraged local
and foreign investment in 5 zones, including
fishery investment.
- No correct record on
NGOs, but there are
several NGOs that solely,
partially or potentially
concerned with the
fisheries sector. They
provide services to
unfortunate group of
fishers. They are for
example Sarvoday,
Sanasa, Seva Lanka
Foundation, national
Fisheries Solidarity, Social
Mobilization Foundation,
Small Fishers’ Foundation.
Thailand
- Local organizations play
increasingly dominant roles in
managing fisheries resources,
supported and promoted by the
government.
- Marketing and trade promotion is mostly
carried out by the private sector, while the
government plays a role as facilitator and
gives other support.
− NGOs work closely
with the communities,
especially in small-scale
capture fisheries. In
aquaculture, NGOs play
less of a role.
Vietnam
− There are 28 coastal provinces and
cities having fisheries departments
and two others having Department
of Agriculture and Rural
Development.
− People’s Committee and People’s
Council of the provinces consider
and approve the strategies and
plans.
- People’s Committee exists in all
levels of public administration.
− Based on traditional relationship
− Women and youth groups
− The private sector plays a dominant role; is
more effective. The public sector controls
only the processing activities for exporting.
− Investment is huge, so only the government
and big corporations can be involved in it.
− The Nau and Vua system is the assemble
system where middlemen collect from
producers, store and distribute to retail
outlets.
- NGOs exist but their roles
are limited to specific
localities and topics.

202 Strategies and Options for Increasing and Sustaining Fisheries and Aquaculture Production to Benefit Poorer Households in Asia
Co
un
try
Tech
nic
al a
dvi
ceFi
nan
cial
su
pp
ort
Aq
uac
ult
ure
join
t in
vest
men
tM
arin
e fi
sher
ies
join
t-ve
ntu
reD
eep
-sea
fish
erie
s jo
int-
ven
ture
Ban
gla
des
h-
Wo
rld
Fish
Cen
ter a
nd
oth
er
inte
rnat
ion
al d
on
ors
- G
ram
een
Ban
k,
wh
ich
was
in
itia
ted
by
the
UN
DP
and
no
w is
an
au
ton
om
ou
s in
stit
ute
- Fe
ed in
vest
men
t fr
om
ov
erse
a in
vest
ors
-
Mai
nly
in fi
sher
ies
pro
cess
ing
ac
tivi
ties
- No
t d
evel
op
ed
Ch
ina
- W
orl
dFi
sh C
ente
r an
d o
ther
d
on
ors
-
T
he
Five
-yea
r Pl
an in
dic
ates
fu
rth
er o
pen
ing
o
f th
e ag
ricu
ltu
ral
sect
or i
ncl
ud
ing
fis
her
ies
to fo
reig
n
inve
stm
ent
and
im
pro
vin
g t
he
effic
ien
cy o
f fo
reig
n c
apit
al u
se
in t
he
agri
cult
ura
l se
cto
r.
-
Jo
int
inve
stm
ent,
esp
ecia
lly o
n fe
ed
-
Jo
int-
ven
ture
bu
sin
ess
in it
s EE
Z
is s
up
po
rted
by
law
s, b
ut
it is
no
t ec
on
om
ical
, mo
stly
join
t-ve
ntu
re
wit
h o
ther
co
un
trie
s in
th
eir E
EZ
or i
nte
rnat
ion
al w
ater
s.
- Jo
int-
ven
ture
b
usi
nes
s w
ith
Sri
La
nka
for u
sin
g
lan
din
g fa
cilit
ies
Ind
ia
- W
B (s
hri
mp
an
d fi
sh p
roje
ct),
Wo
rld
Fish
Cen
ter,
UN
DP,
DA
NID
A, O
DA
(UK
– p
ost
h
arve
st),
OD
A (J
apan
), FA
O
(HA
CC
P)
-
F
inan
cial
su
pp
ort
giv
en
by
inte
rnat
ion
al
do
no
rs
- Th
ere
are
join
t ve
ntu
res
in a
qu
acu
ltu
re,
esp
ecia
lly in
feed
, h
atch
ery
and
sh
rim
p
farm
ing.
- Th
ey a
re le
gal
ly
end
ors
ed.
-
Th
ere
are
join
t ve
ntu
res
wit
h
Thai
lan
d, a
nd
Ko
rea
in In
dia
’s EE
Z.
- No
t d
evel
op
ed
Ind
on
esia
- In
do
nes
ia re
ceiv
es te
chn
ical
ad
vice
in fi
sher
ies
man
agem
ent
fro
m
inte
rnat
ion
al d
on
ors
su
ch a
s W
orl
dFi
sh C
ente
r.
-
I
nd
on
esia
rece
ives
fin
anci
al s
up
po
rt
fro
m in
tern
atio
nal
d
on
ors
.
-
Th
ere
are
join
t ve
ntu
res
in a
qu
acu
ltu
re w
ith
o
ther
co
un
trie
s.
-
Th
ere
are
mar
ine
fish
erie
s jo
int
ven
ture
s w
ith
oth
er c
ou
ntr
ies.
- N
ot
yet
dev
elo
ped
Appe
ndix
2, T
able
5 In
tern
atio
nal I
nvol
vem
ent i
n Fi
sher
ies i
n th
e Se
lect
ed C
ount
ries

203Appendix 2
Co
un
try
Tech
nic
al a
dvi
ceFi
nan
cial
su
pp
ort
Aq
uac
ult
ure
join
t in
vest
men
tM
arin
e fi
sher
ies
join
t-ve
ntu
reD
eep
-sea
fish
erie
s jo
int-
ven
ture
Mal
aysi
a-
WFC
- SE
AFD
EC-S
EAFD
EC-
Wit
h n
eig
hb
ori
ng
co
un
trie
s-
Wit
h n
eig
hb
ori
ng
co
un
trie
s-
No
t ye
t d
evel
op
ed
Phili
pp
ines
- Sh
arin
g o
f tec
hn
ical
ad
vice
w
ith
oth
er c
ou
ntr
ies
and
wit
h
inte
rnat
ion
al o
rgan
izat
ion
s su
ch a
s W
FC, W
WF,
FAO
, etc
.
- Th
e Ph
ilip
pin
es
rece
ives
fin
anci
al
sup
po
rt fr
om
in
tern
atio
nal
d
on
ors
su
ch a
s A
DB,
WB,
USA
ID.
- Th
ere
are
join
t ve
ntu
res
in a
qu
acu
ltu
re,
esp
ecia
lly in
feed
, se
awee
d.
- Ph
ilip
pin
e ex
per
tise
, es
pec
ially
in s
eaw
eed
- J
oin
t ve
ntu
res
wit
h n
eig
hb
ori
ng
co
un
trie
s, es
pec
ially
wit
h
Ind
on
esia
in b
oth
EEZ
s, an
d w
ith
o
ther
co
un
trie
s in
th
e So
uth
Pa
cific
- Jo
int
ven
ture
s in
dee
p-s
ea
fish
erie
s ex
ist.
Sri L
anka
- W
FC, F
AO
an
d d
on
or a
gen
cies
- FA
O a
nd
do
no
r ag
enci
es
- P
oss
ible
wit
h lo
cal j
oin
t in
vest
men
t d
epen
din
g
on
ag
reem
ents
- F
ore
ign
inve
sto
rs
in a
qu
acu
ltu
re a
re
sup
po
rted
an
d
enco
ura
ged
.
- EE
Z is
clo
sed
to fo
reig
n v
esse
ls,
bu
t u
se o
f fish
lan
din
gs
faci
litie
s is
al
low
ed.
- M
arin
e su
rvei
llan
ce s
yste
m is
co
llab
ora
ted
wit
h fo
reig
n o
r lo
cal
org
aniz
atio
ns
in a
co
st-e
ffec
tive
w
ay.
- Jo
int
ven
ture
w
ith
Ch
ina
for
tun
a fis
hin
g in
in
tern
atio
nal
w
ater
s-
Sri L
anka
g
over
nm
ent
coo
per
ates
w
ith
th
e in
tern
atio
nal
co
mm
un
ity
in p
reve
nti
ng
Ill
egal
, u
nre
po
rted
an
d
un
reg
ula
ted
(IU
U) fi
sher
ies.
Thai
lan
d
- Th
aila
nd
has
rece
ived
te
chn
ical
ad
vice
fro
m m
any
inte
rnat
ion
al o
rgan
izat
ion
s su
ch a
s W
FC, W
WF
and
oth
ers,
and
it h
as p
rovi
ded
th
e sa
me
to o
ther
nei
gh
bo
rin
g
cou
ntr
ies.
- Th
aila
nd
has
re
ceiv
ed fi
nan
cial
su
pp
ort
fro
m
man
y in
tern
atio
nal
o
rgan
izat
ion
s, an
d
it h
as p
rovi
ded
th
e sa
me
to o
ther
n
eig
hb
ori
ng
co
un
trie
s.
- Th
aila
nd
has
inve
sted
in
aqu
acu
ltu
re a
nd
oth
er
ind
ust
ries
in n
eig
hb
ori
ng
an
d o
ther
co
un
trie
s.
- Th
aila
nd
has
ag
reed
to fi
sher
ies
join
t ve
ntu
res
wit
h o
ther
co
un
trie
s.
- Th
aila
nd
has
d
evel
op
ed d
eep
-se
a fis
her
ies
wit
h
oth
er c
ou
ntr
ies,
and
als
o p
ract
iced
o
n it
s o
wn
.
Vie
tnam
- Man
y in
tern
atio
nal
do
no
rs
sup
po
rt a
qu
acu
ltu
re
dev
elo
pm
ent,
such
as
WB,
W
FC, D
AN
IDA
, AD
B, U
ND
P, EU
.
- Man
y in
tern
atio
nal
d
on
ors
pro
vid
e fin
anci
al s
up
po
rt
in fi
sher
ies
man
agem
ent
such
as
AD
B.
- A
qu
acu
ltu
re fe
ed is
no
t wel
l d
evel
op
ed in
Vie
tnam
; it
is im
po
rted
or p
rod
uce
d
join
tly
wit
h fo
reig
n
com
pan
ies.
- Vie
tnam
has
dev
elo
ped
fish
erie
s jo
int
ven
ture
s w
ith
oth
er c
ou
ntr
ies.
- Vie
tnam
has
d
evel
op
ed d
eep
se
a fis
her
ies
wit
h
oth
er c
ou
ntr
ies.

204 Strategies and Options for Increasing and Sustaining Fisheries and Aquaculture Production to Benefit Poorer Households in Asia
Appendix 3Source of data on the demand side
Data were obtained from national/regional household consumption/expenditure surveys conducted either by the project or respective statistics offices of partner countries (Table 1). Specifically, the study utilized the information on fish consumption by species or types contained in respective datasets. Five partner countries out of nine used secondary sources, namely: China, Indonesia, Malaysia, the Philippines and Sri Lanka. The remaining four countries (Bangladesh, India, Thailand and Vietnam) conducted own primary surveys because fish species dissaggregation was not available in their national household expenditure surveys. All data sets used in this demand study were fairly recent (1999-2002) except those for Sri Lanka, which went back to 1996. In some cases where prices of the fish species/types included in the study were not available in the expenditure survey, complimentary data sets from separate national surveys were used. For example, in the case of the Philippines, fish prices were taken from the Consumer Price Index Survey (CPIS) of the National Statistics Office.
Econometric approaches to demand estimation
The purpose of this section is to present a spectrum of creative, innovative and interesting approaches used by researchers to analyze the demand for fish and other marine products. Empirical studies pertaining to seafood demand and preferences articulation are selectively reviewed to illustrate concepts and highlight research applications. A brief review of the theory of demand is presented
to trace the evolution of different models used in food demand analysis.
Demand functions can be indirectly derived either from utility maximization (which yields a Marshallian demand specification) or through expenditure minimization (the dual version of the former, which yields a Hicksian compensated demand function). Both formulations can be used for empirical investigations of demand models using single-equation or system approaches. Earlier demand models often used the single-equation approach, but later empirical studies were focused on the system approach, a technique pioneered by Stone in 1954. Although the demand system that Stone developed was consistent with the assumptions of neoclassical demand theory, the model restricts the nature of the relationship of the goods included in the system by assuming that the underlying preference ordering was additive. This implies that the marginal utility provided by the consumption of one commodity is independent of the consumption of the other goods; hence, all commodities are treated as substitutes and inferior goods are excluded. Early versions of system models are the Rotherdam model (Theil 1965), the S-branch model (Brown and Heien 1972) and the translog demand model (Christensen et al. 1975).
Deaton and Muellbauer (1980) recently extended empirical research on demand systems by developing and estimating the almost ideal demand system (AIDS). The demand system for the AIDS model was derived, by using the duality theory, from an optimal expenditure function defined as the minimum expenditure necessary to attain a specific level of utility at given prices.

205Appendix 3
Country Type of Data Year CoverageSample size
(households)Data Source
BangladeshPrimary
1999
9 districts Rural inland Rural coastal Urban
810 Own survey
ChinaPanelSecondary
1997 and 2001
Nationwide(20% of total national sample)
49,508
National Statistics Bureau(Household Expenditure Survey)
India Primary 20026 out of 18 states where fish is consumed
591 Own survey
Indonesia Secondary 1999Nationwide(All 26 provinces)
61,482
Central Bureau of Statistics(Socioeconomic National Survey)
Malaysia Secondary 2000Nationwide(All 13 states)
9,198
National Statistics Bureau(Household Expenditure Survey)
Philippines Secondary 2000Nationwide(All 16 regions)
39,615
National Statistics Office(Family Income and Expenditure Survey)
ThailandPrimary
1999-200210 inland provinces5 coastal provinces
456(4 rounds)
Own survey
Sri Lanka Secondary 1996 Nationwide 19,752
Department of Census and Statistics(Household Income and Expenditure Survey
Vietnam Primary 200213 out of 62 provinces
780(4 rounds)
Own survey
Appendix 3, Table 1 Summary of Consumption Data Sources for the Selected Countries

206 Strategies and Options for Increasing and Sustaining Fisheries and Aquaculture Production to Benefit Poorer Households in Asia
This model was claimed to be more advantageous than its forerunners owing to the following reasons: (1) it gives an arbitrary first-order approximation to any demand system; (2) it satisfies the axioms of choice exactly; (3) it aggregates perfectly over consumers; (4) it has a functional form that is consistent with micro-level household budget data; (5) it is simple to estimate in its linear approximate form; and (6) it can be used to test the homogeneity and symmetry of demand parameters. In addition, although Deaton and Muellbauer did not mention it, the AIDS is indirectly non-negative, allowing consumption of one commodity to affect the marginal utility of another commodity; whereas the linear expenditure system (LES) is directly additive, implying independent marginal utilities. Thus, the AIDS, in addition to the listed desirable properties, does not impose the severe substitution limitations implied by additive demand models such as the LES (Blanciforti and Green 1983).
Blanciforti and Green (1983) empirically compared the results generated by a simplified linear approximation of the AIDS and the LES models. One of their findings suggested that many commodities classified as luxury goods in the LES (income elasticities greater than one) become necessities in the AIDS model (income elasticities less than one). Specifically, the AIDS possesses a property showing that the values of income elasticities are lower for necessities as their budget shares decreases (the reverse is true for the LES). Thus, the AIDS was found to be an attractive system for analyzing the demand for food commodities. However, the AIDS model requires a large number of parameters to be estimated, and this imposes constraints on the sample size.
The AIDS model is specified as follows:
Wi = αi + ∑j γij log Pj + βi log {X/P}……...…..(1)
where: Wi is the share in expenditure of the good iPj is the price of the good jX is the income of the ith household
P is a price deflator of the income variable defined as follows:
log P = αo + ∑k αk log Pk + ½ ∑j ∑k γkj log Pk log Pj……………..........................................…..(2)
Use of the price index defined in equation (2) often raises empirical difficulties, especially when aggregate annual time-series data are used on it (Green and Alston 1990; Moschini 1995). One of the main reasons for the popularity of the AIDS model is that the price deflator P in equation (2) can be replaced by an index that will allow the estimation of a linear demand system. If prices are highly collinear (as they often are), then P may be approximately proportional to P*, i.e., P≈P*. Deaton and Muellbauer (1980) suggest replacing P in the AIDS model by the Stone price index P* defined as:
log P* = ∑k Wk log Pk……………………………(3)
The model that uses the Stone’s price index is called the “linear approximate AIDS or LA/AIDS model. The LA/AIDS model has been used extensively in demand analysis, which includes the works of Blanciforti and Green (1983), Eales and Unnevehr (1988) and Moschini (1995).
The occurrence of zero observations is one of the most pressing issues in applied demand

207Appendix 3
analysis and other microeconometric applications (Shonkwiler and Yen 1999). At the same time, the fact that the observed budget shares cannot take on negative values means that the dependent variable is censored. The problem of censored dependent variable was first recognized by Tobin (1958), who showed that the use of ordinary least squares (OLS) estimation for such model results in biased and inconsistent estimates. To address the problem, Tobin proposed a maximum likelihood (ML) estimation using the Tobit model. This technique is easy to carry out in the case of the single-equation demand estimation. However, the problem becomes more complex in the case of the system demand model that consists of a set of demand relations interrelated through both the error structure and the cross-equation restrictions.
Whereas theoretical literature exists for systems of equations with limited dependent variables (Amemiya 1974; Lee and Pitt 1986; 1987; Wales and Woodland 1983), direct ML estimation of these models remains difficult when censoring occurs in multiple equations because of the need to evaluate multiple integrals in the likelihood function (Shonkwiler and Yen 1999). Heien and Wessells (1990) argued that it is possible to estimate models of this type by maximum likelihood, but such procedures generally are computationally prohibitive. Heien and Wessells (1990) provide a comprehensive survey of the studies concerning the non-negativity constraint or the problem of censored dependent variables. Heckman (1979) proposed a two-step estimation procedure for the system of equations with limited dependent variables, which was popularized by Heien and Wessells (1990) through the use of inverse Mills ratio (IMR) in demand model
estimation. The IMR is added in the model as a selectivity regressor (derived from probit estimation in an earlier step) to remove the sample selection bias created by a significant number of zero consumption in the data set. The demand system is then estimated using the seemingly unrelated regression (SUR) in the second step, hence the name Heckman two-step procedure. The first step involves a probit regression to compute for the probability that a given household will consume the commodity in question. The decision to consume is modeled as a dichotomous choice problem, i.e., Cih = f(Pih, Dh) where Cih is 1 if the hth household consumes that ith food item, and 0 if otherwise; Ph is a vector of prices for the hth household and Dh is a vector of the demographic variables. This regression is then used to compute the inverse Mills ratio (IMR) for each consuming household. The IMR ratios for the hth households that consume and do not consume the ith good are given by equations 4 and 5, respectively:
for C=1: IMR = ψ(Pih, Dh) /Ψ(Pih,Dh)...........….(4)
for C=0: IMR = ψ(Pih, Dh)/Ψ(Pih,Dh)]……........(5)
where ψ and Ψ are the density and cumulative probability functions, respectively.
The IMR is used as an instrument that incorporates the censored latent variable in the second-stage estimation of the demand relations. Heien and Wessells (1990) compared the results generated by the censored model (with IMR) and the uncensored model. The authors concluded that the censored model provided substantially improved results in terms of goodness of fit and the conformity of price elasticities with prior expectation.

208 Strategies and Options for Increasing and Sustaining Fisheries and Aquaculture Production to Benefit Poorer Households in Asia
In spite of the popularity and extensive applications of the Heien and Wessells (HW) model (e.g, Gao and Spreen 1994; Gao et al. 1996; Han and Wahl 1998; Heien and Durham 1991; Nayga 1995, 1996, 1998; Park et al. 1996; Salvanes and DeVoretz 1997; Wang et al. 1996; and Wellman 1992), Shonkwiler and Yen (1999) criticized the model and claimed that “there is internal inconsistency in this model”. In addition, the authors proposed an alternative consistent two-step estimation (CTS) procedure for systems of equations with limited dependent variables and conducted a Monte Carlo simulation to investigate and compare the performance of the CTS and the censored model proposed by Heien and Wessells (1990). Shonkwiler and Yen (1999) concluded that the CTS performed well, compared to the HW procedure. The authors added that although their CTS model only considered a three-equation linear system in the simulation, an application of the methodology to the case of multiple and/or nonlinear equations (e.g., a “theoretically plausible” demand system) would be equally straightforward. Another problem arising because of zero consumption is that of missing prices. In order to estimate a complete system, prices must be available for all items consumed by all households.
However, for households not consuming a particular item, there will be no data on the price of that item. The usual procedure employed is to estimate the missing price by performing a regression on the price of the item from those households that did consume it. Therefore, regional dummies, seasonal dummies and income are included as regressors in this model. The model is then used to estimate the missing price for those households that did not consume that particular item. The properties of estimates using price data obtained in this manner were
discussed by Dagenais (1973), and Gourieroux and Monfort (1981). However, it should be pointed out that these properties hold only for non-censored variables.
Likewise, it has been recognized that food demand is influenced by the age structure of the population and various other demographic factors as cited by Heien and Wessells (1990). The AIDS or LA/AIDS models can be modified by incorporating demographic variables in the budget share equations of the AIDS model as follows: αj = ρjo + ∑m ρjm dm, where dm is the mth demographic variable. This method of incorporating demographic variables in the AIDS model is known as translation (Heien and Wessells 1990). The other widely used technique is demographic scaling. Translation preserves the linearity of the system, whereas scaling is a highly non-linear specification (Pollak and Wales 1981).
Model and estimation procedure for the study
A multi-stage budgeting framework1 was used to model the fish consumption behavior of Asian households similar to the approach employed by Dey (2000b), who built on the framework used by Deaton and Muellbauer (1980), Blundell et al. (1993) and Heien and Wessels (1990). This approach made use of the concept of Strotz (1957) who extended the idea of exhaustive expenditure to stages. In the first stage, the consumer is assumed to allocate expenditures to broad groups of commodities and then, in the second stage, to further allocate expenditures within each of the broad groups to smaller groups. This process can continue, but for most empirical analyses, it has been limited to two stages requiring the condition of weak separability - that is, the condition ordering of goods on the independence of marginal utilities
1 Detailed discussions of multi-stage budgeting framework are found in Thomas (1987); Blundell et al. (1993); Mustapha et al. (1994); Fan et al. (1995); Gao et al. (1996); and Tiffin and Tiffin (1999).

209Appendix 3
2 For further discussions on separable utility functions in the multi-stage budgeting framework, please refer to Brown and Heien (1972); Eales andUnnevehr (1988); Yen and Roe (1989); Gao et al. (1996); Jorgenson et al. (1988); and Michalek and Keyzer (1992).
of goods within one group from consumption of the goods in other groups.
This approach was used to address a common problem in the empirical estimation of the AIDS models, which requires a sizeable system of demand equations in light of the wide variety of consumption goods jointly purchased by households. The full demand system containing all these commodities warrants a large amount of own-price and cross-price parameters that are impractical to estimate, given the limited sample size. A solution forwarded in the literature is to estimate the model in stages, whereby expenditures on goods belonging to various food categories are estimated sequentially. In this study, a three-stage budgeting framework was adopted to enable the specification of a fish demand system in the final stage that is species-specific, while keeping the size of the demand system manageable.
Expenditure functions (for food and subsequently for fish) were specified at the initial stages of the model, while the quadratic extension of the Deaton and Muellbauer’s linear approximate AIDS model (1980), hereafter referred to as the QUAIDS model, was formulated in the final stage. The food expenditure function shows how households, given their total per-household incomes, allocate their budget to food and non-food commodities. The fish expenditure function shows how the fish budget of a household is affected by the prices of various types of food commodities, such as cereal, fish, meat, beverages, fruit and vegetables. In the final stage, the QUAIDS model was specified to estimate the parameters of the demand system needed in the computation of elasticities for various fish types in light of the household fish budget.
The QUAIDS model used in this study assumes that fish is weakly separable2 from all the other categories of food commodities, such as cereals, fruits/vegetables, meat and beverages. The weak separability assumption of the direct utility function over various groups of commodities is necessary to satisfy the condition for estimating the AIDS model in a multi-stage budgeting framework. This procedure suggests that price aggregation in a partitioned utility function is possible only if either of the following conditions is satisfied: (a) the utility function is strongly separable (block additive form) or (b) it is homothetically separable. In this study, the second condition was supposed to allow the specification of a fish demand system that is independent of the other food commodities cited.
In the first stage, the food expenditure function (FD) is expressed as:
FD= f(PF, PNF, Y,Z)..…...……….............………(6)
where: FD is the per capita food expenditure; PF is the household-specific price index for food; PNF is the household-specific price index of non-food prices; Y is a vector of per-household income expressed in linear and quadratic forms; and Z is a vector of household characteristics.
The price index for food (PF) is computed as the geometric mean of food prices (Σwj lnPj), where wj is the share in the total food expenditure of the jth food commodity and Pj is the price of the jth commodity. The price index for non-food commodities (PNF) was included in the model to take into account the income effect component of the change in non-food price index. Further, it is assumed that the substitution effect between food and non-food commodities is negligible.

210 Strategies and Options for Increasing and Sustaining Fisheries and Aquaculture Production to Benefit Poorer Households in Asia
The income variable Y is included in the model both in linear and squared forms. The quadratic term was included to capture the possible non-linearity in the food expenditure behavior of households with respect to income. The variable Zi is a vector of household characteristics, which is represented by a dummy variable for urban areas, the number of children in the household and household size.
In the second stage, the fish expenditure function (FS) is expressed as:
FS = f(P, FD, Z)…………................…………….(7)
where: FS is the per capita fish expenditure;P is a vector of prices for different food categories such as cereals, meat, fish, vegetables, etc.; FD* is a vector of predicted food expenditure from stage 1, in linear and quadratic forms; and Z is the same vector of household characteristics used in equation 1.
The QUAIDS model for various fish types is specified in the third stage as a system of equations where the budget share of each fish type (Wi) is expressed as a function of fish prices, fish expenditures and demographic characteristics of a household. The demand system is expressed as follows:
Wi = f(PF, FS*/P*, Z, IMRi)……….......……..…(8)
where: Wi is the share of an individual fish type in total fish expenditure; PF is the vector of prices for different fish types i; FS* is a vector of predicted fish expenditure from stage 2, in linear and quadratic forms; P* is a household specific Stone price index for fish and is used as a deflator for fish expenditure; Z is the vector of household characteristics; and IMRi is the inverse Mill’s ratio for the specific fish type i.
To achieve the QUAIDS specification, the quadratic term for the fish expenditure variable is added to the linear approximate AIDS model (LA-AIDS) as an explanatory variable (Dey 2000b; Blundell et al. 1993; Dickens et al. 1993; and Meenakshi and Ray 1999). The QUAIDS specification was used in this study to capture the non-linearity in consumption behavior of households for goods exhibiting threshold levels such as food commodities. At the same time, it relaxes the restriction imposed by linear demand functions regarding the allocation of marginal expenditures among commodities to be the same in rich and poor households (Beach and Holt 2001). Such an assumption limits the classification of goods into either necessities or luxuries and denies the possibility that some goods may be luxuries at a low level of income and necessities at a higher level of income. This type of consumption behavior may be observed in the case of high-valued fish and other marine products such as prawn, oysters and crabs. Also, the computation of demand and income elasticities by income classes, i.e., low, medium and high income, is facilitated under the QUAIDS specification, since only one set of demand parameters needs to be estimated for the global sample. Subsequently, the demand elasticities by income group can be computed by simply varying the level of income in the elasticity formula.
The use of the Stone price3 index as a deflator for the fish expenditure variable in the model allows the empirical approximation of the non-linear AIDS model of Deaton and Muellbauer (with translog price index) to be linearly estimated. It has the following formula: lnP*=Σi wi lnPi. The Stone index is particularly useful in AIDS models with other sources of non-linearities (Moschini

211Appendix 3
1995); hence, it is suitable to the QUAIDS model used in this study.
The inverse Mills ratios4 (IMRs) are also incorporated in the model to correct for the possible bias created by the presence of zero consumption for certain fish types (Heckman, 1979). Zero consumption results when households report no consumption due either to abstention or corner solution in the household’s utility maximization problem. Corner solution results when consumers cannot afford to pay the price of certain fish types given their budget (i.e., shrimp and other high-value fish types) while abstention may be due to non-preference or infrequent purchases. Both cases render the share in expenditure Wi to zero. In this paper, correction of the sample selection bias created by the presence of numerous zero consumption of certain fish types in the dataset requires either the use of the Heckman two-step procedure (1979) in estimating the inverse Mills ratios for the various fish types or the Tobit model in the estimation of the fish expenditure function (equation 2).
To ensure that the specification of the QUAIDS model will conform to the theory of optimal consumption (i.e., that the consumer is a utility maximizer), three restrictions on the parameters of the model need to be satisfied. These restrictions are: (1) the homogeneity condition (i.e., consumers react only to real prices and income); (2) the additivity condition (i.e., all the budget shares wi add up to 1); and (3) the symmetry condition (i.e., the cross effects of a change in the price of a certain fish type on the demand for another fish type are equal). At the same time, due to the quadratic nature of the demand functions, the symmetry restriction also requires that the ratio of the income coefficients
must all be equal to a constant, implying that the relative effects of the linear and squared income terms in the demand equations must be the same for all fish types.
The additivity property of the QUAIDS model implies a singular variance-covariance matrix for the error terms of the model when all the n demand functions are estimated jointly. To impose this restriction, the last equation in the model is simply deleted to avoid the singularity problem in the estimation of the model parameters. Then, the parameters of the omitted demand equation are calculated by substituting the estimated parameters of the n-1 equations in the formula of the additivity restrictions. The parameter estimates of the whole model are invariant with respect to the demand function that is deleted from the system (Pollack and Wales 1981). To estimate the parameters of the QUAIDS model, the iterative seemingly unrelated regression (ITSUR) method of the SYSNLIN (non-linear systems) procedure of SAS (Statistical Analysis System 1984) was employed.
Based on the parameter estimates of the QUAIDS model, the price elasticities for the different fish types are estimated as follows:
ξij = (bij / wi) - {c1i + 2c2i Ln(FS)} (wj/wi) – kij ..(9)
where: kij is the Knonecker delta that is equal to 1 for own-price elasticity and zero for cross-price elasticity; wi is the consumption share of the ith fish type; and bi and ci are parameter estimates of the QUAIDS model.
3 For further discussions on the use of Stone price index in AIDS models, please refer to Swamy and Binswanger (1983); Green and Alston (1990); Pashardes (1993); Buse (1994); and Hahn (1994).

212 Strategies and Options for Increasing and Sustaining Fisheries and Aquaculture Production to Benefit Poorer Households in Asia
4 For further discussion on zero consumption, refer to Keen 1986; Shonkwiler and Yen 1999, and Perali and Chavas 2000. Also, further discussions on the use of IMR in censored demand functions can be found in Cheng and Capps 1988; Heien and Wessels (1990), Heien and Durham (1991), and Byrne et al. 1996.
The above formula yields the uncompensated price elasticity (ξij). The compensated (Hicksian) elasticity is computed using the Slutsky equation in elasticity form, i.e.,
ξijH = ξij + wj ηi ……………...........................…(10)
where: ξijH stand for Hicksian elasticity, while ηi
is the fish expenditure elasticity of the individual fish type and is given by the formula: ηi = (c1i + 2c2i Ln(FS)/wi) + 1…............…..…..(11)
The income elasticity ηiY for a specific fish species is
computed as the joint product of food expenditure elasticity ηFD from stage 1, fish expenditure elasticity ηFS with respect to food from stage 2, and fish expenditure elasticity for the individual fish type, i.e.,
ηiY = (ηFD) (ηFS) (ηi) ..………............................(12)
Theoretical framework for supply response
Studies on multi-products and joint inputs supply response for agriculture abound in the literature (see Just et al. 1983; Shumway 1983; Shumway et al., 1987; Ball 1988; and Ball et al. 1997). These studies used the duality theory by formulating a profit or revenue function and then deriving the output supply and input demand functions indirectly by applying the Hotelling’s lemma. The main advantage of the dual approach, as compared to direct estimation of the supply function, is that the state of production technology can be implicitly derived from the former.
Not many aquaculture supply response studies per se are available in the literature. Studies by Anderson (1985) and Ye and Beddington (1996)
focused on the interaction between aquaculture and marine capture fisheries. However, because the production process in aquaculture, which involves greater control of environmental factors, is approximately similar to crop production, the duality approach in modeling fishery supply response appears to be appropriate. For capture fisheries, the bioeconomic models were traditionally used to specify the production relationship between aggregate industry or individual species output (total catch) and aggregate input that is normally expressed as fishing effort (Clark and Munro 1980; Sampson, 1992; Tai and Heaps 1996; and Pascoe and Mardle 1999). However, the aggregate production function that is often used in the literature to relate total catch to fishing effort and resource abundance invariably has a very restrictive Cobb-Douglas functional form. In addition, the fishing effort variable used in the production function combines a myriad of inputs such as vessels, labor, fuel, fishing gears and others into a composite index. Thus, fishing effort is an abstract concept that is difficult to understand.
In recent years, several studies in marine capture fisheries applied the duality approach as an alternative to bioeconomic models in estimating the supply response functions. These studies used either a profit function approach (for example, Squires 1987, 1988; Dupont 1991; Salvanes and Squires 1995; and Alam et al. 2002) or a revenue function specification (Kirkley and Strand 1988; Squires and Kirkley 1991, 1996; Thunberg 1995; and Diop and Kazmierczak 1996). The dual approach has the advantage because it obviates the abstract concepts of fishing effort and provides direct and specific knowledge on individual inputs and outputs.

213Appendix 3
The above review of literature seems to point to the fact that the use of the dual approach is appropriate in modeling both the aquaculture and capture fisheries supply response. This approach is followed in this study.
The normalized quadratic profit function, often applied to joint agricultural production (e.g., Shumway et al. 1987; and Ball et al. 1997) is used to derive the output supply and input demand equations for the estimation of the fish supply response in Asia. Given the netput vector (where positive and negative netputs denote quantities of outputs and inputs, respectively), the researchers arbitrarily select an element as a numeraire good and denote its price as Pnum and its quantity as Qnum. Let i, j ∈A and k, l ∈V, where A denotes a set of non-numeraire netputs while V denotes a set of conditioning variables (consisting of fixed inputs and are taken as exogenous). The stochastic specification of the normalized quadratic profit function is represented as:
……………......…….…(1)
where π* is normalized profit, the α’s and γ’s are parameters of the model, Pi
* = Pi/Pnum is the normalized price of the ith netput with Pi as the producer price, Vk is the kth conditioning variable, and ε is the error term. Applying the envelope theorem, the netput supply QAi are the price derivatives of the profit function as follows:
……………..................................……...……….(2)
Note that if QAi < 0, then the netput i is an input. Supply response to price changes, expressed in terms of own-price and cross-price elasticities, can be readily computed from (2).
To derive the supply function of the numeraire commodity, multiply the expression in (1) by Pnum to obtain the nominal profit, then differentiate with respect to Pnum to yield:
….............……............(3)
The derivation of the supply function from a profit function entails certain restrictions on the former. A profit function is homogenous in terms of prices, and should have equal cross-price derivatives. Therefore, the supply parameters must comply with the homogeneity and symmetry restrictions5. In the present specification, the homogeneity restriction has been incorporated by normalization while the symmetry restriction can be implemented by imposing αij = αji during the estimation of (2). Note that equation (2) needs to be estimated separately for each fishery production category for all the nine countries using Zellner’s Seemingly Unrelated Regression (SUR) technique.
The data used in the supply response estimation come from two main sources. For almost all of the selected DMCs in the study except Indonesia, data from secondary sources such as published statistics and reports from relevant government agencies, official statistical databases, and other published research reports form the backbone of the data set used. In some countries where secondary data are unavailable for some of the model variables, primary data from surveys
ii kkk
jj
ii PQA *0
lkk l
kljiiji j
kk
k PPQnum21
21 **
00
εεννγ +++ ∑∑∑ *
21
ii
ill kk l
k P
kii k
ikjii j
ijkk
kii
i PPPP ***0
*0
*
21
5 A profit function should also satisfy the convexity and monotonicity restrictions. Implementing these restrictions is possible (e.g., Lang 2001), but the procedure is highly technical and is not intuitively appealing.

214 Strategies and Options for Increasing and Sustaining Fisheries and Aquaculture Production to Benefit Poorer Households in Asia
conducted by researchers were used. The sources of data used in the study are provided in Table 3. It should be noted that in many DMCs where time-series data were used in the estimation of the fish supply response model, sufficient lengths of the data series were unavailable, thereby affecting the degree of freedom in the estimation. In these cases, the time series data were disaggregated by locations or regions in order to construct a data panel with a larger sample size. It should also be
noted that the supply estimation faced considerable data constraints, much more so than the demand estimation. In some instances, entire categories were omitted from the statistical estimation process. Where this was unavoidable, elasticities were imputed by modeling convention, i.e., based on literature review and expert judgment.

215Appendix 3
Country / Production System
Primary Source Secondary Source
Bangladesh
Inland Capture; Marine/Brackishwater Aquaculture
Fisheries Statistical Yearbook of Bangladesh, Department of Fisheries
Inland/Freshwater Aquaculture
Surveys 1998, 2002, and 2003
ChinaDepartment of Fisheries, China
Chinese Fisheries Statistic Yearbook, Fisheries Bureau; Chinese Price Information Centre Database
IndiaHandbook on Fisheries Statistics, Ministry of Agriculture; Reports from various states, Fertilizer Statistics, Fertilizer Association of India; Agriculture Prices in India; Government Economic Survey reports
Indonesia Surveys 2001, 2002
Malaysia
Marine CaptureAnnual Fisheries Statistics, Department of Fisheries; Consumer Price Index, Department of Statistics; previous research surveys
Aquaculture Survey 2000Annual Fisheries Statistics, Department of Fisheries; Consumer Price Index, Department of Statistics
PhilippinesFamily Income and Expenditure Survey (FIES) 2000
National Statistics Office
Sri LankaReports from Statistical Unit of the Ministry of Fisheries and Aquatic Resources
Thailand Fisheries Statistics, Department of Fisheries
Vietnam Survey 2002
Appendix 3, Table 2 Summary of Production Data Sources in the Selected Countries

216 Strategies and Options for Increasing and Sustaining Fisheries and Aquaculture Production to Benefit Poorer Households in Asia
Var
iab
leM
ajo
r ca
rp(t
on
ne/
ha)
Oth
er c
arp
(to
nn
e/h
a)Ti
lap
ia(t
on
ne/
ha)
Pan
gas
(to
nn
e/h
a)La
bo
ur
(day
/ha)
Sto
ck(N
o. fg
lg/h
a)Fe
ed(k
g/h
a)
Inte
rcep
t-3
04.6
7-3
29.5
9-2
53.3
6-4
659.
749
6.84
7434
0.5
-5,5
94.0
8
Maj
or
carp
3.61
94.
511**
-0.5
33-3
.891
-0.4
660.
588
3.30
4
Oth
er c
arp
4.51
1**1.
201
2.48
8*-4
.631
***
0.27
00.
107
4.88
6
Tila
pia
-0.5
332.
488*
4.47
8***
-0.8
742.
317**
*0.
274*
2.67
9
Pan
gas
-3.8
91-4
.631
***
-0.8
756.
340**
*1.
726
-0.2
581.
994
Lab
or
0.47
0-0
.270
-2.3
17**
*-1
.726
-2.3
77**
*0.
620
-0.7
62
Sto
ck-0
.588
-0.1
07-0
.274
*0.
258
0.62
0-1
00.7
0*-9
.889
Feed
-3.3
04-4
.886
-2.6
79-1
.994
-0.7
62-9
.889
-73.
216
Inve
rse
mill
rat
io14
05.3
41,
171.
0458
3.29
7,94
0.41
--
9,88
4.36
Var
iab
leC
arp
s (t
on
ne/
ha)
Live
fish
(to
nn
e/h
a)
Inte
rcep
t3,
495.
923
30.3
69
Car
ps
177.
680
-30.
191
Live
fish
-30.
191
82.4
35**
*
Appe
ndix
3, T
able
3.A
.1 S
uppl
y Pa
ram
eter
s for
Inla
nd C
ultu
red
Fish
, Ban
glad
esh
Appe
ndix
3, T
able
3 S
uppl
y Pa
ram
eter
Est
imat
es b
y Pr
oduc
tion
Syst
em a
nd F
ish
Type
in N
ine
DMCs
Appe
ndix
3, T
able
3.A
.2 S
uppl
y Pa
ram
eter
s for
Inla
nd C
aptu
red
Fish
, Ban
glad
esh

217Appendix 3
Var
iab
leSh
rim
p(t
on
ne/
ha)
Sto
ck(N
o. fg
lg/h
a)Fe
ed(k
g/h
a)Fe
rtili
zer
(kg
/ha)
Lim
e(k
g/h
a)
Inte
rcep
t79
.195
22,9
28.4
60-6
9.16
454
.629
-0.7
62
Shri
mp
1.90
2*24
.389
1.49
3***
-1.1
49*
0.01
2
Sto
ck-2
4.38
9-1
1,63
8.60
0-5
1.79
0-3
3.25
40.
215
Feed
-1.4
93**
*-5
1.79
0-7
6.27
0***
-6.8
71-0
.333
Fert
ilize
r1.
149**
-33.
254
-6.8
71-2
5.84
10.
321
Lim
e-0
.012
0.21
5-0
.333
0.32
1-0
.003
Emb
. Co
st0.
003
1.76
3***
0.00
00.
000
0.00
0
Bam
. Co
st0.
006
-4.3
45*
-0.0
04-0
.002
0.00
0
Bo
x0.
001
-0.9
000.
005
0.00
7*0.
000
Inve
rse
mill
rat
io-
-15
0.84
075
.297
-
Appe
ndix
3, T
able
3.A
.3 S
uppl
y Pa
ram
eter
s for
Bra
ckis
hwat
er C
ultu
red
Shrim
p, B
angl
ades
h
*** S
igni
fican
t at 1
% le
vel, *
* sig
nific
ant a
t 5%
leve
l, * si
gnifi
cant
at 1
0% le
vel

218 Strategies and Options for Increasing and Sustaining Fisheries and Aquaculture Production to Benefit Poorer Households in Asia
Pri
ceLo
w v
alu
e fi
shH
igh
val
ue
fish
Low
val
ue
cru
stac
ean
sH
igh
val
ue
cru
stac
ean
sM
ollu
sks
Oth
ers
Co
nst
ant
13,0
72(1
.277
)66
,329
(3.9
12)*
30,2
94(2
.949
)*25
,670
(2.4
69)*
61,8
26(3
.501
)*0.
2094
5E+
06(5
.013
)*
Low
-val
ue
fish
10,7
69(0
.264
0)-5
,070
(-0.
4521
)-5
,844
.8(-
1.08
5)2,
980.
3(1
.006
)23
,592
(1.8
15)
-20,
089
(-0.
1197
)
Hig
h-v
alu
e fi
sh-5
,070
(-0.
4521
)25
,953
(2.2
19)*
542.
09(0
.100
1)-2
,228
.9(-
0.66
05)
-10,
256
(-0.
7190
)42
,934
(0.9
009)
Low
-val
ue
cru
stac
ean
s-5
,844
.8(-
1.08
5)54
2.09
(0.1
001)
611.
01(0
.148
4)2,
468.
3(1
.393
)-1
,105
.8(-
0.16
12)
-29,
082
(-1.
258)
Hig
h-v
alu
e cr
ust
acea
ns
2,98
0.3
(1.0
06)
-2,2
28.9
(-0.
6605
)2,
468.
3(1
.393
)57
6.34
(0.2
969)
-3,5
23.3
(-0.
8205
)47
,747
(2.3
67)*
Mo
llusk
s23
,592
(1.8
15)
-10,
256
(-0.
7190
)-1
,105
.8(-
0.16
12)
-3,5
23.3
(-0.
8205
)15
,981
(0.6
995)
-8,1
65.3
(-0.
1502
)
Oth
ers
-20,
089
(-0.
1197
)42
,934
(0.9
009)
-29,
082
(-1.
258)
47,7
47(2
.367
)*-8
,165
.3(-
0.15
02)
-0.6
872E
+07
(-3.
821)
*
Ag
gre
gat
e ca
tch
per
u
nit
eff
ort
0.11
046E
+06
(6.6
70)*
-32,
536
(-0.
9993
)-9
9,81
0(-
5.06
0)*
-61,
936
(-3.
350)
*-4
8,33
3(-
1.63
4)-0
.183
9E+
06(-
3.33
3)*
Appe
ndix
3, T
able
3.B
.1 S
uppl
y Pa
ram
eter
for M
arin
e Ca
ptur
ed F
ish,
Mal
aysi
a
Figur
es in
par
enth
eses
are a
sym
ptot
ic t-v
alue
s, an
d * d
enot
es si
gnifi
canc
e at 5
% le
vel.

219Appendix 3
Var
iab
leH
igh
-val
ue
fish
Hig
h-v
alu
e cr
ust
acea
nM
ollu
sks
Tila
pia
Feed
Co
nst
ant
389.
29(1
.11)
143.
40(0
.29)
-975
.43
(-0.
58)
630.
98*
(2.3
0)0.
60(0
.66)
Hig
h-v
alu
e fi
sh p
rice
82.9
3(0
.919
)-1
73.5
9*(-
2.10
)38
.33
(0.2
8)51
.94
(0.7
9)0.
45*
(2.4
0)
Hig
h-v
alu
e cr
ust
acea
n p
rice
-173
.59*
(-2.
10)
168.
51(1
.22)
192.
92(1
.51)
-187
.98*
(-2.
42)
-0.3
5(-
1.39
)
Mo
llusk
s p
rice
38.3
3(0
.28)
192.
92(1
.51)
-311
.44
(-1.
19)
81.1
2(0
.81)
-0.1
9(-
0.69
)
Tila
pia
pri
ce51
.94
(0.7
9)-1
87.9
8*(-
2.42
)81
.12
(0.8
1)54
.29
(0.5
8)-0
.80
(-1.
44)
Feed
pri
ce0.
45*
(2.4
0)-0
.35
(-1.
40)
-0.1
9(-
0.58
)-0
.80
(-1.
44)
891.
63(1
.61)
Are
a o
f po
nd
(ha)
0.07
3(0
.83)
-0.0
40(-
0.45
)6.
21*
(7.3
5)0.
047
(0.7
7)-0
.000
8*(-
5.09
)
Are
a o
f cag
e (m
2)
0.00
8*(8
.11)
0.00
7*(7
.37)
0.04
6*(4
.71)
-0.0
005
(-0.
70)
-0.0
0000
4*(-
2.18
)
Var
iab
leLo
w-v
alu
e fi
shTi
lap
iaFe
ed
Co
nst
ant
-1,0
63.3
(-0.
31)
-983
.31
(-0.
40)
85,8
72(1
.05)
Low
-val
ue
fish
pri
ce-1
26.0
3(-
0.16
)78
0.64
(0.8
8)1,
013.
4(0
.13)
Tila
pia
pri
ce19
7.51
(0.1
5)-1
26.0
3(-
0.16
)2,
214.
8(0
.19)
Feed
pri
ce22
14.8
(0.1
9)10
13.4
(0.1
3)-2
,341
20(-
0.89
)
Are
a o
f po
nd
(ha)
1.92
*(3
.42)
0.63
(1.5
6)-2
7.89
*(-
2.09
)
Are
a o
f cag
e (m
2)
0.06
9*(3
.03)
0.03
6*(2
.23)
0.79
(1.4
7)
Appe
ndix
3, T
able
3.B
.2 S
uppl
y Pa
ram
eter
s for
Bra
ckis
hwat
er A
quac
ultu
re F
ish,
Mal
aysi
a
Figur
es in
par
enth
eses
are a
sym
ptot
ic t-v
alue
s, an
d * d
enot
es si
gnifi
canc
e at 5
% le
vel.
Appe
ndix
3Ta
ble
3.B.
3 Su
pply
Par
amet
ers f
or F
resh
wat
er A
quac
ultu
re F
ish,
Mal
aysi
a
Figur
es in
par
enth
eses
are a
sym
ptot
ic t-v
alue
s, an
d * d
enot
es si
gnifi
canc
e at 5
% le
vel.

220 Strategies and Options for Increasing and Sustaining Fisheries and Aquaculture Production to Benefit Poorer Households in Asia
Var
iab
leC
aptu
re fi
shSh
ells
Oil
Lab
or
Inte
rcep
t-5
88.9
880
55.3
633
-25.
2633
-15.
9876
Pri
ce o
f cap
ture
fish
7.44
696.
4895
12.7
622
1.28
85
Pri
ce o
f sh
ell fi
sh6.
4895
5.78
861.
2885
90.8
700*
Pri
ce o
f oil
-12.
7622
-4.3
290
-3.1
642
-42.
1828
Pri
ce o
f lab
or
-4.3
290
-90.
8700
*-4
2.18
2820
.413
7
Urb
anit
y74
.241
7-7
3.44
082.
2691
92.6
463
Edu
cati
on
374.
4910
**10
1.03
84**
17.4
397*
*18
.026
3
Ho
use
ho
ld s
ize
93.3
599
-1.9
575
2.38
634.
7135
Var
iab
leA
qu
acu
ltu
refi
shM
uss
el &
oys
ter
Fert
ilize
rLa
bo
r
Inte
rcep
t-5
76.4
710
17.1
286
-356
.136
017
.090
1
Pri
ce o
f aq
uac
ult
ure
fi
sh16
.897
4-9
.638
5-5
5.10
582.
3261
Pri
ce o
f mu
ssel
&
oys
ters
-9.6
385
-1.7
953
2.32
61-7
.576
1
Pri
ce o
f fer
tiliz
er55
.105
8-2
0.98
78-4
.490
535
.357
5
Pri
ce o
f lab
or
-20.
9878
7.57
6135
.357
5-7
.981
1
Urb
anit
y17
1.59
0616
.978
3-7
5.82
571.
0331
Edu
cati
on
162.
9895
**-2
.465
513
6.88
12**
23.0
925*
*
Ho
use
ho
ld s
ize
86.4
690
0.67
3528
.206
4-2
.768
6
Appe
ndix
3, T
able
3.C
.1 S
uppl
y Pa
ram
eter
s for
Mun
icip
al C
aptu
red
Fish
, Phi
lippi
nes
Note
: Par
amet
er es
timat
es fo
r mun
icipa
l cap
ture
fish
ery u
sing
FIES
200
0 (N
SO)
Appe
ndix
3, T
able
3.C
.2 S
uppl
y Pa
ram
eter
s for
Aqu
acul
ture
Fis
h, P
hilip
pine
s
Note
: Par
amet
er es
timat
es fo
r the
aqua
cultu
re se
ctor
usin
g FI
ES 2
000
(NSO
)

221Appendix 3
Pri
ceIn
do
-Pac
ific
Mac
kere
lSh
rim
pSq
uid
Cra
bH
igh
Val
ue
Fish
Low
Val
ue
Fish
Pro
cess
Die
sel
Co
nst
ant
-550
8**
1263
-629
9***
-928
***
-772
-379
45**
*-4
207*
*-5
2050
**
Ind
o-P
acifi
c M
acke
rel
8.26
13.1
947
.64*
*-1
9.15
**-2
0.97
-17.
88-1
01.9
**-7
5.07
Shri
mp
13.1
92-1
2.60
41.
992
6.10
5**
0.78
00.
413
37.7
6**
-62.
031
Squ
id47
.65*
*1.
993.
16-7
.39
-2.3
3-5
8.94
37.2
4-1
92.2
**
Cra
b-1
9.15
**6.
105*
*-7
.39
5.16
-1.4
756
.11*
*-1
0.87
66.5
2**
Hig
h-v
alu
e fi
sh-2
0.97
0.78
-2.3
3-1
.47
12.3
410
0.0*
**-1
9.44
118.
2**
Low
-val
ue
Fish
-17.
880.
41-5
8.94
56.1
1**
100.
04**
*38
6.79
318.
4***
-870
.08
Pro
cess
-1
01.9
**37
.762
**37
.241
-10.
87-1
9.44
331
8.4*
**-2
55.9
***
-69.
145
Die
sel
75.0
762
.03
192.
18**
-66.
52**
-118
.22*
*87
0.09
69.1
5-1
296.
77
Res
earc
h-0
.08
-0.1
20.
050.
04-0
.01
1.63
**-0
.61*
**-3
.34*
*
Are
a55
.92*
**63
.49*
**52
.81*
**25
.30*
**18
.10*
**44
3.9*
**10
1.4*
**-1
26.6
0
Year
2.79
**-0
.63
3.16
***
0.47
***
0.40
19.0
6***
2.14
**27
.05*
*
Appe
ndix
3, T
able
3.D
.1 S
uppl
y Pa
ram
eter
s for
Mar
ine
Capt
ured
Fis
h, Th
aila
nd
Note
: ** a
nd **
* den
ote s
igni
fican
t at 5
% an
d 1%
leve
ls, re
spec
tivel
y.

222 Strategies and Options for Increasing and Sustaining Fisheries and Aquaculture Production to Benefit Poorer Households in Asia
Sh
rim
pM
ollu
sks
Shri
mp
feed
Hig
h-v
alu
e fe
edSh
rim
p
fin
ger
ling
Mo
llusk
s fi
ng
erlin
g
Co
nst
ant
-0.1
559*
**0.
0336
3*-0
.401
7***
0.02
445
-10.
58**
*0.
1593
7
Shri
mp
0.9E
-50.
5E-0
4-0
.6E-
040.
8E-0
4-0
.021
***
0.00
106
Fish
0.5E
-04
-8.6
E-4*
**-0
.000
21.
4E-0
40.
0060
-0.0
109*
*
Shri
mp
feed
0.6E
-04
2.07
E-4
0.00
025
-0.3
E-04
0.23
87**
0.05
3**
Hig
h-v
alu
e fe
ed-0
.8E-
04-0
.000
14-0
.004
7-6
.6E-
040.
1161
30.
0402
Shri
mp
fin
ger
ling
0.02
17**
*-0
.006
060.
1528
7-0
.006
7-6
.219
-2.5
750
Mo
llusk
s fi
ng
erlin
g-0
.001
060.
0109
6**
-3.9
227
-0.0
891
-599
.79*
*-1
7.78
Year
0.8E
-04*
**-1
.7E-
05*
0.00
02**
*-1
.2E-
50.
0054
***
-0.0
001
Res
earc
h &
D
evel
op
men
t In
vest
men
t-5
.8E-
06**
5.0E
-06*
**-1
.7E-
5***
5.0E
-6**
-0.0
009*
**0.
9E-0
4
Rai
n-1
.5E-
078.
00E-
08-4
E-07
3.45
E-09
-1E-
58.
0E-0
6**
Dis
solv
ed o
xyg
en
-7E-
069.
4E-5
3.2E
-40.
2E-4
-0.0
243*
*0.
0047
9*
Du
mm
y-2
.01E
-4-5
.84E
-4**
*-8
.8E-
4-5
.6E-
4***
0.04
8**
0.00
60
Appe
ndix
3, T
able
3.D
.2 S
uppl
y Pa
ram
eter
s for
Coa
stal
Aqu
acul
ture
Fis
h, Th
aila
nd
Note
: ** a
nd **
* den
ote s
igni
fican
t at 5
% an
d 1%
leve
ls, re
spec
tivel
y.

223Appendix 3
Tila
pia
Silv
er
bar
bC
atfi
shSn
akeh
ead
Pra
wn
Hig
h-v
alu
e fi
shLo
w-v
alu
e fi
shP
roce
ssed
Her
biv
ore
fe
edC
arn
ivo
re
feed
Co
nst
ant
-2.1
27-2
6.8*
**0.
000
-6.7
97-0
.116
-0.9
5125
.31*
**-4
.111
-68.
84**
*5.
029
Tila
pia
0.27
6-0
.33*
*0.
001
-0.0
92-0
.06*
**0.
056*
*-0
.027
0.04
40.
032
0.08
4
Silv
er B
arb
-0.3
3**
0.67
4***
0.00
0-0
.239
*0.
039*
-0.0
09-0
.059
0.05
40.
284
-0.1
44
Cat
fish
0.00
10.
000
0.00
00.
000
0.00
0***
0.00
00.
000
0.00
2***
0.00
5-0
.003
Snak
e H
ead
-0.0
92-0
.239
*0.
000
0.35
1***
0.04
9***
-0.0
31-0
.041
-0.0
49-0
.372
0.10
6
Pra
wn
-0.0
6***
0.03
9*-3
E-4*
**0.
049*
**-0
.012
-0.0
19*
-0.0
59**
*-0
.023
*-0
.017
-0.0
44**
*
Hig
h-v
alu
e fi
sh0.
056*
*-0
.009
0.00
0-0
.031
-0.0
19*
0.02
60.
216*
**0.
062*
**-0
.035
0.10
4***
Low
-val
ue
fish
-0.0
27-0
.059
0.00
0-0
.041
-0.0
59**
*0.
216*
**-0
.520
***
-0.1
77**
*-0
.915
***
-0.3
23**
Pro
cess
ed fi
sh0.
044
0.05
40.
002*
**-0
.049
-0.0
23*
0.06
2***
-0.1
77**
*0.
069
0.03
0-0
.077
Her
biv
ore
feed
-0.0
32-0
.284
-0.0
050.
372
0.01
70.
035
0.91
5***
-0.0
30-6
.529
3.73
3***
Car
niv
ore
feed
-0.0
840.
144
0.00
3-0
.106
0.04
4***
-0.1
04**
*0.
323*
*0.
077
2.58
7-1
.406
**
Year
0.00
10.
014*
**0.
000
0.00
30.
000
0.00
0-0
.013
***
0.00
20.
035*
**-0
.002
Reg
ion
0.01
10.
008
2E-4
***
0.01
90.
001
-0.0
30**
*0.
015
0.02
1*-0
.025
-0.0
11
Are
a0.
000*
**0.
000*
**0.
000
0.00
0*0.
000*
**0.
000
0.00
00.
000
0.00
00.
000
Du
mm
y0.
007
0.00
80.
000
-0.0
110.
020
0.11
8***
-0.1
54-0
.031
0.01
10.
010
Appe
ndix
3, T
able
3.D
.3 S
uppl
y Pa
ram
eter
s for
Fre
shw
ater
Aqu
acul
ture
Fis
h, Th
aila
nd
Note
: *, *
* and
*** d
enot
e sig
nific
ance
at 1
0%, 5
% an
d 1%
leve
ls, re
spec
tivel
y.

224 Strategies and Options for Increasing and Sustaining Fisheries and Aquaculture Production to Benefit Poorer Households in Asia
Carp Seed Feed Labor
Constant 897.49 0.16 -1,973.00 193.14
Carp 4.8524* 0.0003 11.01 -3.76
Seed -0.0003 0.0001 -0.03 0.0007
Feed -11.01 -0.03 650.62 9.31
Labor 3.76 0.0007 9.31 1.01
Farm area -1,098.8** 0.05 3,112.17 -207.04
Household size 0.09 0.00 0.072 0.003
Catfish Seed Feed Labor
Constant -3,756.59 0.13 -1,791.24 14.75
Catfish 278.80** -0.0007 14.12 0.70
Seed 0.0007 0.0002 0.005 0.0015
Feed -14.12* 0.0051 3,820.52 -15.93
Labor -0.70 0.0015 -15.93 0.57
Household size 0.27 0.00 -0.001 0.0001
Tilapia Seed Feed Labor
Constant -157.39 -0.19 -3,711.28 59.50
Tilapia 11.86* 0.0043 73.72 0.31
Seed -0.0043 0.0006 0.11 0.0048
Feed -73.72* 0.11 2,032.52 -7.96
Labor -0.31 0.0048 -7.96 -1.03
Household size 0.06 0.00 0.018 0.0004
Shrimp Seed Feed Labor
Constant -142.69** 1.52 4,683.74 -35.57
Shrimp 2.88** -0.002 -6.50 0.06
Seed 0.0023 0.0009 -0.10 0.0001
Feed 6.50* -0.10 -1,905.51** 13.44
Labor -0.06 0.0001 13.44 0.26
Household size -0.01 -0.0001 -0.02 0.0001
Appendix 3, Table 3.E.1 Supply Parameters for Cultured Carp, Vietnam
Note: * and ** denote significance at 5% and 1% levels, respectively.
Appendix 3, Table 3.E.2 Supply Parameters for Cultured Catfish, Vietnam
Note: * and ** denote significance at 5% and 1% levels, respectively.
Appendix 3, Table 3.E.3 Supply Parameters for Cultured Tilapia, Vietnam
Note: * and ** denote significance at 5% and 1% level,, respectively.
Appendix 3, Table 3.E.4 Supply Parameters for Cultured Shrimp, Vietnam
Note: * and ** denote significance at 5% and 1% levels, respectively.

225Appendix 3
Price Major carp Other carp Tilapia Pangas Labor Stock Feed
Major carp 0.275 0.343 -0.041 -0.296 -0.036 0.045 0.251
Other carp 0.002 0.001 0.001 -0.002 0.000 0.000 0.002
Tilapia -0.003 0.013 0.024 -0.005 0.013 0.002 0.015
Pangas -0.040 -0.047 -0.009 0.065 0.018 -0.003 0.020
Labor 0.013 -0.008 -0.066 -0.049 -0.067 0.018 -0.022
Stock -0.041 -0.007 -0.019 0.018 0.043 -6.972 -0.685
Feed -0.042 -0.062 -0.034 -0.025 -0.010 -0.125 -0.928
Price Major carp Live fish
Major carp 0.07 -0.01
Live fish -0.41 1.12
Price Shrimp Stock Feed Fertilizer Lime
Shrimp 0.513 6.576 0.402 -0.310 0.003
Stock 0.000 -0.059 0.000 0.000 0.000
Feed -0.055 -1.913 -2.817 -0.254 -0.012
Fertilizer 0.049 -1.419 -0.293 -1.102 0.014
Lime -0.114 2.106 -3.263 3.151 -0.031
Price SCCC GCCC OFFA SHRA OTHA Feed
SCCC 0.055 0.154 0.003 -0.172 -0.052 0.044
GCCC 0.176 0.044 0.078 -0.126 --0.141 0.029
OFFA 0.006 0.147 0.965 0.349 -1.172 -0.134
SHRA -0.290 -0.186 0.274 1.882 -1.106 -0.440
OTHA -0.023 -0.056 -0.246 -0.296 0.393 0.509
Feed -0.000 -0.000 -0.000 -0.000 -0.000 -0.012
Appendix 3, Table 4 Fish Supply and Input Demand Elasticity Estimates by Production System and Fish Type in Nine DMCs
Appendix 3, Table 4.A.1 Elasticities for Inland Cultured Fish, Bangladesh
Appendix 3, Table 4.A.2 Elasticities for Inland Captured Fish, Bangladesh
Appendix 3, Table 4.A.3 Elasticities for Brackishwater Cultured Shrimp, Bangladesh
Appendix 3, Table 4.B.1 Elasticities for Aquaculture Fish, China
SCCC: silver/common carps; GCCC: grass/crucian carps; OFFA: other aquaculture finfish; SHRA: aquaculture shrimp; OTHA: other aquaculture products; Labor: numeraire

226 Strategies and Options for Increasing and Sustaining Fisheries and Aquaculture Production to Benefit Poorer Households in Asia
Price YC HT OFFC SHRC OTHC
YC 0.566 0.837 -0.641 1.557 -1.782
HT 0.285 0.518 -0.596 3.556 -3.069
OFFC -0.138 -0.378 1.465 -1.227 -0.243
SHRC 0.179 1.204 -0.655 4.139 -3.865
OTHC -0.296 -1.494 -0.187 -5.558 5.268
Indian major carp
Other freshwater fish
Prawn Labor Feed Fertilizer
Indian major carps
1.560 0.294 -4.032 0.174 0.032 -0.013
Other freshwater fish
0.157 1.716 -0.224 0.254 0.818 0.637
Prawn -0.645 -0.221 0.727 0.127 0.043 0.171
Wage -0.046 -0.185 -0.210 -0.746 0.047 0.270
Feed -0.048 -0.415 -0.417 0.272 -0.872 -0.138
Fertilizer 0.001 -0.088 -0.113 0.107 -0.009 -1.544
Area (ha) 0.731 0.737 0.73 0.717 0.794 0.626
Pelagic HV Pelagic LVDemersal
HVDemersal
LVShrimp Mollusks Fuel Labor
Own Price 0.28 0.33 0.45 0.2 0.49 0.28 0.1 0.01
Fuel -0.06 -0.24 -0.14 -0.37 -0.96 -0.27 -1.1 -0.001
Wage -0.004 -0.003 -0.01 0.002 0.537 0.576 -0.002 1.08
Coast length (km)
0.44 0.31 0.37 0.53 0.37 0.71 1.08
Year trend 0.32 0.6 0.03 0.58 1.1 0.28 1.64
Appendix 3, Table 4.B.2 Elasticities for Captured Fish, China
YC: yellow crocker; HT: hair-tail; OFFC: other finfish; SHRC: shrimp; OTHC: other products
Appendix 3, Table 4.C.1 Elasticities for Aquaculture Fish, India
Appendix 3, Table 4.C.2 Elasticities for Marine Captured Fish, India

227Appendix 3
Own price elasticity
Shrimp Tuna Mackerel APF Grouper SnapperOther finfish
Fuel
Marine capture 0.23 0.23 0.03 0.096 0.23 0.23 0.096 0.01
Grouper Fuel Fertilizer
Marine culture 0.50 0.50 0.50
Other finfish
Carp Tilapia Catfish Fuel
Inland capture 0.098 0.094 0.01 0.0144 0.0100
Carp Tilapia Catfish Fuel Fertilizer
Inland culture 0.14 0.03 0.004 0.06 0.06
AnchovyLow-value
fishHigh-value
fishLow-value crustacean
High-value crustacean
Mollusks Other
Anchovy -0.1134 - - - - - -
Low-value fish
- 0.1048 -0.0309 -0.1648 0.1101 0.4529 -0.0976
High-value fish
- -0.1944 0.6234 0.0602 -0.3244 -0.7758 0.8223
Low-value crustacean
- -0.1371 0.008 0.0415 0.2197 -0.0512 -0.3406
High-value crustacean
- 0.3129 -0.1466 0.7506 0.2297 -0.7297 2.5038
Mollusks - 0.3341 -0.091 -0.0454 -0.1894 0.4464 -0.0578
Other - -0.0189 0.0253 -0.0793 0.1705 -0.0152 -3.2296
Aggregate catch per unit effort
-0.5469 0.3838 -0.0708 -1.0046 -0.8169 0.3313 -0.3193
Appendix 3, Table 4.D.1 Elasticities for Marine Captured, Marine Cultured, Inland Captured and Inland Cultured Fish, Indonesia
Appendix 3, Table 4.E.1 Elasticities for Marine Captured Fish, Malaysia
Elasticities were computed at mean values of variables.

228 Strategies and Options for Increasing and Sustaining Fisheries and Aquaculture Production to Benefit Poorer Households in Asia
High-value FishHigh-value Crustacean
Mollusks Tilapia Feed
High-value fish 1.47 -3.03 0.04 45.41 -3.83
HV Crustacean -3.31 3.16 0.23 -176.73 3.18
Mollusks 0.60 2.99 -0.30 63.06 1.47
Tilapia 0.85 -3.03 0.08 43.87 6.28
Feed 0.00 0.00 0.00 -0.0006 -6.69
Low-value Fish Tilapia Feed
Low-value fish 0.13 -0.18 -0.26
Tilapia -0.05 0.70 -0.07
Feed 0.25 0.26 4.88
Variable Captured fish Shell fish Oil Labor
Price of captured fish 0.0130 0.0427 1.0013 0.0094
Price of shell fish 0.0236 0.0795 0.2111 1.3869
Price of oil -0.0067 -0.0086 -0.0747 -0.0928
Price of labor -0.0218 -1.7324 -9.5935 0.4325
Variable Aquaculture fish Mussel & oyster Fertilizer Labor
Price of aquaculture fish 0.1775 -1.3897 -0.7822 0.2525
Price of mussel & oysters -0.0358 -0.0914 0.0117 -0.2905
Price of fertilizer 0.2662 -1.3919 -0.0293 1.7651
Price of labor -0.6024 2.9852 1.3715 -2.3672
Appendix 3, Table 4.E.2 Elasticities for Brackishwater Aquaculture Fish, Malaysia
Appendix 3, Table 4.E.3 Elasticities for Freshwater Aquaculture Fish, Malaysia
Appendix 3, Table 4.F.1 Elasticities for Municipal Captured Fishery, Philippines
Appendix 3, Table 4.F.2 Elasticities for Aquaculture Fish, Philippines

229Appendix 3
Large pelagic Small pelagic Demersal Other Fuel Ice
Large pelagic
Small pelagic
Demersal
Other
Fuel
Ice
0.18 -0.30
0.10
0.29
-1.14
1.18
-0.57
-0.40
0.03
0.72
-0.02
-0.13
-0.05
-0.06
-0.05
-0.01
-0.01
-0.01
-0.01
-0.01
-0.01
Freshwater fish Ice
Freshwater fish
Ice
0.20 -0.01
-0.05
Prawn Freshwater fish Feed Fertilizer Seed
Prawn
Freshwater fish
Feed
Fertilizer
Seed
0.40 0.00
0.13
0.00
-0.17
-0.80
0.00
-0.12
-0.01
-0.80
-0.21
-0.01
-0.01
-0.01
-0.80
Indo-Pacific
MackerelShrimp
High-value fish
Low-value fish
Squid CrabProcessed
fishFuel
Indo-Pacific Mackerel
0.03 0.05 -0.19 -0.01 0.18 -0.19 -0.30 -0.01
Shrimp 0.17 -0.18 0.03 0.00 0.03 0.22 0.40 -0.03
High-value fish -0.19 0.01 0.28 0.11 -0.02 -0.04 -0.14 0.05
Low-value fish -0.03 0.00 0.46 0.08 -0.12 0.28 0.48 -0.07
Squid 0.32 0.01 -0.04 -0.05 0.02 -0.14 0.21 -0.06
Crab -0.13 0.04 -0.02 0.04 -0.05 0.09 -0.06 0.02
Processed fish -0.48 0.20 -0.23 0.18 0.19 -0.14 -0.99 -0.01
Appendix 3, Table 4.G.1 Elasticities for Marine Captured Fish, Sri Lanka
Appendix 3, Table 4.G.2 Elasticities for Municipal Captured Fish, Sri Lanka
Appendix 3, Table 4.G.3 Elasticities for Aquaculture Fish, Sri Lanka
Appendix 3, Table 4.H.1 Elasticities for Marine Captured Fish, Thailand

230 Strategies and Options for Increasing and Sustaining Fisheries and Aquaculture Production to Benefit Poorer Households in Asia
Sh
rim
pH
igh
-val
ue
Mo
llusk
sLo
w-v
alu
e M
ollu
sks
Shri
mp
feed
Hig
h-v
alu
e fe
edSh
rim
p
fin
ger
ling
Hig
h-v
alu
e fi
ng
erlin
gLo
w-v
alu
e Fi
ng
erlin
g
Shri
mp
0.06
0.53
0.53
-0.2
10.
71-0
.80.
350.
35
Hig
h-v
alu
e M
ollu
sks
0.04
-1.0
8-1
.08
-0.0
80.
160.
03-0
.46
-0.4
6
Low
-val
ue
Mo
llusk
s0.
04-1
.08
-1.0
8-0
.08
0.16
0.03
-0.4
6-0
.46
Shri
mp
feed
0.08
0.37
0.37
0.15
-0.0
61.
613.
233.
23
Hig
h-v
alu
e fe
ed-0
.01
-0.0
4-0
.04
-0.3
8-0
.15
0.11
0.34
0.34
Shri
mp
fin
ger
ling
0.24
-0.1
0-0
.10
0.82
-0.1
04-0
.39
-1.4
6-1
.46
Hig
h-v
alu
e fi
ng
erlin
g-0
.000
10.
0018
0.00
18-0
.21
0.01
4-0
.37
-0.1
0-0
.10
Low
-val
ue
fin
ger
ling
-0.0
001
0.00
180.
0018
-0.2
10.
014
-0.3
7-0
.10
-0.1
0
Appe
ndix
3, T
able
4.H
.2 E
last
iciti
es fo
r Coa
stal
Aqu
acul
ture
Fis
h, Th
aila
nd

231Appendix 3
Ti
lap
iaSi
lver
bar
bC
atfi
shSn
akeh
ead
Hig
h-v
alu
e fi
shLo
w-v
alu
e fi
shP
raw
nP
roce
ssed
fi
shC
arn
ivo
re
feed
Her
biv
ore
fe
ed
Tila
pia
0.39
-0.6
41.
95-0
.80
0.16
-0.0
7-0
.69
0.07
0.14
0.02
Silv
er b
arb
-0.5
31.
500.
29-2
.40
-0.0
3-0
.17
0.48
0.10
-0.2
70.
16
Cat
fish
0.00
0.00
1.08
0.00
0.00
0.00
0.00
0.00
-0.0
10.
00
Snak
ehea
d-0
.28
-1.0
2-1
.06
6.72
-0.2
0-0
.23
1.15
-0.1
80.
38-0
.40
Hig
h-v
alu
e fi
sh-0
.61
0.52
-3.0
92.
94-0
.39
-1.0
5-0
.91
-0.2
6-0
.49
-0.0
6
Low
-val
ue
fish
0.13
-0.0
3-0
.29
-0.4
40.
120.
90-0
.34
0.17
0.27
-0.0
3
Pra
wn
-0.0
3-0
.09
0.27
-0.2
90.
51-1
.09
-0.5
2-0
.24
-0.4
3-0
.37
Pro
cess
ed fi
sh0.
080.
133.
07-0
.53
0.23
-0.5
7-0
.30
0.14
-0.1
60.
02
Car
niv
ore
feed
-0.0
80.
192.
78-0
.62
-0.2
00.
560.
320.
09-1
.54
0.86
Her
biv
ore
feed
-0.0
2-0
.23
-3.5
81.
330.
040.
970.
08-0
.02
2.50
-1.3
3
Appe
ndix
3, T
able
4.H
.3 E
last
iciti
es fo
r Fre
shw
ater
Aqu
acul
ture
Fis
h, Th
aila
nd
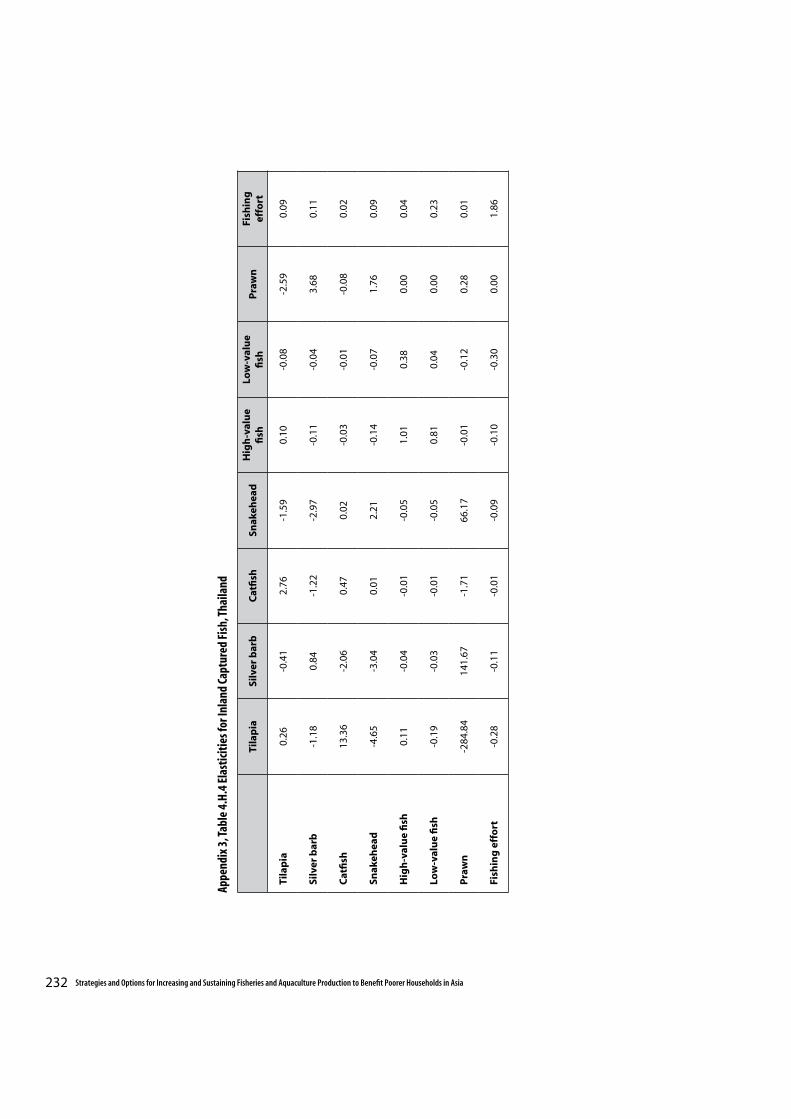
232 Strategies and Options for Increasing and Sustaining Fisheries and Aquaculture Production to Benefit Poorer Households in Asia
Ti
lap
iaSi
lver
bar
bC
atfi
shSn
akeh
ead
Hig
h-v
alu
e fi
shLo
w-v
alu
e fi
shP
raw
nFi
shin
g
effo
rt
Tila
pia
0.26
-0.4
12.
76-1
.59
0.10
-0.0
8-2
.59
0.09
Silv
er b
arb
-1.1
80.
84-1
.22
-2.9
7-0
.11
-0.0
43.
680.
11
Cat
fish
13.3
6-2
.06
0.47
0.02
-0.0
3-0
.01
-0.0
80.
02
Snak
ehea
d-4
.65
-3.0
40.
012.
21-0
.14
-0.0
71.
760.
09
Hig
h-v
alu
e fi
sh0.
11-0
.04
-0.0
1-0
.05
1.01
0.38
0.00
0.04
Low
-val
ue
fish
-0.1
9-0
.03
-0.0
1-0
.05
0.81
0.04
0.00
0.23
Pra
wn
-284
.84
141.
67-1
.71
66.1
7-0
.01
-0.1
20.
280.
01
Fish
ing
eff
ort
-0.2
8-0
.11
-0.0
1-0
.09
-0.1
0-0
.30
0.00
1.86
Appe
ndix
3, T
able
4.H
.4 E
last
iciti
es fo
r Inl
and
Capt
ured
Fis
h, Th
aila
nd

233Appendix 3
Carp Seed Feed Labor
Carp 0.0575 0.2305 0.0910 -0.0311
Seed 0.0000 0.2280 -0.0009 0.0000
Feed -0.0212 -4.3998 0.8751 0.0125
Labor 0.0889 1.2059 0.1535 0.0166
Catfish Seed Feed Labor
Catfish 2.1623 -0.3814 0.0764 0.0038
Seed 0.0001 1.8767 0.0005 0.0002
Feed -0.0107 0.2678 2.0232 -0.0084
Labor -0.0090 1.3366 -0.1433 0.0051
Tilapia Seed Feed Labor
Tilapia 0.0979 2.4582 0.4245 0.0018
Seed -0.0001 1.5275 0.0028 0.0001
Feed -0.0495 5.3305 0.9514 -0.0037
Labor -0.0044 4.6808 -0.0786 -0.0102
Shrimp Seed Feed Labor
Shrimp 0.1457 -8.1281 -0.2292 0.0021
Seed 0.0008 20.8933 -0.0248 0.0000
Feed 0.0034 -3.6960 -0.6927 0.0049
Labor -0.0009 0.0688 0.1371 0.0027
Appendix 3, Table 4.I.2 Elasticities for Cultured Catfish, Vietnam
Appendix 3, Table 4.I.3 Elasticities for Cultured Tilapia, Vietnam
Appendix 3, Table 4.I.4 Elasticities for Cultured Shrimp, Vietnam
Appendix 3, Table 4.I.1 Elasticities for Cultured Carp, Vietnam

234 Strategies and Options for Increasing and Sustaining Fisheries and Aquaculture Production to Benefit Poorer Households in Asia
Appendix 4, Table 1.A.1 Supply Elasticities by Types of Fish, Bangladesh
Appendix 4
Appendix 4, Table 1 Supply and Demand Elasticities by Types of Fish in Nine DMCs
Inland culture
Indian major carp 0.7
Other carp 0.5
Tilapia 0.6
Pangas 0.6
Brackish culture
Shrimp 0.8
Inland capture
Indian major carp 0.4
Live fish 0.7
Hilsha 0.5
Freshwater fish 0.5
Marine capture
High-value marine fish 0.4
Low-value marine fish 0.3
Demand elasticities
Own price Expenditure
Rural Urban Rural Urban
Indian major carp -1.92 -0.65 1.97 1
Other carp -3.36 -0.19 1.26 0.6
Tilapia -1.37 -1.27 1.47 -0.25
Pangas -1.7 -2.58 2.45 2.09
Live fish -5.2 -0.55 1.29 1
Hilsha -2.15 -0.77 2.26 1.06
Freshwater fish -0.6 -0.75 0.97 0.59
Shrimp -0.93 -0.49 0.99 0.43
High-value marine fish -7.3 0.23 2.98 0.84
Dried fish -1 3.29 2.56 0.83
Appendix 4, Table 1.A.2 Demand Elasticities by Types of Fish, Bangladesh

235Appendix 4
Aquaculture
Carp 0.09
Other finfish aquaculture 0.9
Shrimp 1.42
Other fish aquaculture 0.55
Tilapia 0.4
Capture
Other finfish capture 0
Shrimp 0
Other capture 0
Appendix 4, Table 1.B.1 Supply Elasticities by Types of Fish, China
Demand elasticities
Own price Expenditure
Rural Urban Rural Urban
Carp -1 -0.3 0.9 1
Other finfish -0.8 -0.5 1 1.1
Shrimp -0.2 -0.5 1.3 1.5
Other fish -1.2 -0.5 1 1.3
Appendix 4, Table 1.B.2 Demand Elasticities by Types of Fish, China
Aquaculture
Indian major carps 1.56
Other freshwater fish 1.716
Prawn 0.727
Marine capture
Pelagic high-value fish 0.276
Pelagic low-value fish 0.326
Demersal high-value fish 0.454
Demersal low-value fish 0.203
Shrimp 0.494
Mollusks 0.278
Appendix 4, Table 1.C.1 Supply Elasticities by Types of Fish, India

236 Strategies and Options for Increasing and Sustaining Fisheries and Aquaculture Production to Benefit Poorer Households in Asia
Demand elasticities
Own price Expenditure
India India
Indian major carps -0.99 1.62
Other freshwater fish -0.99 1.62
Prawn/Shrimp -0.99 1.61
Pelagic high-value fish -0.99 1.62
Pelagic low-value fish -1.05 1.62
Demersal high-value fish -0.95 1.62
Demersal low-value fish -0.88 1.62
Mollusks -1 1.66
Appendix 4, Table 1.C.2 Demand Elasticities by Types of Fish, India
Appendix 4, Table 1.D.1 Supply Elasticities by Types of Fish, Indonesia
Inland culture
Carp 0.1449
Tilapia 0.025
Catfish 0.0043
Brackish culture
Shrimp 0.5
Milkfish 0.5
Marine culture
Grouper 0.5
Inland capture
Other finfish 0.0975
Carp 0.09353
Tilapia 0.009353
Catfish 0.01446
Marine capture
Shrimp 0.23
Tuna 0.23
Mackerel 0.03
Assorted pelagic fish 0.096
Grouper 0.23
Snapper 0.23
Other finfish 0.0964

237Appendix 4
Appendix 4, Table 1.D.2 Demand Elasticities by Types of Fish, Indonesia
Demand elasticities
Own price Expenditure
Rural Urban Rural Urban
Shrimp -1.2 -1.06 1.8703 1.4916
Tuna -1.35 -1.45 1.1241 0.6184
Mackerel -1.35 -1.75 1.026 1.3914
Assorted pelagic fish -1.56 -1.46 0.6827 0.5213
Grouper -1.35 -1.45 1.2879 1.2879
Snapper -1.35 -1.45 1.2879 1.2879
Other finfish -0.9 -0.9 0.6521 0.6521
Carp -0.94 -0.9 0.2624 0.2624
Tilapia -0.94 -0.9 0.4826 0.4826
Catfish -0.94 -0.9 0.4826 0.4826
Milkfish -0.94 -0.9 0.9759 0.9759
Dried -0.92 -0.9 0.6184 0.6184
High-value pelagic fish -1.85 -1.3 1.4986 1.4986
Purse Seine Anchovy
Anchovy -0.1134
Marine capture
Low-value fish 0.1048
High-value fish 0.6234
Low-value crustacean 0.0415
High-value crustacean 0.2297
Mollusks 0.4464
Others 0.2296
Brackish culture
High-value fish 1.47
High-value crustacean 3.162
Mollusk -0.305
Tilapia 0.871
Freshwater
Low-value fish 0.05
Tilapia 0.1795
Appendix 4, Table 1.E.1 Supply Elasticities by Types of Fish, Malaysia

238 Strategies and Options for Increasing and Sustaining Fisheries and Aquaculture Production to Benefit Poorer Households in Asia
Demand elasticities
Own price Expenditure
Rural Urban Rural Urban
Tilapia -1.086 -1.062 0.9915 0.9862
Low-value fish -1.262 -1.35 1.2583 1.2979
High-value fish -1.25 -1.39 0.4925 0.6512
Crustacean -1.341 -1.1 0.5206 0.5835
Mollusk -1.077 -1.28 0.8327 0.8285
Anchovy -1.25 -1.089 0.931 0.9214
Others 2.1783 2.1889
Appendix 4, Table 1.E.2 Demand Elasticities by Types of Fish, Malaysia
Aquaculture
Oyster 0.8
Carp 0.4
Catfish 0.6
Milkfish 1
Tilapia 0.8
Shrimp 0.8
Other aquaculture 0.4
Other shell fish 0.4
Commercial
Grouper 0.6
Tuna 0.6
Anchovy 0.6
Roundscad 0.6
Other shell fish 0.6
Squid 0.6
Shrimp 0.6
Other captured fish 0.6
Municipal
Tuna 0.1
Grouper 0.1
Anchovy 0.1
Roundscad 0.1
Squid 0.1
Other shell fish 0.1
Shrimp 0.1
Milkfish 0.1
Tilapia 0.1
Carp 0.1
Catfish 0.1
Other captured fish 0.1
Appendix 4, Table 1.F.1 Supply Elasticities by Types of Fish, Philippines

239Appendix 4
Appendix 4, Table 1.F.2 Demand Elasticities by Types of Fish, Philippines
Demand elasticities
Own price Expenditure
Rural Urban Rural Urban
Anchovy -1.249 -1.343 0.70416 0.58675
Milk fish -1.761 -1.369 0.43422 0.69664
Roundscad -1.527 -1.5 0.57417 0.58245
Tilapia -1.661 -1.493 0.47952 0.59086
Shrimp -0.953 -0.989 1.84999 1.42926
Squid -1.33 -1.233 1.48804 1.34615
Shell fish n/a n/a 1.46592 1.44338
Others -1.502 -1.657 1.59681 1.90295
Processed fish -1.426142857 -1.369142857 0.7979 0.70925
Aquaculture
Cultured prawn 0.4
Freshwater fish 0.13
Marine capture
Large pelagic fish 0.18
Small pelagic fish 0.1
Demersal fish 1.18
Other marine fish 0.72
Municipal
Freshwater fish 0.2
Appendix 4, Table 1.G.1 Supply Elasticities by Types of Fish, Sri Lanka
Demand elasticities
Own price Expenditure
Rural Urban Estate Rural Urban Estate
Large pelagic fish -0.83 -0.83 -0.83 1 1 1
Small pelagic fish -0.56 -0.56 -0.56 0.99 0.99 0.99
Demersal fish -1.01 -1.01 -1.01 1 1 1
Other marine fish -1.01 -1.01 -1.01 1.01 1.01 1.01
Freshwater fish -1.06 -1.06 -1.06 0.97 0.97 0.97
Appendix 4, Table 1.G.2. Demand Elasticities by Types of Fish, Sri Lanka

240 Strategies and Options for Increasing and Sustaining Fisheries and Aquaculture Production to Benefit Poorer Households in Asia
Appendix 4, Table 1.H.1 Supply Elasticities by Types of Fish, Thailand
Freshwater aquaculture
Tilapia 0.39
Silver barb 1.5
Catfish 1.08
Snakehead 1.72
High-value freshwater fish 0.5
Low-value freshwater fish 0.9
Prawn 2
Marine culture
Shrimp (culture) 3.16
High-value marine 1.08
Low-value marine 0.1
Marine capture
Indo Pacific mackerel 0.03
Shrimp (capture) 0.23
High-value marine fish 0.28
Low-value marine fish 0.08
Cephalopods 0.02
Inland capture
Tilapia 0.26
Silver barb 0.84
Catfish 0.47
Snakehead 2.21
High-value freshwater fish 1.01
Low-value freshwater fish 0.04
Prawn 0.28
Appendix 4, Table 1.H.2 Demand Elasticities by Types of Fish, Thailand
Demand elasticities
Own price Expenditure
Rural Urban Rural Urban
Tilapia -0.66 -0.66 0.27 0.27
Silver barb -0.05 -0.05 0.6 0.6
Catfish -0.9 -0.9 0.71 0.71
Snakehead -1.1 -1.1 1.47 1.47
Indo Pacific mackerel -0.8 -0.8 1.34 0.95
Shrimp -0.29 -1.5 1.64 1.03
Cephalopods -0.31 -0.8 0.9 0.9
Processed freshwater fish -1.02 -0.02 1.31 1.31
Processed captured fish -0.02 -0.02 1.13 1.13
Prawn -0.65 -0.65 1.03 1.03
High-value fish 0.31 -0.31 1.37 1.37
Low-value fish 1.03 1.02

241Appendix 4
Freshwater aquaculture
Tilapia 0.0979
Catfish 1.1623
Other freshwater fish 0.0575
Marine culture
Shrimp 0.1457
Marine capture
Mollusk 0.4
Squid 0.4
High-value marine fish 0.4
Low-value marine fish 0.1
Anchovy 0.1
Appendix 4, Table 1.I.1 Supply Elasticities by Types of Fish, Vietnam
Demand elasticities
Own price Expenditure
Rural Urban Rural Urban
Catfish -0.988 -0.988 0.603 0.603
Shrimp -2.031 -3.031 0.917 0.917
Tilapia -1.782 -2.782 0.679 0.679
Mollusk -1.655 -1.655 1.013 1.013
Squid -0.514 -0.514 0.923 0.923
Low-value marine fish -1.185 -1.185 0.451 0.451
High-value marine fish -0.738 -0.738 0.98 0.98
Anchovy -0.4 -0.4 0.276 0.276
Other freshwater fish -0.684 -0.684 0.492 0.492
Processed fish 0.176 0.176
Appendix, 4 Table 1.I.2 Demand Elasticities by Types of Fish, Vietnam

242 Strategies and Options for Increasing and Sustaining Fisheries and Aquaculture Production to Benefit Poorer Households in Asia
Aquaculture—food and livelihoods for the poor in Asia:A brief overview of the issues
Twelve articles printed in the journal Aquaculture Economics and Management volume 9 (issue 1 and 2) January 2005 arose as a result of the research work carried out by the WorldFish Center for the project titled “Strategies and Options for Increasing and Sustaining Fisheries and Aquaculture Production to Benefit Poorer Households in Asia.”
The full versions of the papers are available from the publisher Taylor and Francis through the website http://www.uaex.edu/cengle/IAAEM/Management/default.htm.
Dey, Madan M. and Mahfuzuddin Ahmed. 2005. “Aquaculture – Food and Livelihoods for the Poor in Asia: a Brief Overview of the Issues” Aquaculture Economics & Management 9(1): 1-10.
Abstract This article does not have an abstract.
Dey, Madan Mohan, Mohammed A. Rab, Ferdinand J. Paraguas, Ramachandra Bhatta, Md. Ferdous Alam, Sonny Koeshendrajana and Mahfuzuddin Ahmed. 2005. “Status and Economics of Freshwater Aquaculture in Selected Countries of Asia” Aquaculture Economics & Management 9(1): 11-37.Reprinted by permission of the publisher (Taylor & Francis, http://www.informaworld.com).
AbstractThe paper discusses the status of freshwater aquaculture, and the productivity and cost effectiveness of alternative technologies in the major fish producing countries in Asia, such as Bangladesh, China India, Indonesia, the Philippines, Thailand and Vietnam. The analysis is based on field survey data collected by the WorldFish Center and its partner research institutes, and supplemented by secondary information. The paper adopts descriptive techniques to compare the performance of each technology across the countries in terms of productivity, cost effectiveness and profitability. Results suggest that freshwater fish farming is generally profitable in Asia. The semi-intensive polyculture and monoculture of omnivorous and herbivorous species like carps and tilapia are likely to be more suitable for adoption by the poor farmers in Asia. Although the return from monoculture of carnivorous species such as prawn, snakehead and walking catfish is higher than that from culture of omnivorous and herbivorous species, it appears too capital intensive to be suitable for adoption by the resource poor farmers. The paper also performs econometric analysis to examine the determinants of fish production under polyculture and feed demand for the same. The results of the production function analysis reveal that further use of farm-based feed after a certain level of application cannot increase productivity as the law of diminishing marginal productivity sets in. Feed use is largely determined by the income and ownership status of the farmer. Provision of institutional credit and more secured access to the waterbodies would help poor farmers adopt appropriate aquaculture technologies.
Appendix 5.1

243Appendix 5
Dey, Madan Mohan, Ferdinand Javien Paraguas, Nartaya Srichantuk, Yuan Xinhua, Ramachandra Bhatta and Le Thi Chau Dung. 2005. “Technical Efficiency of Freshwater Pond Polyculture Production in Selected Asian Countries: Estimation and Implication” Aquaculture Economics & Management 9(1): 39-63.Reprinted by permission of the publisher (Taylor & Francis, http://www.informaworld.com).
AbstractThe research documented in this paper estimated the levels and determinants of farm-level technical efficiencies (TE) in freshwater pond polyculture systems in China, India, Thailand and Vietnam. The levels of country-specific TE were estimated for different production intensity levels by estimating stochastic production frontier functions involving the model for technical inefficiency effects. The results were compared with estimates from past studies of aquaculture TE. It was found that yield, input levels and TE increases in line with intensity levels. TE estimates ranged from 42% among extensive farms in Vietnam to 93% among intensive farms in China. For low intensity farms, increased technical efficiency, and the resulting increased productivity, could be achieved by increasing human capital (through effective and efficient training and extension), provision of basic infrastructure (such as roads), easier access to seed supplies, and security of tenure or a well-defined system of land use rights. Increasing technical efficiency and productivity among intensive farms will result more from the continuous development of new technology and cross-country technology transfer. However, the realization of these potential increases in TE depends on governments in these countries continuing to provide adequate support for freshwater aquaculture development.
Dey, Madan M., Mark Prein, A. B. M. Mahfuzul Haque, Parvin Sultana, Nguyen Cong Dan and Nguyen Van Hao. 2005. “Economic Feasibility of Community-Based Fish Culture in Seasonally Flooded Rice Fields in Bangladesh and Vietnam” Aquaculture Economics & Management 9(1): 65-88.Reprinted by permission of the publisher (Taylor & Francis, http://www.informaworld.com).
AbstractDuring the rainy season in extensive river floodplains and deltaic lowlands, floods lasting several months render the land unavailable for crop production for several months each year. These waters are considerably underutilized in terms of managed aquatic productivity. This raises the opportunity to enclose parts of these annually occurring floodwater areas to produce a crop of specifically stocked aquatic organisms aside from the naturally occurring ‘wild’ species that are traditionally fished and are not affected by the culture activity, overall resulting in more high-quality, nutrient-dense food production and enhanced farm income for all stakeholders, notably the poor. The WorldFish Center and its national partners recently tested two systems in a community based management approach in Bangladesh and Vietnam: (i) concurrent rice-fish culture in shallower flooded areas, and (ii) alternating rice and fish culture in the deep-flooded areas. Results indicate that community-based fish culture in rice fields is technically feasible, economically viable and socially acceptable. It can increase fish production to about 600 kg/ha/year in shallow flooded areas and up to 1.5 t/ha/year in deep-flooded areas, without reduction in rice yield and wild fish catch. For the overall system and in the trials conducted, an additional income of US$135 per ha in southern Vietnam, and up to US$437 per ha in Bangladesh were achieved, which is an increase of 20%to 85% over the previous profitability. The communities neighboring the trial sites have been adopting the technologies widely.

244 Strategies and Options for Increasing and Sustaining Fisheries and Aquaculture Production to Benefit Poorer Households in Asia
Dey, Madan Mohan, Mohammed A. Rab, Ferdinand J. Paraguas, Somying Piumsombun, Ramachandra Bhatta, Md Ferdous Alam and Mahfuzuddin Ahmed. 2005. “Fish Consumption and Food Security: a Disaggregated Analysis by Types of Fish and Classes of Consumers in Selected Asian Countries” Aquaculture Economics & Management 9(1): 89-111.Reprinted by permission of the publisher (Taylor & Francis, http://www.informaworld.com).
AbstractThis paper discusses fish consumption and preference patterns for fish species by income groups, and by urban/rural divide in Bangladesh, China, India, Indonesia, the Philippines, Thailand, and Vietnam. The analysis is based on primary data collected by the WorldFish Center and its partner institutes by means of a survey of 5,931 households in the selected countries. The FAO database and other published materials were also used to analyze trends in fish consumption. Freshwater fish species constitute a major share in total per capita fish consumption in most of these countries. Pelagic and demersal marine fish are the main contributor to per capita total fish consumption in the countries with longer coastal boundaries (such as Indonesia, the Philippines and Thailand), and in the coastal regions within each country. Results suggest that fish contributes between 15% and 53% of the total animal protein intake in these countries. Fish consumption varies widely with economic position of the households, in terms of both per capita consumption and type of fish species. Per capita fish consumption increases with increase in income. The share of fish protein in total animal protein expenditure is higher for lower income groups, demonstrating their dependence on fish as a source of animal protein. Poor people consume mostly low-price fish and rich people spend a significant portion of their fish budget on expensive fish. Per capita fish consumption is substantially higher in rural areas than in urban areas.
Dey, Madan M., Roehlano M. Briones and Mahfuzzudin Ahmed. 2005. “Disaggregated Analysis of Fish Demand, and Trade in Asia: Baseline Model and Estimation Strategy” Aquaculture Economics & Management 9(1): 113-139.Reprinted by permission of the publisher (Taylor & Francis, http://www.informaworld.com).
AbstractQuantitative modeling of fish supply, demand and trade is a useful tool for analyzing recent structural changes, such as the rapid development of aquaculture. Existing models are, however, limited by their use of highly aggregated fish categories and assumed (rather than estimated) elasticities. This paper outlines an estimation strategy and a multiproduct equilibrium model for disaggregated analysis of fish supply, demand, and trade. The model is composed of a producer, consumer and trade core, and is specified to accommodate special features of the fish sector. The estimation and modeling strategy also address common data problems, such as heterogeneity of fish types, diversity of production categories, and so forth. The model has been applied to nine major fish producers in developing Asia.

245Appendix 5
Garcia, Yolanda T., Madan Mohan Dey and Sheryl Ma M. Navarez. 2005. “Demand for Fish in the Philippines: a Disaggregated Analysis” Aquaculture Economics & Management 9(1): 141-168.Reprinted by permission of the publisher (Taylor & Francis, http://www.informaworld.com).
AbstractThis paper sought to establish the fish consumption pattern of Filipino households and estimate the price and income elasticities of fish demand by species, as well as by income groups, i.e., low, middle, and high income. The study used the countrywide Family Income and Expenditure Survey (FIES) for year 2000 of the National Statistics Office, which includes over 39,000 households. A three-stage budgeting framework was used in the analysis, which estimated food and fish expenditure functions in the first and second stages, respectively. In the third stage, a system of demand equations for fish by species was estimated using a quadratic almost ideal demand system (QUAIDS) model. Parameter estimates of the model were corrected through the Heckman procedure to remove the possible bias brought about by zero consumption of certain fish species resulting from nonpreference or infrequent purchases. Results showed that estimated price and income elasticities of demand varied substantially across fish type and across income groups. All 11 fish types included in the study were found to have positive income elasticity for all income levels. Hence, fish in general can be considered normal goods, including processed fish. However, the high-priced fish types generated elasticity values greater than one, which rendered them as luxury food fish. Own-price elasticity, on the other hand, was found to be elastic in most species with values increasing as consumers climbed up the income ladder. This observation, however, was not true in the case of milkfish and tilapia (two most popular species in the country) where price responsiveness of demand was found to be higher among the lower-income groups.
Rodriguez, U-Primo E., Yolanda T. Garcia and Sheryl M. Navarez. 2005. “The Effects of Export Prices on the Demand and Supply for Fish in the Philippines” Aquaculture Economics & Management 9(1): 169-194.Reprinted by permission of the publisher (Taylor & Francis, http://www.informaworld.com).
AbstractThis paper describes the effects of changes in export prices on Philippine fish demand, supply, prices and trade. The analysis uses a multi-commodity-model of the fisheries sector that is based on the AsiaFish model. The results indicate that higher export prices lead to higher output and exports for the fisheries sector. However, such changes also cause a decline in the domestic consumption of fish.
Li, Luping and Jikun Huang. 2005. “China’s Accession to the WTO and Its Implications for the Fishery and Aquaculture Sector” Aquaculture Economics & Management 9(1): 195-215.Reprinted by permission of the publisher (Taylor & Francis, http://www.informaworld.com).
AbstractThis paper reviews recent developments in China’s fishery and aquaculture sectors, as well as the policies affecting rural households in general and fisheries households in particular. It explores how China’s policies may change as a result of the nation joining the World Trade Organization (WTO) in December 2001 and the likely impacts of these changes on China’s fishery and aquaculture sector. It was found that the domestic fish markets are gradually integrating, suggesting that fish price shifts in one area will affect prices in most parts of the country. It was also found that, compared with the prices of other agricultural commodities, the domestic prices of most aquatic products are well below world prices. This suggests that exports of aquatic products would be able to expand now that the nation has joined the WTO and that fishers would gain from this move.

246 Strategies and Options for Increasing and Sustaining Fisheries and Aquaculture Production to Benefit Poorer Households in Asia
Dey, Madan M., M. A. Rab, K. M. Jahan, A. Nisapa, A. Kumar and M. Ahmed. 2005. “Food Safety Standards and Regulatory Measures: Implications for Selected Fish Exporting Asian Countries” Aquaculture Economics & Management 9(1): 217-236.Reprinted by permission of the publisher (Taylor & Francis, http://www.informaworld.com).
AbstractDeveloping Asian countries continue to record an impressive trade surplus in fish products. However, raising consumer concerns about a range of food safety matters and increasingly stringent regulatory standards related to fish product supply pose on-going challenges to the sustained international market access of many developing country suppliers. This paper provides an overview of emerging trade patterns in fish products and the trade regime in which this is occurring. It then reviews the implementation of various food safety standards on fish and seafood exports in the major fish-exporting countries in Asia, and analyzes the costs and benefits of compliance with these standards and regulations in these countries. Results show that, at the factory level, implementation of the standards has significantly increased the cost of processing, and the cost per unit of fish processed is higher for the smaller plants. These economies of scale could exclude small operators in developing countries. Continued competitiveness of small plants would seem to require government policies and support designed to minimize the cost of compliance with international standards.
Katiha, Pradeep K., J. K. Jena, N. G. K. Pillai, Chinmoy Chakraborty and M. M. Dey. 2005. “Inland Aquaculture in India: Past Trend, Present Status and Future Prospects” Aquaculture Economics & Management 9(1): 237-264.Reprinted by permission of the publisher (Taylor & Francis, http://www.informaworld.com).
AbstractIn India, inland aquaculture has emerged as a fast-growing enterprise and a viable alternative to the declining capture fisheries. The present paper is an attempt to assess Indian inland aquaculture with respect to its resource base, output trends, systems and activities, yield gaps, adoption and impact on aquaculturists, economics, returns to inputs, investment needs, and future prospects. The paper is largely based on existing literature and observations made as part of an ICAR-WorldFish demand supply project. Indian aquaculture is primarily limited to inland sector and carp-oriented; for that reason, this activity received special attention. Freshwater aquaculture observed tremendous growth in the past 15 years, but immense scope still exists for horizontal expansion and increases in productivity (vertical expansion). This is evidenced by the fact that the average farm fish yield is only one-third of that achieved in farm trials. The difference was mainly due to much higher input use in on-farm trials. Most of the aquaculturists were practicing extensive aquaculture, but aquaculturists with semi-intensive operations benefited most from adoption of technology. The benefit:cost ratios for different systems of aquaculture varied between 1.22 to 1.86. The return to capital was much higher than the return to labor, due to the low labor input. The semi-intensive aquaculture system would receive the greatest return from projected macrolevel investments, followed by extensive and intensive systems. Dedicated efforts are needed to meet the demand for quality fish seed and feed in order to achieve the desired 45% increase in area and greater than 50% increase in productivity. Based on the observations, activities designed to foster inland aquacultural development in India are recommended.

247Appendix 5
Piumsombun, S., M. A. Rab, M. M. Dey, and M. Srichantuk. 2005. “The Farming Practices and Economics of Aquaculture in Thailand” Aquaculture Economics & Management 9(1): 265-287.Reprinted by permission of the publisher (Taylor & Francis, http://www.informaworld.com).
AbstractThe paper reviews freshwater and coastal aquaculture practices in Thailand, and compares the productivity, costs, and benefits across various types of cultivation and various intensities of production. The paper is based on data that were collected in surveys conducted during 1998-2001 by the Department of Fisheries (DOF), Thailand and the WorldFish Center. More than 22% of Thailand’s fish supply comes from aquaculture, with coastal aquaculture accounting for more than 88% of this in terms of value. Intensive culture of shrimp is the dominant form of coastal aquaculture, occupying 69% of the area under production. However, in some regions, the average net profit/kg of intensive shrimp culture is negative, and semi-intensive farming, with relatively lower fixed investment and operating costs, delivers the highest rate of return on investment. On the coast, grouper and sea bass are the most important cage-cultivated species, achieving an economic rate of return as high as 92%. In the same environment, culture of mollusks, such as green mussels, oysters, and blood cockles, is widespread. It can also be economically sustainable, with relatively low capital and operating costs. Although the relative share of freshwater aquaculture production is declining, the level of output has been increasing rapidly. While the average production from monoculture of carnivorous species is higher than that from polyculture, the average capital investment and operating costs associated with the former are also higher. The expansion of freshwater polyculture and of mollusk culture in coastal areas would greatly assist poor fish farmers.