1 what works in student retention? act’s fourth national survey on college retention dr. wes...
TRANSCRIPT
1
What Works in What Works in Student Retention?Student Retention?ACT’s Fourth National Survey
on College Retention
Dr. Wes HableyPrincipal Associate
Educational ServicesACT, Inc.
22
33
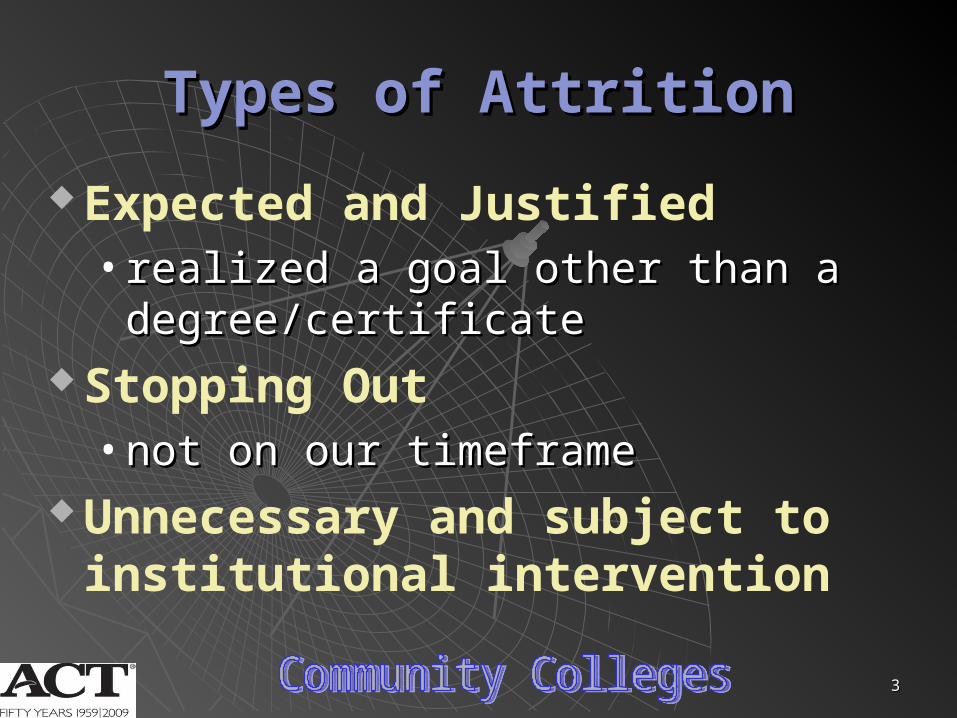
Types of AttritionTypes of Attrition
Expected and Justified• realized a goal other than a realized a goal other than a
degree/certificatedegree/certificate Stopping Out
• not on our timeframenot on our timeframe Unnecessary and subject to
institutional intervention
44
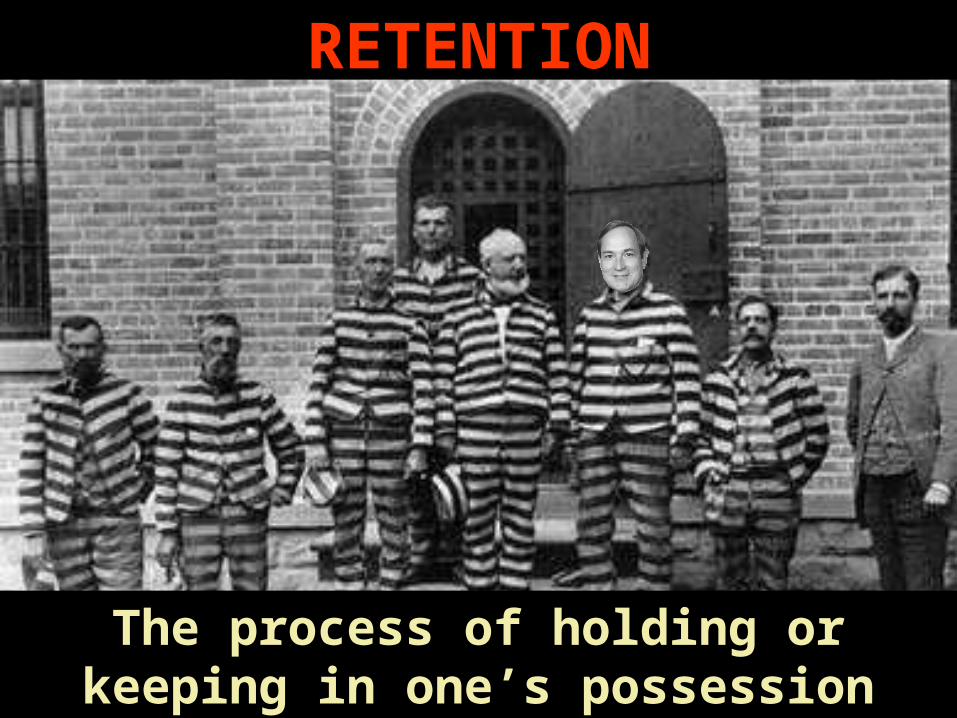
RETENTIONRETENTION
The process of holding or keeping in one’s possession

55
The process or state of being
gradually worn down.
ATTRITIONATTRITION
Migrant Mother, Dorothea Lange
Library of Congress, Prints and Photographs Division
[ reproduction number LC-USF34-9058-C]

6
PERSISTENCEPERSISTENCE
To continue to exist or prevail
77
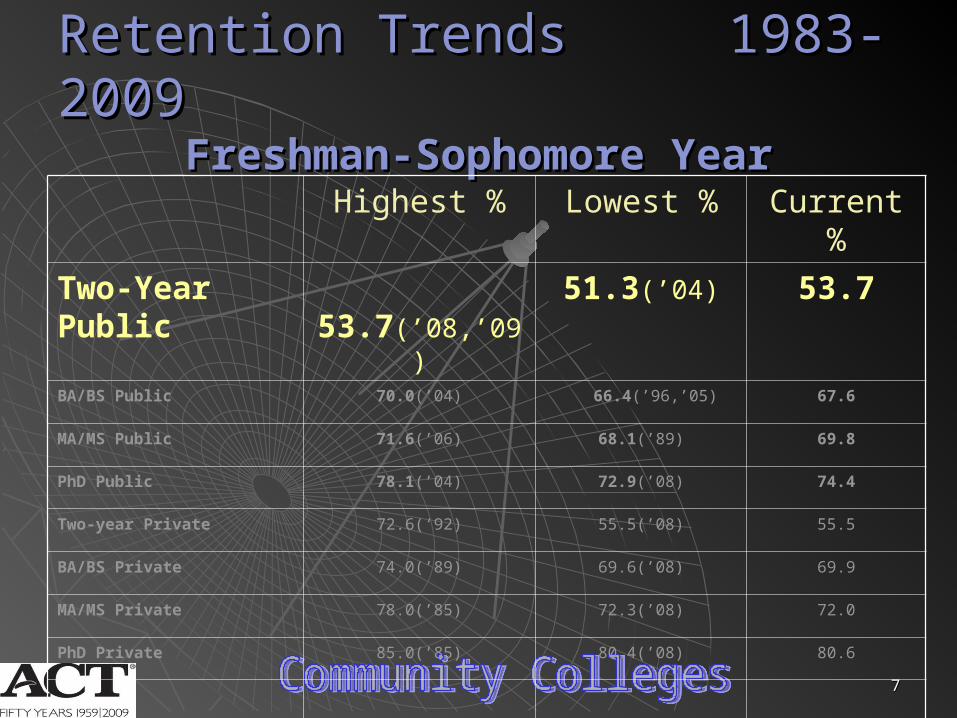
Retention TrendsRetention Trends 1983-20091983-2009 Freshman-Sophomore Year Freshman-Sophomore Year
Highest % Lowest % Current %
Two-Year Public
53.7(’08,’09) 51.3(’04) 53.7
BA/BS Public 70.0(’04) 66.4(’96,’05) 67.6
MA/MS Public 71.6(’06) 68.1(’89) 69.8
PhD Public 78.1(’04) 72.9(’08) 74.4
Two-year Private 72.6(‘92) 55.5(’08) 55.5
BA/BS Private 74.0(’89) 69.6(’08) 69.9
MA/MS Private 78.0(’85) 72.3(’08) 72.0
PhD Private 85.0(’85) 80.4(’08) 80.6
88
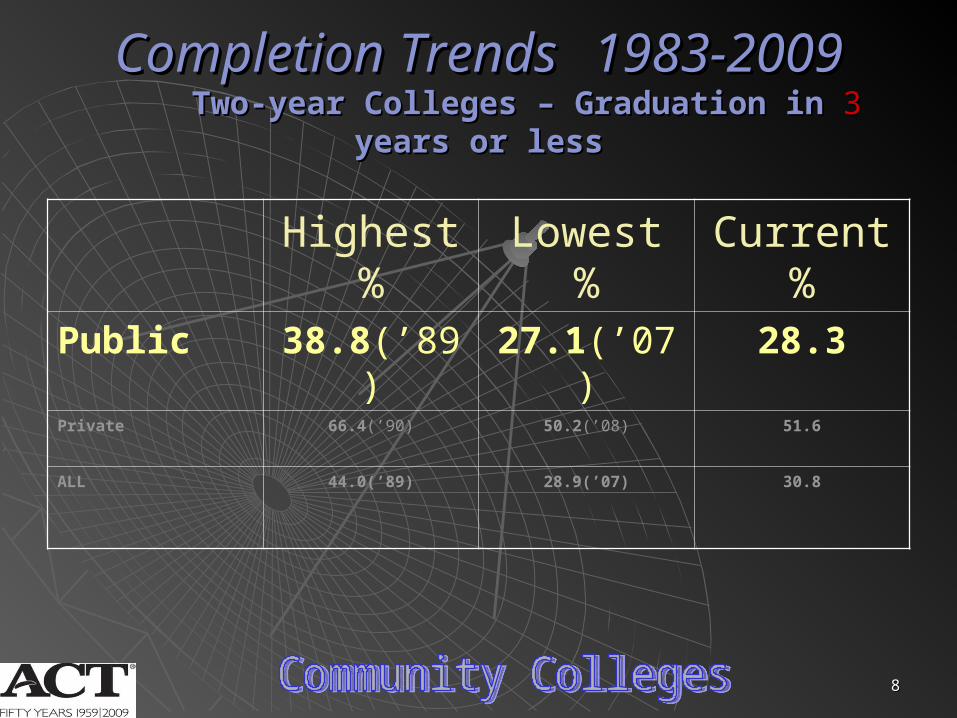
Completion TrendsCompletion Trends 1983-20091983-2009Two-year Colleges – Graduation in Two-year Colleges – Graduation in 33 years or years or
lessless
Highest % Lowest % Current %Public 38.8(’89) 27.1(’07) 28.3Private 66.4(’90) 50.2(’08) 51.6
ALL 44.0(’89) 28.9(’07) 30.8
99
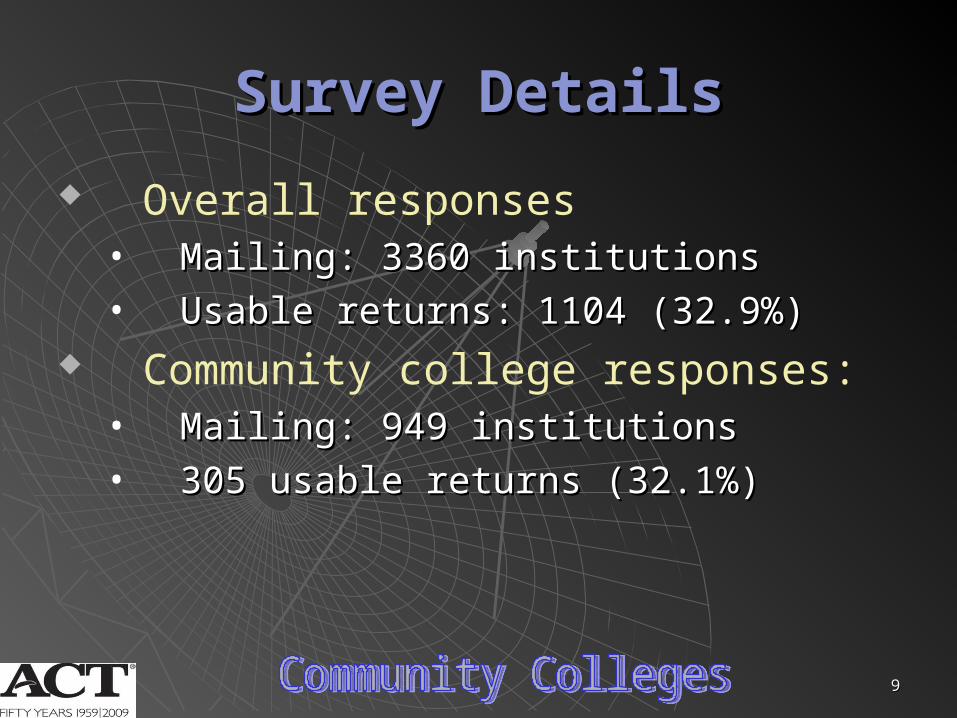
Survey DetailsSurvey Details
Overall responses• Mailing: 3360 institutionsMailing: 3360 institutions• Usable returns: 1104 (32.9%)Usable returns: 1104 (32.9%)
Community college responses:• Mailing: 949 institutions Mailing: 949 institutions • 305 usable returns (32.1%)305 usable returns (32.1%)

1010
Survey DetailsSurvey Details
Survey sectionsI.I. Background Background
II.II. Retention and degree completion ratesRetention and degree completion rates
III. Factors affecting attrition
IV. Retention practices
V. Highest impact programs
1111
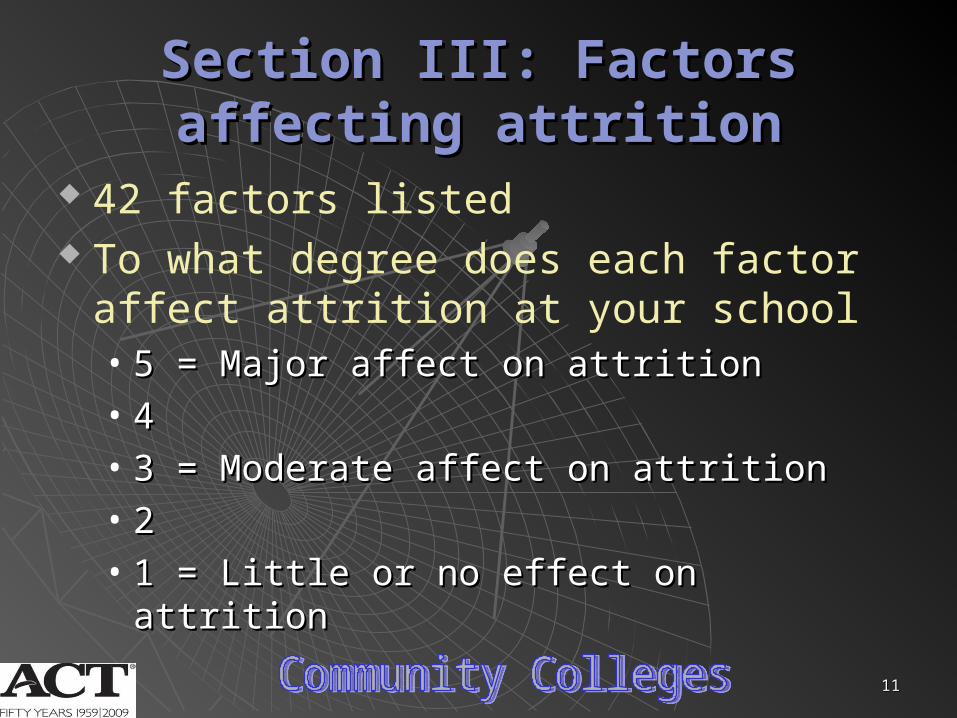
Section III: Factors affecting Section III: Factors affecting attritionattrition
42 factors listed To what degree does each factor affect
attrition at your school• 5 = Major affect on attrition5 = Major affect on attrition• 44• 3 = Moderate affect on attrition3 = Moderate affect on attrition• 22• 1 = Little or no effect on attrition1 = Little or no effect on attrition
1212
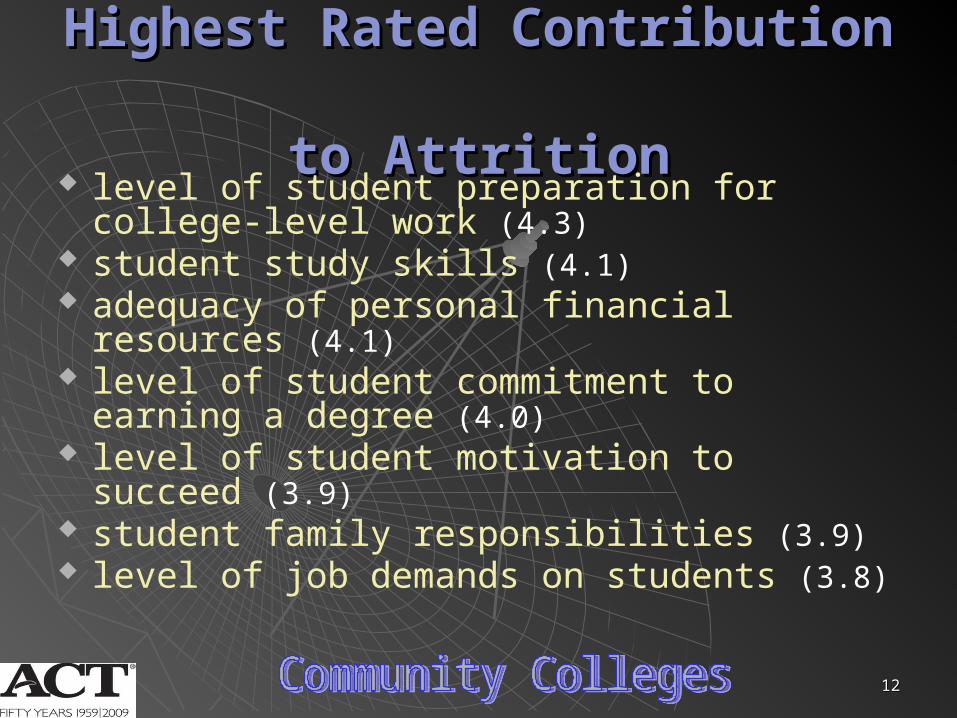
Highest Rated Contribution Highest Rated Contribution to Attritionto Attrition
level of student preparation for college-level work (4.3)
student study skills (4.1) adequacy of personal financial resources (4.1) level of student commitment to earning a degree
(4.0) level of student motivation to succeed (3.9) student family responsibilities (3.9) level of job demands on students (3.8)
1313
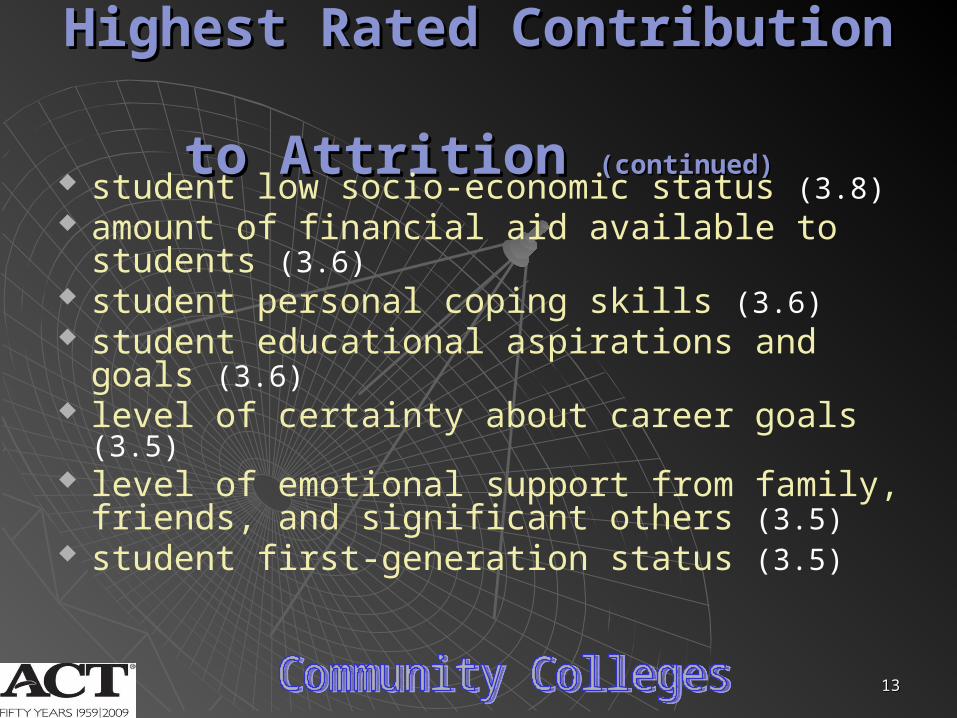
Highest Rated Contribution Highest Rated Contribution to Attrition to Attrition (continued)(continued)
student low socio-economic status (3.8) amount of financial aid available to students (3.6) student personal coping skills (3.6) student educational aspirations and goals (3.6) level of certainty about career goals (3.5) level of emotional support from family, friends,
and significant others (3.5) student first-generation status (3.5)
1414
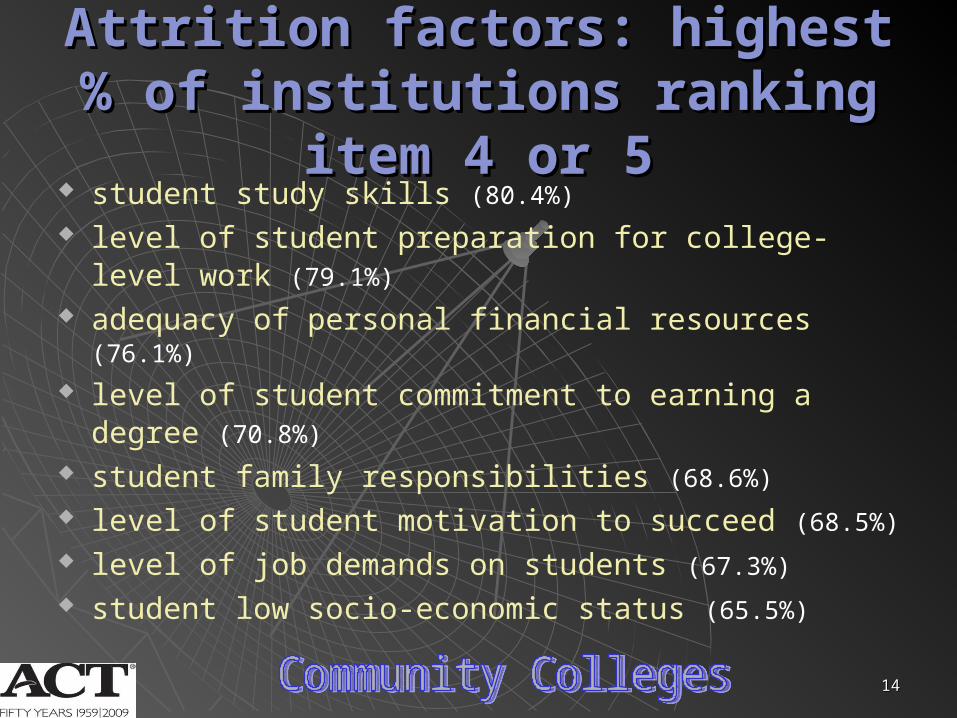
Attrition factors: highest % of Attrition factors: highest % of institutions ranking item 4 or 5institutions ranking item 4 or 5
student study skills (80.4%)
level of student preparation for college-level work (79.1%)
adequacy of personal financial resources (76.1%)
level of student commitment to earning a degree (70.8%)
student family responsibilities (68.6%)
level of student motivation to succeed (68.5%)
level of job demands on students (67.3%)
student low socio-economic status (65.5%)
1515
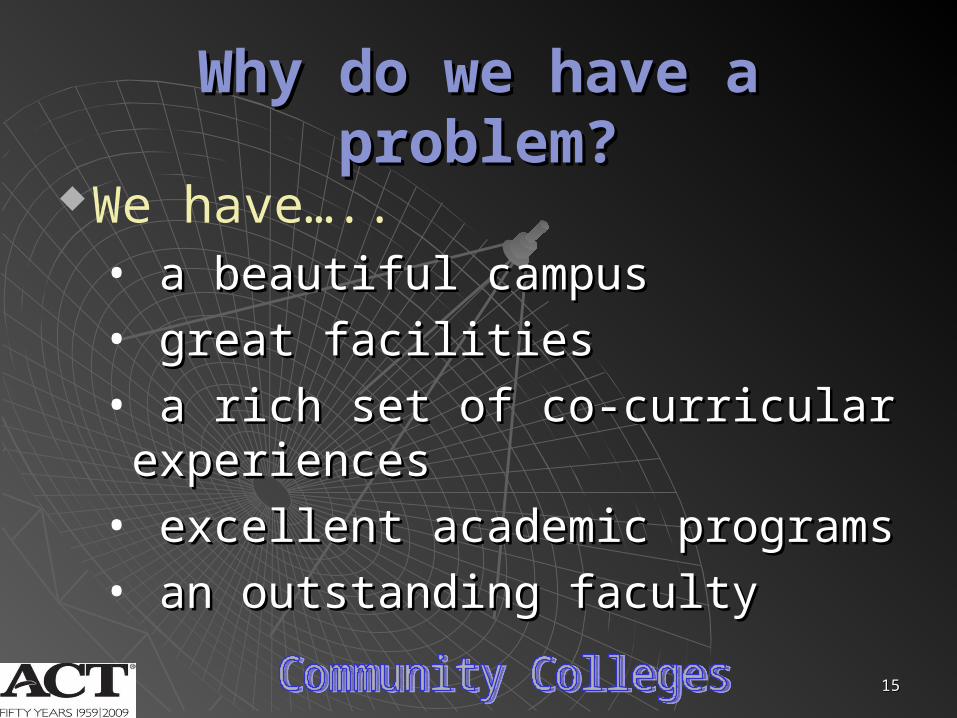
Why do we have a problem?Why do we have a problem?
We have…..• a beautiful campusa beautiful campus
• great facilitiesgreat facilities
• a rich set of co-curricular a rich set of co-curricular experiencesexperiences
• excellent academic programsexcellent academic programs
• an outstanding facultyan outstanding faculty
1616
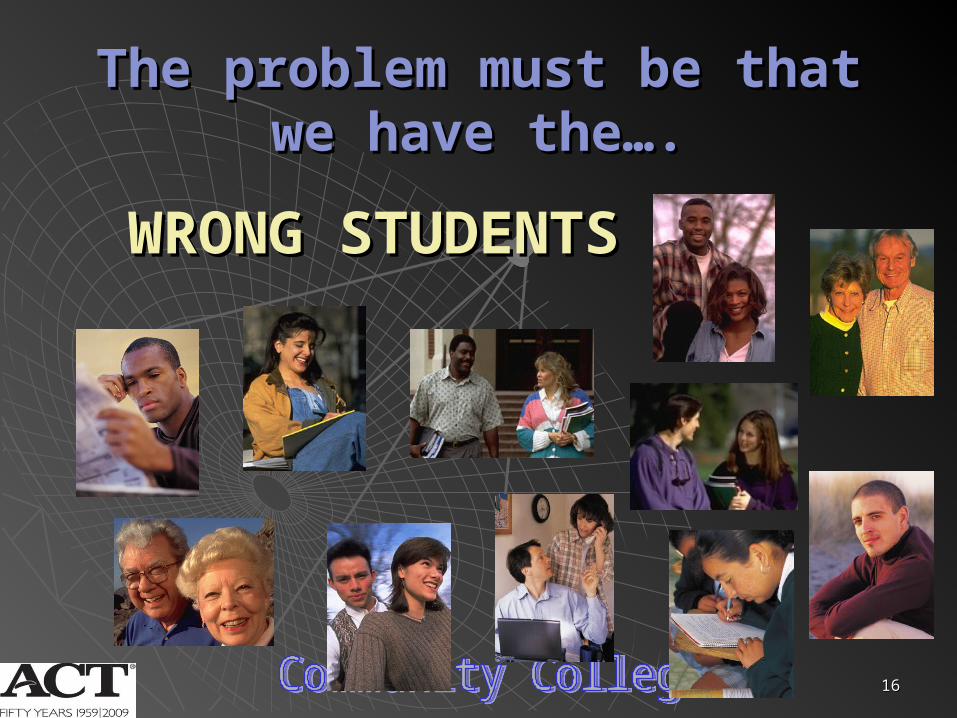
The problem must be that we The problem must be that we have the….have the….
WRONG STUDENTSWRONG STUDENTS
1717
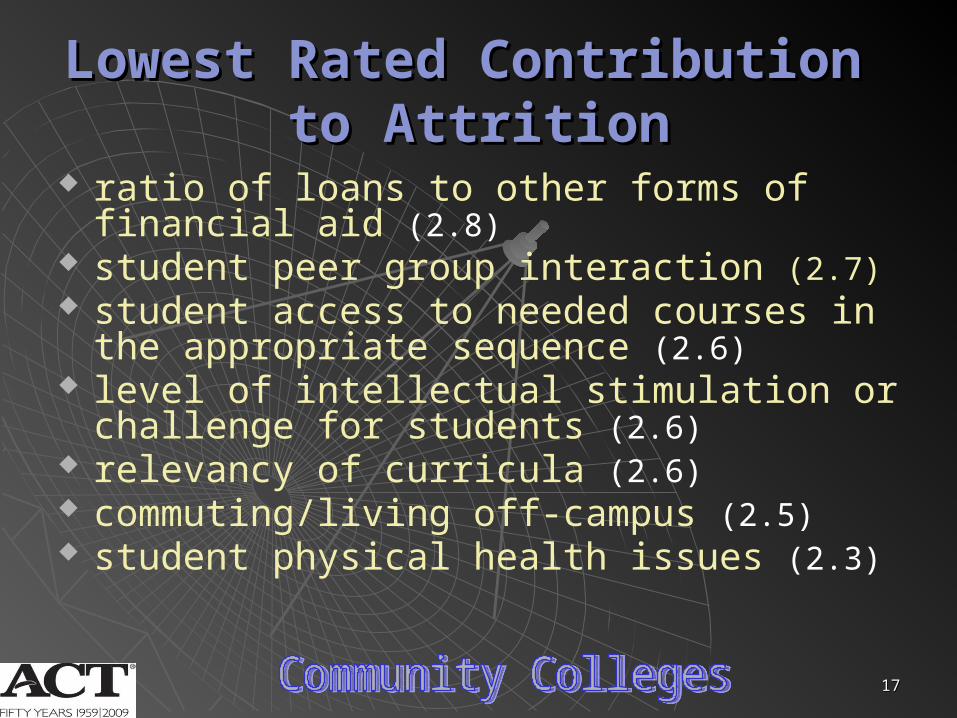
Lowest Rated Contribution Lowest Rated Contribution to Attritionto Attrition
ratio of loans to other forms of financial aid (2.8) student peer group interaction (2.7) student access to needed courses in the
appropriate sequence (2.6) level of intellectual stimulation or challenge for
students (2.6) relevancy of curricula (2.6) commuting/living off-campus (2.5) student physical health issues (2.3)
1818
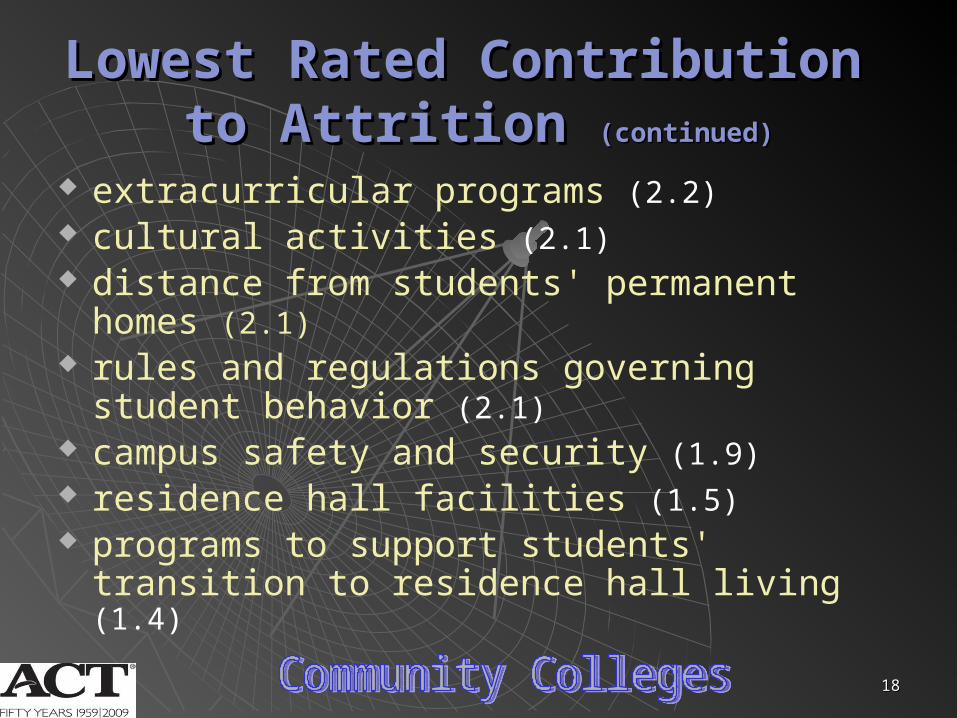
Lowest Rated Contribution Lowest Rated Contribution to Attrition to Attrition (continued)(continued)
extracurricular programs (2.2) cultural activities (2.1) distance from students' permanent homes (2.1) rules and regulations governing student
behavior (2.1) campus safety and security (1.9) residence hall facilities (1.5) programs to support students' transition to
residence hall living (1.4)
1919
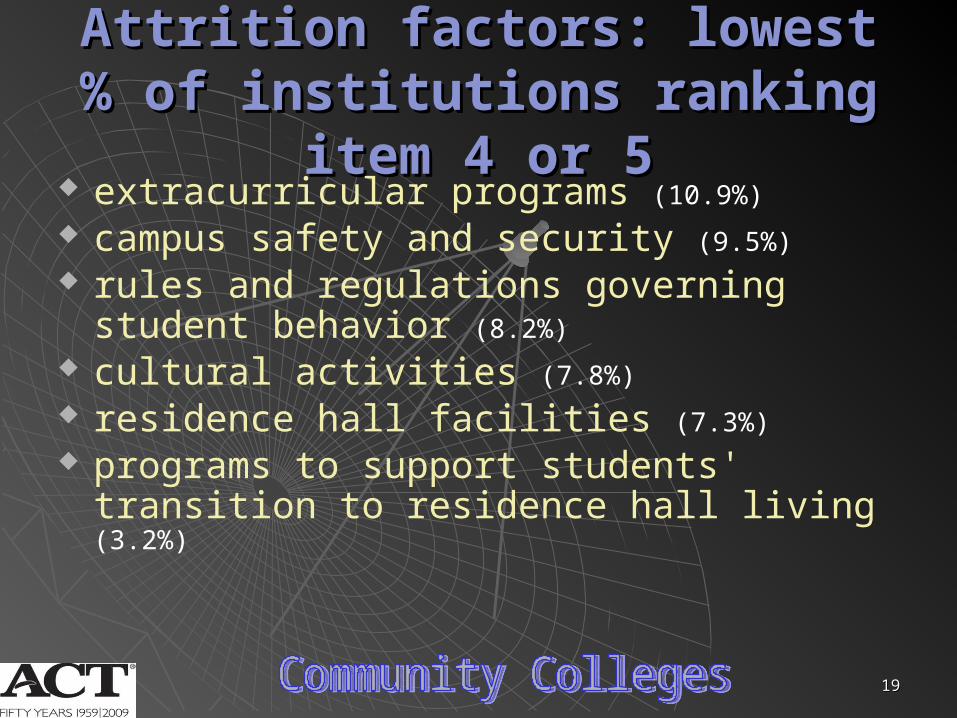
Attrition factors: lowest % of Attrition factors: lowest % of institutions ranking item 4 or 5institutions ranking item 4 or 5
extracurricular programs (10.9%)
campus safety and security (9.5%)
rules and regulations governing student behavior (8.2%)
cultural activities (7.8%)
residence hall facilities (7.3%)
programs to support students' transition to residence hall living (3.2%)
2020
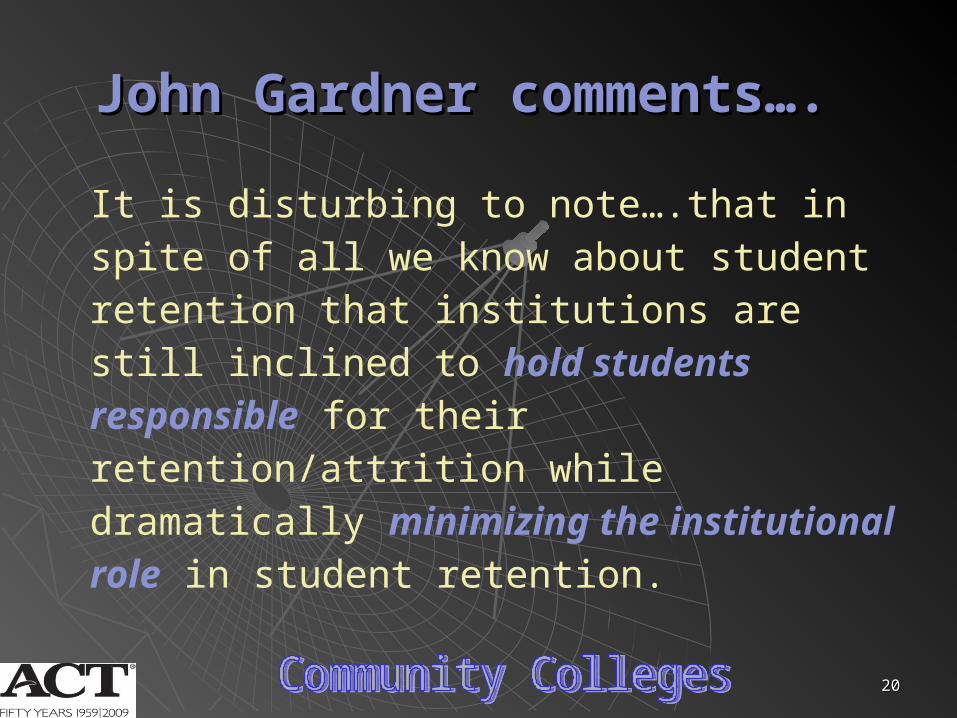
John Gardner comments….John Gardner comments….
It is disturbing to note….that in spite of all we know about student retention that institutions are still inclined to hold students responsible for their retention/attrition while dramatically minimizing the institutional role in student retention.

2121
2222
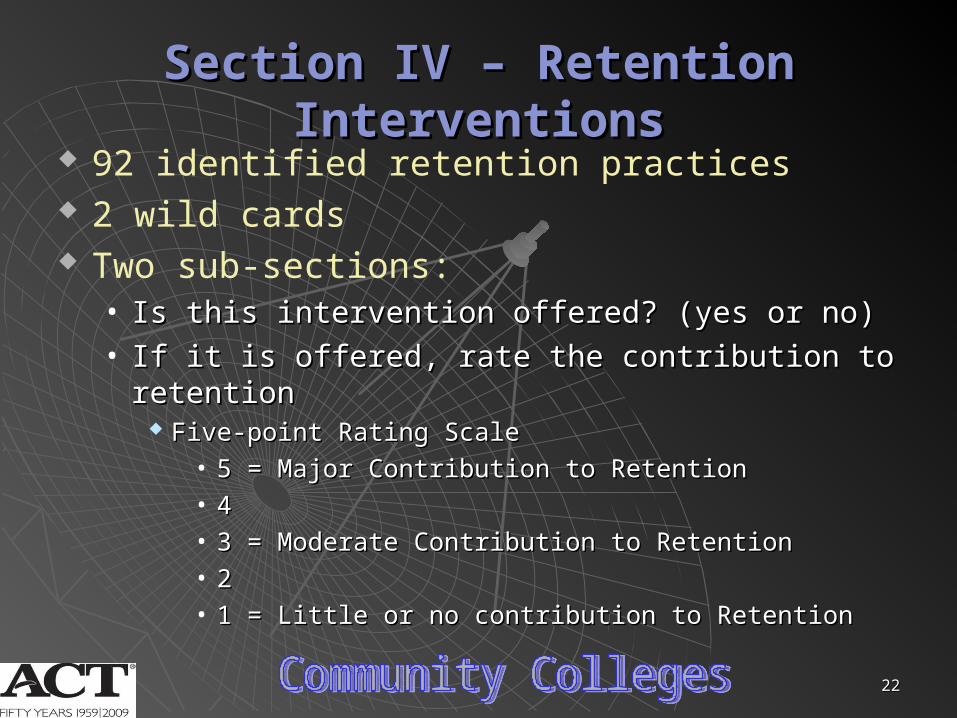
Section IV – Retention InterventionsSection IV – Retention Interventions 92 identified retention practices 2 wild cards Two sub-sections:
• Is this intervention offered? (yes or no)Is this intervention offered? (yes or no)• If it is offered, rate the contribution to retentionIf it is offered, rate the contribution to retention
Five-point Rating ScaleFive-point Rating Scale• 5 = Major Contribution to Retention5 = Major Contribution to Retention• 44• 3 = Moderate Contribution to Retention3 = Moderate Contribution to Retention• 22• 1 = Little or no contribution to Retention1 = Little or no contribution to Retention
2323
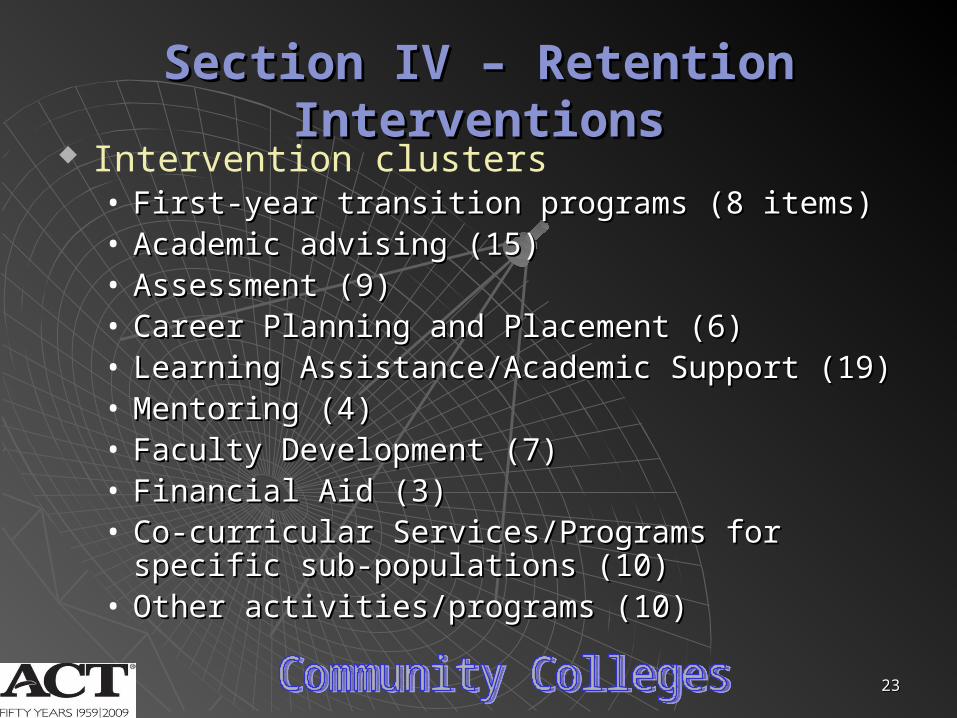
Section IV – Retention InterventionsSection IV – Retention Interventions Intervention clusters
• First-year transition programs (8 items)First-year transition programs (8 items)• Academic advising (15)Academic advising (15)• Assessment (9)Assessment (9)• Career Planning and Placement (6)Career Planning and Placement (6)• Learning Assistance/Academic Support (19)Learning Assistance/Academic Support (19)• Mentoring (4)Mentoring (4)• Faculty Development (7)Faculty Development (7)• Financial Aid (3)Financial Aid (3)• Co-curricular Services/Programs for specific sub-Co-curricular Services/Programs for specific sub-
populations (10)populations (10)• Other activities/programs (10)Other activities/programs (10)
2424
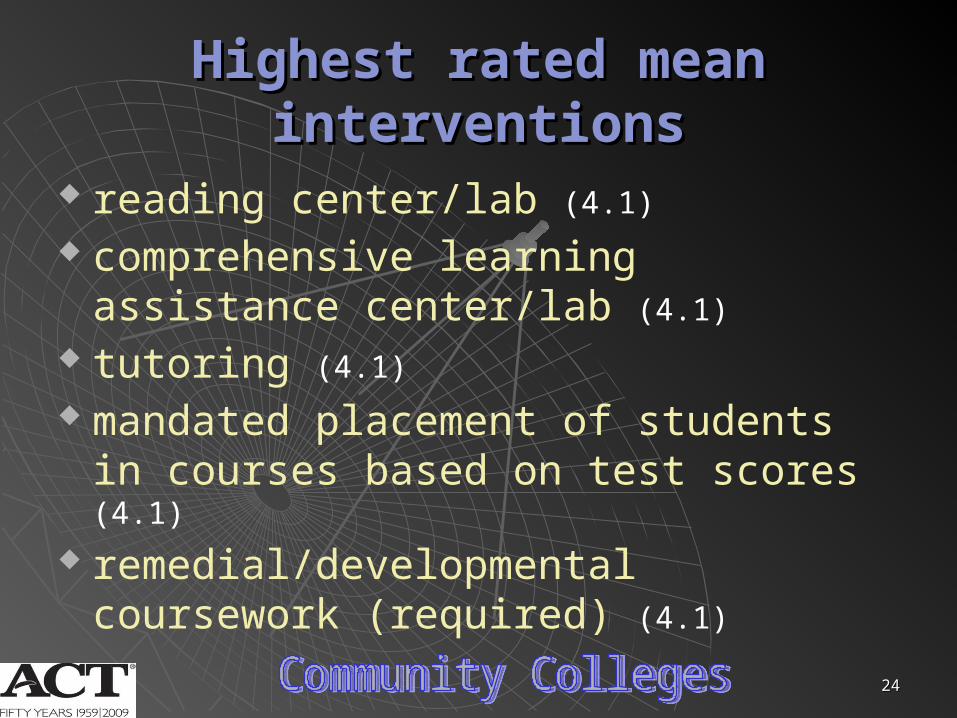
Highest rated mean interventionsHighest rated mean interventions
reading center/lab (4.1)
comprehensive learning assistance center/lab (4.1)
tutoring (4.1)
mandated placement of students in courses based on test scores (4.1)
remedial/developmental coursework (required) (4.1)
2525
Highest rated mean interventionsHighest rated mean interventions(continued)(continued)
increased number of academic advisors (4.0) writing center/lab (4.0) mathematics center/lab (4.0) first-generation students (4.0) advising interventions with selected student
populations (3.9) academic advising center (3.9)
2626
Lowest Rated Mean InterventionsLowest Rated Mean Interventions
fraternities/sororities (2.4)
recognition/rewards for non-faculty academic advisors (2.6)
recognition/rewards for faculty academic advisors (2.6)
degree guarantee program (2.8)
freshman interest groups (FIGS) (2.9)

2727
Lowest Rated Mean InterventionsLowest Rated Mean Interventions
enhanced/modified faculty reward system (3.0)
gay/lesbian/bisexual/transgender students (3.0)
health and wellness course/program (3.0)
residence hall programs (3.0)
2828
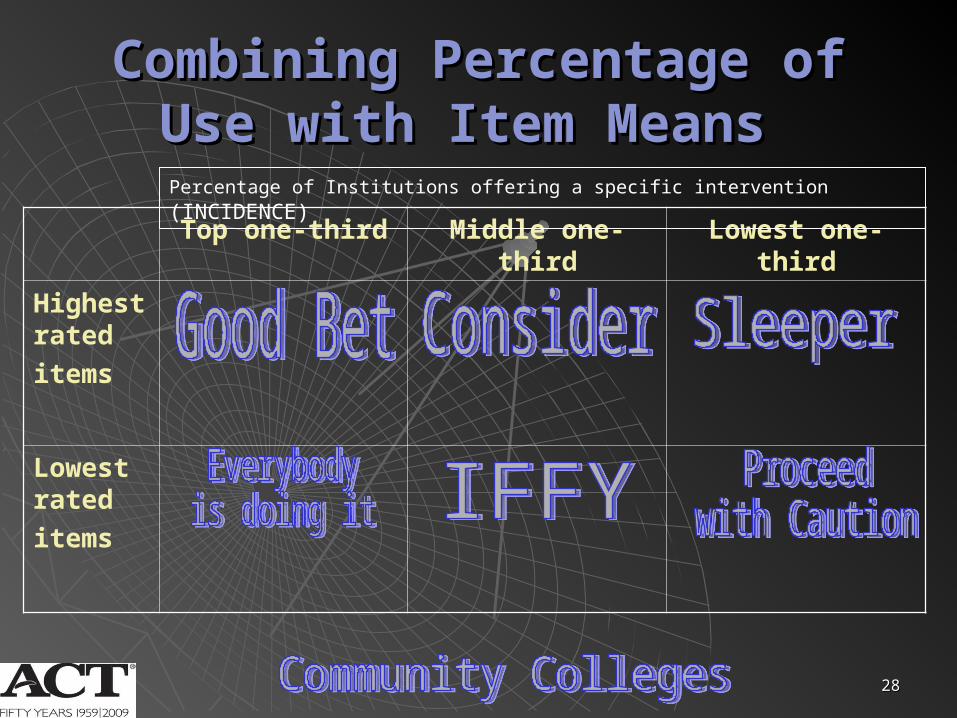
Combining Percentage of Use Combining Percentage of Use with Item Means with Item Means
Top one-third Middle one-third Lowest one-third
Highest rated
items
Lowest rated
items
Percentage of Institutions offering a specific intervention (INCIDENCE)
2929
This is not rocket science!This is not rocket science!

3030
GOOD BET: Highest ratings in top GOOD BET: Highest ratings in top third of usagethird of usage
comprehensive learning assistance center/lab (4.1) tutoring (4.1) mandated placement of students in courses based on
test scores (4.1) remedial/developmental coursework (required) (4.1) writing center/lab (4.0) mathematics center/lab (4.0) advising interventions with selected student populations
(3.9) academic advising center (3.9) supplemental instruction (3.8)
3131
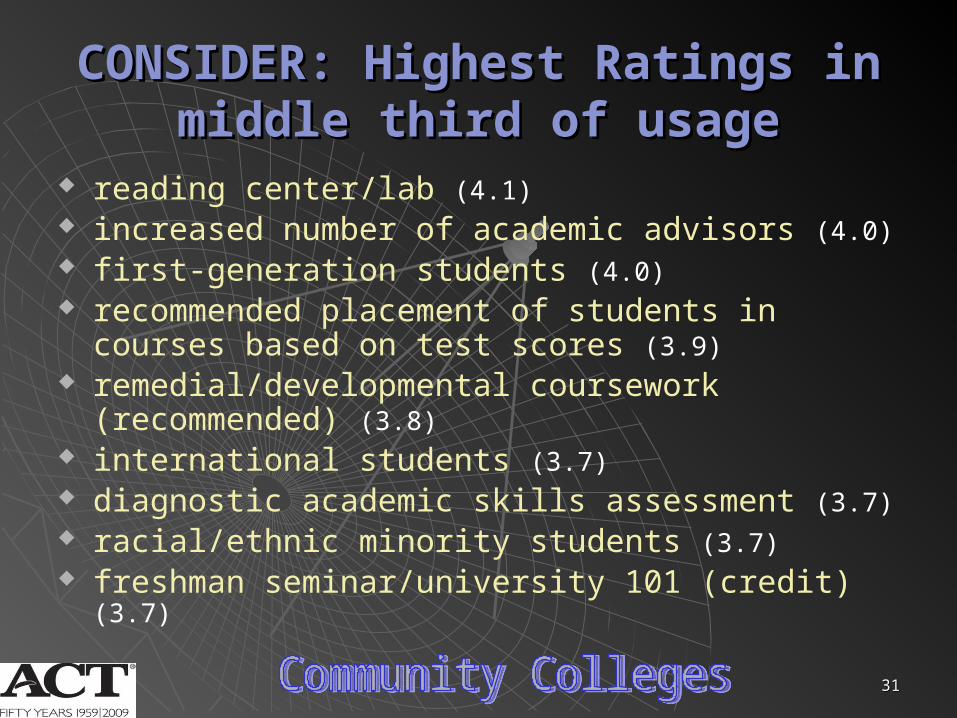
CONSIDER: Highest Ratings in CONSIDER: Highest Ratings in middle third of usagemiddle third of usage
reading center/lab (4.1) increased number of academic advisors (4.0) first-generation students (4.0) recommended placement of students in courses based
on test scores (3.9) remedial/developmental coursework (recommended)
(3.8) international students (3.7) diagnostic academic skills assessment (3.7) racial/ethnic minority students (3.7) freshman seminar/university 101 (credit) (3.7)
3232
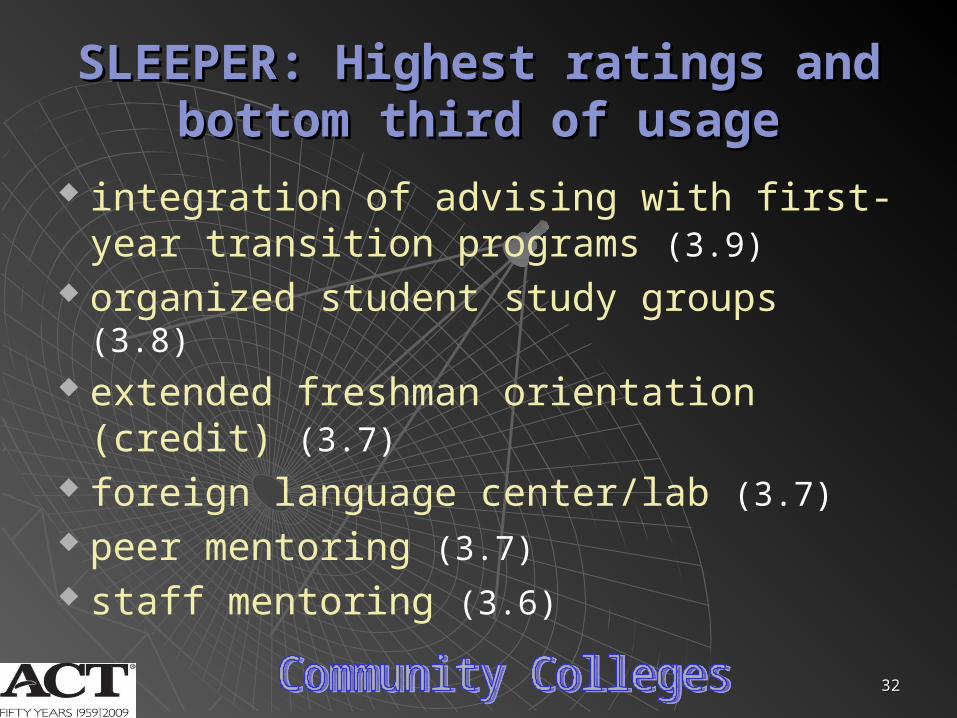
SLEEPER: Highest ratings and SLEEPER: Highest ratings and bottom third of usagebottom third of usage
integration of advising with first-year transition programs (3.9)
organized student study groups (3.8) extended freshman orientation (credit)
(3.7) foreign language center/lab (3.7) peer mentoring (3.7) staff mentoring (3.6)

3333
DATA - !%&#!DATA - !%&#!%*&&@!%*&&@!
BORING!BORING!

3434
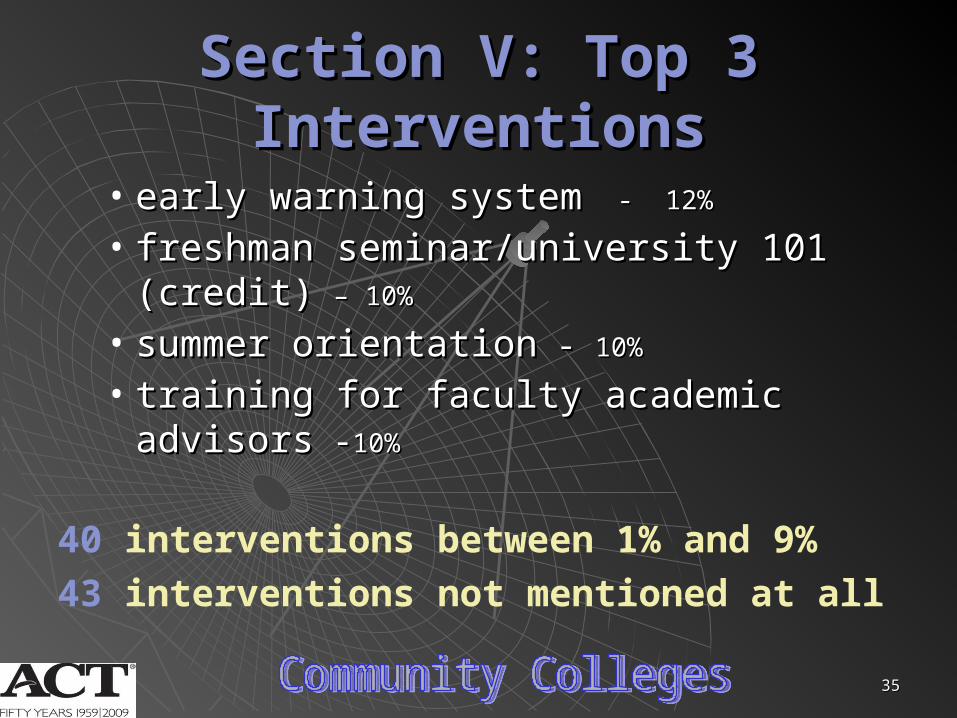
Section V: Top 3 InterventionsSection V: Top 3 Interventions
• mandated placement of students in courses based on test scores - 36%
• tutoring - 22%• remedial/developmental coursework
(required) - 20%• comprehensive learning assistance
center/lab 4%• academic advising center - 12%
3535
Section V: Top 3 InterventionsSection V: Top 3 Interventions
• early warning systemearly warning system - 12% - 12%
• freshman seminar/university 101 (credit)freshman seminar/university 101 (credit) – 10%– 10%
• summer orientationsummer orientation - - 10%10%
• training for faculty academic advisorstraining for faculty academic advisors - -10%10%
40 interventions between 1% and 9%
43 interventions not mentioned at all
3636
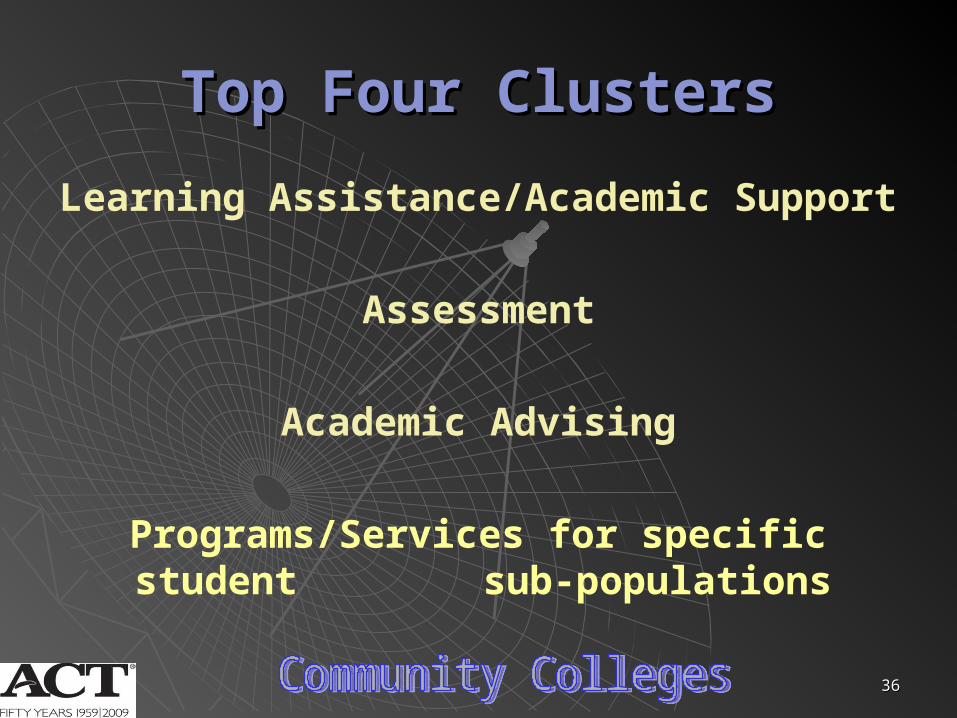
Top Four ClustersTop Four Clusters
Learning Assistance/Academic Support
Assessment
Academic Advising
Programs/Services for specific student sub-populations
3737
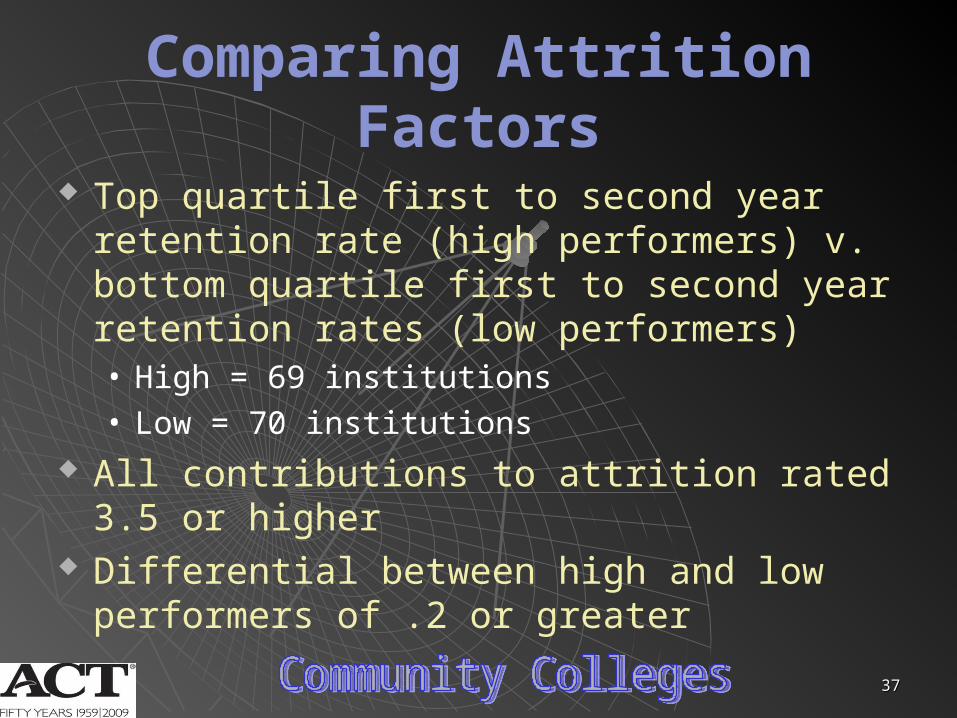
Comparing Attrition Factors
Top quartile first to second year retention rate (high performers) v. bottom quartile first to second year retention rates (low performers)• High = 69 institutions• Low = 70 institutions
All contributions to attrition rated 3.5 or higher Differential between high and low performers
of .2 or greater
3838
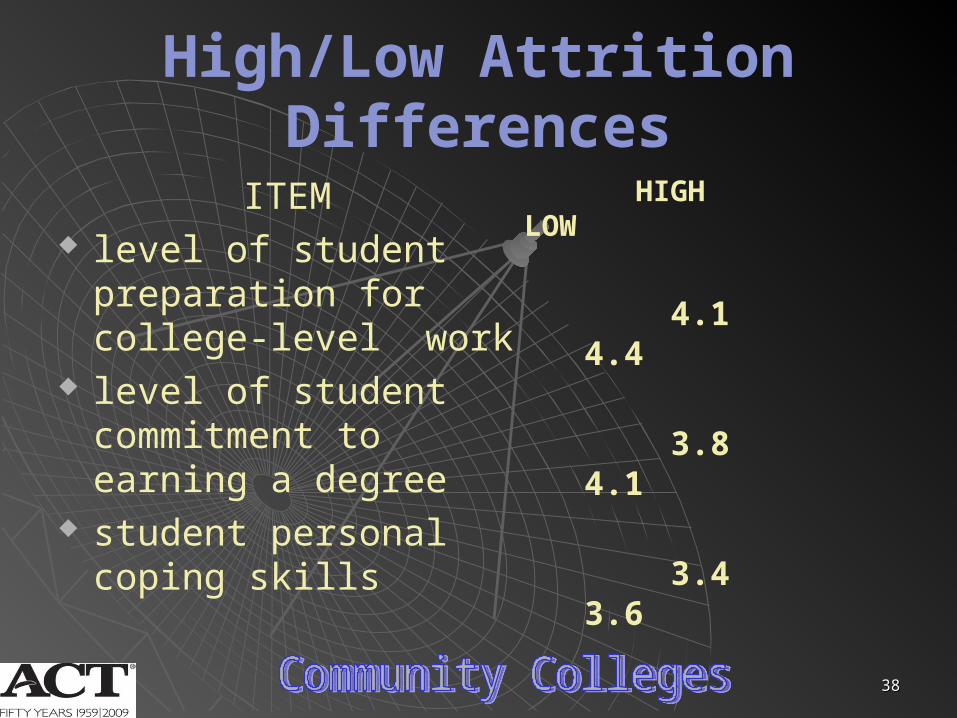
High/Low Attrition Differences
ITEM level of student
preparation for college-level work
level of student commitment to earning a degree
student personal coping skills
HIGH LOW
4.1 4.4
3.8 4.1
3.4 3.6

3939
Comparing Intervention Practices
Top quartile first to second year retention rate (high performers) v. bottom quartile first to second year retention rate (low performers)• High = 69 institutions• Low = 70 institutions
Included only items with a mean > 3.6 for all community colleges
High performer incidence rate > 10% above low performer incidence rate
4040
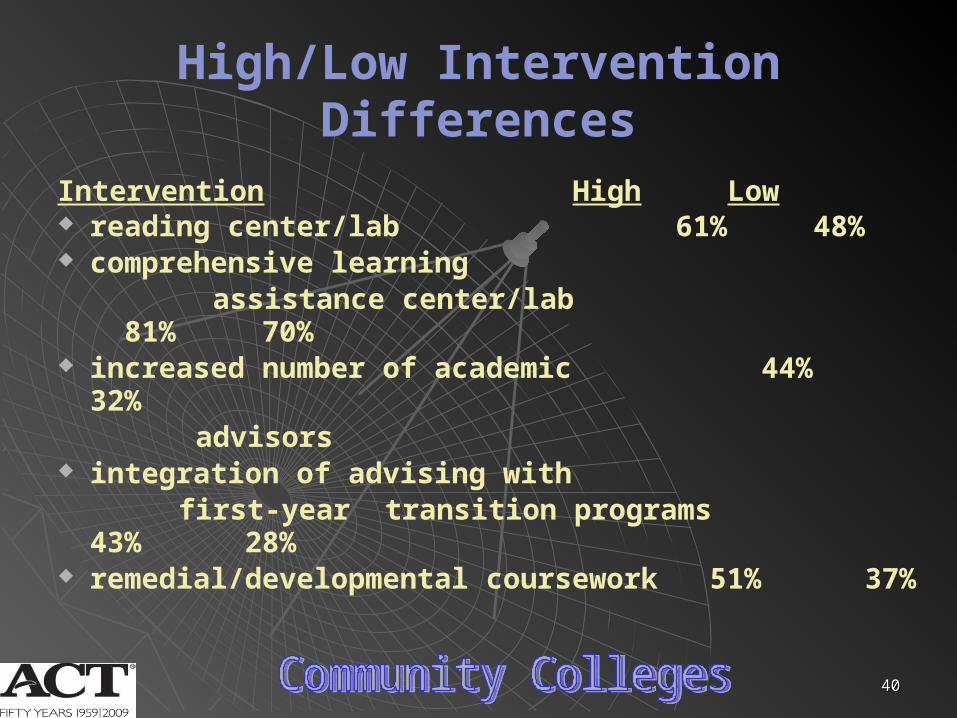
High/Low Intervention Differences
Intervention High Low reading center/lab 61% 48% comprehensive learning assistance center/lab 81% 70% increased number of academic 44% 32% advisors integration of advising with first-year transition programs 43% 28%
remedial/developmental coursework 51% 37%

4141
High/Low Intervention Differences
Intervention High Low pre-enrollment financial aid 93% 77% advising diagnostic academic skills 69% 41% assessment racial/ethnic minority students 63% 41% center(s) that integrates advising with career/life planning 61% 45% staff mentoring 29% 18%
4242
4343
What Works in What Works in Student Retention?Student Retention?
ACT’s Fourth National Survey
on College Retention