student retention: expanding the paradigm to focus on individual student success dr. wes habley...
TRANSCRIPT
Student Retention: Expanding The Paradigm To Focus On Individual Student
Success
Dr. Wes HableyAssistant Vice President, Strategic Partnerships
ACT, Inc.
President Obama 2020 Goal
• U.S. will return to first in the world in the proportion of 25-34 year-olds with some form of postsecondary education
• Requires H.S. graduation rate of 90% (current rate is 74.9%)
• We must double current undergraduate enrollment
• 8 million more individuals must complete postsecondary education
Lumina Foundation Goal
• Increase the percentage of Americans with high-quality degrees and credentials to 60 percent by the year 2025. (166,000/year) Current level: 39.9% Higher education attainment rates among
adults, first-generation, low-income and students of color are significantly lower than those of other students
Fastest growing segments of the US population are those least likely to complete high, enroll in college and earn certificates or degrees.
Topics
• Overview of WWISR surveys• Attrition Factors• Retention Interventions• Retention and Degree Completion Rates• Educational Attainment Rates• Expanding the Retention Paradigm
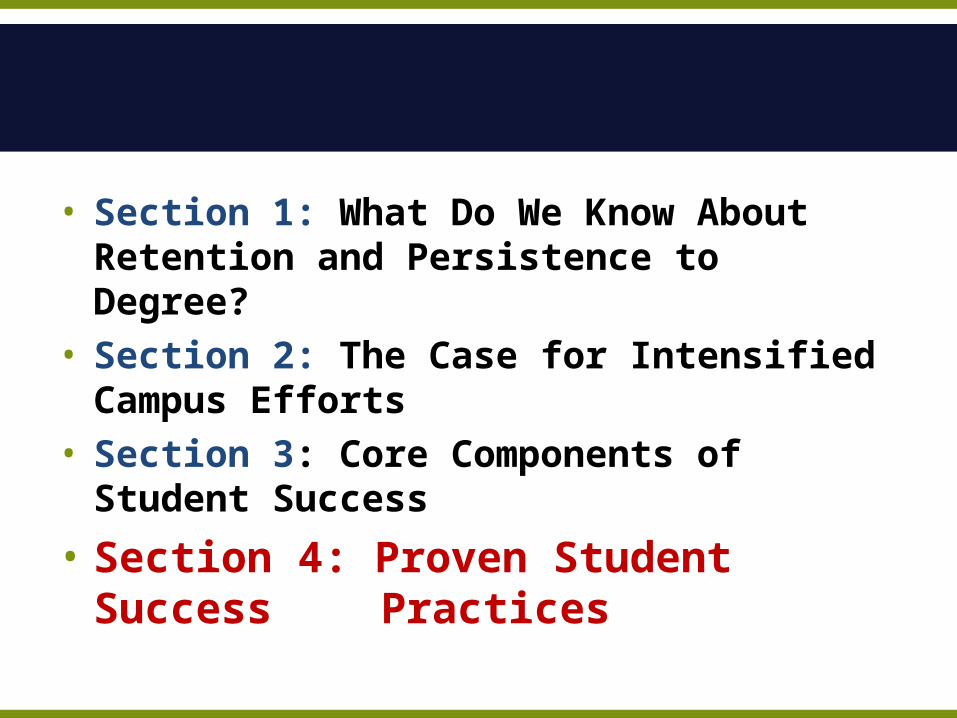
• Section 1: What Do We Know About Retention and Persistence to Degree?
• Section 2: The Case for Intensified Campus Efforts
• Section 3: Core Components of Student Success
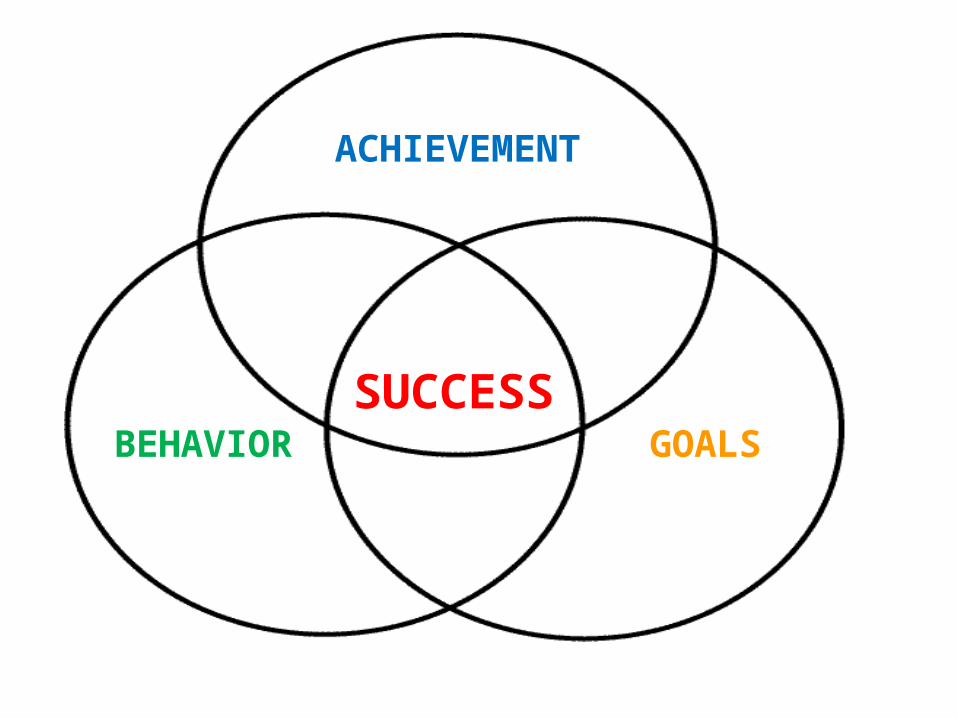
ACHIEVEMENT
BEHAVIOR GOALSSUCCESS
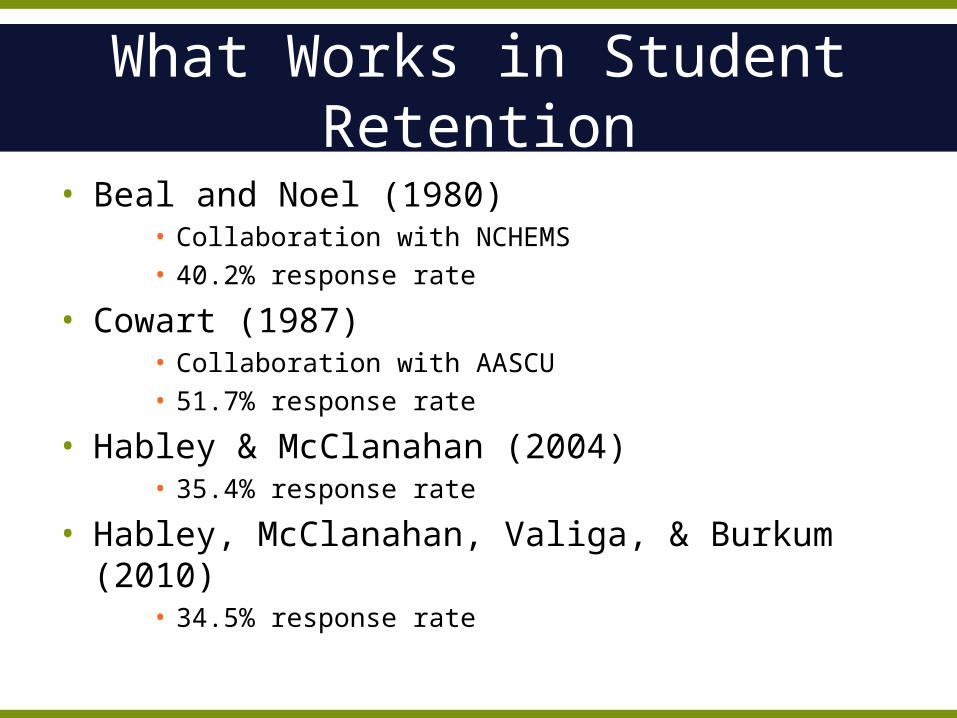
What Works in Student Retention
• Beal and Noel (1980)• Collaboration with NCHEMS• 40.2% response rate
• Cowart (1987)• Collaboration with AASCU• 51.7% response rate
• Habley & McClanahan (2004)• 35.4% response rate
• Habley, McClanahan, Valiga, & Burkum (2010)• 34.5% response rate
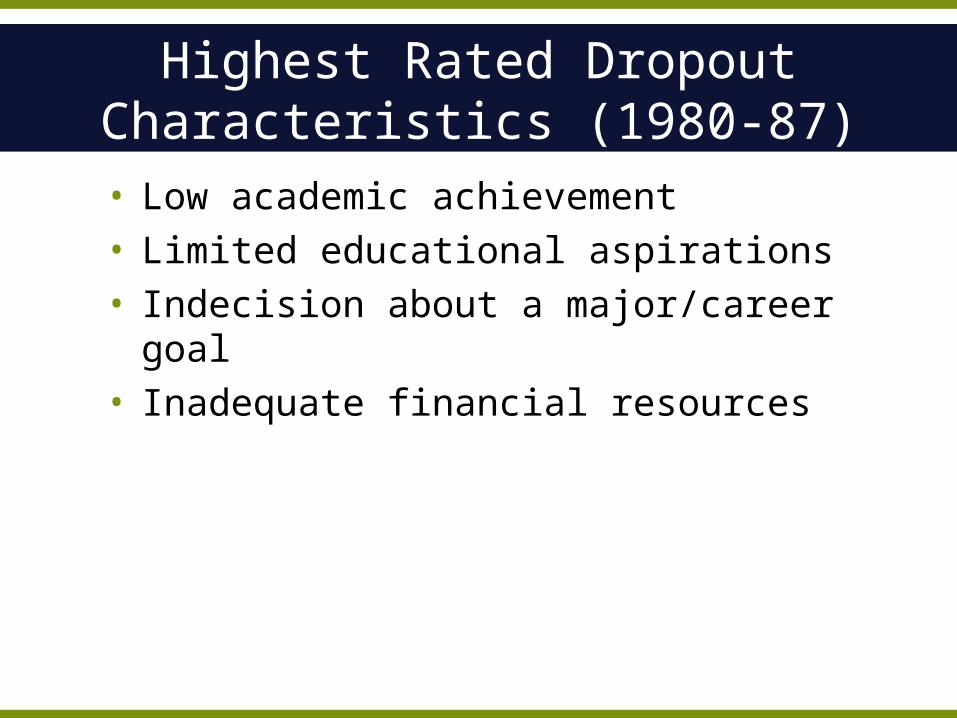
Highest Rated Dropout Characteristics (1980-87)
• Low academic achievement• Limited educational aspirations• Indecision about a major/career goal• Inadequate financial resources
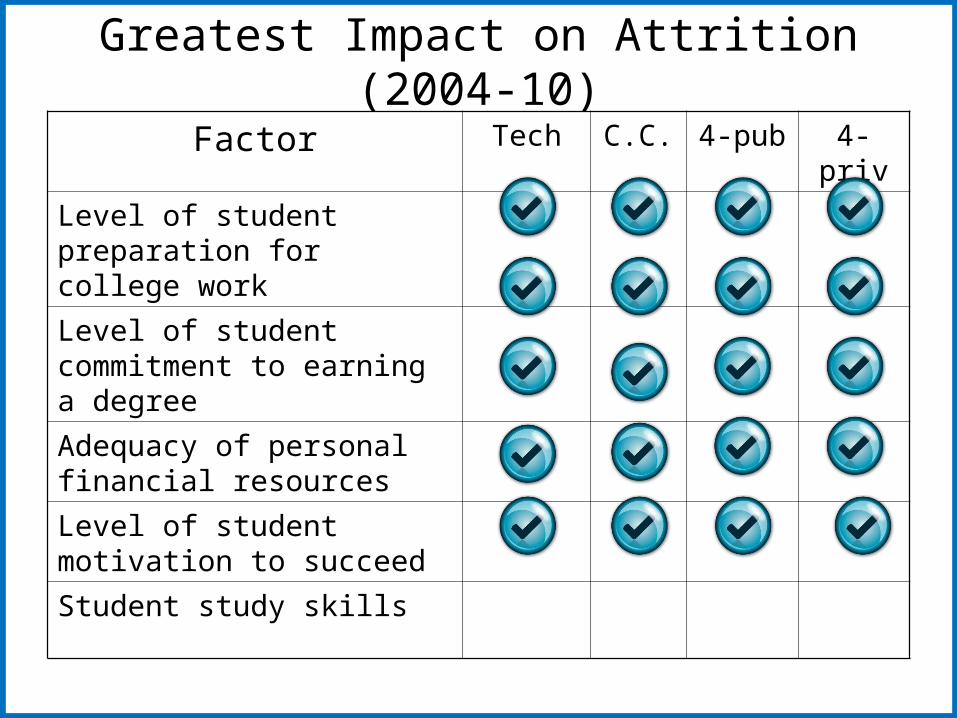
Greatest Impact on Attrition (2004-10)
Factor Tech C.C. 4-pub 4-priv
Level of student preparation for college work
Level of student commitment to earning a degree
Adequacy of personal financial resources
Level of student motivation to succeed
Student study skills
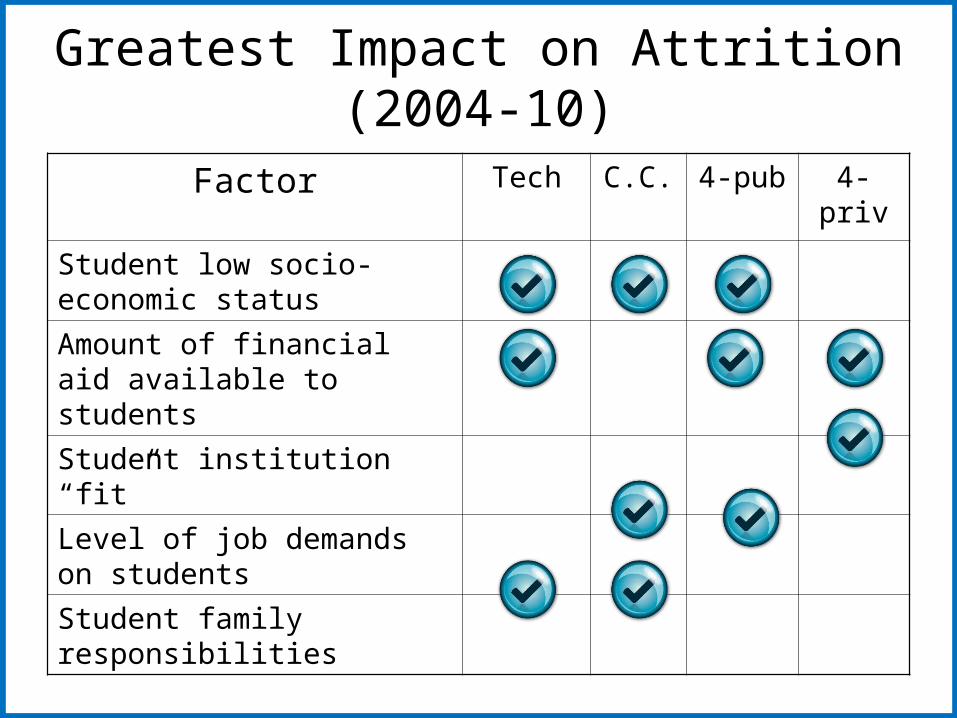
Greatest Impact on Attrition (2004-10)
Factor Tech C.C. 4-pub 4-priv
Student low socio-economic status
Amount of financial aid available to students
Student institution “fit”
Level of job demands on students
Student family responsibilities
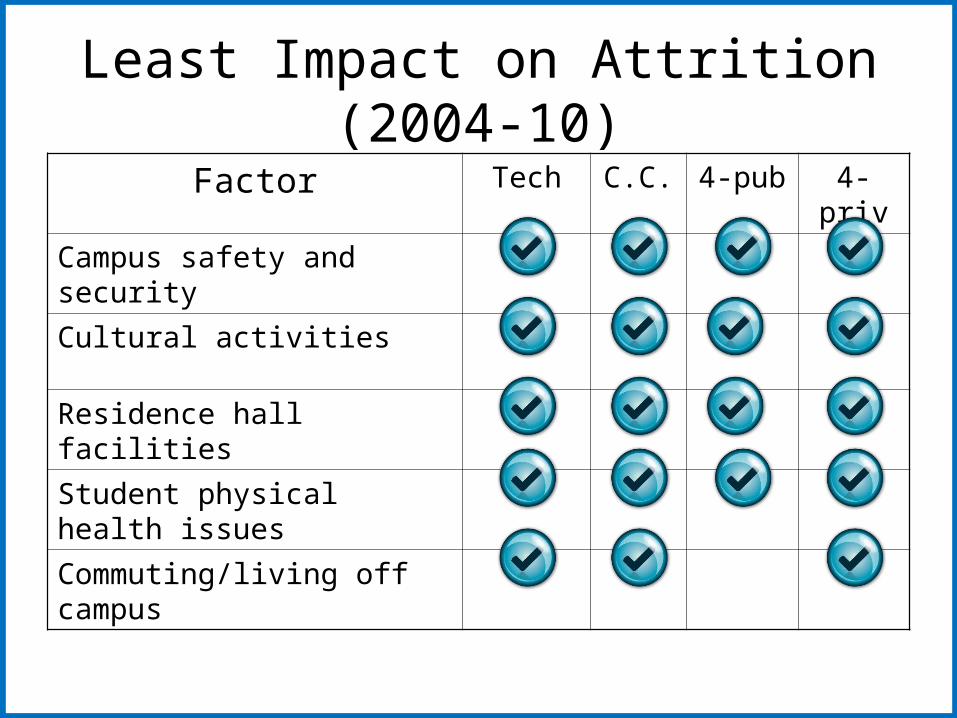
Least Impact on Attrition (2004-10)
Factor Tech C.C. 4-pub 4-priv
Campus safety and security
Cultural activities
Residence hall facilities
Student physical health issues
Commuting/living off campus
13
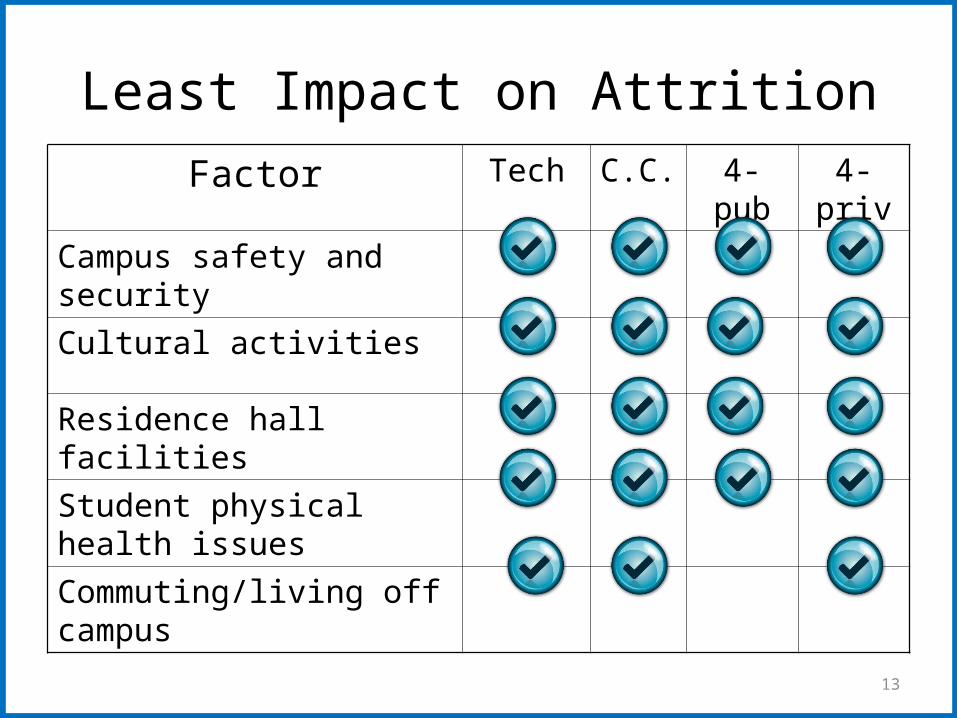
Least Impact on AttritionFactor Tech C.C. 4-pub 4-
priv
Campus safety and security
Cultural activities
Residence hall facilities
Student physical health issues
Commuting/living off campus
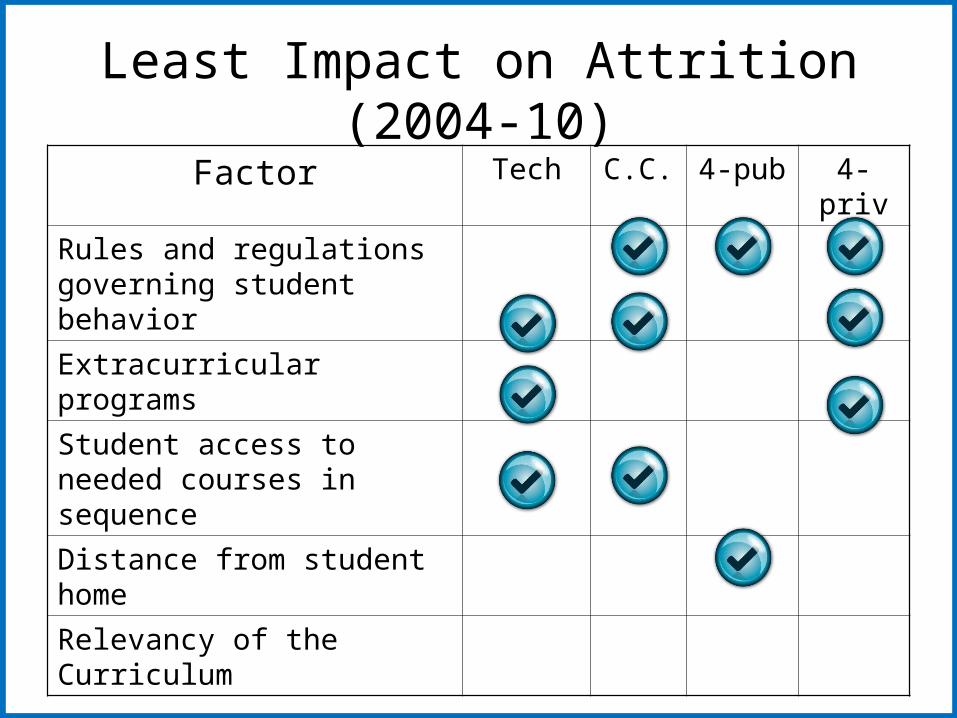
Least Impact on Attrition (2004-10)
Factor Tech C.C. 4-pub 4-priv
Rules and regulations governing student behavior
Extracurricular programs
Student access to needed courses in sequence
Distance from student home
Relevancy of the Curriculum
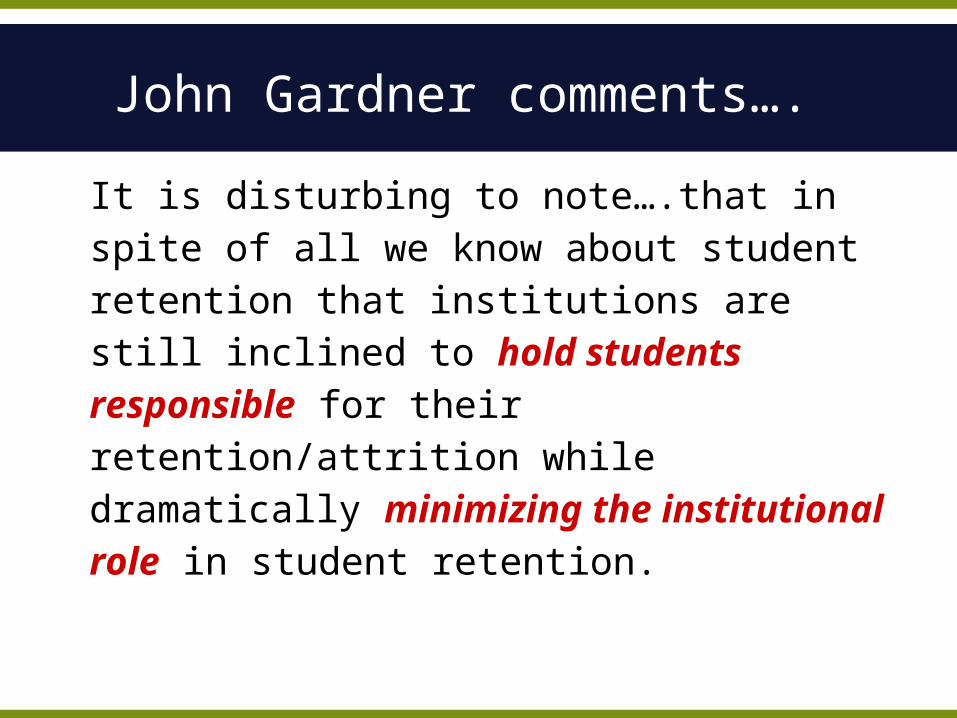
John Gardner comments….
It is disturbing to note….that in spite of all we know about student retention that institutions are still inclined to hold students responsible for their retention/attrition while dramatically minimizing the institutional role in student retention.
• Section 1: What Do We Know About Retention and Persistence to Degree?
• Section 2: The Case for Intensified Campus Efforts
• Section 3: Core Components of Student Success
• Section 4: Proven Student Success Practices
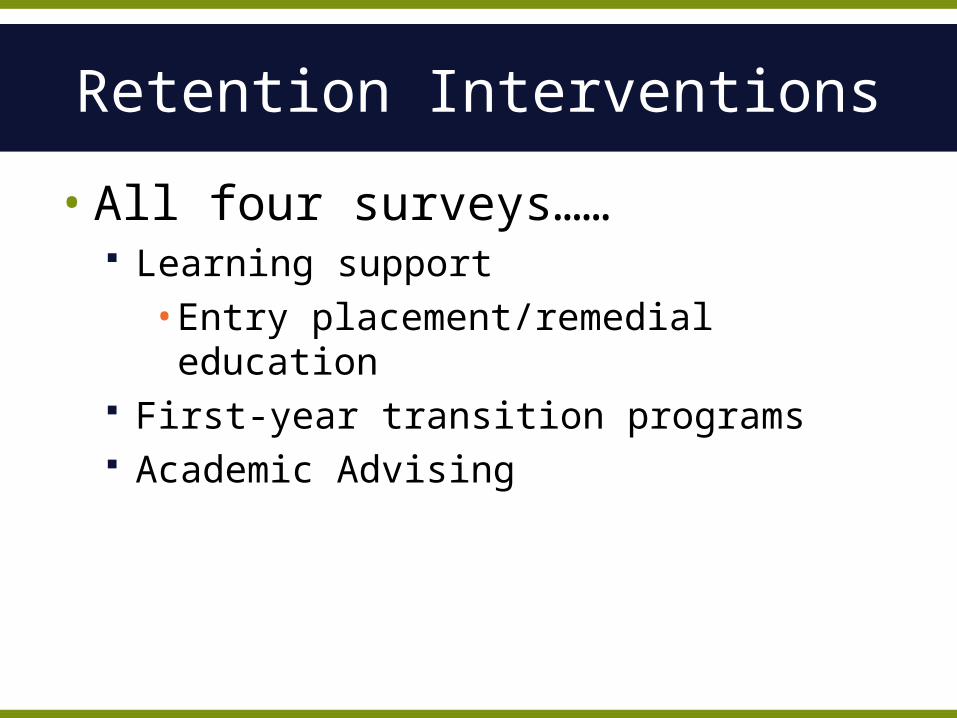
Retention Interventions
• All four surveys…… Learning support
• Entry placement/remedial education First-year transition programs Academic Advising

ACHIEVEMENT
BEHAVIOR GOALSSUCCESS
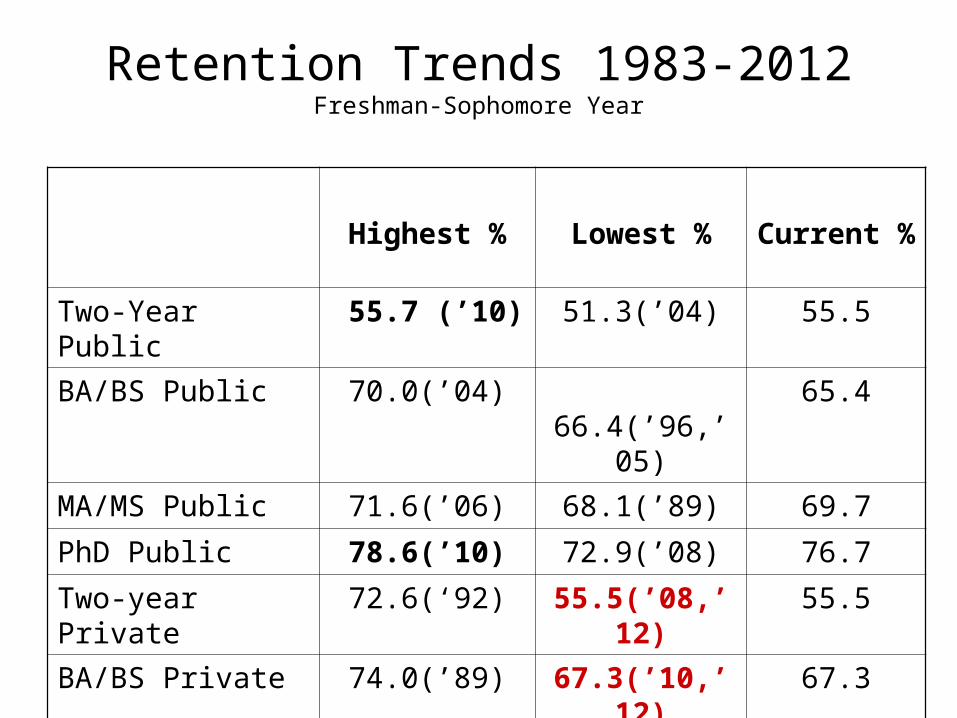
Retention Trends 1983-2012Freshman-Sophomore Year
Highest % Lowest % Current %
Two-Year Public 55.7 (’10) 51.3(’04) 55.5
BA/BS Public 70.0(’04) 66.4(’96,’05) 65.4
MA/MS Public 71.6(’06) 68.1(’89) 69.7
PhD Public 78.6(’10) 72.9(’08) 76.7
Two-year Private 72.6(‘92) 55.5(’08,’12) 55.5
BA/BS Private 74.0(’89) 67.3(’10,’12) 67.3
MA/MS Private 78.0(’85) 70.3(’10,’12) 70.3
PhD Private 85.0(’85) 80.2(‘12) 80.2
ALL 66.5
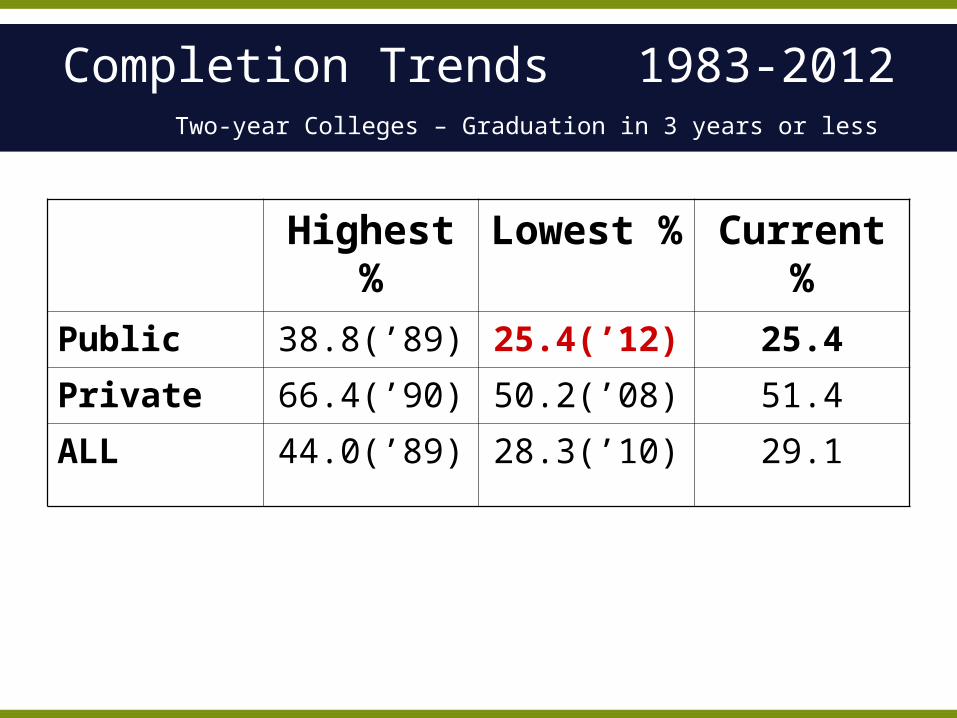
Completion Trends 1983-2012Two-year Colleges – Graduation in 3 years or less
Highest % Lowest % Current %
Public 38.8(’89) 25.4(’12) 25.4
Private 66.4(’90) 50.2(’08) 51.4
ALL 44.0(’89) 28.3(’10) 29.1
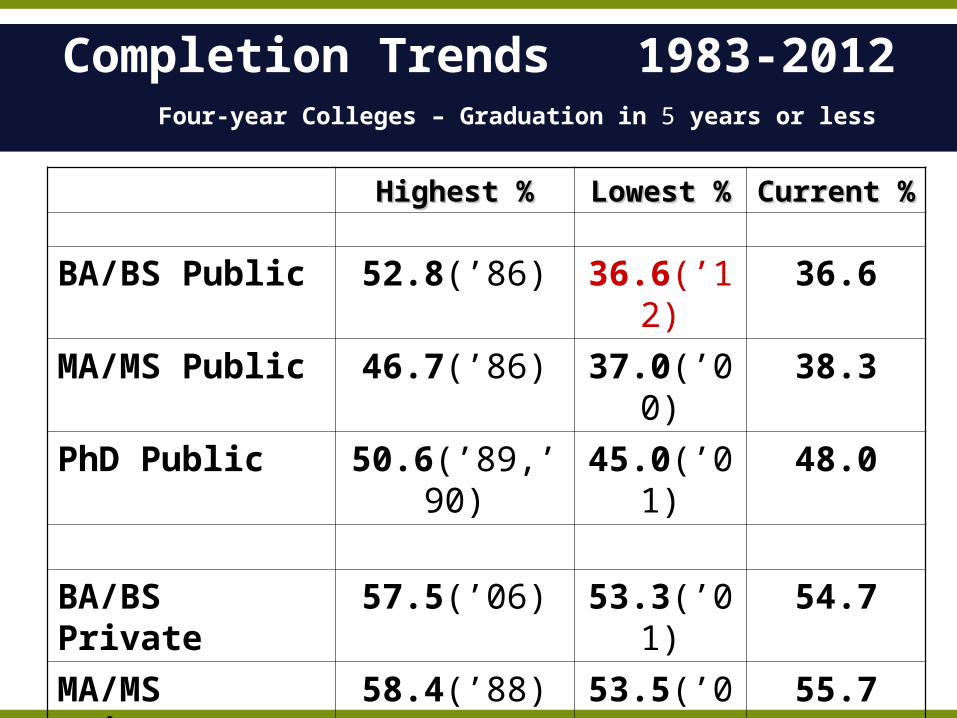
Highest %Highest % Lowest %Lowest % Current %Current %
BA/BS Public 52.8(’86) 36.6(’12) 36.6
MA/MS Public 46.7(’86) 37.0(’00) 38.3
PhD Public 50.6(’89,’90) 45.0(’01) 48.0
BA/BS Private 57.5(’06) 53.3(’01) 54.7
MA/MS Private 58.4(’88) 53.5(’01) 55.7
PhD Private 68.8(’86) 62.9(‘12) 62.9
Completion Trends 1983-2012Four-year Colleges – Graduation in 5 years or less
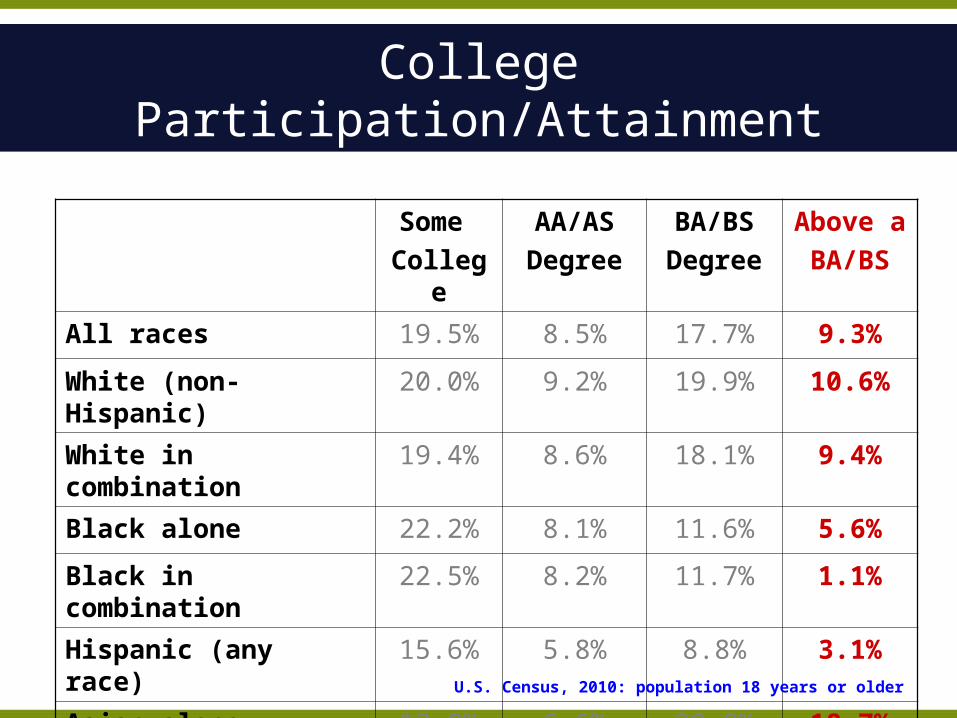
College Participation/Attainment
Some
College
AA/AS
Degree
BA/BS
Degree
Above a
BA/BS
All races 19.5% 8.5% 17.7% 9.3%
White (non-Hispanic) 20.0% 9.2% 19.9% 10.6%
White in combination 19.4% 8.6% 18.1% 9.4%
Black alone 22.2% 8.1% 11.6% 5.6%
Black in combination 22.5% 8.2% 11.7% 1.1%
Hispanic (any race) 15.6% 5.8% 8.8% 3.1%
Asian alone 13.9% 6.6% 29.8% 18.7%
Asian in combination 14.6% 6.7% 29.5% 18.2%
U.S. Census, 2010: population 18 years or older
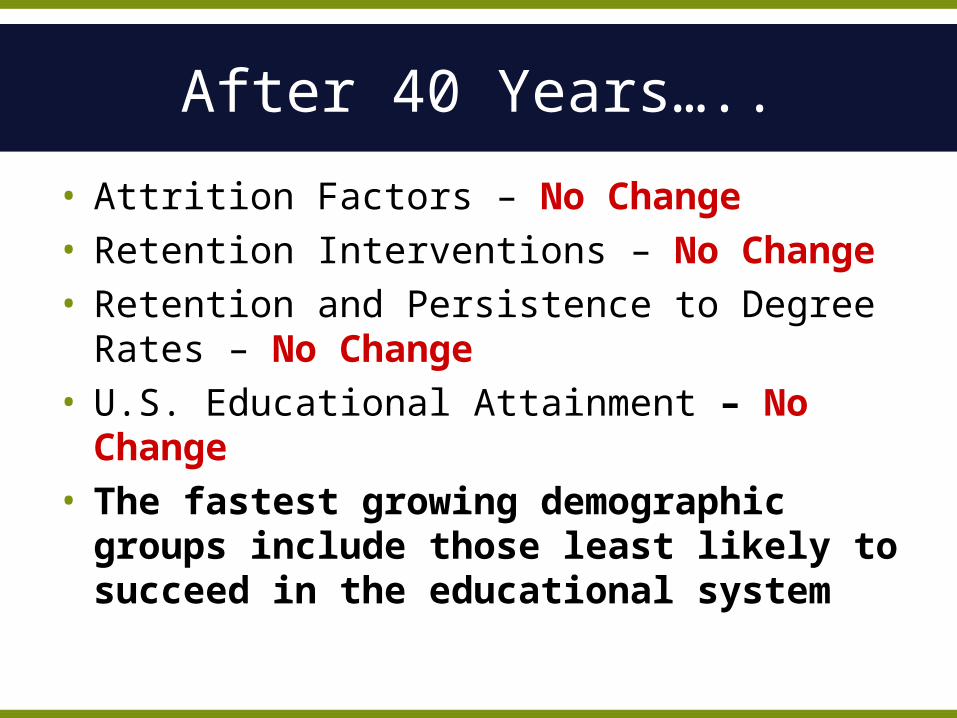
After 40 Years…..
• Attrition Factors – No Change• Retention Interventions – No Change• Retention and Persistence to Degree Rates
– No Change• U.S. Educational Attainment – No Change• The fastest growing demographic
groups include those least likely to succeed in the educational system
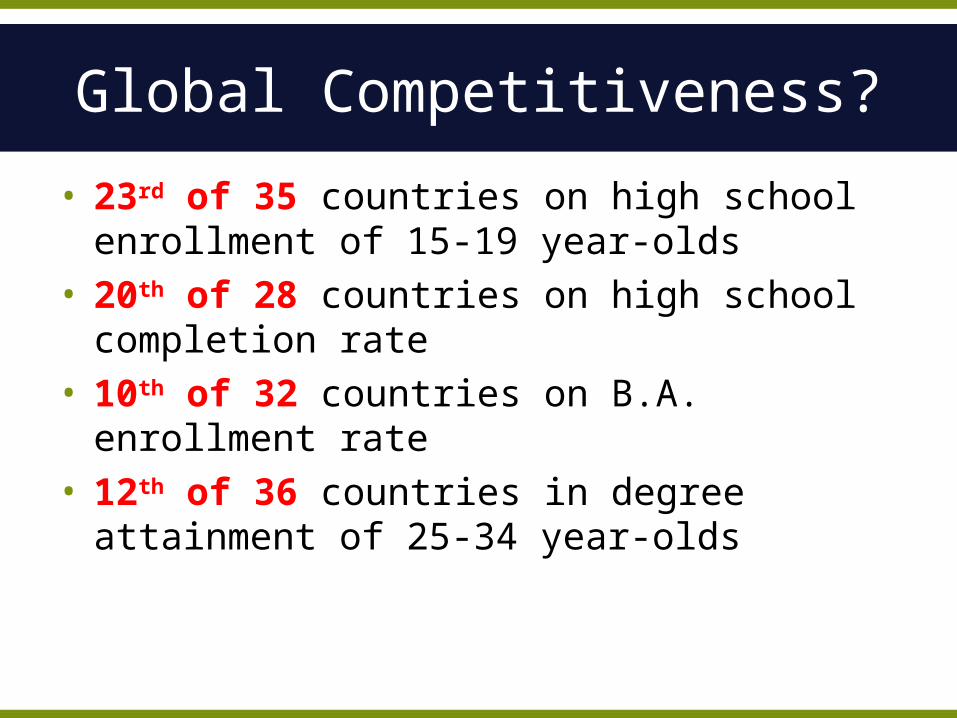
Global Competitiveness?
• 23rd of 35 countries on high school enrollment of 15-19 year-olds
• 20th of 28 countries on high school completion rate
• 10th of 32 countries on B.A. enrollment rate
• 12th of 36 countries in degree attainment of 25-34 year-olds

Lumina Foundation Goal?
Obama Goal?
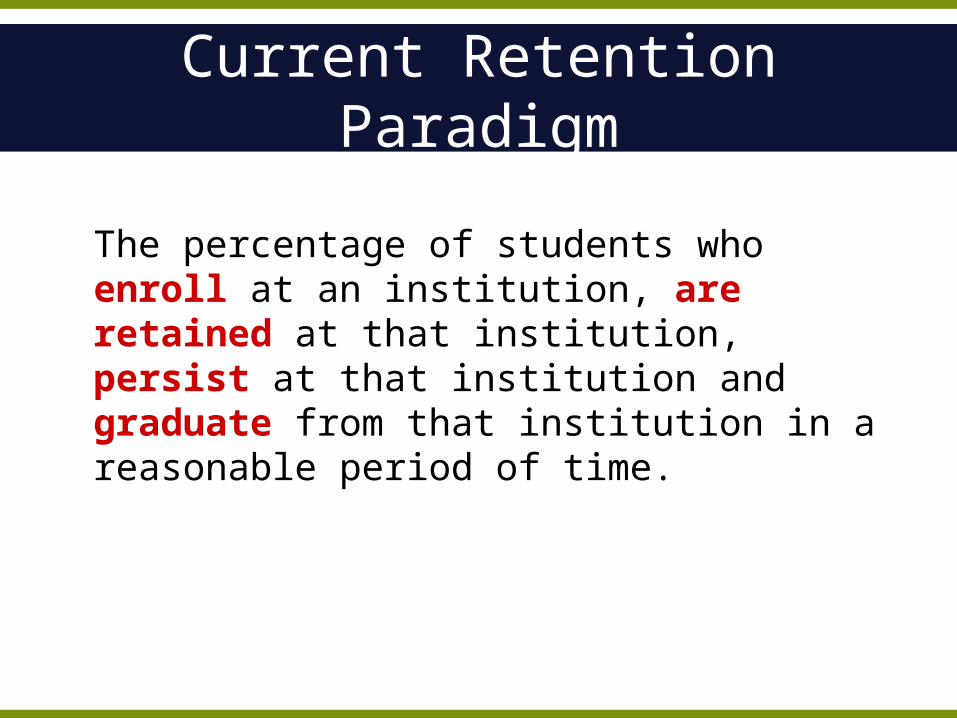
Current Retention Paradigm
The percentage of students who enroll at an institution, are retained at that institution, persist at that institution and graduate from that institution in a reasonable period of time.
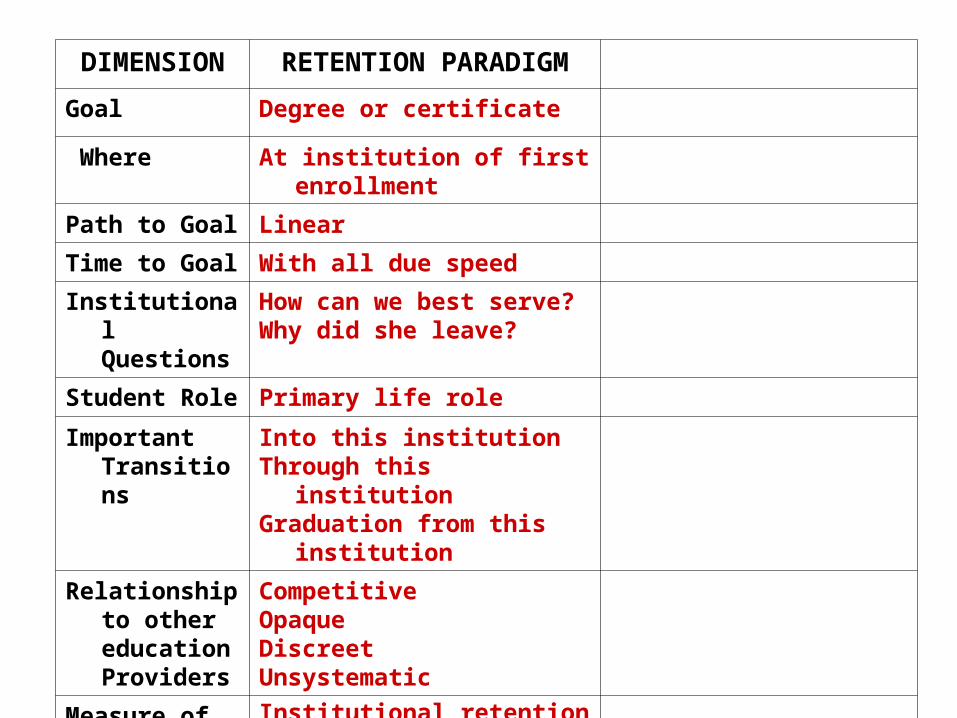
DIMENSION RETENTION PARADIGM
Goal Degree or certificate
Where At institution of first enrollment
Path to Goal Linear
Time to Goal With all due speed
Institutional Questions
How can we best serve?Why did she leave?
Student Role Primary life role
Important Transitions
Into this institutionThrough this institutionGraduation from this institution
Relationship to other education Providers
Competitive OpaqueDiscreetUnsystematic
Measure of Effectiveness
Institutional retention rateInstitutional degree completion
rate
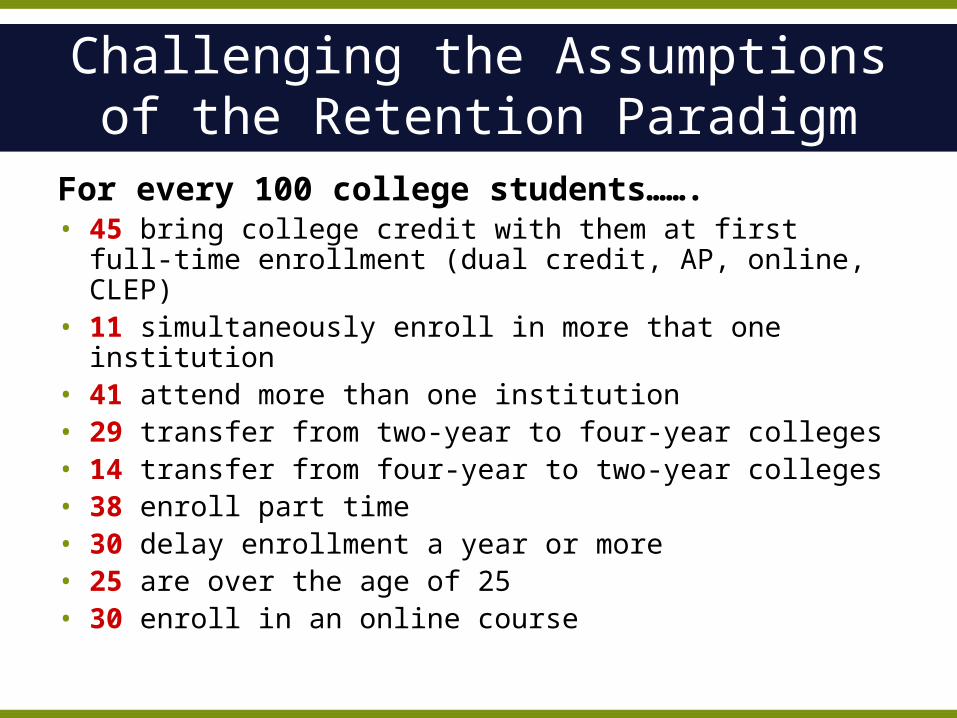
Challenging the Assumptions of the Retention Paradigm
For every 100 college students…….• 45 bring college credit with them at first full-time
enrollment (dual credit, AP, online, CLEP)• 11 simultaneously enroll in more that one
institution• 41 attend more than one institution• 29 transfer from two-year to four-year colleges• 14 transfer from four-year to two-year colleges• 38 enroll part time• 30 delay enrollment a year or more• 25 are over the age of 25• 30 enroll in an online course

Reality cover
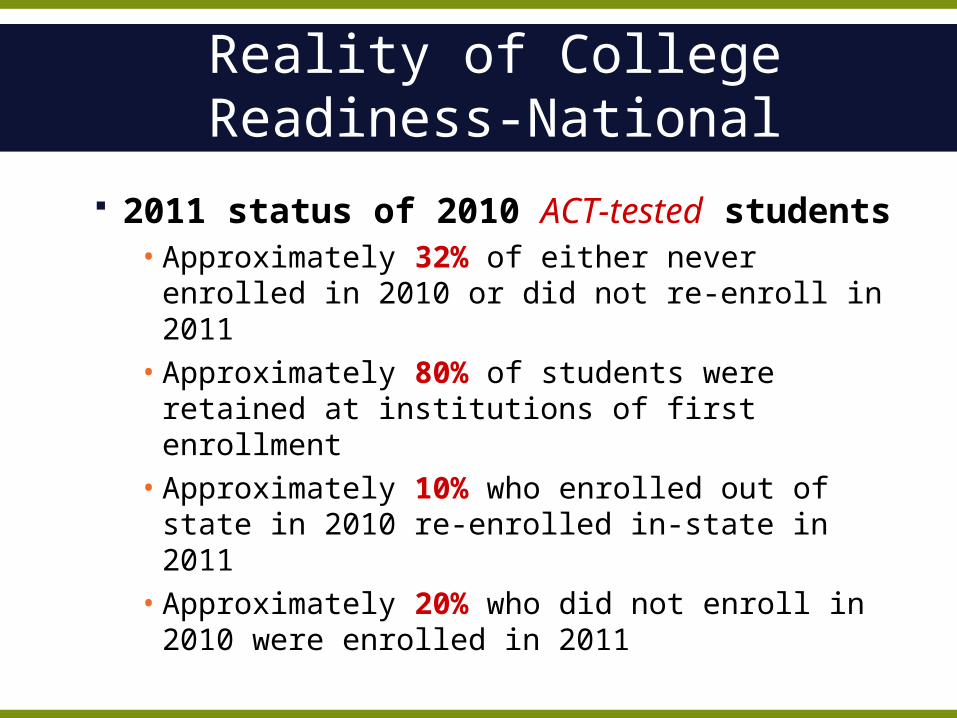
Reality of College Readiness-National
2011 status of 2010 ACT-tested students
• Approximately 32% of either never enrolled in 2010 or did not re-enroll in 2011
• Approximately 80% of students were retained at institutions of first enrollment
• Approximately 10% who enrolled out of state in 2010 re-enrolled in-state in 2011
• Approximately 20% who did not enroll in 2010 were enrolled in 2011
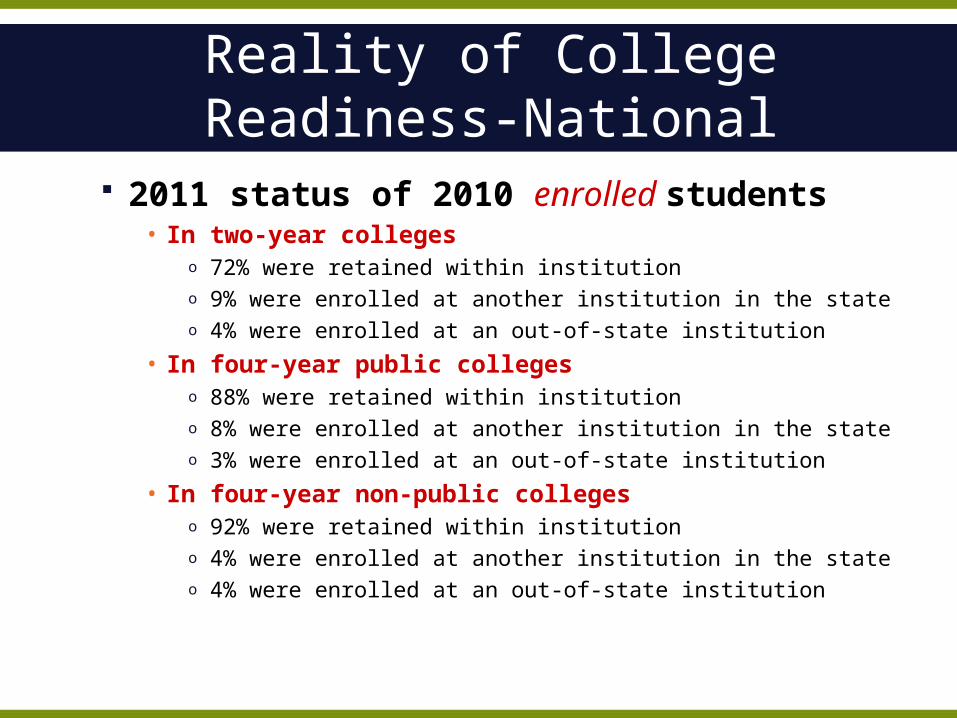
Reality of College Readiness-National
2011 status of 2010 enrolled students
• In two-year collegeso 72% were retained within institutiono 9% were enrolled at another institution in the stateo 4% were enrolled at an out-of-state institution
• In four-year public collegeso 88% were retained within institutiono 8% were enrolled at another institution in the stateo 3% were enrolled at an out-of-state institution
• In four-year non-public collegeso 92% were retained within institutiono 4% were enrolled at another institution in the stateo 4% were enrolled at an out-of-state institution
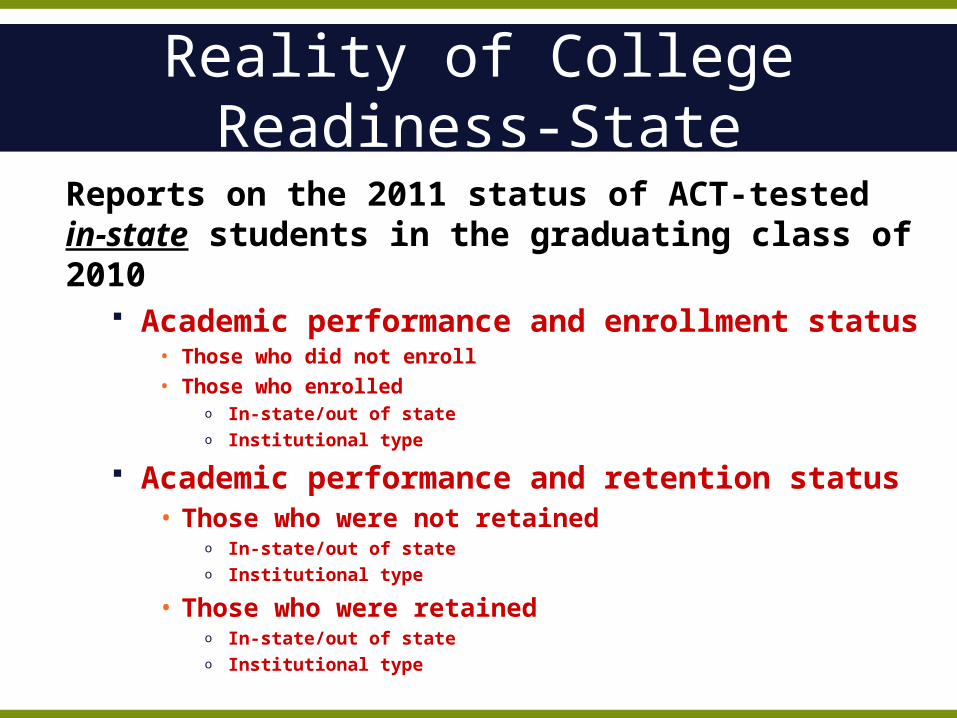
Reality of College Readiness-State
Reports on the 2011 status of ACT-tested in-state students in the graduating class of 2010
Academic performance and enrollment status
• Those who did not enroll• Those who enrolled
o In-state/out of stateo Institutional type
Academic performance and retention status• Those who were not retained
o In-state/out of stateo Institutional type
• Those who were retainedo In-state/out of stateo Institutional type
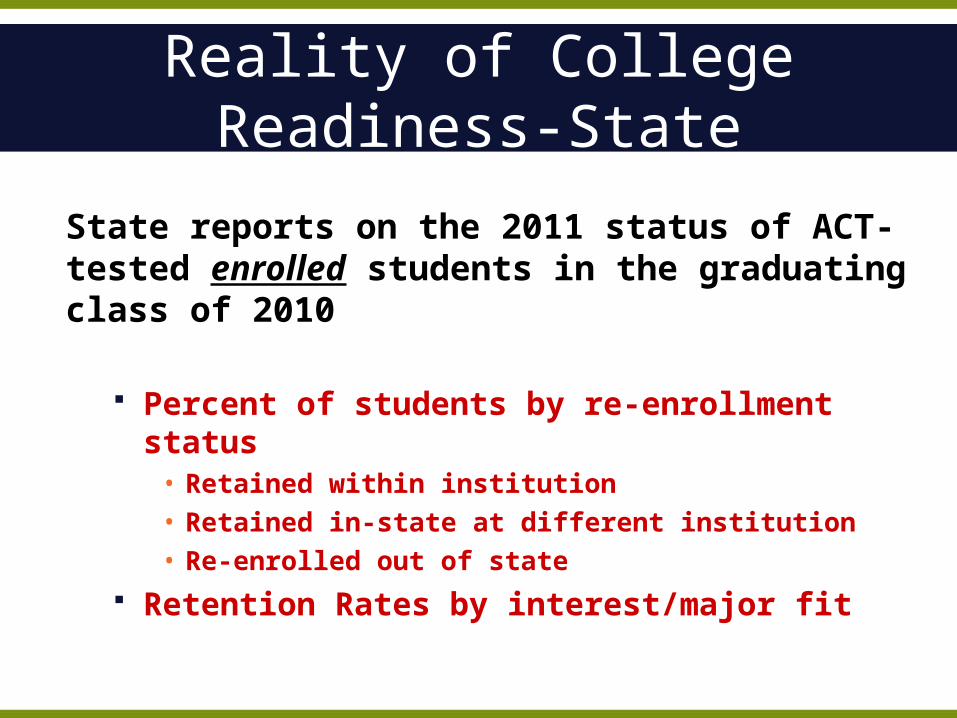
Reality of College Readiness-State
State reports on the 2011 status of ACT-tested enrolled students in the graduating class of 2010
Percent of students by re-enrollment status
• Retained within institution• Retained in-state at different institution• Re-enrolled out of state
Retention Rates by interest/major fit
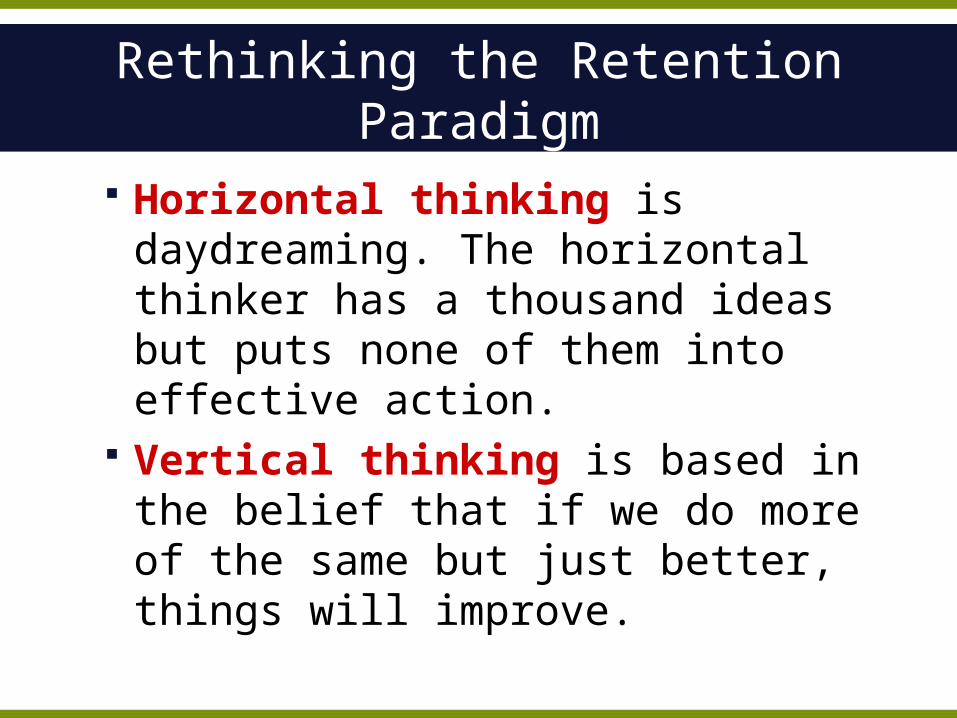
Rethinking the Retention Paradigm
Horizontal thinking is daydreaming. The horizontal thinker has a thousand ideas but puts none of them into effective action.
Vertical thinking is based in the belief that if we do more of the same but just better, things will improve.
Rethinking the Retention Paradigm
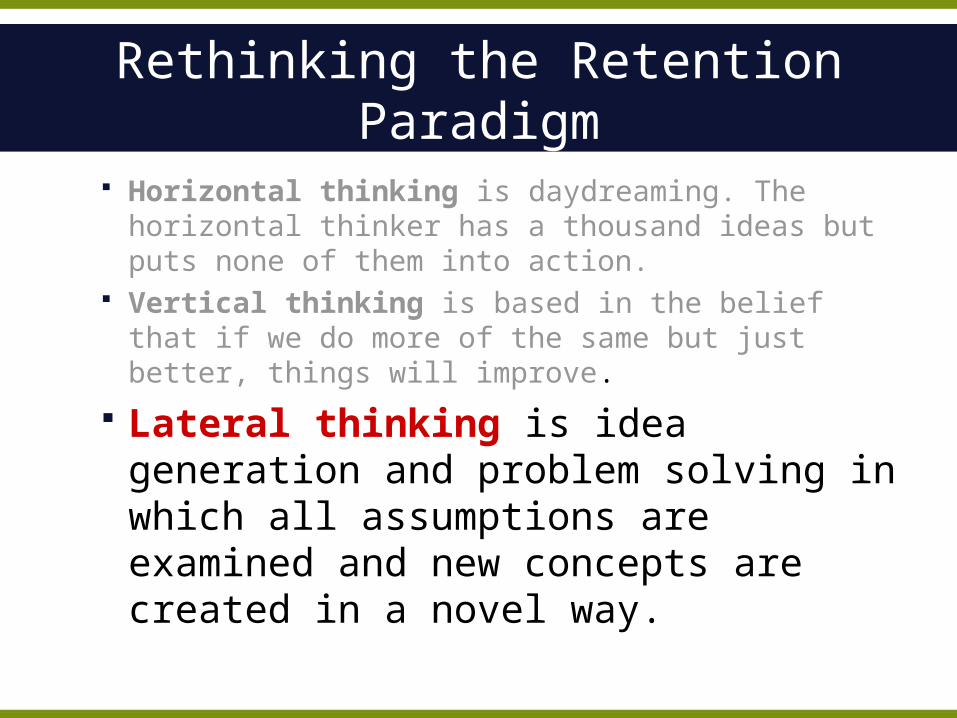
Horizontal thinking is daydreaming. The horizontal thinker has a thousand ideas but puts none of them into action.
Vertical thinking is based in the belief that if we do more of the same but just better, things will improve.
Lateral thinking is idea generation and problem solving in which all assumptions are examined and new concepts are created in a novel way.
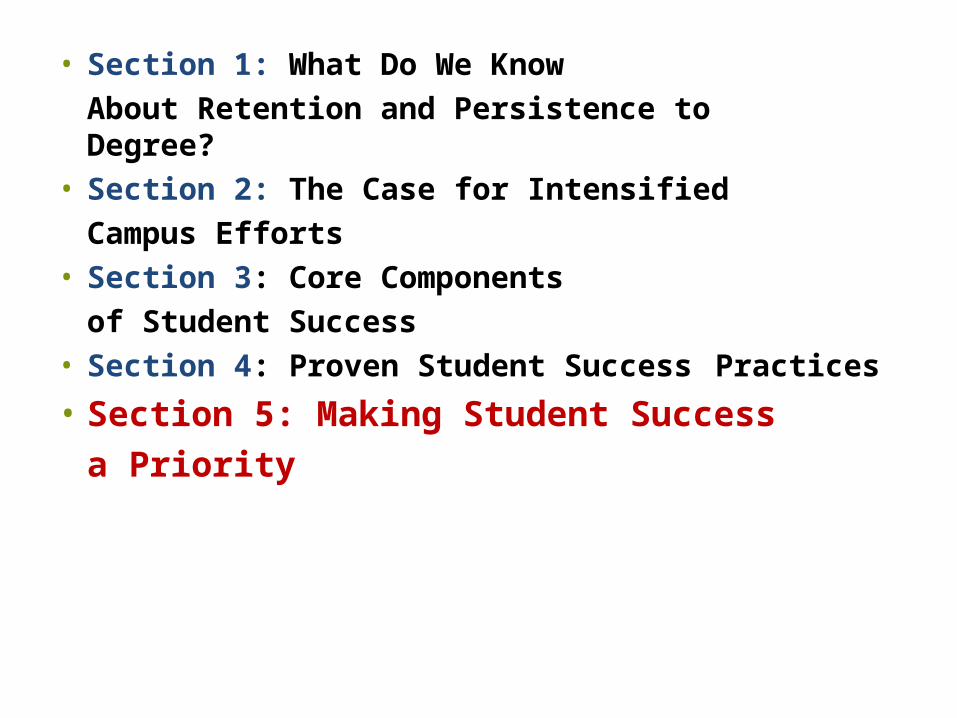
• Section 1: What Do We KnowAbout Retention and Persistence to Degree?
• Section 2: The Case for IntensifiedCampus Efforts
• Section 3: Core Componentsof Student Success
• Section 4: Proven Student Success Practices
• Section 5: Making Student Successa Priority
Rethinking the Retention Paradigm
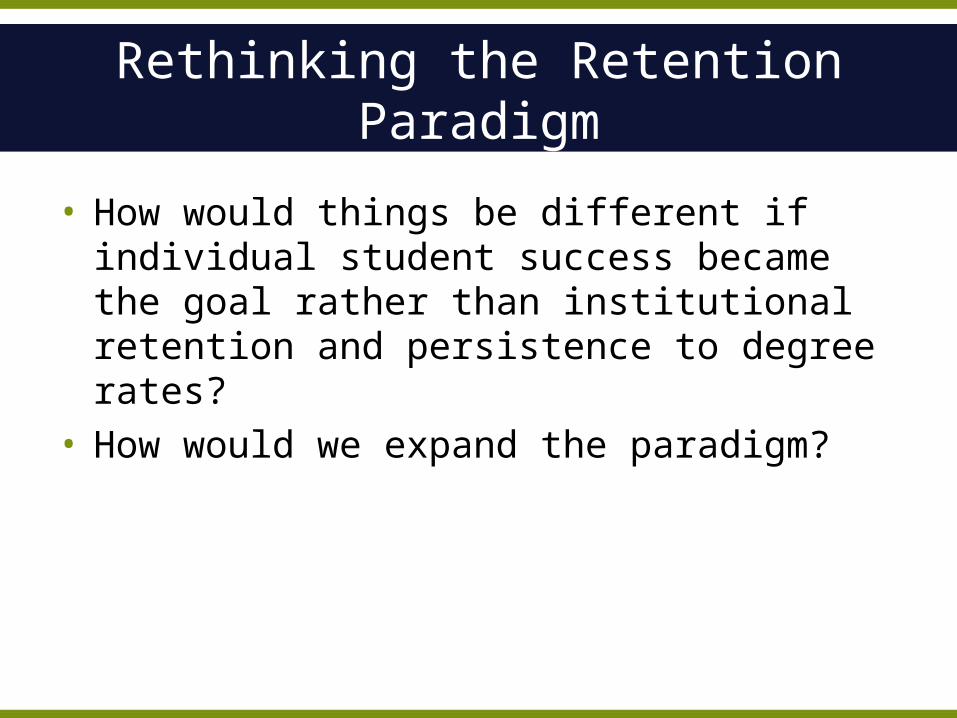
• How would things be different if individual student success became the goal rather than institutional retention and persistence to degree rates?
• How would we expand the paradigm?
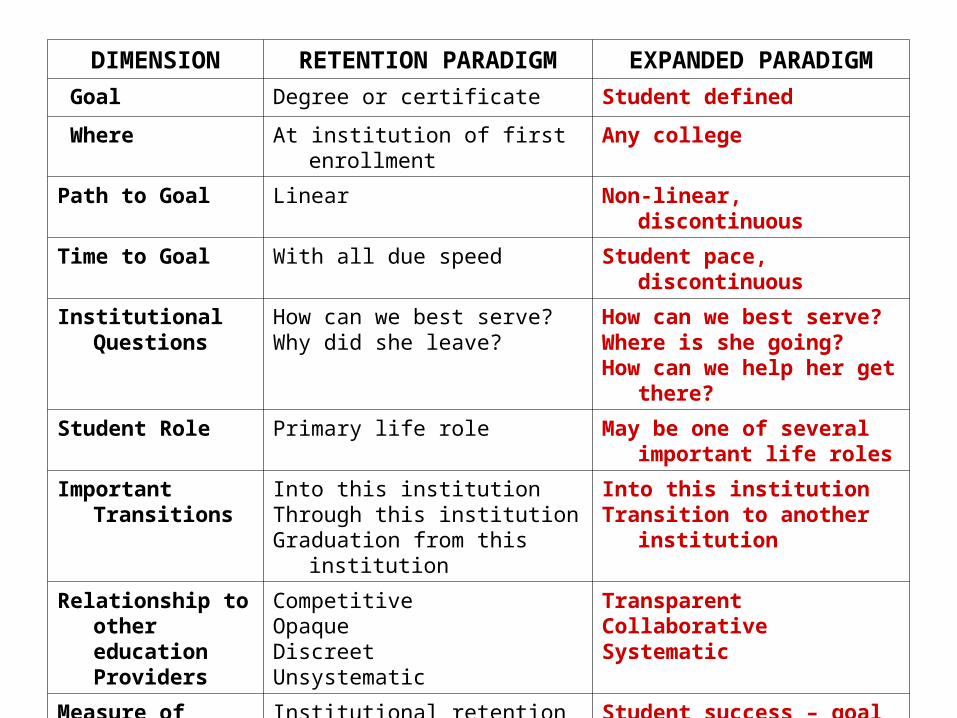
DIMENSION RETENTION PARADIGM EXPANDED PARADIGM
Goal Degree or certificate Student defined
Where At institution of first enrollment Any college
Path to Goal Linear Non-linear, discontinuous
Time to Goal With all due speed Student pace, discontinuous
Institutional Questions
How can we best serve?Why did she leave?
How can we best serve? Where is she going?How can we help her get there?
Student Role Primary life role May be one of several important life roles
Important Transitions
Into this institutionThrough this institutionGraduation from this institution
Into this institutionTransition to another institution
Relationship to other education Providers
Competitive OpaqueDiscreetUnsystematic
TransparentCollaborativeSystematic
Measure of Effectiveness
Institutional retention rateInstitutional degree completion rate
Student success – goal achievement rate
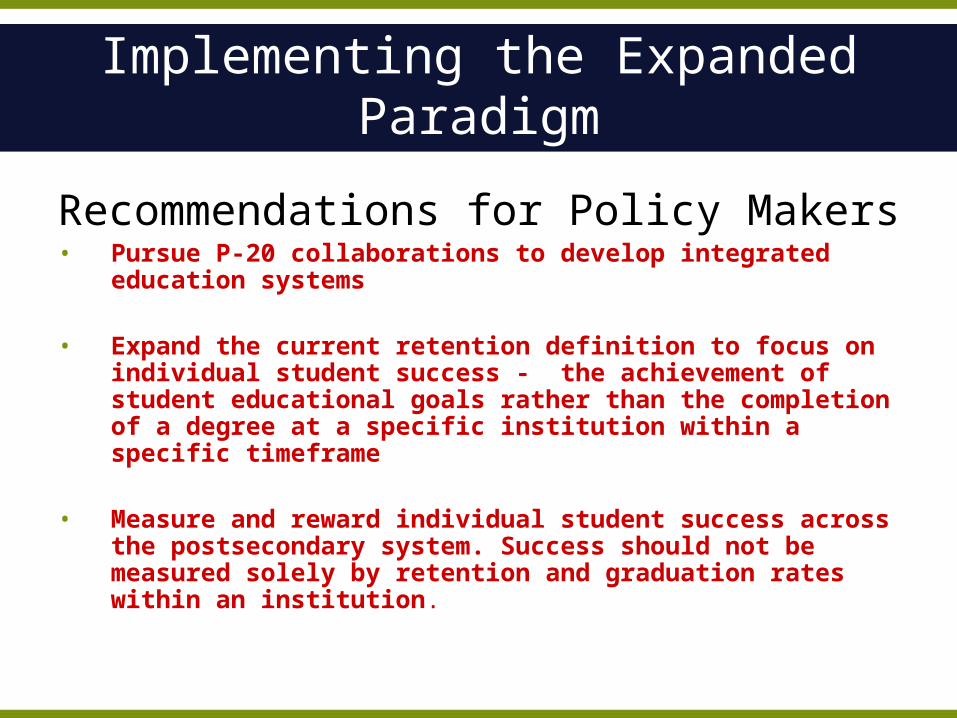
Implementing the Expanded Paradigm
Recommendations for Policy Makers• Pursue P-20 collaborations to develop integrated
education systems
• Expand the current retention definition to focus on individual student success - the achievement of student educational goals rather than the completion of a degree at a specific institution within a specific timeframe
• Measure and reward individual student success across the postsecondary system. Success should not be measured solely by retention and graduation rates within an institution.
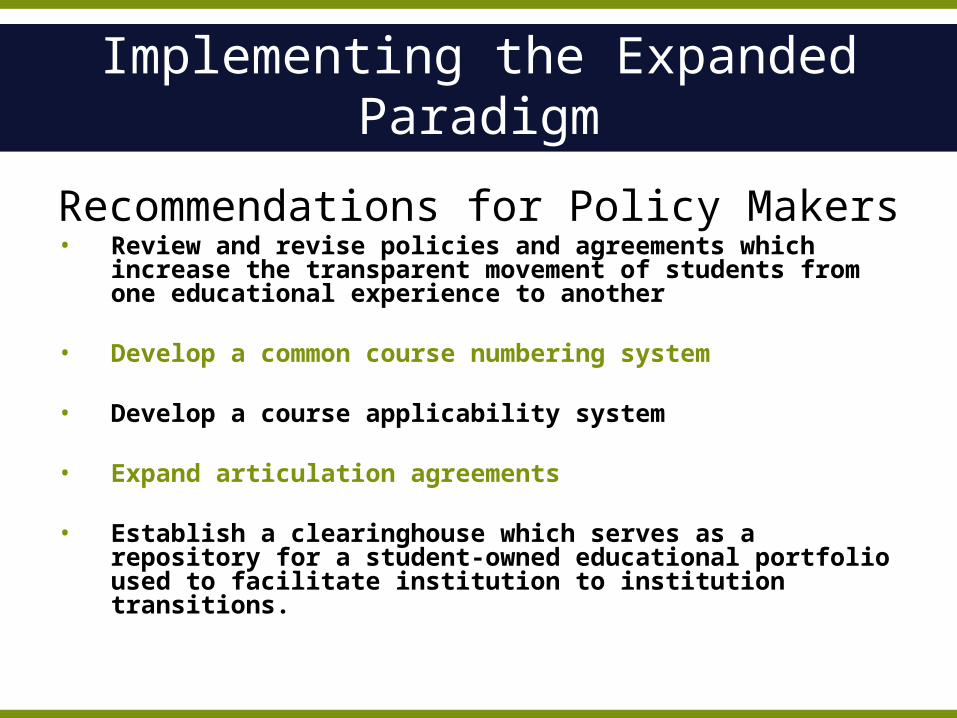
Implementing the Expanded Paradigm
Recommendations for Policy Makers• Review and revise policies and agreements which
increase the transparent movement of students from one educational experience to another
• Develop a common course numbering system
• Develop a course applicability system
• Expand articulation agreements
• Establish a clearinghouse which serves as a repository for a student-owned educational portfolio used to facilitate institution to institution transitions.
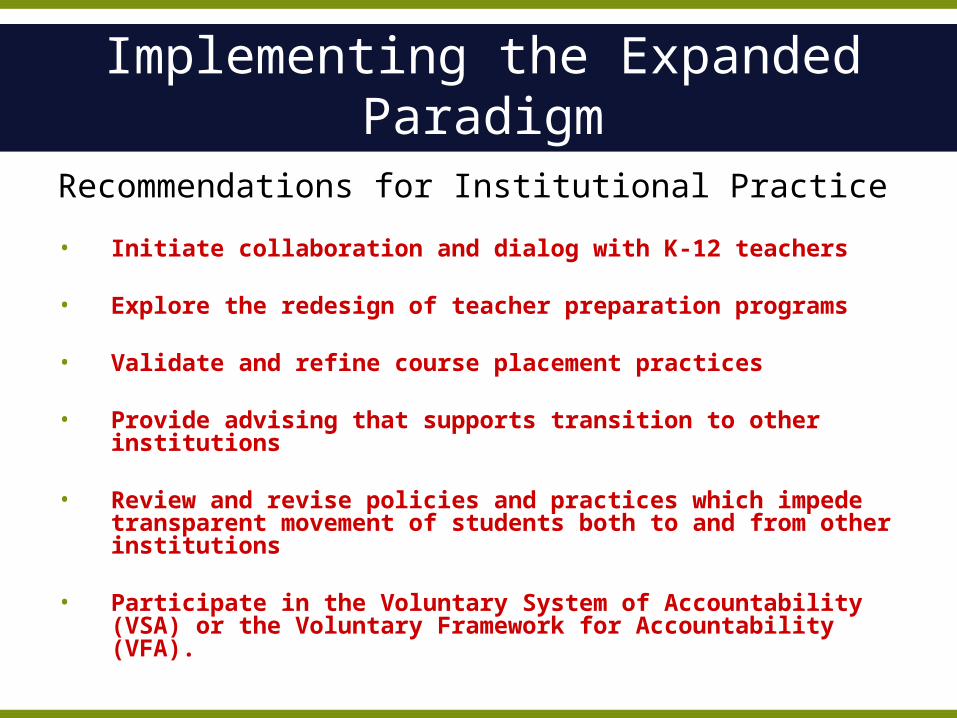
Implementing the Expanded Paradigm
Recommendations for Institutional Practice
• Initiate collaboration and dialog with K-12 teachers
• Explore the redesign of teacher preparation programs
• Validate and refine course placement practices • Provide advising that supports transition to other
institutions
• Review and revise policies and practices which impede transparent movement of students both to and from other institutions
• Participate in the Voluntary System of Accountability (VSA) or the Voluntary Framework for Accountability (VFA).
Topics
• Overview of WWISR surveys• Attrition Factors• Retention Interventions• Retention and Degree Completion Rates• Educational Attainment Rates• Expanding the Retention Paradigm