1 sustainable consumption and production
TRANSCRIPT
Sustainable consumption and production 1
SUSTAINABLE CONSUMPTIONAND PRODUCTIONBaseline Research for ASEAN

Intentionally Left Blank
SUSTAINABLE CONSUMPTIONAND PRODUCTIONBaseline Research for ASEAN
November 2020

Sustainable consumption and production4
TABLE OF CONTENTS
667
List of Figures List of Tables List of Abbreviations
2.1 International Standards
2.1.1 ISO 14020 Series
2.1.2 ISO 14040 Life Cycle Assessment
2.1.3 ISO 14060 Greenhouse Gases
2.1.4 PAS 2050: International Standard by the UK
2.1.5 Greenhouse Gas Protocol
2.1.6 Comparison of the Three Carbon Footprint Standards
2.2. Standards Used by Each Country
2.2.1 Indonesia, Philippines, Singapore and Vietnam – ISO 14024 Type I Ecolabel
2.2.2 Malaysia – ISO 14025 Type III Ecolabel and ISO 14067 Carbon Footprint Quantification
2.2.3 Thailand – PAS2050
Discussion
ASEAN 2025: Forging Ahead Together
1.1 Sustainable Consumption and Production
1.2. Current Challenges in ASEAN
1.2.1 Overproduction of Waste and Lack of Waste Disposal Infrastructure
1.2.2 Climate Change a Threat to ASEAN
1.2.3 Carbon Emissions on the Rise in ASEAN
1.2.4 Consumption Carbon Emissions
1.2.5 Increase in Demand for Energy
1.3. ASEAN’s Energy Plans
1.4. Project Focus and Methodology02
01
CO2 FOOTPRINTING FOR CONSUMER GOODS
INTRODUCTION
20
21
21
21
22
22
22
23
25
25
25
26
11
12
13
13
15
15
15
16
16
17

Sustainable consumption and production 5
3.1 Brunei
3.2 Cambodia
3.3 Indonesia
3.4 Laos
3.5 Malaysia
3.6 Myanmar
3.7 Philippines
3.8 Singapore
3.9 Thailand
3.10 Vietnam
Discussion
03ENERGY EFFICIENCY
30
30
30
31
31
32
32
34
35
36
37
4.1 Brunei
4.2 Cambodia
4.3 Indonesia
4.4 Laos
4.5 Malaysia
4.6 Myanmar
4.7 Philippines
4.8 Singapore
4.9 Thailand
4.10 Vietnam
Discussion
04RECYCLING
39
40
41
42
43
45
47
49
51
52
53
05CONCLUSION 54
Acknowledgment 59

Sustainable consumption and production6
List of Figures
Figure 1: Table listing key strategies of the APEC Phase I ............................................................................ 17
Figure 2: Carbon emissions sorted by consumer need ................................................................................ 19
Figure 3: Indonesia energy efficiency label .................................................................................................. 31
Figure 4: Malaysia energy efficiency label for television, refrigerator, domestic fan and air conditioners .. 32
Figure 5: Philippine energy efficiency label for air conditioners ................................................................... 33
Figure 6: Philippine energy efficiency label for refrigerators ........................................................................ 33
Figure 7: Philippine energy efficiency label for fluorescent lamps ............................................................... 34
Figure 8: Philippine energy efficiency label for lamp ballasts ....................................................................... 34
Figure 9: Singapore energy efficiency label for air-conditioner, refrigerator, clothes dryer and television .. 35
Figure 10: Singapore energy efficiency label for lamps ................................................................................ 35
Figure 11: Thailand energy efficiency no.5 label .......................................................................................... 36
Figure 12: Vietnam energy efficiency label .................................................................................................. 37
Figure 13: 2018 recycling statistics in Singapore ......................................................................................... 50
List of Tables
Table 1: Ranking of ASEAN countries according to waste generation (Jain, 2017) ....................................... 13
Table 2: List of ASEAN countries with respective increase in consumption emissions from 1990 to 2017. . 16
Table 3: List of ISO series related to carbon footprint of a product .............................................................. 20
Table 4: Summary of ASEAN countries and their respective ecolabel/carbon footprint scheme ................. 23
Table 5: Carbon footprint labels ................................................................................................................... 24
Table 6: Summary of ASEAN countries and their respective energy efficiency labels .................................. 29
Table 7 Summary of recycling progress in ASEAN ........................................................................................ 53

Sustainable consumption and production 7
List of Abbreviations
3R Reduce, Reuse, and RecycleACE ASEAN Centre for Energy AEMAS ASEAN Energy Management SystemAGC Brunei Attorney General Chambers
AJEEP ASEAN Japan Energy Efficiency Programme
ASEAN Association of Southeast Asian Nation
ASEAN-SHINE ASEAN Standard Harmonization Initiative (ASHI) for Energy Efficiency
ASHI ASEAN Standard Harmonization Initiative
BNERI Brunei National Energy Research Institute
BSI British Standards Institution
CFP Carbon Footprint for Products
CFR Carbon Footprint Reduction
DEIPMO Brunei Department of Energy and Industry, Prime Minister’s Office
ECAP Energy Conservation Workshop under AJEEP
EdL Electricite du Laos
EE Energy Efficiency
EE&C-SSN ASEAN Energy and Conservation Sub-Sector Network
EMTIPS Energy Market Transformation with Information Provision Scheme
GAIA Global Alliance for Incinerator Alternatives
GCP Global Carbon Project

Sustainable consumption and production8
GHG Greenhouse Gas
HDPE High-density Polyethylene
IIEC International Institute of Energy Conservation
ISO International Standards Organisation
IQNet International Certification Network
LDPE Low-density Polyethylene
MEPS Minimum Energy Performance Standards
MSW Municipal Solid Waste
NEA National Environmental Agency of Singapore
NSWMP National Solid Waste Management Policy
PET Polyethylene Terephthalate
PNS Philippine National Standard
PP Polypropylene
RAC Room Air Conditioners
S&L Standard and Labelling System
SIRIM Standard and Industrial Research Institute of Malaysia
TBCSD Thailand Business Council for Sustainable Development
TEI Thailand Environment Institute
TGO Thailand Greenhouse Gas Management Organisation
VNEEP Vietnam National Energy Efficiency Program
WRI World Resource Institute
WBCSD World Business Council for Sustainable Development

Intentionally Left Blank

01INTRODUCTION

Sustainable consumption and production 11
1. INTRODUCTION
ASEAN 2025: FORGING AHEAD TOGETHER
ASEAN is currently the 5th largest GDP in the world, valued at US$3.0 trillion in 2018 just after Germany. By 2030, ASEAN is predicted to become the 4th largest economy, just after the United States, China and the European Union. As a result of rapid economic and urban population growth, specific challenges have arisen, including but not limited to region-wide social inequality, increased resource consumption and generation of waste. ASEAN produces approximately 8.9 million metric tons of mismanaged plastic waste annually, contributing to 60% of marine debris (Ismail, 2018). Moreover, six out of ten ASEAN member states are ranked among the top 20 among 192 coastal countries that mismanaged plastic waste in 2010 with 57 - 89% of mismanaged waste (Indonesia, Malaysia, Myanmar, Philippines, Thailand, Vietnam) (Lyons, Su, & Neo, 2019).
This problem has been exacerbated by China’s ban on waste imports in 2018, which has caused an increase in low quality, contaminated and sometimes illegal plastic waste imports into ASEAN. The regional recycling industry is unable to cope with the sheer volume of imported waste and coupled with the overproduction of domestic waste; these issues can result in greater inequality as those who are vulnerable are disproportionately affected. Exposed communities are experiencing negative impacts such as contaminated water supplies, crop death, respiratory illness from exposure to burning plastic, and the rise of organized crime (GAIA, 2019).
In response to these challenges that ASEAN has been facing in recent years, the ASEAN 2025: Forging Ahead Together work plan was created. The plan was simultaneously endorsed by ASEAN Leaders at their 27th Summit and charts the path for ASEAN Community building over the next ten years. Through this progressive roadmap, ASEAN is working towards a Community that is ‘politically cohesive, economically integrated, and socially responsible.’ This plan includes four different sections, ASEAN Community Vision 2025, ASEAN Political-Security Community Blueprint 2025, ASEAN Economic Community Blueprint 2025, ASEAN Socio-Cultural Community Blueprint 2025. (ORBIS, 2016)

Sustainable consumption and production12
1.1 Sustainable Consumption and Production
Sustainable consumption and production (SCP) is goal 12 of the United Nations’ Sustainable Development Goals. It involves changing consumption and production patterns by reviewing the life cycle of a service or product, to safeguard the needs of future generations. Reducing the use of natural resources and toxic materials and the production of waste and pollutants are imperative to achieving this goal. ASEAN has recognised the importance of SCP and has defined it as a target under the ASEAN 2025: Forging Ahead Together work plan under the Socio-Cultural Community section. Under the Socio-Cultural Community (section C4) C.4 of the ASEAN 2025 work plan, ‘Sustainable Consumption and Production’ is one of the targets and has the following components:
1. Strengthen public-private partnerships to promote the adoption of environmentally-soundtechnologies for maximising resource efficiency.
2. Promote environmental education (including eco-school practice), awareness, and capacity toadopt sustainable consumption and green lifestyle at all levels.
3. Enhance capacity of relevant stakeholders to implement sound waste management and energyefficiency.
4. Promote the integration of SCP strategy and best practices into national and regional policies oras part of CSR activities.
One of the key elements of SCP is access to information, fully empowered enforcement and certification entities, as well as ways and means for consumers to easily compare products and services based on a trustworthy, public and harmonised information system. Seals and labelling have proven to be an appropriate way to not only raise the awareness of consumers but also act as an important sales proposal for businesses. This labelling process will also facilitate trade with common standards, which is a goal of the ASEAN and its ASEAN Economic Community approach. It will be critical to initiate an ASEAN level process to address the risk of consumers getting lost in too many national, regional and private labels and certificates. It is also necessary to inform consumers and businesses about the sustainability aspects of products and services across all member states in a mutually agreed and established manner, eventually creating a kind of ASEAN SCP labelling, certification and information system.
The areas to cover may range from CO2 footprinting, energy efficiency, organic production, free of banned/critical substances, recycled components, origin of raw materials, etc. It would also cover non-physical topics like a fair trade, ethical production, data privacy, etc. which eventually are all characteristics of a sustainable product or service.
As the current program under the leadership of the Hanns Seidal Stiftung (HSS) is dedicated to mitigating climate change, the proposed intervention by ASEAN CSR Network will focus on three topical areas deemed critical to change consumers’ and producers’ perception awareness and behaviour.
1. CO2 footprinting for consumer goods.
2. Energy efficiency classification of consumer appliances.
3. Guidance on recycling for consumer goods (recyclability).
Sustainable consumption and production 13
A clear, commonly understood and harmonised way of communication of such characteristics to the consumer through unified information and labelling systems is critical to achieving the desired sustainable change in consumption behaviour in the ASEAN region. This will eventually contribute to a substantial reduction of greenhouse gas emissions and usage of resources including energy, as well as being supportive of waste reduction. Such positive effects on the consumers’ side are also expected to materialise for production, distribution and disposal/end of use/recycling. Consumers with knowledge will drive demand for sustainable products in a participatory manner. This will have a longer-lasting effect as well.
1.2 Current Challenges in ASEAN
1.2.1 Overproduction of Waste and Lack of Waste Disposal Infrastructure
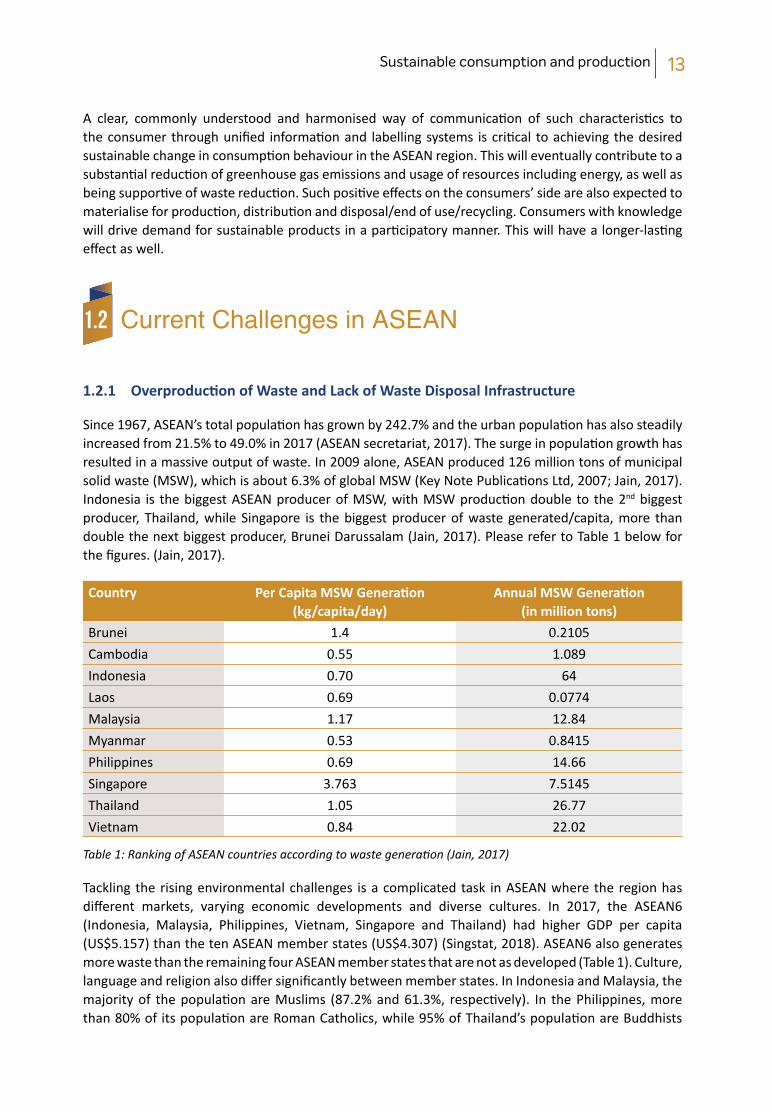
Since 1967, ASEAN’s total population has grown by 242.7% and the urban population has also steadily increased from 21.5% to 49.0% in 2017 (ASEAN secretariat, 2017). The surge in population growth has resulted in a massive output of waste. In 2009 alone, ASEAN produced 126 million tons of municipal solid waste (MSW), which is about 6.3% of global MSW (Key Note Publications Ltd, 2007; Jain, 2017). Indonesia is the biggest ASEAN producer of MSW, with MSW production double to the 2nd biggest producer, Thailand, while Singapore is the biggest producer of waste generated/capita, more than double the next biggest producer, Brunei Darussalam (Jain, 2017). Please refer to Table 1 below for the figures. (Jain, 2017).
Country Per Capita MSW Generation (kg/capita/day)
Annual MSW Generation (in million tons)
Brunei 1.4 0.2105Cambodia 0.55 1.089Indonesia 0.70 64Laos 0.69 0.0774Malaysia 1.17 12.84Myanmar 0.53 0.8415Philippines 0.69 14.66Singapore 3.763 7.5145Thailand 1.05 26.77Vietnam 0.84 22.02
Table 1: Ranking of ASEAN countries according to waste generation (Jain, 2017)
Tackling the rising environmental challenges is a complicated task in ASEAN where the region has different markets, varying economic developments and diverse cultures. In 2017, the ASEAN6 (Indonesia, Malaysia, Philippines, Vietnam, Singapore and Thailand) had higher GDP per capita (US$5.157) than the ten ASEAN member states (US$4.307) (Singstat, 2018). ASEAN6 also generates more waste than the remaining four ASEAN member states that are not as developed (Table 1). Culture, language and religion also differ significantly between member states. In Indonesia and Malaysia, the majority of the population are Muslims (87.2% and 61.3%, respectively). In the Philippines, more than 80% of its population are Roman Catholics, while 95% of Thailand’s population are Buddhists

Sustainable consumption and production14
(HV, Thompson, & Tonby, 2014). Local cultural and religious beliefs and habits may conflict with technocratic waste management protocols and result in partial implementation of policies (Allison, 2014).
For most of these countries, the development of waste management infrastructure and policy implementation has not kept up with economic growth. Most of the ASEAN countries are still developing and not enough resources are directed towards strengthening waste collection, treatment and disposal infrastructure. Implementation is difficult as it relies heavily on the local government, which may not have the capacity to finance waste management sustainably. Furthermore, waste management is often not profitable, especially if there is a lack of waste management and recycling infrastructure. Nine out of ten ASEAN member states still rely on the informal method of collecting, transporting and disposing of waste in its waste management. As a result of a lack of proper recycling infrastructure and improper handling, most of the waste produced leaks out into the environment, with adverse effects. Moreover, communities that are on the lower end of the social class in rural areas are especially affected by illegal landfills (Ariffin, 2018, Rogers, 2019; Jain, 2017).
Overproduction of waste coupled with a lack of waste disposal infrastructure and system has caused air, land and water pollution. Improper waste handling such as open dumping and open burning of waste contribute to higher greenhouse gas emissions, the presence of pest infestations. Other hazards include the release of toxic contaminants into the air, the spread of diseases, and water, soil and air pollution. Toxic substances from waste such as faecal matter, heavy metals, bacteria and viruses pollute soil, ground and surface water. Plastic waste that is dumped in the rivers is also broken and carried through its tributaries to the ocean, flooding the ocean with microplastic that is difficult to clean up. While local communities are usually the first in line to be affected by such pollution through food security and health standards, the global community is affected as well as the pollution enters the ocean where it circulates to all parts of the world. (Ferronato & Torretta, 2019).
It has been documented that the 12 rivers in ASEAN are polluted with trash, one of which is the Mekong River, which traverses China, Myanmar, Laos, Thailand, Cambodia and Vietnam (Ismail, 2018). Out of these 12, seven rivers in ASEAN (including the Mekong) are among the top 20 most polluted rivers in the world (Lebreton, et al., 2017). In addition to improperly managed land-based plastic waste, marine litter also contributes to mismanaged plastic waste that ends up in our oceans. The sources of marine litter are diverse, ranging from commercial and recreational ships and vessels to land-based sources such as street litter and production waste.
Based on mismanaged plastic waste data in 2010, five ASEAN member states; Indonesia, Philippines, Vietnam, Thailand and Malaysia generate 8.9 million tons of it every year, making up 27.9% of global mismanaged plastic waste from all 192 coastal countries. Just 20 countries produce 83% of the 4.4–12.7 million tonnes of land-based plastic waste that ends up in the ocean, and Indonesia, Philippines, Vietnam and Thailand are among the top six most plastic polluting countries, with Malaysia coming in eighth. Indonesia is the biggest producer, generating 3.22 million tons of mismanaged plastic waste, with half ending up in the sea. (Jambeck, Geyer, Wilcox, & Siegler, 2015; Garcia, Fang, & Lin, 2019; Gong & Trajano, 2019). Based on these figures, this transboundary water pollution is a significant issue in ASEAN who contributes to almost a third of global mismanaged plastic waste. If plastic waste leakage is left unchecked, the comprehensive quantity of plastic in the ocean may nearly double to 250 million metric tons by 2025 (Ocean Conservancy, 2017; Habib, 2019).

Sustainable consumption and production 15
1.2.2 Climate Change a Threat to ASEAN
Climate change is also another substantial concern in the ASEAN region. Recently, the Singapore government announced that it expects to spend S$100 billion or more over the next 100 years to invest in engineering solutions to protect Singapore’s coastlines from rising sea levels (Wong, 2019). ASEAN has been identified as the coastal region most susceptible to the impacts and risks of climate change by the 2014 IPCC Fifth Assessment Report (Lassa, Lai, & Goh, 2015). As mentioned previously, more impoverished communities will be disproportionately affected, such as farmers, fishermen and poor urban consumers, as their capacity to adapt and recover from climate change events is limited (Lassa, Lai, & Goh, 2015). Rising temperatures also threaten food security, energy demands and economic development. Studies have shown that average temperatures in the region have been rising (ASEAN Secretariat, 2012). Compared to historical warming of 0.5 – 1.1 °C for the period of 1901-2005, it is projected that by the end of the 21st century, the annual mean temperature is expected to increase by a median value of 2.5°C (National Intelligence Council , 2009).
1.2.3 Carbon Emissions on the Rise in ASEAN
One primary driver of climate change is carbon emissions and in 2017, ASEAN was responsible for 4.18% of territorial carbon dioxide emissions (total emissions within a country’s borders). With Indonesia (12th in the world), Thailand (20th in the world), Malaysia (25th in the world) and Vietnam (230th in the world) having the highest total carbon emissions in the region. Brunei, Malaysia and Singapore ranked highest for total carbon emissions per person (Global Carbon Project, 2017). This increase in carbon emissions is mainly driven by the rise in economic growth and urban population, leading to rising affluence or GDP per capita (Wang, Chen, & Kubota, 2016). A study by (Chontanawat, 2018) found that increasing income or GDP per capita was the most crucial factor in increasing CO2 emissions, and its effect would increase over time. As ASEAN predominately still relies on fossil fuel for its energy source, energy management through fuel substitution and technological upgrades to decrease emission intensity is crucial to sustaining a higher level of economic growth with the present growth in population.
1.2.4 Consumption Carbon Emissions
According to the emissions profile for each ASEAN country in the Global Carbon Project (GCP) database, since 1990, consumption emissions have increased from a range of 0.2 - 9.0% (Table 2). Consumption emissions include discharges resulting from domestic final consumption and production of imports for each country (Ritchie, 2018). Singapore’s increase may be low because it has developed much earlier than the other ASEAN states and does not manufacture a high volume of products as compared to other member states. Data from the GCP database also suggest that consumption emissions will continue to increase for most member states rather than plateauing as these countries are still developing and growing.

Sustainable consumption and production16
CountryIncrease in Consumption Emissions from 1990 to 2017
(%)Brunei 3.1
Cambodia 7.2
Indonesia 4.3
Laos 7.9
Malaysia 5.0
Myanmar 5.6
Philippines 3.2
Singapore 0.2
Thailand 4.4
Vietnam 9.0
Table 2: List of ASEAN countries with an increase in consumption emissions from 1990 to 2017.
1.2.5 Increase in Demand for Energy
Economic development and a rise in the urban population in the region has intensified energy demand. ASEAN is forecasted to grow on average, 4% annually and in response, primary energy demand is anticipated to grow 4.7% per year (ACE, 2015). The rise in energy demand has posed a few challenges to the energy sector; these include energy security, the investment needed for fuel supply and energy efficiency, universal access and environmental sustainability (Andrews-Speed & Singh, 2019). ASEAN member states are taking more initiatives to increase the share of renewable energy and diversify their energy portfolio; however, progress varies significantly across each country and differences seem to be mostly dependent on government policy (Daubach, 2019). More investment into renewable energy is still needed to scale it up significantly and make it more price competitive.
1.3 ASEAN’s Energy Plans
To combat these challenges, the ASEAN Centre for Energy (ACE) has developed the ASEAN Plan of Action for Energy Cooperation (APAEC). This plan has seven programme areas, which range from energy efficiency and conservation, renewable energy, energy policy and planning, technology, transboundary infrastructure development, nuclear energy and cross border energy agreements. Phase 1 (2016-2020) is currently in progress and aims to implement short to medium-term measures to boost energy security cooperation while improving on transboundary connectivity between member states in terms of energy supply, transportation and trade, and diversifying energy profiles. This includes multilateral electricity purchase between Thailand, Laos and Malaysia and collective harmonisation of energy efficiency standards of electrical appliances to enhance energy efficiency, especially in the residential sector (Bangkok Post, 2019). The progress of Phase I is to be reviewed for the implementation of Phase II (2020-2025). This year, the ASEAN Ministers on Energy Meeting and Associated Meetings (AMEM) was held in Bangkok, Thailand to discuss ASEAN’s progress in achieving the targets outlined in Phase I and the way forward for Phase II. So far, ASEAN has exceeded its goal of reducing energy intensity

Sustainable consumption and production 17
(EI) of 20% by reaching 24.4%. The share of renewable energy in ASEAN’s total primary energy supply climbed to 14.3% in 2017, and the aim is to reach 23% by 2025 (Business Mirror, 2019).
ASIAN POWER GRIDTo ini�ate mul�lateral electricity trade in at least one sub-region
by 2018.
TRANS ASIAN GAS PIPELINETo enhance connec�vity for energy
security and accessibility via pipelinesand regasifica�on terminals.
COAL & CLEAN COALTECHNOLOGY
To enhance the image of coal throughpromo�on of clean coal
technologies (CCT).
ENERGY EFFICIENCY &CONSERVATION
To reduce energy intensity3 by 20% in2020 based on 2005 level.
RENEWABLE ENERGYAspira�onal target to increase thecomponent of renewable energy4
to 23% by 2025 inASEAN Energy Mix5.
To build capabili�es in policy,technology and regulatory aspects of
nuclear energy
REGIONAL ENERGY POLICY &PLANNING
To be�er profile the energy sector interna�onally.
CIVILIAN NUCLEAR ENERGY
Figure 1: Table listing key strategies of the APEC Phase I (ACE, 2015)
1.4 Project Focus and Methodology
The report will be focusing and elaborating on the three topical areas mentioned before:
1. CO2 footprinting for consumer goods.
2. Energy efficiency classification of consumer appliances.
3. Guidance on recycling for consumer goods (recyclability).
This report is desktop research on the current status with regards to consumer information policies and practices in all 10 ASEAN countries on SCP, including a mapping of stakeholders (including business and its representative bodies)rinting for Consumer Goods

02CO2 FOOTPRINTING FOR CONSUMER GOODS

Sustainable consumption and production 192. 2. CO2 Footprinting for Consumer Goods
Consumer purchasing decisions are a major driver of carbon emissions in an economy. It is estimated that industries which are directly tied to consumer behaviour such as the fashion (10%), food (37%) and tourism (8%) industry already make up more than half of global greenhouse gases (Fu, Shu, & Liu, 2018; Lenzen, et al., 2019; McFall-Johnsen, Woodward, & US, 2019). A summary chart from a carbon footprint report by carbon trust provides some examples of consumer needs that contribute to carbon emissions (Figure 2). As mentioned in our finding with regards to consumption carbon emissions in paragraph 1.3.4, data from the GCP database suggest that consumption emissions will continue to increase for most member states rather than plateauing as these countries are still developing and growing. It is expected that carbon emission will increase, rather than decrease since 2006.
Recrea�on and leisure
Space hea�ng
Food and catering
Household
Health and hygiene
Clothing and footwear
Commu�ng
Educa�on
Other government
Communica�on
Key of emission sources1
Direct
Indirect
Travel
31.6MtC
24.0
22.4
22.2
21.7
16.1
13.1
7.9
4.8
1.6
Chart total 165.4 MtC
Grand total 176.4 MtC
Exclusions 11.0 MtC Avia�on fuel emissions
Source: UK Carbon A�ribu�on Model, Centre for Environmental Strategy, University of Surrey, 20051 Direct emissions are the emissions associated with the direct consump�on of (non-transport related) fossil fuels and elec�city in the household. Indirect
emissions include the emissions embodied in good and services, including energy required to produce the goods and services and the emissions from space hea�ng and ligh�ng by the service and government sectors. Travel-related emissions include emissions from transport fuels and the indirect emissions embodied in transport goods and services.
Figure 2: Carbon emissions sorted by consumer need (Carbon Trust, 2006)
Consumer demand for more sustainable products has given rise to vegan products, upcycled fashion garments, impossible burgers and plastic alternatives. Carbon emission footprint labels for consumer goods can provide valuable information to consumers who wish to minimise their environmental impact.

Sustainable consumption and production20
2.1 International Standards
Currently, three international standards provide methods to quantify the carbon footprint of a product. They are:
1. ISO 14067: Greenhouse gases -- Carbon footprint of products -- Requirements and guidelinesfor quantification (2018)
2. PAS2050 (2008) developed by Carbon Trust and the British government
3. Greenhouse Gas Protocol Product Life Cycle Accounting and Reporting Standard (2011) byWorld Resource Institute (WRI) and the World Business Council for Sustainable Development(WBCSD).
These standards mostly draw on some of the older environmental standards from the international standards organisation (ISO) (Table 3).
ISO Series ISO Standard
ISO 14020 (1998) – Environmental labels and declarations (ELD) – General principles
ISO 14024: 2018 - Environmental labels and declarations: environmental labelling type I, guiding principles and procedures.
ISO 14021: 2016 - Environmental labels and declarations: self-declaration environmental claims, terms and definitions, Type II
ISO 14025: 2006 - Environmental labels and declarations - Type III environmental declaration, principles and procedures.
ISO 14040 – Environmental management – Life cycle assessment – Principles and framework
ISO14040: 2006 - Environmental management — Life cycle assessment — Principles and framework
ISO14044: 2006 - Environmental management — Life cycle assessment — Requirements and guidelines
ISO 14060 – Guide for the inclusion of environment aspects in product standards.
ISO 14064: 2018 - Greenhouse gases – Specification with guidance at the organisation level for quantification and reporting of greenhouse gas emissions and removals.
ISO 14067: 2018 - Greenhouse gases -- Carbon footprint of products -- Requirements and guidelines for quantification
Table 3: List of ISO series related to carbon footprint of a product

Sustainable consumption and production 21
2.1.1 ISO 14020 Series
The ISO 14020 series (first edition 1998) was the first to provide some guidelines on environmental labels. It outlines nine general principles that serve as a prerequisite for environmental labels and declarations. The ISO 14020 series defines three types of environmental labels and declarations, type I (ISO 14024, first edition 1999), type II (ISO 14021, first edition 1998) and type III (ISO 14025, first edition 2006). The more relevant ones for this project are the type I and type III ecolabel.
2.1.1.1 ISO 14024 Type I Environmental Label
ISO 14024 type I environmental label is voluntary and awarded by a third party. The third-party can be a governmental organisation or a private non-commercial entity that has developed a multiple criteria-based programme for a specific product or products. It is considered the strongest ecolabel among the three previously mentioned and identifies products that are determined to be environmentally preferable within a particular product category. Type I environmental labelling programs can be operated by public or private agencies at the national, regional or international levels.
2.1.1.2 ISO 14025 Type III Environmental Label
ISO 14025 type III environmental label is a self-declared environmental claim for any written or spoken environmental statement or claim, including statements, symbols and graphics, regarding products. There are no set criteria; manufacturers simply declare the information they wish to communicate about the environmental attributes of their product. For such claims, assurance of reliability is essential, verification must be conducted properly to avoid unreliable and deceptive environmental claims than may cause adverse environmental effects such as trade barriers or unfair competition. The evaluation methodology used by those who make these claims must be documented, clear, transparent and scientifically sound to ensure that purchasers of the products are assured of the validity of the claims.
2.1.2 ISO 14040 Life Cycle Assessment
ISO 14025 type III eco label also draws on the ISO 14040 series on life cycle assessment for quantifying environmental information. The ISO 14040 series was first released in 1997, with specific steps and details later released in 2006 through ISO 14044. ISO 14040 explains the principles and framework related to life cycle assessment for environmental management while ISO 14044 provides specific requirements, datasheets, tables and figures for users to carry out life cycle assessments. This series is important because it provides the backbone for carbon footprint quantification for consumer products.
2.1.3 ISO 14060 Greenhouse Gases
The next series is ISO 14060, which focuses on the inclusion of environmental aspects in product standards. It provides clarity and consistency for quantifying, monitoring, reporting and validating or verifying greenhouse gas (GHG) emissions and removals. This series has expanded on both environmental labelling and life cycle assessment to provide guidelines and methodologies for quantifying and reporting carbon emissions.
The most relevant ISO standard for this project is ISO 14067: Greenhouse gases -- Carbon footprint of products -- Requirements and guidelines for quantification. It was first released in 2018 and is based on ISO 14040/44 and ISO 14025, but focuses on climate change only.

Sustainable consumption and production22
ISO 14064 covers the reporting of GHG emissions at organisational and project level and has three parts. Part 1 focuses on the organisation level and part 2 at the project level. Part 3 provides guidance for those conducting or managing the validation and/or verification of GHG assertions.
2.1.4 PAS 2050: International Standard by the UK
Another international standard that touches on product carbon footprint is PAS 2050. It is a publicly available international standard developed by Carbon Trust and UK Department of Environment, Food and Rural Affairs and published by the British Standards Institution (BSI) in 2008. PAS 2050 builds on existing life cycle assessment methods established through ISO 14040 and ISO 14044 by giving requirements specifically for the assessment of GHG emissions within the life cycle of goods and services. These requirements further clarify the implementation of these standards concerning the evaluation of GHG emissions of goods and services and establish principles and techniques. It was first released in 2008 and has been revised again in 2011.
2.1.5 Greenhouse Gas Protocol
The last is the Greenhouse Gas Protocol product standard developed by WRI WBCSD in 2011. It provides detailed guidance and a framework to assist companies and other organisations with quantifying and publicly reporting an inventory of GHG emissions and removals associated with a specific product. It does not address avoided emissions or actions taken to mitigate released emissions. This standard also cannot be used to quantify GHG reductions from offsets or claims of carbon neutrality.
2.1.6 Comparison of the Three Carbon Footprint Standards
ISO 14067, PAS 2050 and GHG protocol build on existing life cycle assessment methods established through ISO 14040 and ISO 14044. While BSI, WRI WBCSD and ISO have cooperated to increase the alignment of the standards, there are still differences between each standard.
A study by Wang, Wang, & Yang (2018) showed that even with the same input data, each standard gave a different carbon footprint result due to the use of different methods. This includes boundary issues, inclusion or exclusion of capital goods (e.g. machine, equipment or buildings), inclusion or exclusion of biogenic carbon (carbon derived from renewable sources) storage and emissions and the cut-off criteria. The cut-off criteria specify the exclusion of materials, energy flow levels of environmental significance related to a production system.
By setting quantified thresholds, PAS 2050 excludes inputs lower than 1% of the anticipated total GHG emissions, and the total omissions are up to 5%. No cut-off criteria exist in the GHG Protocol, because 100% completeness is necessary. Exclusions can be justified only if no data are available or an estimation proves that the process is insignificant based on mass, energy, volume, and environment. In ISO 14067, no specific criteria are available. In ISO 14067, GHG emissions from the production of capital goods are considered, where PAS 2050 and GHG Protocol explicitly excluded these aspects from the boundary. As such, each standard is suited for different case studies.

Sustainable consumption and production 23
2.2 Standards Used by Each Country
Currently, only Malaysia and Thailand have a national scheme that focuses on carbon footprint quantification for consumer products. Indonesia, Philippines, Singapore and Vietnam base their national labelling scheme on ISO 14024, first developed in 1999. The remaining countries, Brunei, Cambodia, Laos and Myanmar do not have any national scheme related to ecolabelling or carbon footprint quantification for consumer products (Table 4).
Country Carbon footprint for Consumer Product Legislation
Brunei No national ecolabelling scheme Cambodia No national ecolabelling scheme Indonesia Type I ecolabel based on ISO 14024 (Ramah Lingkungan)Laos No national ecolabelling schemeMalaysia Carbon footprint verification based on ISO 14025 and ISO 14067Myanmar No national ecolabelling schemePhilippines Type I ecolabel based on ISO 14024 (Green Choice Philippines)Singapore Type I ecolabel based on ISO 14024 (Singapore Green Labelling Scheme)Thailand Carbon footprint label based on PAS 2050Vietnam Type I ecolabel based on ISO 14024 (Vietnam Green Label)
Table 4: Summary of ASEAN countries and their respective ecolabel/carbon footprint scheme

Sustainable consumption and production24
Country Carbon footprint for Consumer Product Legislation label
Brunei No label Cambodia No label
Indonesia
Laos No label
Malaysia
Myanmar No label
Philippines
Singapore
Thailand
Vietnam
Table 5: Carbon footprint labels

Sustainable consumption and production 25
2.2.1 Indonesia, Philippines, Singapore and Vietnam – ISO 14024 Type I Ecolabel
ISO 14024 (1999) was released much earlier than the three international standards that address carbon footprint quantification for consumer products (earliest 2008). Thus, most ASEAN countries who had developed their national environmental labelling scheme early, rely on the ISO 14024, which is voluntary but must be verified by a third party. The progress of each country differs, and some have developed criteria for more products than others, but in general, the aim is to guide consumers in purchasing products and services which have reduced impacts on the environment, encourage manufacturers to adopt processes and supply environmentally sound products, and use the label to empower consumers and complement the government’s environmental policy.
2.2.2 Malaysia – ISO 14025 Type III Ecolabel and ISO 14067 Carbon Footprint Quantification
Malaysia launched a product carbon footprint scheme under SIRIM QAS International in 2014. This organisation is under SIRIM Berhad, the Standard and Industrial Research Institute of Malaysia (SIRIM), a corporate organisation owned wholly by the Malaysian government under the Minister of Finance Incorporated. The verification is a voluntary type III environmental declaration that presents a quantified GHG profile for the life cycle of a product to enable comparisons between products fulfilling the same function as defined under ISO 14025:2006 and ISO/TS 14067:2013. The carbon footprint quantification, verification and labelling are primarily intended for use in business-to-business communication, although the same output can be adapted for business-to-consumer communication. SIRIM has developed a toolkit to assist companies in calculating their carbon emissions based on specific product category rules. SIRIM QAS then verifies the collected data and grants certification for acceptable results. The certification grants the benefit of market access to over 37 countries around the world via the International Certification Network (IQNet). SIRIM partnered with the Carbon Trust UK, Building Materials Distributors Association of Malaysia, Malaysian Green Building Confederation and Federation of Malaysian Manufacturers to come up with the scheme.
2.2.3 Thailand – PAS2050
Thailand’s carbon footprint scheme is the most developed among all the ASEAN states. The Thailand Greenhouse Gas Management Organisation (TGO), an autonomous governmental organisation under the Ministry of Natural Resources and Environment, started the Carbon Footprint for Products (CFP) project in 2009. It has developed a carbon footprint label that quantifies GHG emissions from each production unit throughout the whole life cycle (cradle-to-grave) of a product. The project aims to provide an alternative to consumers to contribute towards reducing GHG emissions by purchasing low emission products and services. The project also seeks to promote and enhance the competitiveness of the Thai industrial sector in the global mark. This label uses PAS 2050 as its accounting method for calculating the carbon footprint.
Thailand also has a Carbon Footprint Reduction (CFR) label developed in 2010 that demonstrates an achievement in the reduction of the product’s carbon footprint as required by the TGO’s carbon labelling program. This reduction is based on the product’s life cycle and companies that achieve TGO’s CFR requirement could be eligible to use CFR label on their products. The last label that Thailand has is the Carbon Reductional Label launched in 2009. This label indicates the reduction of greenhouse gas emissions per unit of product/service in the production process as a simple reference for consumers to decide on what items of products or services they should purchase. It was jointly launched by TGO, Thailand Business Council for Sustainable Development (TBCSD) and Thailand Environment Institute (TEI).

Sustainable consumption and production26
DiscussionThere is an urgent need to take action on reducing carbon footprint, particularly as it has a direct and critical impact on climate change (Čuček, Klemeš, & Kravanja, 2015; Eden, Sirola, & Towler, 2014). ASEAN countries are particularly vulnerable to climate change, as the rising temperatures, erratic weather patterns and rising sea levels impact agriculture production, erode coastal lines and disrupt economic activities.
This study has shown that not all ASEAN member states adopt a carbon footprint standard, and amongst those that did, differences exist. It would be useful if ASEAN would consider setting up a task force similar to ACE in tackling this problem.
The task force may want to consider moving away from production-oriented to consumption-oriented climate policy to reduce carbon footprint, particularly as the production-oriented climate policy has not yield much results. In a study by Girod, Vuuren, & Hertwich (2014), production-oriented climate policy has its limitations in climate mitigation, with slow progress and the potential to reaching the ambitious climate policies via the UN Framework Convention on Climate Change by 2020.
Moran, et al. (2018) has found that enabling consumer behaviour changes through consumer options such as carbon footprint labels, energy efficiency labels, mobility patterns such as public transport, emissions could be reduced by approximately 25%. In the study by Camilleri et al (2019), a well-designed carbon label can help shift consumers’ choices away from higher-emission options such as food products.
Our findings at each country level provide a useful overview as well as a quick reference for consideration. Besides advising on the relevant and appropriate standards for each member state, the task force could also consider making carbon label easy to understand at the consumer level. Studies such as those conducted by Guenther, Saunders, & Tait (2014) shows that consumers have difficulties in understanding the label. This is particularly important if we are to influence consumers’ behaviour to achieve the desired outcome.

Intentionally Left Blank

03ENERGY EFFICIENCY

Sustainable consumption and production 293. 3. Energy Efficiency
ACE assumes a central role in the ASEAN energy sector and works closely with energy authorities and ministries in ASEAN member states for energy cooperation. As part of the ASEAN Plan of Action for Energy Cooperation mentioned before, ACE is focusing on energy efficiency and conservation. As part of this plan, the ASEAN Energy and Conservation Sub-Sector Network (EE&C-SSN) leads regional efforts to achieve energy intensity reduction in ASEAN by 30% by 2025 (ACE, 2015). Most energy efficiency programmes are directed towards residential and commercial buildings, energy-intensive industries and transport sectors. Some examples include ASEAN Energy Management System (AEMAS), Promotion of Energy Efficiency & Conservation (PROMEEC), ASEAN Japan Energy Efficiency Programme (AJEEP), Energy Conservation Workshop under AJEEP (ECAP), Energy Market Transformation with Information Provision Scheme (EMTIPS), and the ASEAN Standard Harmonization Initiative (ASHI) for Energy Efficiency (ASEAN-SHINE) on air-conditioners and lighting. The last programme would help to boost energy efficiency, specifically in the residential sector by 5 - 10%. With regard to ASHI, ACE aims to develop a regional policy and roadmap for minimum energy performance standards (MEPS) implementation and national policy and roadmap for MEPS implementation. As part of these action plans, ACE also aims to develop infrastructure for the implementation of MEPS at the national level while raising consumer awareness. One crucial part of MEPS is energy efficiency labelling and standard schemes, and this guides consumers when buying energy-efficient products while setting energy efficiency standards for the industry (ACE, Energy Efficiency Standards and Labelling for Cambodia, 2015; ACE, ASEAN Plan Of Action For Energy Cooperation (APAEC) 2016-2025, 2015).
Currently, Brunei, Cambodia, Laos and Myanmar do not have any energy efficiency labelling and standard schemes yet. However, Brunei and Laos do have plans to create a national energy efficiency labelling and standard schemes and are in the process of consulting the ACE. The six countries, Indonesia, Malaysia, Philippines, Singapore, Thailand and Vietnam have energy efficiency labels (Table 5). Some ASEAN member states have labels for more electrical products than others but generally, there are labels for air conditioners and lamps. Most of the labels use stars to rate energy efficiency, but across the board they do not apply the same energy efficiency standards for their rating system.
Country Energy efficiency (EE) label (year)Brunei In development Cambodia No known plans to have an energy efficiency labelIndonesia Established (2009)Laos In development Malaysia Established (1994)Singapore Established (2008)Philippines Established (1994)Myanmar No known plans to have an energy efficiency labelThailand Established (1994)Vietnam Established (2013)
Table 6: Summary of ASEAN countries and their respective energy efficiency labels
03ENERGY EFFICIENCY

Sustainable consumption and production30
3.1 Brunei
The Brunei government has plans to have an energy efficiency label for air conditioners; however, it has not been finalised yet. Brunei can benefit from energy efficiency labels as electricity consumption from air conditioning systems contributes a big part to this electricity consumption in Brunei, like other tropical countries. The Energy Department, created in 2005, is under the purview of the Department of Energy and Industry, Prime Minister’s Office (DEIPMO) and is the implementing agency for standards and labelling scheme in Brunei. The standards and labelling program is a collaborative project between the DEIPMO and the Brunei National Energy Research Institute (BNERI). The Attorney-General Chambers (AGC) has provided the first clean copy of the draft order, to be further revised by the DEIPMO.
For the first stage, the order would only focus on air-conditioning systems. Subsequently, it will be extended to other appliances or products i.e., refrigerators, lighting systems, rice cookers, water heaters, etc (Abas & Mahlia, 2018; ASEAN-SHINE, 2015; Ahmad & Othman, 2014; APERC, 2016).
3.2 Cambodia
Cambodia does not have a national energy efficiency label for electric appliances and all products are imported from other countries, so energy labels are dependent on the country where the products are imported from.
3.3 Indonesia
Launched since 2009, the Indonesian Energy Efficiency Labelling Program has been in place for residential appliances and is regulated by the Ministry of Energy and Mineral Resources. It is a component of the Government Regulation No. 70/2009 on Energy Conservation. This program aims to provide information to consumers about the energy efficiency level of a product, as well as to encourage manufacturers to increase the level of energy efficiency of products that they produce. The labelling program currently covers air conditioning (voluntary), compact fluorescent lightbulbs (mandatory), refrigerators (voluntary) and freezers (voluntary). Programs to include rice cookers, clothes washers, irons, ballasts, televisions, and fans are under development as of early 2015. The labelling system uses a star-rating system of four stars and includes information about the absolute energy efficiency of the product (kWh/year). The star rating shows the product’s energy efficiency rank relative to similar products in the market and is assigned by an independent and accredited test facility that tested the product (IEA, 2015).

Sustainable consumption and production 31
Figure 3: Indonesia energy efficiency label provides information on energy efficiency standards, model product number and registration number
3.4 Laos
Laos is still developing an energy efficiency standard and labelling program with the help of other Asian countries such as Japan and Thailand. Laos has no manufacturing capability for electrical and electronic products, including lighting products and imports these products from neighbouring countries such as Thailand, China and Vietnam. Facing energy shortage due to rapid economic growth, Laos is taking a key step to tackle the energy supply shortage through demand-side management. The residential sector is a major energy consumer in Laos, and in 2015, it made up 40.2% of the country’s energy consumption. High energy consumption is mainly due to the usage of low energy efficient electric appliances. The Electricite du Laos (EdL), a state-own utility, is implementing the Demand-Side Management and Energy Efficiency (DSM/EE) Phase II project with financial support from the World Bank and contracting the International Institute of Energy Conservation (IIEC) as the project consultant.
In August 2018, a workshop was held in Vientiane with several Laos ministries as well as ACE to discuss the improvement of the standard and labelling (S&L) system proposal (air conditioner-related), creation of the draft of regulations, and preparation of the S&L operation system. As of 2019, nothing has been announced yet (Chantha, 2013; Prasitpianchai, 2014; Ministry of Energy and Mines, 2018).
3.5 Malaysia
Energy efficiency label is regulated by Energy Commission of Malaysia (Suruhanjaya Tenaga) through the Electricity Regulation (Amendments 2013) Regulation 101A (3). It is mandatory since 1994 for all manufacturers and importers of the following products: television, refrigerator, domestic fan and air conditioners. The number of stars indicates energy efficiency from one to five (Suruhanjaya Tenaga Energy Comission, 2019).

Sustainable consumption and production32
Figure 4: Malaysia energy efficiency label for television, refrigerator, domestic fan and air conditioners
3.6 Myanmar
Myanmar does not have any national energy efficiency standards and labelling scheme. The majority of electrical products in the market are imported from Indonesia, Japan, Malaysia, Singapore and Thailand which come with each country’s national energy efficiency labels. Awareness of energy efficiency labels is still low. In a survey conducted by the Myanmar Engineering Society in 2015 for a household energy efficiency project, only 37% of respondents were aware of such labels. Furthermore, some energy efficiency labels were written in each country’s native language and thus not understandable to the locals. The Asian Development Bank noted in their 2016 Myanmar: Energy sector assessment, strategy, and road map report that there is potential for significant energy savings through the introduction of MEPS and energy labelling schemes (Paing, Aye, Yee, & Thaw, 2015).
3.7 Philippines
Since 1994, the Philippine government has introduced the Philippine national standard (PNS) 396 on household appliances. It specifies the energy efficiency standard and labelling requirements for room air conditioners (RAC) sold in the country. PNS 396 serves as the legal basis for the energy labelling of RACs. It was formulated and developed by the Technical Committee on Household Appliances (TC-30) comprising representatives from the Association of Home Appliance Manufacturers, Kilusang Mamimili ng Pilipinas (market representatives), professional organisations, the Bureau of Product Standards, the Department of Energy and other concerned government agencies. Manufacturers, assemblers and importers of RACs are required to adhere to energy efficiency standards set by the Philippine government and display an energy label to allow consumers to compare RACs based on energy efficiency. It has also expanded to include refrigerators, lamps and fluorescent lamps. The label

Sustainable consumption and production 33
focuses on the energy efficiency of that product using measurements such as light output, power consumption, average life and the energy efficacy factor. It does not use stars or ticks like the other labels in ASEAN (DOE, Standard for Energy Efficiency Ratio and Labeling Requirements, 2019; DOE, Lighting and Appliance Labelling Standard, 2019).
Figure 5: Philippine energy efficiency label for air conditioners
Figure 6: Philippine energy efficiency label for refrigerators

Sustainable consumption and production34
Figure 7: Philippine energy efficiency label for fluorescent lamps
Figure 8: Philippine energy efficiency label for lamp ballasts
3.8 Singapore
The National Environmental Agency of Singapore (NEA) sets the mandatory energy labelling and MEPS to encourage more households to choose energy-efficient appliances with low life cycle cost. This initiative helps families to reduce utility bills and GHG emissions. The label is mandatory to supply regulated goods in Singapore, and this includes refrigerators, dryers, televisions, lamps, air conditioners and induction motors. NEA uses a tick system from one to five, one to four (refrigerators) or one to three (lamps). (NEA, 2019; TODAY Singapore, 2014)

Sustainable consumption and production 35
Figure 9: Singapore energy efficiency label for air-conditioner, refrigerator, clothes dryer and television
Figure 10: Singapore energy efficiency label for lamps
3.9 Thailand
Energy efficiency labelling by the Electricity Generating Authority of Thailand was introduced in 1994 for refrigerators and has expanded since then to include 24 more electrical products. As of 2015, 272 million energy-efficient products have been labelled. The project named Label No. 5, seeks to continuously improve the testing and requirements of Label No. 5 electrical appliances to reach global standards. The objective of the program is to inform consumers that No. 5 labelled appliances are highly energy-efficient and thus reduce their electricity bills. This will also enhance competition among manufacturers to further improve the energy efficiency of their products. There are tax incentives and subsidies for energy-efficient products (25% tax credit from the purchase of mostly label No. 5 products). The old Label No.5 uses a rating scale of one to five, the new label uses a rating scale of four levels: No. 5, No. 5 ★, No. 5 ★★ and No. 5 ★★★. It also emphasises on the electricity bill more(Electricity Generating Authority of Thailand, 2015; Chaichinda, 2013).

Sustainable consumption and production36
Figure 11: Thailand energy efficiency No.5 label (1: Energy efficiency level, the highest efficiency is 3 stars, 2: Indicates the type of product that has been certified, 3: Electricity bill per year to compare and estimate electricity usage, 4: Performance value for comparison with other products of similar size, 5: Product information, including brand, name, model, size, to be able to check the preliminary, 6: website of the Electricity Saving Label Project
No. 5)
3.10 Vietnam
Under the National Energy Efficiency Program (VNEEP), managed by the Ministry of Industry and Trade (MOIT), energy efficiency labelling has become mandatory since 1 July 2013 for four groups of products, namely, household appliances, office equipment, industrial equipment and road transport facilities. These include fluorescent lighting, compact fluorescent lighting, air-conditioning systems, refrigerators, washing machines, electric rice cookers, television sets and fans. Unlike other countries with one energy efficiency label, Vietnam’s label includes two main parts. The first part is to identify the energy-efficient products and the second one is used for rating energy saving (Vibol & Kunthy, 2014).

Sustainable consumption and production 37
Figure 12: Vietnam energy efficiency label
Discussion:In comparison to carbon footprinting of consumer goods, there is clear labelling, measurement and tracking of energy consumption with 6 out of 10 ASEAN states adopting and enforcing these standards. Brunei and Laos have plans to implement energy efficiency labels, while Cambodia and Myanmar have no plans to do so. The ASEAN Energy and Conservation Sub-Sector Network (EE&C-SSN) could work with these four countries as part of its target to achieve energy intensity reduction in ASEAN by 30% by 2025.
While energy intensity reduction can help decrease carbon emissions, greater focus and diversification of energy sources via renewables can also help to mitigate carbon emissions (Dogan & Seker, 2016). Carbon emissions were found to increase with GDP and energy consumption, as ASEAN continues to grow, it is likely that carbon emissions would continue to increase as well.
Thus renewable energy sources may help to avert this future through replacing old traditional energy sources such as coal, gas and oil and reducing carbon emissions in the process, ensuring sustainable economic development. (Waheed, Sarwar, & Wei, 2019; Long, Naminse, Du, & Zhuang, 2012; Khan, Khan, & Rehan, 2020)
As the ACE continues to help with the process of helping all ASEAN states adopt energy efficiency labels and standards, perhaps the ASEAN Working Group on Climate Change (AWGCC) can help to focus on carbon footprint labels and encourage ASEAN member states to adopt such labels.

04RECYCLING

Sustainable consumption and production 394. Recycling
The majority of the ASEAN countries have policies in place aimed at reducing waste and encouraging recycling rates of recyclables except for Cambodia. Laos’ policy for recycling is still in development as the government is currently focusing its efforts on developing a national waste management strategy and infrastructure. Brunei, Indonesia, Malaysia, Philippines, Singapore, Thailand and Vietnam have programs in place to increase recycling rates as well. However, current waste management and recycling infrastructures in ASEAN are not enough to keep up with the increasing volume of waste generated annually. All ASEAN states have already banned or are planning to ban imports on waste including plastic from 2021 to 2030 onwards. This year, Cambodia, Indonesia, Malaysia and Philippines have sent back illegal foreign trash imports back to their originating countries citing health and environmental concerns. This unlawful dumping of waste has worsened since China stopped accepting waste imports from developed countries in early 2018. Southeast Asian and East Asian countries have now become landfills for illegal waste.
Plastic is labelled with a number from one to seven according to Resin Identification Codes (RIC). The strongest recycling markets are for those numbered one and two, and to a lesser extent, number five. Number one is polyethylene terephthalate, or PET: things like clear plastic water bottles or colour sorted plastic soda bottles. High-density polyethylene, or HDPE, is stamped with the number two, and includes milk jugs, detergent, and oil bottles. Number five plastic is polypropylene, or PP, a tough, lightweight plastic used to make things like buckets, the plastic liners inside cereal boxes, yogurt containers, and plastic bottle tops. The global recycled plastic market is dominated by four major plastic resin types, namely PET (1), HDPE (2), PP (5) and LDPE (4 Low-density polyethylene) (Locock, et al., 2017). Often, developed countries focus on recycling the higher quality recyclables (1, 2, 5) and export the rest of the plastic to less developed countries (3, 4, 6, 7). These plastics that are more difficult and expensive to sort and process and contain toxic additives, are now re-directed towards Southeast Asian countries as China has now stopped accepting them (GAIA, 2019).
A 2019 report by the Global Alliance for Incinerator Alternatives (GAIA) explores this plastic crisis in Southeast Asia, focusing on the following countries, Indonesia, Malaysia and Thailand. The report highlights the negative and positive impacts the flood of imported plastic has brought and shows how this issue has impacted whole communities. While some have benefitted from the increase in economic investment and the supply of recycled plastics, others have had their livelihoods and quality of life adversely affected. Land, water and air pollution stemming from the plastic waste itself and processing of the waste has transformed once relatively clean and green villages into waste landfills (GAIA, 2019).
4.1 Brunei
In Brunei, recycling collection is carried out by private companies who export it to other countries as there is a lack of recycling facilities locally (Wong, 2017; Wasil, 2018; Brunei, 2019). There is no specific legal act or government order in place regulating the management of recyclable materials; however, imports of plastic waste is strictly prohibited. The recycling of plastics comes under the Environmental Protection and Management Order (2016), the Customs Order (2006) and the Workplace Health and Safety Order (2009). Extended producer responsibility schemes remain voluntary. The government has set a target to achieve a 15% recycling rate by 2020 and a 30% recycling rate by 2035 and encourages citizens to practice source separation for recyclable materials. Some government initiatives include awareness and education campaigns and installing collection infrastructure such as communal waste
Sustainable consumption and production40
collection centres. The Ministry of Development’s Department of Environment, Parks and Recreation, published a recycling handbook in 2015 that explained the importance of recycling and its methods. It also provided a list of recycling companies that accept recyclable waste from the public. Both public and private operators agree that plastic bottles as the most common recovered plastic material. The largest district in Brunei (Muara District, home to 80% of Brunei’s population), have separate recycling bins installed and the government aims to introduce this to all remaining districts gradually.
The lack of integration among the different components of the recycling system impedes the scaling-up of recycling. For example, even though residents may dispose of recyclables separately at waste collection centres, transport companies may mix up the waste and cause contamination. Furthermore, there is a lack of data on waste management and recycling, making it difficult to determine future actions to improve recycling policy and infrastructure. The widespread use of single-use plastic by smaller businesses and local convenience stalls also poses a challenge to improving recycling practices (Akenji, et al., 2019).
4.2 Cambodia
The Ministry of Environment is designated by Cambodia’s law on Environmental Protection and Natural Resource Management (1996), as the leading agency with regards to waste management and pollution control. There is currently no official recycling policy, program or infrastructure in Cambodia but there is an informal developed system of waste pickers and craft villages which scavenge and pick out recyclable waste to sell or make into new products. These informal recyclers contribute to Cambodia’s recycling rate of 11%. As part of the 2018 Waste Management Strategy and Action Plan of Phnom Penh 2018-2023, the promotion of recycling through waste separation, the involvement of the private recycling sector and encouraging the use of recyclables forms one part of its action areas. The government aims to enhance the city’s recycling capacity by facilitating the creation of the domestic recycling industry. Currently, recycling activities are still limited, and the government is looking to attract both investment and private recyclers while raising consumer awareness (PPCA, IGES, Environment, & CCCA, 2018; Jeronimo, 2019).
This action plan seems to be built on Cambodia’s national strategy on 3R for waste management, which has been formulated since 2008. The action plan aims to reduce, reuse and recycle waste and products while staying economically feasible. The strategy outlines two targets related to recycling:
1. By 2015, solid waste separation for recycling purpose should be between 10 to 20% forhousehold, 30 to 40% for business areas, and 50% for industrial wastes, while organic wastecomposting is about 20% for household organic wastes (including business centers); and
2. By 2020, solid waste separation for recycling purpose should be increased to 50% for householdswaste, 70% for business areas, and 80% for industrial wastes, while waste composting shouldbe increased double to 40% for household organic wastes, and 50% for organic wastes frombusiness centres.
However, it is difficult to assess the above targets as there is no formal assessment or survey on 3R practices in the country. Recycling in the country is also limited and the domestic recycling industry is underdeveloped. While as much as 19.5% of plastic waste was found to be collected in Phnom Penh and exported for recycling in 2005, the industry is still hindered by a largely monopolistic market,

Sustainable consumption and production 41
dominated by several major export firms and limited by appropriate recycling infrastructure. The lack of distinctive and/or overlapping roles and responsibilities for district government, municipal authorities and relevant ministries makes it challenging to coordinate actions in addressing plastic waste and enforcing laws and regulations on waste. Budgetary, technical and capacity related constraints and lack of technically competent officers hinder the improvement of waste management and recycling practices. Lastly, data on the recycling industry is often inconsistent and unverifiable (Akenji, et al., 2019; Sethy, 2017).
4.3 Indonesia
There are three national regulations/laws that are related to recycling efforts in Indonesia:
1. Law no. 18/2008 regarding Domestic Solid Waste Management
2. Law no. 32/2009 regarding Environmental Protection and Management
3. Government regulation no. 81/2012 regarding household solid waste management
Law no. 18/2008 focuses on the responsibility of the national and local governments in building and maintaining safe and effective recycling facilities and the implementation of waste management. One of the essential mandates in this law is the implementation of waste separation as the first step of waste recycling. In addition, the government and regional government have to facilitate the activities of reusing and recycling, and the market for recycled products. The government has to provide incentives and disincentives to encourage waste reduction, which includes recycling. Compensation for damaged parties due to illegal and unsafe waste management practices is also to be managed by the government. The government also manages licensing for the waste management business (ILO, 2008).
Law no. 32/2009 aims to create environmentally sustainable development through means of an environmental planning policy, and the rational exploitation, development, maintenance, restoration, supervision and control of the environment. Both Law no. 32/2009 and Law no. 18/2008 manage the licensing and permit system for waste management, including reuse, recycling and recovery. The laws also prohibit the import of waste into the country unless it is a non-hazardous waste imported as raw material for the recycling industry. Some examples include cotton, rubber, plastic and paper scrap. Under these laws, the government also implements programs that encourage the business sectors that generate hazardous waste to exercise the 3R principles and recycle their waste (ECOLEX, 2009).
The Government Regulation no. 81/2012 regulates more specific 3Rs and mandates that extended producer responsibility (EPR) is compulsory. The mandates that waste minimisation adopts a 3R approach and that handling of waste must be done early as possible at its sources so that it may provide value and potential economic benefits. Waste materials not listed in the regulation above, such as non-hazardous industrial waste, agriculture waste, etc. are considered for recycling.
Currently, only 7.5% of MSW in Indonesia is recycled or composted. There are two main recycling flows, in the first, collectors, including those in the informal sectors, collect recyclable materials at sources and in the second, these materials are separated and recycled by the municipality after MSW collection. Recycling activities in this context are all activities of reusing objects that were previously called “waste”, either by directly self-reusing or by selling to waste traders. The Ministry of Environmental

Sustainable consumption and production42
and Forestry (MEF) has built on these existing policies and regulations to conduct programmes that encourage recycling. These include developing the implementation of community and city base 3Rs and waste banks that educate the public in waste reduction through waste separation and saving for recycling purposes, allowing them to earn income at the same time. This is supported by Ministry Regulation no. 13/2012, which lays out guidelines for the 3Rs through Waste Banks. To date, MEF has facilitated the construction of 1,195 Waste Banks distributed across 55 regions and cities in Indonesia.
At the city level, the government works with the Ministry of Public works and Housing (MPWH) to help the local government. The authority helps the local government to transport waste to material recovery facilities known as TPS-3R (transfer point for MSW with recycling activity) and integrated MSW treatment centres known as TPST, which carry out recycling and composting. Through the waste handling policy of the ministry, in small towns and medium cities, half of MSW is processed in material recovery facilities, and in large and metropolitan cities, a quarter is processed in TPS3R and TPST each and the remaining 50% of all MSW is directed to the landfill. From 2007 to 2015, the central government helped build 595 TPS-3R and 3 TPSTs. The ministry aims to increase the number of TPS-3Rs to 47,329 by 2020. However, an evaluation carried out in 2015 found that out of 146 of TPS-3R located at Java, Sumatra and Kalimantan, only 12% of them were functioning, while 41% fell into the unused category (Sudibyo, Pradana, Budiman, & Budhijanto, 2017).
There are independent initiatives to reduce plastic in different Indonesian cities, but there is no national policy that mandates the reduction of plastic through consumers. A pilot program in 2016 to charge consumers for plastic shopping bags was successful, leading to a decrease of 55% waste and 40% plastic refusal; however, it failed to continue due to the unwillingness of participating retailers to continue. Indonesia is looking to apply the extended producer responsibility concept by giving more responsibility to the manufacturing industry, fast-moving consumer goods (FMCG) and retailers in reducing plastic waste from their products and services through product packaging redesign, use of recyclable materials, and waste management. However, this has not been confirmed yet (Ismail, Indonesia’s plastic action, 2018). Indonesian ministry has proposed a fiscal incentive to encourage the recycling industry by reducing value-added tax (VAT) by 5%, but this has not been confirmed yet (Novastria, 2019).
Indonesia has established several key policies and strategies on waste management, recently also targeting the plastics issue through the National Action Plan on Marine Debris (2017-2025). However, research showed that due to a lack of skills and knowledge, these policies have not been put into practice. While there is a need to develop more evidence-based policymaking, this process is disrupted by a deficit of available data on waste generation and management (including marine litter data and recycling sectors/activities) and poorly centralised database on waste generation and management (Akenji, et al., 2019; Damanhuri, 2017).
4.4 Laos
Enacted in 2012, the Environmental Protection Law (EPL) No 29/NA is the basic law on environmental protection and states that general waste should be separated to allow reuse and recycling. There are no other policies and regulations that support waste to resource approaches or the principles of 3Rs. The Ministry of Natural Resources and Environment (MoNRE) and the Ministry of Public Works and Transport (MPWT) oversee solid waste management and recycling in Laos, while the main

Sustainable consumption and production 43
responsibilities are delegated to provincial authorities and district offices. At the provincial level, the national ministries have more of a regulatory, supervisory and supporting role, as the Urban Development Administrative Authorities (UDDAs) oversee solid waste management issues. At the local level in capital city, the Vientiane City Office for Management and Service (VCOMS) is responsible.
There are no official statistics for national recycling rates but in 2011, a survey conducted in Vientiane found a 8.7% recycling rate. The informal waste management sector has both informal and formal stakeholders. The informal sector consists of waste pickers, scavengers and VCOMS workers who collect and sell recyclables while working within the premises of waste collection and transfer facilities and landfills. Waste pickers and scavengers often collect recyclables from source and sell them on the same day to buying centres. And because, just like India and other developing countries, the waste pickers are not part of the formalised economy, they are usually deprived of the mechanisms that protect them from world market fluctuations or declining prices. That makes them very vulnerable to exploitation. The VCOMS workers, who collect recyclables from mixed waste, recover soiled plastics which sell for a lesser cost than clear and clean plastics.
The formal sector includes recycling buying centres, recycling workshops and processing companies, which are legally licensed to operate and conduct profit-driven activities with recyclables. Recyclables sold to buying centres are either processed by local small and medium enterprises that carry out some sort of processing/treatment of recyclables or exported to neighbouring countries for final processing or treatment, in particular China and Vietnam. While these enterprises can churn out raw materials for other industries, the manufacturing processes of these companies tend to be relatively simple and rudimentary, and thus adding limited value to the recyclables value chain.
In general, there is a lack of awareness from the population at large on 3R principles as well as the lack of policy and regulatory framework to support recycling activities in Laos. Due to the lack of national recyclable processing industries, all stakeholders in the value chain are vulnerable to market price instability. Low waste collection coverage, low frequency of waste collection services, lack of segregation practices and limited infrastructure to segregate and store recyclable materials limits the volume of clean recyclables that can be obtained. Presently, most of the manpower efforts are spent on collection and segregation (Akenji, et al., 2019; Storey, et al., 2018).
4.5 Malaysia
3R campaigns and initiatives in Malaysia started as early as the late 1980s and focused on recycling activities but were unsuccessful in improving existing waste management practices. In 2000, the National Recycling program (2001-2005) was formally launched in 2000 as part of the 8th Malaysia plan in response to reduce Malaysia’s dependence on landfills due to its population density. This was launched together with Policy for Integrated Solid Waste Management in Malaysia in 2001, National Strategic Plan for Solid Waste Management in Malaysia in 2005 and Master Plan on National Waste Minimization in 2006 (Sreenivasan, Govindan, Chinnasami, & Kadiresu, 2012). The National Recycling program (2001-2005) had the following objectives:
1. Inculcate the habit of recycling among the population.
2. Reduce operational cost of solid waste management.
3. Minimize the volumes of waste disposal by landfills.
Sustainable consumption and production44
4. Reduce utilisation of raw materials.
5. Improve awareness and cooperation among stakeholders.
6. 20% recycling rate of total generated waste by 2020 (Jereme, Siwar, & MahmudulAlam, 2015).
In 2007, the Solid Waste and Public Cleansing Management Corporation Act (Act 672) was approved by Parliament and implemented through the National Solid Waste Management Policy (NSWMP) with the following goals:
1. To build a solid waste management system that is holistic, cost-effective, socially acceptable andsustainable.
2. To implement solid waste management based on the hierarchy of solid waste which emphasiseson waste reduction through the concept of 3Rs (Reduce, Reuse, Recycling).
3. Inculcate public awareness for sustainable management of public waste, cleansing and recycling.
4. Improve and implement recycling technology (Sreenivasan, Govindan, Chinnasami, & Kadiresu,2012).
This policy places emphasis on source separation activities by households as those who fail to comply with the legislation is fined. It enables the government to establish extended producer responsibility, mandate the use of recyclable materials and restrict the use of certain materials in manufacturing (Akenji, et al., 2019). As part of the strategic thrust of the third outline perspective of the Malaysian solid waste plan, the government will not only consider the installation of incinerators for safe and efficient disposal of waste but will also formulate strategies for waste reduction, reuse and recycling as part of a comprehensive waste management policy. There are six components of this policy:
1. Determination of solid waste management priorities (Reduce, Reuse, Recover, and Disposal).
2. Rapid and comprehensive development of the necessary legal and institutional framework(adoption of privatisation policy for solid waste management services).
3. Development of public participation in solid waste management.
4. Provision of sustainable technologies to manage solid waste in Malaysia (the technologiesused are affordability, operated by skilled workers, and consider local conditions andenvironment).
5. A comprehensive approach to developing the waste reduction, reuse, recovery elements ofsolid waste management (full participant from all main players).
6. A socially acceptable solid waste management system that calls for substantial initialgovernment intervention with a gradual shift towards full cost recovery (a financial plan thatmeets urgent requirements without social inequalities and full cost recovery by the year2020) (Yahaya, 2008).
However, due to weak governance among the stakeholders, including the Ministry of Urban Welling, Housing and Local Government, Department of National Solid Waste Management, Solid Waste Corporation and the concession company, the objectives of NSWMP has failed to materialise. The solid waste management facilities were unhygienic, exposing the workers to the risk of diseases and affecting their quality of life. In addition, the recycling rate among Malaysians is still low at 15% compared to the neighbouring countries such as Singapore and Thailand. The most common recyclables collected in Malaysia are old newspapers, glass bottles, plastic PET bottles, aluminium tin cans, vehicle tires, and food waste. The recyclables market in Malaysia is largely privatised and seasonal and in nature,

Sustainable consumption and production 45
thus prices fluctuate according to demands. This leads to feedstock problems as collectors and traders accumulate recyclables while waiting for the optimal selling price. In 1996, and again in 2000, the government launched various campaigns and programs to create awareness on the 3R programme. Despite the government’s efforts, the public reception has been relatively poor (Akenji, et al., 2019; Pariatamby, 2017).
As mentioned previously, China’s ban on waste imports in 2018 has caused an increase of low quality, contaminated and sometimes illegal plastic waste imports into ASEAN. Significantly, Malaysia is affected by this as waste imports from G7 countries has tripled, from 128,000 tonnes in 2017 to 461,000 tons in 2018. According to a report by Plastic Atlas (2019), plastic imports have increased by six-fold and almost 40 illegal recycling factories have been constructed, discarding toxic wastewater into waterways and contaminating the air with burning plastic fumes. In 2018, Malaysia was the top importer of plastic waste in the world, importing 10.7% of world plastic waste. Even as increasing volumes of domestic plastic waste continue to put pressure on existing waste management systems, the country primarily treats imported waste despite having a large plastic recycling industry with considerable levels of associated expertise (Heinrich-Böll-Stiftung, 2019).
4.6 Myanmar
Recycling activities are carried out in many cities in Myanmar mostly by the informal sector. This includes waste pickers and collectors, operators of collection facilities and wholesale vendor operators, small mills and factories that make use of recovered materials, delivery operations and retail of recovered, remanufactured and/or recycled products. These collectors collect recyclable materials such as newspapers, metal, plastic bottles, tin and glass from households, communal depots, streets, commercial areas and final disposal sites. They sell these collected items to waste dealers who subsequently clean, sort, store and sell them in bulk to the recycling industry both locally and for export.
Currently, there is a lack of recycling and waste management framework, infrastructure and implementation in Myanmar, leading to poor waste management practices. This has caused several environmental and public health issues in Myanmar. The lack of proper collection, transportation and disposal systems, results in most of the generated waste becoming pollution, contaminating the country’s open lands, channels and rivers. Soil and water contamination has been linked to leachate from unmanaged disposal sites. Open burning of waste often occurs at these unmanaged disposal sites as well, resulting in air pollution. Resource recovery can help to decelerate the depletion of raw materials and increasing cost, as such failure to make use of recyclables represents a missed opportunity. These issues coupled with inconsistencies in institutional ability and associated financial constraints guided Myanmar’s decision to assert waste management as a crucial planning and policy priority (Akenji, et al., 2019, ECD & MoNREC, 2017; Thien, et al., 2018; Maw, 2018).
Myanmar has developed a National Waste Management Strategy and Action plan from 2017 to 2030, which includes the goal of developing a conducive policy framework and strategies and capacity for sustainable and environmentally sound management of industrial and other hazardous wastes based on waste hierarchy and 3Rs.
There are two main targets:

Sustainable consumption and production46
1. Mandate separate collection and sound treatment of hazardous waste, including infectionmedical waste from non-hazardous waste in 100% of all townships within the next 8-12 years.
2. Mandate sound collection and environmentally friendly treatment of all industrial waste in100% of all townships within the next 8-12 years.
There are also two specific targets related to recycling:1. C.2.3: Develop national standards for cities with a view to promoting waste minimisation, reuse,
recycle, and recovery of waste materials.2. C.2.10: Study and develop strategies/standards for various waste treatment/recovery options
that cannot be reused or recycled, including biogas projects and methane gas from landfills, aswell as thermal treatment; by introducing financial incentives such as tipping fees and renewableenergy feed-in tariff and sound empirical standards for air emissions/water effluents aimed atmitigating the impact on human health and the environment.
One proposed activity to achieve these targets includes: Introduce proper recycling laws and cleaner production practices to reduce waste at source. The recycling laws designate target industries and products. Within these voluntary efforts, the law states that 3R measures should be used during the stages of product design and manufacturing that companies should use identification labelling to enable the classification of waste for collection, and those business operators should voluntarily formulate collection and recycling systems. The laws were designed to promote recycling according to the articles’ properties or state of waste generation. The details of these systems vary with the individual laws. These laws clarify the role sharing, obligations, and cost burdens of relevant parties, such as the manufacturers, retailers, consumers, waste generators, disposers and local governments. They also set targets for recycling. The laws include special exceptions for those who dispose of wastes in accordance with the law. The enactment and enforcement of these laws have significantly increased the rate of recycling of the articles they target (Akenji, et al., 2019; ECD & MoNREC, 2017).
Another goal is to substantively reduce waste through 3Rs (reduce, reuse, recycling) and thereby establish a circular resource society. There are three targets:
1. Mandate the development of city waste management strategies and action plans with actualwaste reduction targets by all City Development Committees (CDCs) and Township DevelopmentCommittees (TDCs) by 80% within the next 8-12 years.
2. Mandate the introduction of targets for diverting the food waste from landfills by 60% withinthe next 8-12 years.
3. Mandate the separate collection and set waste recycling targets for industrial, medical andother waste by 60% within the next 8-12 years.
Some proposed activities to achieve these targets include:1. Mandate Extended Producer Responsibility (EPR) to enforce industries to take responsibility
for the lifecycle of products that they produce, including establishing methods and fundingmechanisms to manage the products once they become waste, and setting targets for reuse,recycling or recovery.
2. Develop national standards for cities to promote waste minimisation, reuse, recycle, andrecovery of waste materials.
3. Build on existing small-scale entrepreneurial recycling by integrating the informal recyclingwithin the mainstream waste management sector.
4. Promote nationally coordinated awareness campaigns, which support separation at source of

Sustainable consumption and production 47
recyclables from the domestic waste stream among all households, businesses and organisations. (ECD & MoNREC, 2017; Gamaralalage, Hengesbaugh, Onogawa, & Hlaing, 2017)
Myanmar faces some challenges with regards to implementing the above policy; these include:
1. Limited government financial support and skilled human resources for municipal solid wastemanagement systems. Inadequate capacity and knowledge on proper treatment technologiesand infrastructure coupled with exploitation of existing resources contribute to gaps in wastemanagement service provision. This leads to a lack of confidence in the private sector, whichhinders business investment in waste management systems.
2. Fragmented responsibilities and lack of coordination across ministries and departments, levelsof government (central, regional, and townships) and cities. This leads to weak enforcementof existing legislation, mismanagement of waste and inadequate monitoring and evaluation ofwaste management practices.
3. A lack of available and reliable data on waste generation and management makes it difficult forpolicymakers to develop evidence-based policies to tackle waste management issues. Data isnot readily available to policymakers and relevant stakeholders as centralised information onwaste generation and management are lacking.
4. Limited capacity, expertise and financial and technical capabilities in adapting, obtaining andresearching suitable technologies for local waste management systems.
(Akenji, et al., 2019, ECD & MoNREC, 2017; Gamaralalage, Hengesbaugh, Onogawa, & Hlaing, 2017)
4.7 Philippines
The Department of Environment and Natural Resources (DENR) is the central ministry in charge of waste management and recycling issues. In 2000, the Philippine government enacted the Republic Act 9003, also known as the Ecological Solid Waste Management Act of 2000. This law mandated city and municipal governments to organise and sustainably manage the collection and disposal of solid waste. It also directed the closure of dumpsites and created the National Solid Waste Management Commission to oversee the law’s implementation. There are a few features within the law related to recycling, namely:
1. Establishment of material recovery facilities (MRFs) in each village/ward/district or cluster, forfurther sorting, resource recovery, and storage.
2. Local 10-year plans for collection and treatment, to be updated regularly and approved by thenational regulating authority.
3. Responsibility for waste collection and treatment is delegated to the local level – localgovernment units (LGUs) and neighbourhoods/villages (barangays).
4. Establishment of a National Solid Waste Management Commission (NSWMC) with broadmembership to oversee the implementation and to provide guidance as well as financial andtechnical support to the local level.

Sustainable consumption and production48
The law also mentions that there must be three representatives from the private sector as part of the National Solid Waste Management Commission:
1. A representative from non-government organisations (NGOs) whose principal purpose is topromote recycling and the protection of air and water quality.
2. A representative from the recycling industry.
3. A representative from the manufacturing or packaging industry.
The commission must develop and implement a program to assist local government units in the identification of markets for materials diverted from disposal facilities through reuse, recycling, and composting, and other environment-friendly methods. Develop and implement a program to assist local government units in the identification of markets for materials diverted from disposal facilities through reuse, recycling, and composting, and other environment-friendly methods. Encourage all local government agencies and all local government units to patronise products manufactured using recycled and recyclable materials. Propose and adopt regulations requiring the source separation and post-separation collection, segregated collection, processing, marketing and sale of organic and designated recyclable material generated in each local government unit (IBP USA, 2012).
Local Government Units are mandated to conduct waste characterisation to encourage initial source reduction and a recycling element for a local waste management plan. Municipal solid waste mostly comes from household and commercial establishments, where an estimated 28% is recyclables. Encouraging initial source segregation for households and establishments presents an excellent potential for composting and recycling industries. Local Government Units are primarily responsible for the implementation and enforcement of the provisions of RA 9003 within their respective jurisdictions. These include source segregation of solid waste (Section 21) and the creation of material recovery facility (MRF) in every barangay or cluster of barangays (Section 32). The barangay is responsible for the collection of the segregated biodegradable and recyclable waste. The law also requires at least 25% of all solid wastes from waste-disposal facilities to be diverted or recovered through resource-recovery activities. While this target has been met as solid waste diversion rate is 46% on average in 2015, there is no available data for recycling rates in the country. Furthermore, there are still more than 900 open dumpsites across the country due to weak implementation by officials and corruption encouraged by funds earmarked for waste disposal. More than 20% of the Philippines trash ends up in the ocean annually as a result (IBP USA, 2012; Vila, 2018).
The formal recycling industry for plastics in the Philippines is small and most plastic waste is exported for recycling. In 2018, exports amounted to around 65,000 tonnes, while imports reached 11,800 tonnes. Plastic bottles made of PET and sometimes HDPE are the main type of plastic waste collected for recycling, as these plastics are not only highly available, there is also an existing market demand, making collection economically attractive. Junkshops, waste dealers, and processors make up the informal network of collectors, often well established in urban areas. In rural areas, collecting recyclables is not economically attractive due to high transport cost, and they end up in dumpsites or get burned together with general waste that has no value. Overall, there exists a shortage of data on plastic consumption, post-use collection, and treatment, as well as on recycling operations. There are currently 23 companies listed on the National Solid Waste Management Commission for recycling enterprises that work with plastic; however, not all plastic handled by these companies may be recycled domestically (Akenji, et al., 2019; Atienza, 2017; SEPO, 2017).
Sustainable consumption and production 49
4.8 Singapore
The National Environment Agency is the main ministry tasked with waste management and recycling. The government introduced the Resource Sustainability Act in 2019 with the following purposes:
1. To implement a framework where persons who profit from the supply of products bear the costof collecting and treating these products when they become waste.
2. To encourage producers of packaging to reduce, reuse or recycle packaging.
3. To enable proper segregation and treatment of food waste.
The act introduces a regulatory framework on producers upstream, compelling businesses to recover resources from waste, specifically e-waste, packaging waste, and food waste. The Act also authorises the National Environment Agency officers with powers to enforce the new regulations and penalties for future offenders. Specifically, producers of specific packaging that have an annual turnover of over S$10 million, are required to report data on packaging (Clause 20 of Part 4):
1. A producer required by section 20 to submit a report under that section must also submit a planto the Agency to reduce, reuse or recycle packaging in Singapore (whether or not the packagingis imported or used by the producer).
2. Without affecting section 52, a plan to reduce, reuse or recycle packaging under subsection (1)must include information on the implementation of any part of the plan.
In April 2001, a national recycling programme was launched that requires licensed public waste collectors to provide recycling bins and recycling collection services to all HDB estates, and private landed properties and condominiums/private apartments opted into the public waste collection scheme. Paper, plastic, glass and metal recyclables are deposited into the same blue recycling bin and mixed recyclables are collected one to three times a week by dedicated recycling trucks and sent to Materials Recovery Facilities (MRF) for sorting. After sorting, the recyclable materials are sent to recycling facilities for further processing. While recycling is not mandatory in Singapore, the government has embarked on several initiatives to encourage recycling. These include improving the current recycling bins to reflect recycling instructions, social media campaigns to raise awareness and to roll out reverse vending machines that accept empty drink cans and plastic bottles in exchange for discount vouchers (Liu, 2019; NEA, 2019; NEA, 2001).
In 2018, the overall recycling rate stood at 60%, mostly contributed by high recycling rates (70-99%) of construction debris, ferrous metal, non-ferrous metals, used slag, scrap tyres, and horticultural waste. However, these waste types only make up 5.7% of total waste in Singapore. Plastics is the biggest contributor of waste in tons and makes up 29.6% of Singapore’s waste, and food is next with 20.8%. Only 17% of food waste and 4% of plastics were recycled (Figure 13). In 2019, the recycling rate for plastic had increased to 7% (NEA, 2018; Goh, 2019). While Singapore has various local recyclers and collectors, about 30% of recyclable waste is exported to countries including Australia, China, India, Indonesia, Malaysia, South Korea and Thailand for processing and recycling. Singapore aims to achieve a recycling rate of 70% by 2030 and has launched the Zero-Waste Masterplan in 2019 to work towards this goal.

Sustainable consumption and production50
Waster Type Total Disposed(tonnes)
Total Recycled(tonnes)
Total Generated(tonnes)
RecyclingRate
Construction debris 6,600 1,617,900 1,624,500 99%Ferrous metal 9,300 1,260,200 1,269,500 99%Non-ferrous metal 1,700 169,600 171,300 99%Used slag 2,300 178,900 181,200 99%Scrap tyres 3,200 29,300 32,500 90%Horticultural 151,100 370,100 521,200 71%Wood 131,800 187,900 319,700 59%Paper/Cardboard 467,400 586,400 1,053,800 56%Glass 51,500 12,200 63,700 19%Food 636,900 126,200 763,100 17%Ash and sludge 215,200 24,600 239,800 10%Textile/Leather 205,800 14,000 219,800 6%Plastic 908,600 40,700 949,300 4%Others (stones, ceramic, rubber, etc.) 274,300 11,400 285,700 4%Total 3,065,700 4,629,400 7,695,100 60%
Figure 13: 2018 recycling statistics in Singapore (NEA, Waste Statistics and Overall Recycling, 2018)
The Zero-Waste Masterplan maps out Singapore’s key strategies to build a sustainable, resource-efficient and climate-resilient nation. This includes adopting a circular economy approach to waste and resource management practices and shifting towards more sustainable production and consumption. A circular economy is one which maximises the value of resources by keeping them in use for as long as possible. Some features include:
1. New recycling labels that will convey more explicitly what can and cannot be placed in the binsto prevent cross-contamination increase sorting efficiency.
2. Recycling trucks in Singapore will be refreshed with a new and identical design and help thepublic to readily identify and differentiate them from the waste collection vehicles.
3. Resource Sustainability Bill that includes the following targets:
• Mandatory packaging reporting by 2020.
• Extended producer responsibility for electronic waste by 2021.
• Mandatory food waste segregation treatment by 2024.
• Extended producer responsibility for packaging, including plastics, before 2025.
4. Towards Zero Waste Grant (TZWG) has been created to support ground-up initiatives that drivewaste reduction and recycling in any of the three key waste streams. They are packaging waste,food waste and electrical and electronic waste (e-waste). Households are encouraged to recyclemore and/or recycle right.
5. Closing the Waste Loop initiative funds projects to tackle the mounting problems of climatechange and mounting waste. Among these projects are initiatives to help recycle packagingwaste, specifically plastic-embedded multilayer films, such as those used to carry potato chips,and research into converting debris and waste from the Semakau Landfill into useful materials.

Sustainable consumption and production 51
In general, there is still low awareness and willingness of both consumers and producers with regards to convenience, product protection and food hygiene, resulting in excessive packaging. Singapore also lacks the capacity and technology to process contaminated plastics and multi-material packaging and enables plastics to be used more sustainably. The recycling market is also vulnerable to demand and supply forces, and recycled plastics may be of low value (Akenji, et al., 2019; Halimah Yacob, 2019; MEWR, 2019; Mohan, 2019; NEA, National Recycling Programme, 2020; NEA, Waste Statistics and Overall Recycling, 2018; Oh, 2019; Tan, 2019).
4.9 Thailand
The central ministries related to waste management and recycling in Thailand are the Ministry of Natural Resources and Environment (MONRE) - Pollution Control Department (PCD), Ministry of Interior - Local Authority (Municipal Solid Waste), Ministry of Industry - Industry (Industrial waste) and Ministry of Energy - Department of Alternative Energy Development and Efficiency (waste to energy). MONRE is responsible for coming up with overall policies, action plans, guidelines and information systems. The Ministry of Interior oversees municipal solid waste, while the Ministry of Industry oversees industrial waste. These ministries are part of the policy network for waste management in Thailand and can have a significant influence on other stakeholders in the network. This policy network sets the laws, policies and plans that encourage stakeholders such as plastic producers, waste generators, waste collectors and waste recyclers, to control the environmental issues that stem from each stakeholder. This is to achieve the goal of better waste management and recycling in Thailand.
The PCD has come up with the National 3R strategy to recycle 60% of plastic waste by the end of 2021. The ministry has also come up with the National Master Plan for Waste Management (2016–2021) and Plastic debris management plan (2017–2021). These three plans and strategies aim to promote reuse and recycle of waste through introducing environmental labels, capacity building on 3Rs and waste management through public involvement and cooperation between private and public sectors and increase efficiency of waste separation, collection, recovery and utilisation systems (Akenji, et al., 2019; Kamuang & Siriratpiriya, 2017).
In 2013, plastic recycling rate was estimated to be 9.6% out of total plastic production. In 2014, approximately 13.86% of total MSW was utilised for recycling. In 2015, about 20% of total MSW, 30.1% of non-hazardous Industrial waste and 12.7% of hazardous industrial waste were recovered or recycled. Solid waste remains a major environmental issue in Thailand as waste production from domestic and industrial sectors has rapidly increased, and effective waste management methodologies are not applied adequately. Land, air and visual pollution occur as effective treatment and disposal facilities and transport are lacking, leading to low collection coverage, illegal waste dumping and open burning (Wichai-utcha & Chavalparit, 2019).
Currently, the local administration organisation under the Ministry of Interior oversees municipal waste management and they provide waste collection services and disposal. The recycling industry in Thailand has both formal and informal actors. The former consists of waste generators such as households, the commercial sector and institutes who collect and sell their recyclable plastic waste to waste shops or waste recyclers. The informal sector collects the remaining plastic waste through picking and scavenging bins, transfer stations and landfills to sell to waste shops. Manual segregation at sources and dumpsites leads to inefficient segregation and recycling of waste. The PCD reported in

Sustainable consumption and production52
2016 that most waste, especially plastic, does not have high recyclability as 80% of plastic waste such as plastic bags and packaging are contaminated. The costs of eliminating, collecting and cleaning these types of waste are quite expensive. Current network analysis reveals that in the policy network, the local government, waste collectors, waste recyclers and waste shops play essential roles in plastic waste management in Thailand. Waste generators, research institutes/universities, and plastic producers have minor effects on plastic waste reduction/recycling (Akenji, et al., ; Wichai-utcha & Chavalparit, 2019; Styllis, 2018).
According to Akenji et al (2019) and Wichai & Chavalparit (2019), there are five key barriers to plastic waste recycling and management that hold the same for MSW:
1. Consumption patterns involving the high use of plastic in food containers that causescontamination
2. Lack of awareness and education for waste segregation at source and proper recycling practices
3. No requirement for plastic producers to provide a plastic resin identification code (SPI Codes) onplastic bottles/containers to allow for the efficient recycling of plastic waste
4. Limited financial incentives to recycle
5. Lack of efficient waste-collection management due to inadequate knowledge and expertise oflocal government staff and lack of support from the financial sector.
4.10 Vietnam
The main ministry responsible for waste management and recycling in Vietnam is the Ministry of Natural Resources and Environment (MONRE). There are two regulations related to recycling:
1. The Law on Environmental Protection 2014. Under the chapter on waste management(Chapter IX), Decree No. 38/2015/ND-CP on waste management and scraps requires sorting ofplastic waste in domestic solid waste and industrial solid waste for recycling; such waste mustbe managed from generation to collection, transportation and handling. Vietnam has specificlegal documents for plastic bags.
2. Resolution No.24-NQ/TW of June 03,2013. Active in response to climate change, improvementof natural resource management and environmental protection some features include:
• Promoting the reuse, recycling, production and recovery of energy from waste.
• Developing environment economics based on environmental industry, environmentalprotection services and waste recycling.
• Specific target by 2020: re-using or recycling over 65% of domestic waste.
• Forming several key scientific specialties including waste recycling.
• A roadmap by 2020 eliminating mechanisms and policies to support the price of fossil fuels,implementing subsidy for the first 10 years of project of developing new energy, renewableenergy, clean energy, waste recycling and power generation from waste.
3R approach has been introduced and institutionalized through several legislations such as the Law on Environmental Protection 2014, the National Strategy on Integrated Solid Waste Management to

Sustainable consumption and production 53
2025, vision to 2050, and the Party Resolution 24/NQ-TW. Waste reduction, reuse and recycling and limiting waste landfilling is emphasied as a priority in these policies (Vietnam Communist Party, 2013).
There is no official, consistent and scientifically-based data regarding the recycling rate of any kind of waste at the national level published by the government in Viet Nam. However, the National Environment Report 2011 estimated the recycling rate of MSW would be around 8-12% by volume. This recycling activity is implemented mainly by the informal sector in craft villages. According to a study in 2011, recyclable waste such as plastics, paper, and metal accounts for 8.2% of the total collected waste. Recycling is mostly carried out by the informal sector that consists of waste pickers, junkshop owners and small-scale recycling facilities mostly operated by craft villages. 0pp0Residents of these villages buy plastic from junk buyers or directly from waste pickers and process it into plastic pellets or film that is used to make new plastic products. Plastic pellets or plastic films are usually sold to factories in Ho Chi Minh City or China (Pearse, 2010; Thang, 2017).
These unofficial recycling facilities run by villagers pose many health problems through air and water pollution via the recycling process and its by-products. Waste picking of relatively high-value recyclable plastics is prominent in the recycling market of Viet Nam, due to a lack of formal recycling routes. Vietnam faces several challenges in waste management and recycling that mostly stem from the lack of complete policy on 3Rs and waste management. This results in weak implementation of relevant policies, lack of management systems, infrastructure, capacity and technologies. The recyclable market is also vulnerable to market forces as it lacks diversity; high valuable plastics are increasingly favoured over low-quality plastics (Akenji, et al., 2019; Thang, 2017).
DiscussionThe implementation of policies and laws on recycling falls under the broader waste management framework in all the ASEAN states in this study. With greater affluence and increased material consumption, recycling is a critical component in the management of waste and natural resources. In general, the majority of the ASEAN countries do have a framework, plan and strategy with regards to recycling and some form of implementation. However, except for Singapore, enforcement is weak for most of these countries. The data in Table 6 reflect the varying degree and processes in recycling policy and implementation at the ASEAN level. Much remains to be done.
Country Law Policy Framework/Plan/Strategy
Government initiative/programs
Implementation Target
Brunei No No No Yes Nil YesCambodia No No Yes Yes Nil YesIndonesia Yes No Yes Yes Weak NoLaos Yes No No No Nil NoMalaysia Yes Yes Yes Yes Weak YesMyanmar No Yes Yes No Weak YesPhilippines Yes Yes Yes Yes Weak YesSingapore Yes Yes Yes Yes Strong YesThailand No Yes Yes Yes Weak YesVietnam Yes No Yes Yes Weak Yes
Table 7 Summary of recycling progress in ASEAN

05CONCLUSION

Sustainable consumption and production 55
CONCLUSIONSustainable consumption and production is highlighted as a component of the ‘Sustainable’ element and characteristics in the ‘ASEAN Socio-Cultural Community (ASCC) Blueprint 2025’ (ASEAN Secretariat, 2016). The ASCC blueprint forms one of the four pillars identified in ‘The ASEAN 2025: Forging Ahead Together’ work plan endorsed by ASEAN Leaders at their 27th Summit in 2015. This study identified carbon footprint for consumer goods, energy efficiency and recycling as key contributors to managing the environment and scarce resources for a sustainable future.
This report reveals that while some progress is made, much remains to be done. It is clear that the complexities and difficulties in implementing, executing and monitoring a coherent set of guidelines, policies and laws are not easy. The establishment of ASEAN Centre for Energy (ACE) provides a good indication that it is possible to manage complex issues and problems and provides a reference for similar task force such as this to be established for the efforts in reducing carbon footprint and increasing recycling efforts for a sustainable future.
While the economic growth in ASEAN created much of the climate and environmental problems, there are other promising signs and opportunities for progress and change. In the ASEAN key figures report released in 2019, there were many positive indications in terms of improvements in literacy rate, reduction in poverty and increased scores in human development index (ASEAN secretariat, 2019). With a better-educated population, consumers can be educated and influenced to change behaviours and drive sustainable consumption, which ultimately results in sustainable production. The shift from production-oriented climate policy to consumption-oriented climate policy would be the step forward in the right direction.
There is an urgent need for ASEAN to address the climate change challenges and realise the objectives of the ASEAN 2025: Forging Ahead Together blueprint. There is a need for all stakeholders to work together to achieve these. These include:
1. Need for Government Leadership
The demand at the consumer level and supply at the producer level has been ineffective sofar in driving sustainable consumption and production. To address such market reluctance andfailures, the government needs to take an active role in regulating and providing guidance bothat the consumer and producer level. It is also important to coordinate these initiatives at theASEAN level, as the less developed countries could be the weakest link in the drive for SCP,affecting progress for the ASEAN member states as a whole. Government action and leadershipcan be the solution.
a. Be a standard-setter
The report thus far has highlighted the many varying and sometimes confusing market toolsand standards for the various measurement of carbon emissions, energy efficiency andrecycling. As a result, standard-setting needs to be established at the national level, and alsocoordinated at the ASEAN level to harmonise efforts and best practices.
b. Enforcer of standards
It is equally essential that the government not only sets the standards but ensure enforcementfor its policies and regulations to be effective. The report has highlighted the presence andprevalence of policies and rules, but the lack of enforcement meant that standards are

Sustainable consumption and production56
not met. Without enforcement, governments are not able to monitor and measure the effectiveness of its policies and regulations and make changes where necessary.
c. Education and capacity building, applicability of standards
The education and capacity building for sustainable consumption needs to go hand in hand with sustainable production to close the loop in SCP. Each cannot exist in a vacuum on its own, as has been the case in the past.
There are opportunities for the public and private sectors as well as NGOs to participate in filling up the gaps and coordinate efforts to bring about awareness and practical steps to develop a common standard that applies to carbon footprint, energy efficiency and recycling. These efforts need to be managed at the national level, as there are conflicting and competing needs and stresses that could subvert efforts in achieving SCP.
d. Government as an organisation and government-linked companies to act as a role model
Motherhood statements, while necessary to signal some form of intent, are not sufficient to effect changes. There is a need to move beyond statement of intent embedded in national policies, to credible commitment in engaging consumers and producers, as well as the stakeholders in the ecosystem. In the same light, government-linked companies have the resources and talent to walk the talk and lead the way. They represent both the consumer and producer in the supply chain of goods and services and have a national role as well as a corporate role to play. They would be most well placed to help governments and to lead the discussion and direction for policymaking and establishment of regulations.
2. Business Responsibility
a. Act as a responsible enterprise – profitable and contribute to the wellbeing of Society
For national initiatives and policies to be effectively implemented, businesses must understand and buy in the idea of SCP, both as a consumer of resources and producer of goods and services. It is vital to engage them and work with them to achieve sustainable consumption and production activities and practises.
While consumers typically have limited knowledge on the full life cycles of the products they buy, producers are in a much better position to apply a life cycle perspective. Medium sized and large companies generally have the capacity to scrutinise their value chains from a sustainability perspective, to compile relevant data, to engage with actors upstream (suppliers) and downstream (waste managers and recyclers) and to initiate improvements. Given the central role played by the private sector in managing product life cycles, policymakers need to encourage and incentivise companies to adopt a life cycle perspective.
b. Compliance
The United Nations has identified SCP under goal number 12 in achieving economic growth and sustainable development. There is a need to reduce ecological footprint by changing the way we produce and consume goods and resources.
As stated earlier, governments need to set and enforce standards for SCP to be implemented and maintained for any effective changes. It is necessary that private businesses understand the urgency of the current situation and cooperate as well as comply with government policies and regulations to achieve sustainable production, as a buyer and seller of goods and services.
Companies should also integrate sustainability information into their annual reports. Some

Sustainable consumption and production 57
corporations are already reporting their compliance with voluntary codes of conduct, which include pledges to adopt sustainable consumption and production practices. It is also important to note that sustainability reporting is understood as part of a company’s due diligence under its compliance obligations, and as a good business practice that positions a corporation for long-term success in the market. It should not be viewed as a violation of the fiduciary duty to shareholders to maximize profits. In ACN and CGIO’s report on sustainability development (Loh & Thomas 2018; Loh & Thomas, 2015), we see an encouraging trend with more sustainability reporting across ASEAN countries.
c. Transparency
It must be noted that a growing number of companies across all sectors have adoptedsustainability reporting in response to the rising demand for accountability and transparencyin corporate governance and social responsibility. However, in the studies conducted by ACNand CGIO (Loh & Thomas 2018; Loh & Thomas, 2015), transparency in disclosures is notfeatured prominently. As sustainability reporting is in its early stage of development, it willtake some time for this aspect to improve.
d. Accountability – including reporting with data
Target setting and performance measurement of a set of sustainability goals are essentialfor SCP’s integration into the company’s operations. It also signals accountability andcommitment to its stakeholders that the company is taken realistic and practical steps toachieving SCP. There is also a need for companies to disclose their performance targets andparticularly measurement with data, so that it is verifiable.
In the two studies conducted by ACN and CGIO in 2015 and 2018 (Loh & Thomas, 2018; Loh& Thomas, 2015), the report found a disparity among companies in the ASEAN countries,with Malaysia, Singapore and Thailand showing more disclosures in comparison to Indonesiaand Philippines.
e. Working together
Responsible Business is a cross cutting issue. Environmental stewardship is linked toresponsible economic growth and social responsibility. Therefore, businesses need to worktogether to raise awareness, build capacity and support each other in building a region thatis sustainable, inclusive and equitable, respecting the principles of responsibility for thewell being of Society. For this the ASEAN Responsible and Inclusive Business Alliance beingpromoted by ACN and the ASEAN Business Advisory Council (ABAC) could be the platform tofurther the responsible business agenda.
3. Consumers
a. Need to have the ability to make informed decisions
The report has identified the issues confounding consumers’ ability to make informed choicesand purchasing decisions. Clearly, the government needs to establish a common set of easilyunderstood standards and labels to assist the consumers in this regard.
Frankly, the ultimate objective of environmental communication should be to help consumersand supply chain partners make more informed choices and improve their behaviour. This isnecessary to proactively safeguard the environment for both present and future generations,by providing information that is scientifically reliable and consistent, understandable and notmisleading.
b. Information from the transparency and accountability of organisations

Sustainable consumption and production58
Besides educating the consumers on standards and labels, consumers should be able to access companies’ reports on sustainability and assess the reliability of the information produced.
Sustainability reporting is essential to enable access to consumers in understanding a company’s direction and performance in this regard. Currently, while sustainability reporting is mandated at the listed companies’ level, private and privately listed companies make up the bulk of business entities. It will create a greater impact if sustainability reporting is also encouraged or mandated in the private sector.
4. Using the CSR/Responsible Business framework to push for businesses to contribute towards and address climate change issues
While climate change is not highlighted as part of SCP under SDG goal number 12, it plays a very important role with critical impact on SCP. The report has highlighted ASEAN countries are particularly vulnerable to climate change, as the rising temperatures, erratic weather patterns and rising sea levels impact agriculture production, erode coastal lines and disrupt economic activities.
Businesses need to adopt a long- term view to limit and reduce carbon emissions and consider risk assessments in their business plans and actions.
Climate change impacts businesses regardless of their economic activities. Yet, many companies do not recognise the contribution their business make to climate change, particularly if they are not involved in the manufacturing and production process. As a result, companies are also not reporting the contribution its operation has on climate change, nor are they assessing and reporting the effects climate changes have on its operations. This needs to change and the ASEAN countries could conduct research and identify for the companies, the indirect effects of climate change each company contributes.
The following recommendations are made to ASEAN Member States, the ASEAN Secretariat, business community and other stakeholders as the way forward:
1. This report shows that the management of the 3 topics covered is difficult and complex. The diversity of approaches and standards further complicates the management at the national and regional level. We therefore need to have an ASEAN regional standardisation for products, processes and services to achieve the objectives of ASEAN 2025: Forging Ahead Together for environmental sustainability and sustainable consumption and production (SCP).
2. To achieve harmonised protocol for the development and mutual agreement of such standards and regulatory frameworks, we recommend the establishment of an ASEAN Steering Working Group on SCP (this appears to be in discussion for some years but still not realized). Currently, SCP is only included in the ASEAN Working Group on Environmental Education and therefore observed only from Environmental Education aspect. We propose that this SCP Steering Working Group have representatives from Member States, Academia, Business, Consumers and other stakeholders. It should be adequately resourced with money and experts to craft coherent policies, set targets and that these targets are met with timelines and priorities.
3. We also propose that a Technical Working Group on SCP be formed comprising of Experts from all Member States, academia, business, consumer organisations and other relevant stakeholders with the objective of addressing climate change with ASEAN wide coherent policies and standards. The Steering Working Group will set directions and priorities for this Working Group. Processes like the Seville Process that brings together experts from different fields in a working group using Best Available Techniques (BAT) and Best Available Techniques Reference

Sustainable consumption and production 59
Documents (BREF) would be able to achieve the desired objectives.
4. We also propose an Annual ASEAN multi-stakeholder dialogue (AMS government, business,consumer, academic representatives) or other mechanisms to strengthen the exchange/cooperation among AMS. This will be organised and hosted by the Steering Working Group toenable it to make informed decisions.
5. Promote Responsible Business Conduct in a coordinated manner in ASEAN as SustainableConsumption and Production is listed as a CSR activity in the ASEAN 2025: Forging AheadTogether document. Businesses need to act responsibly in a holistic manner – profitable andcontribute to the wellbeing of Society, which includes environmental stewardship. The ASEANResponsible And Inclusive Business Alliance (ARAIBA), an initiative of the ASEAN CSR Networkand ASEAN Business Advisory Council, can be the platform. This will be a multiplier to spreadthe key frameworks as decided by the Multi Stakeholder Dialogue, Experts Working Groups andbusinesses with all parties using a common language to address climate changes challenges.
6. This work should be compatible with ASEAN trade negotiations. We also recommend thatinternational development and knowledge partners contribute to these efforts.
Acknowledgments
This report is made possible by the generous support of Hanns Seidel Foundation.
The study was led by Associate Professor Lawrence Loh from the National University of Singapore (NUS) Business School and Mr Thomas Thomas from the ASEAN CSR Network.
The researchers are Ms Angelica See and Ms Verity Thoi from the NUS Business School’s Centre for Governance, Institutions and Organisations (CGIO).
We also wish to thank Ms Nguyen Thu Trang from the Hanns Seidel Foundation and Mr Florian Beranek from UNIDO for their valuable inputs and guidance.
We also thank the many who contributed in one way or another to the success of this initiative.

Sustainable consumption and production60
References
Abas, A. P., & Mahlia, T. (November, 2018). Development of energy labels based on consumer perspec-tive: Room air conditioners as a case study in Brunei Darussalam. Energy Reports, 4, 671-681.
ACE. (2015). ASEAN Plan Of Action For Energy Coorperation (APAEC) 2016-2025. Jakarta; Indonesia: ASEAN Centre for Energy. Retrieved 2019, from https://aseanenergy.sharepoint.com/Publication-Library/Forms/AllItems.aspx?id=%2FPublicationLibrary%2F2015%2FACE%20Publications%2FA-PAEC%202016%2D2025%2DFinal%2Epdf&parent=%2FPublicationLibrary%2F2015%2FACE%20Publications&p=true
ACE. (21 November, 2015). Energy Efficiency Standards and Labelling for Cambodia. Retrieved 7 No-vember, 2019, from ASEAN Centre For Energy: http://www.aseanenergy.org/news/energy-effi-ciency-standards-and-labelling-for-cambodia/
Ahmad, A., & Othman, H. M. (2014). Electricity Consumption in Brunei Darussalam: Challenges in Energy Conservation. International Energy Journal, 14, 155-166. Retrieved from http://www.thai-science.info/journals/Article/IENJ/10972502.pdf
Akenji, L., Bengtsson, M., Kato, M., Hengesbaugh, M., Hotta, Y., & Aoki-Suzuki, C. (2019). Circular Econ-omy and Plastics: A Gap-Analysis in ASEAN Member States. Brussels: European Commission Di-rectorate General for Environment and Directorate General for International Cooperation and Development, Jakarta: Association of Southeast Asian Nations (ASEAN).
Allison, E. (March, 2014). Waste and Worldviews: Garbage and Pollution Challenges in Bhutan. Journal for the Study of Religion Nature and Culture, 406-428. doi:DOI: 10.1558/jsrnc.v8i4.25050
Andrews-Speed, P., & Singh, H. V. (3 September, 2019). How to power a bright future for ASEAN. Retrieved 5 September, 2019, from World Economic Forum: https://www.weforum.org/agen-da/2018/09/developing-a-shared-vision-for-aseans-energy-transition/
APERC. (2016). Compendium of Energy Efficiency Policies of APEC Economies Brunei Darussalam. SOM Steering Committee on Economic and Technical Cooperation(SCE), Energy Working Group(EWG). Retrieved from https://www.apec.org/Publications/2016/10/Compendium-of-Energy-Efficien-cy-Policies-of-APEC-Economies
Ariffin, E. (6 July, 2018). Indonesia’s plastic waste problem. Retrieved 3 September, 2019, from The ASEAN Post: https://theaseanpost.com/article/indonesias-plastic-waste-problem-0
ASEAN Secretariat. (2012). ASEAN Multi-Sectoral Framework on Climate Change: Agriculture and For-estry Towards Food and Nutrition Security and achievement of SDG (AFCC). Ha Noi; Vietnam: ASEAN Secretariat. Retrieved 29 January , 2020, from https://asean.org/storage/2012/05/ASE-AN-Multisectoral-Framework-for-climate-change.pdf
ASEAN Secretariat. (2016). ASEAN Socio-Cultural Community Blueprint 2025. Jakarta: ASEAN Secretar-iat.
ASEAN Secretariat. (2017). Celebrating ASEAN: 50 Years of Evolution and Progress; A Statistical Publi-cation. Jakarta: The ASEAN Secretariat. Retrieved 12 September, 2019, from https://www.asean-

Sustainable consumption and production 61
stats.org/wp-content/uploads/2017/08/ASEAN50_Master_Publication.pdf
ASEAN-SHINE. (2015). Promotion of Higher Efficiency Air Conditioners in ASEAN: A Regional Roadmap Policy. International Copper Association China. Retrieved from https://www.aseanshine.org/download/get/f4b9ec30ad9f68f89b29639786cb62ef
Atienza, V. (2017). State of the 3Rs in Asia and the Pacific Country Chapter: The Republic of the Phil-ippines. Laguna, Philippines: The Secretariat of the Regional 3R Forum in Asia and the Pacific; United Nations Centre for Regional Development; Institute for Global Environmental Strategies; Ministry of the Environment, Government of Japan.
Brunei, G. (2019). RECYCLING. Retrieved 8 November, 2019, from Green Brunei: https://green-brunei.com/recycling/
Business Mirror. (6 September, 2019). Energy deparment’s Cusi leads Philippines delegation for Amem 37 in Bangkok. Retrieved 6 September, 2019, from BusinessMirror: https://businessmirror.com.ph/2019/09/06/energy-deparments-cusi-leads-philippines-delegation-for-amem-37-in-bang-kok/
Camilleri, A. R., Larrick, R. P., Hossain, S., & Patino-Echeverri, D. (17 December , 2019). Consumers un-derestimate the emissions associated with food but are aided by labels. Nature Climate Change volume, 9, 53–58. Retrieved from https://www.nature.com/articles/s41558-018-0354-z
Carbon Trust. (2006). The carbon emissions generated in all that we consume. London: The Carbon Trust. Retrieved 9 September, 2019, from https://www.carbontrust.com/resources/reports/foot-printing/the-carbon-emissions-generated-in-all-that-we-consume/
Chaichinda, P. (2013). EE Standards and Labeling Programs. In E. G. Thailand (Ed.), Philippine stakehold-ers workshop – Manila. Manila: Lites Asia. Retrieved 7 November, 2019, from https://www.lites.asia/files/otherfiles/0000/0257/Philippine_stakeholder_workshop_1.6_Thailand_standards_and_labelling_Pitarn_Chaichinda.pdf
Chantha, V. (2013). Energy Efficiency and Conservation (EE-C) Activities and Standards and Labelling Programs in Lao PDR. Jakarta; Indonesia: lites.asia. Retrieved from https://www.lites.asia/files/otherfiles/0000/0216/Day_2_Session_1.2_Standards_and_labelling_in_Lao_PDR_Viengsay_Chantha.pdf
Chontanawat, J. (October, 2018). Decomposition analysisof CO2emission in ASEAN: an extended IPAT model. Energy Procedia, 153, 186-190. doi:https://doi.org/10.1016/j.egypro.2018.10.057
Čuček, L., Klemeš, J. J., & Kravanja, Z. (2015). Chapter 5 - Overview of environmental footprints. In J. J. Klemeš, Assessing and Measuring Environmental Impact and Sustainability (pp. 131-193). Elsevi-er Inc. Retrieved from https://doi.org/10.1016/B978-0-12-799968-5.00005-1
Damanhuri, I. E. (2017). State of the 3Rs in Asia and the Pacific Country Chapter: The Republic of In-donesia. Bandung, Indonesia: The Secretariat of the Regional 3R Forum in Asia and the Pacific; United Nations Centre for Regional Development ; Institute for Global Environmental Strategies; Ministry of the Environment, Government of Japan.
Daubach, T. (31 July, 2019). Power play—who’s winning Southeast Asia’s renewables race? Retrieved 5 September, 2019, from Eco-business: https://www.eco-business.com/news/power-play-whos-

Sustainable consumption and production62
winning-southeast-asias-renewables-race/
Davis, S. J., & Caldeira, K. (2010). Consumption-based accounting of CO2 emissions. PNAS, 107(12), 5687-5692. Retrieved 13 April, 2020, from https://www.pnas.org/content/107/12/5687
DOE. (2019). Lighting and Appliance Labelling Standard. Retrieved 7 November, 2019, from Repub-lic of The Philippines Department of Energy: https://www.doe.gov.ph/consumer-connect/light-ing-and-appliance-labelling-standard
DOE. (2019). Standard for Energy Efficiency Ratio and Labeling Requirements. Retrieved 11 November, 2019, from Republic of The Philippines Department of Energy: https://www.doe.gov.ph/stan-dard-energy-efficiency-ratio-and-labeling-requirements
Dogan, E., & Seker, F. (August , 2016). Determinants of CO2 emissions in the European Union: The role of renewable and non-renewable energy. Renewable Energy, 94, 429-439. doi:https://doi.org/10.1016/j.renene.2016.03.078
Dogan, E., & Seker, F. (July, 2016). The influence of real output, renewable and non-renewable en-ergy, trade and financial development on carbon emissions in the top renewable energy coun-tries. Renewable and Sustainable Energy Reviews, 60, 1074-1085. doi:https://doi.org/10.1016/j.rser.2016.02.006
ECD, & MONREC. (2017). National Waste Management Strategy and Action Plan for Myanmar (2017-2030). Nay Pyi Taw, Myanmar: Environmental Conservation Department (ECD), Ministry of the Natural Resources and Environmental Conservation (MONREC), the Republic of the Union of Myanmar, 2017.
ECOLEX. (2009). Law No. 32/2009 on Environmental Protection and Management. Retrieved 8 Novem-ber, 2019, from ECOLEX: https://www.ecolex.org/details/legislation/law-no-322009-on-environ-mental-protection-and-management-lex-faoc097643/
Eden, M. R., Sirola, J. D., & Towler, G. P. (2014). Proceedings of the 8th International Conference on Foundations of Computer-Aided Process Design. Elsevier. Retrieved from https://www.sciencedi-rect.com/topics/engineering/carbon-footprint
Electricity Generating Authority of Thailand. (16 March, 2015). Efficiency of label no.5 appliances in-creased. Retrieved 7 November, 2019, from Electricity Generating Authority of Thailand: https://www.egat.co.th/en/news-announcement/news-release/efficiency-of-label-no-5-appliances-in-creased
Ferronato, N., & Torretta, V. (24 March, 2019). Waste Mismanagement in Developing Countries: A Review of Global Issues. International Journal Environ Res Public Health., 16(6), 1060. Retrieved from https://www.ncbi.nlm.nih.gov/pmc/articles/PMC6466021/
Feucht, Y., & Zander, K. (2017). Consumers’ attitudes on carbon footprint labelling: Results of the SUS-DIET project, Thünen Working Paper, No. 78. Braunschweig: Johann Heinrich von Thünen-Institut. doi:http://dx.doi.org/10.3220/WP1507534833000
Fu, B., Shu, Z., & Liu, X. (7 April, 2018). Blockchain Enhanced Emission Trading Framework in Fashion Apparel Manufacturing Industry. Sustainability, 10(4), 1105. Retrieved 9 September, 2019, from https://doi.org/10.3390/su10041105

Sustainable consumption and production 63
GAIA. (2019). Discarded: Communities on the Frontlines of the Global Plastic Crisis. Global Alliance for Incinerator Alternatives. Retrieved from https://wastetradestories.org/
Gamaralalage, P. J., Hengesbaugh, M., Onogawa, K., & Hlaing, O. M. (2017). Waste Management in Myanmar: Current Status, Key Challenges and Recommendations for National and City Waste Management Strategies. Kanagawa, Japan: Institute for Global Environment Strategies. Retrieved from https://www.iges.or.jp/en/pub/waste-management-myanmar-current-status-key/en
Garcia, B., Fang, M. M., & Lin, J. (13 August, 2019). Marine Plastic Pollution in Asia: All Hands on Deck! Chinese Journal of Environmental Law, 3(1). Retrieved from https://brill.com/view/journals/cjel/3/1/article-p11_2.xml?language=en#note-FN000010
Girod, B., Vuuren, D. P., & Hertwich, E. G. (2014). Climate policy through changing consumption choic-es: Options and obstacles for reducing greenhouse gas emissions. Global Environmental Change, 25, 5–15.
Global Carbon Project. (2017). Retrieved from Global Carbon Atlas: http://www.globalcarbonatlas.org/en/CO2-emissions
Goh, T. (11 October, 2019). Only 7% of Singapore’s plastic for recycling is processed here. Retrieved 8 November, 2019, from Straits Times: https://www.straitstimes.com/singapore/environment/only-7-of-singapores-plastic-for-recycling-is-processed-here
Gong, L., & Trajano, J. C. (2019). Tackling East Asia’s New Environmental Challenge Marine Plastic Pol-lution. S.RAJARATNAM SCHOOL OF INTERNATIONAL STUDIES. Singapore: Nanyang Technological University.
Guenther, M., Saunders, C., & Tait, P. (2014). Carbon labeling and consumer attitudes. Carbon Man-agement, 3, 445-455. doi:10.4155/cmt.12.50
Habib, F. H. (12 July, 2019). What to Expect From ASEAN’s New Agreement on Marine Debris. Re-trieved 3 September, 2019, from The Diplomat: https://thediplomat.com/2019/07/what-to-ex-pect-from-aseans-new-agreement-on-marine-debris/
Halimah Yacob. (9 September, 2019). Resource Sustainability Act 2019. Retrieved from Singapore Stat-ues Online: https://sso.agc.gov.sg/Acts-Supp/29-2019/Published/20191004?DocDate=20191004
Heinrich-Böll-Stiftung. (2019). Plastic Atlas. Berlin: Heinrich-Böll-Stiftung in cooperation with Break Free From Plastic. Retrieved from https://www.boell.de/en/2019/11/05/plasticatlas?dimen-sion1=ds_plastic_atlas
HV, V., Thompson, F., & Tonby, O. (May, 2014). Understanding ASEAN: Seven things you need to know. Retrieved 12 September, 2019, from McKinsey & Company Public Sector: https://www.mckinsey.com/industries/public-sector/our-insights/understanding-asean-seven-things-you-need-to-know
IBP USA. (2012). Comprehensive Solid Waste Management. In I. USA, Philippines Ecology, Nature Pro-tection Laws and Regulations Handbook Volume 1 (pp. 51-52). Washington: International Busi-ness Publications.
IEA. (20 March, 2015). Energy Efficiency Labeling Program. Retrieved 7 November, 2019, from International Energy Agency: https://www.iea.org/policiesandmeasures/pams/indone-

Sustainable consumption and production64
sia/name-30798-en.php?s=dHlwZT1lZSZzdGF0dXM9T2s,&return=PG5hdiBpZD0iYnJlYWR-jcnVtYiI-PGEgaHJlZj0iLyI-SG9tZTwvYT4gJnJhcXVvOyA8YSBocmVmPSIvcG9saWNpZXNhbmRtZW-FzdXJlcy8iPlBvbGljaWVzIGFuZCBNZWFzdXJlczwvYT4gJnJh
ILO. (7 March, 2008). Indonesia (611) . Retrieved 8 November, 2019, from International Labour Organi-sation: https://www.ilo.org/dyn/natlex/natlex4.detail?p_lang=en&p_isn=84427&p_country=ID-N&p_count=611
IMF. (2019). Real GDP growth Annual percent change. Retrieved 12 September, 2019, from Interna-tional Monetary Fund: https://www.imf.org/external/datamapper/NGDP_RPCH@WEO/OEMDC/ADVEC/WEOWORLD/SEQ
Ismail, M. (2 December, 2018). Calls for better plastic waste management. Retrieved 27 December, 2019, from The ASEAN Post: https://theaseanpost.com/article/calls-better-plastic-waste-man-agement
Ismail, M. (19 November, 2018). Indonesia’s plastic action. Retrieved 8 November, 2019, from THE ASEAN POST: https://theaseanpost.com/article/indonesias-plastic-action
Ismail, M. (23 July, 2018). The dying rivers of ASEAN. Retrieved 2 September, 2019, from The ASEAN Post: https://theaseanpost.com/article/dying-rivers-asean
Jain, A. (2017). Waste Management in ASEAN Countries. Thailand: United Nations Environment Programme. Retrieved 12 September, 2019, from http://wedocs.unep.org/bitstream/han-dle/20.500.11822/21134/waste_mgt_asean_summary.pdf?sequence=1&isAllowed=y
Jambeck, J. R., Geyer, R., Wilcox, C., & Siegler, T. R. (13 February, 2015). Plastic waste inputs from land into the ocean. Science, 347(6223). doi:10.1126/science.1260352
Jereme, I. A., Siwar, C., & MahmudulAlam, M. (2015). Waste Recycling in Malaysia: Transition from Developing to Developed Country. Indian Journal of Education and Information Management, 4, 1-14. Retrieved from https://www.researchgate.net/publication/280881782_Waste_Recycling_in_Malaysia_Transition_from_Developing_to_Developed_Country
Jeronimo, M. (25 October, 2019). Plastic Kingdom: On Cambodia’s Recycling Trail. Retrieved 8 Novem-ber, 2019, from New Naratif: https://newnaratif.com/journalism/plastic-kingdom-on-cambodi-as-recycling-trail/share/xuna/793fde23ec4fb2972bfe2ee461f63645/
Kamuang, T., & Siriratpiriya, O. (2017). State of the 3Rs in Asia and the Pacific Country Chapter: The Kingdom of Thailand . Bangkok, Thailand: The Secretariat of the Regional 3R Forum in Asia and the Pacific; United Nations Centre for Regional Development; Institute for Global Environmental Strategies; Ministry of the Environment, Government of Japan.
Key Note Publications Ltd. (2007). Global Waste Management Market Assessment 2007. Key Note Publications Ltd. Retrieved 12 September, 2019, from seas.columbia.edu/earth/wtert/sofos/Key_Global_Waste_Generation.pdf
Khan, M. K., Khan, M. I., & Rehan, M. (2020). The relationship between energy consumption, econom-ic growth and carbon dioxide emissions in Pakistan. Financial Innovation, 6(1). doi:https://doi.org/10.1186/s40854-019-0162-0
Lassa, J. A., Lai, A. Y.-H., & Goh, T. (23 November, 2015). Climate extremes: an observation and pro-

Sustainable consumption and production 65
jection of its impacts on food production in ASEAN. Natural Hazards, 84(Supplement 1), 19–33. Retrieved from https://link.springer.com/article/10.1007/s11069-015-2081-3
Lebreton, L. C., Zwet, J. v., Damsteeg, J.-W., Slat, B., Andrady, A., & Reisser, J. (07 June, 2017). River plastic emissions to the world’s oceans. Nature Communications , 8. Retrieved from https://www.nature.com/articles/ncomms15611/tables/1
Lenzen, M., Sun, Y.-Y., Faturay, F., Ting, Y.-P., Geschke, A., & Malik, A. (23 May, 2019). The carbon foot-print of global tourism. Nature Climate Change, 8, 522–528. Retrieved 9 September, 2019, from https://www.nature.com/articles/s41558-018-0141-x
Liu, V. (1 November, 2019). ‘Reverse’ vending machines to spur recycling. Retrieved 8 November, 2019, from The Straits Times: https://www.straitstimes.com/singapore/reverse-vending-ma-chines-to-spur-recycling
Locock, K. E., Deane, J., Kosior, E., Prabaharan, H., Skidmore, M., & Hutt, O. E. (2017). The Recycled Plastics Market: Global Analysis and Trends. CSIRO.
Loh, L., Thao, N. T., Sim, I., Thomas, T., & Yu, W. (2015). Sustainability Reporting in ASEAN: State of Progress in Indonesia, Malaysia, Singapore and Thailand 2015. Singapore: ASEAN CSR Centre; Centre for Governance, Institutions and Organisations (CGIO).
Loh, L., Thomas, T., Lee, S. P., Lim, L., Pan, H., Malek, M., . . . Thao, N. T. (2018). Sustainability Reporting in ASEAN Countries 2018. Singapore: ASEAN CSR Network; Centre for Governance, Institutions and Organisations (CGIO).
Lokahita, B. (n.d.). Indonesia municipal solid waste Regulations and Common Practice. Retrieved from https://www.academia.edu/23109258/INDONESIA_municipal_solid_waste_Regulations_and_Common_Practice
Long, X., Naminse, E. Y., Du, J., & Zhuang, J. (December , 2012). Non-renewable energy, renewable en-ergy, carbon dioxide emissions and economic growth in China from 1952 to 2012. Renewable and Sustainable Energy Reviews, 52, 680-688. doi:https://doi.org/10.1016/j.rser.2015.07.176
Lyons, Y., Su, T. L., & Neo, M. L. (2019). A review of research on marine plastics in Southeast Asia: Who does what? National University of Singapore in partnership with the UK Science and Innovation Network at the British High Commission in Singapore, Centre for International Law, Singapore. Retrieved from https://cil.nus.edu.sg/publication/a-review-of-research-on-marine-plastics-in-southeast-asia-who-does-what/
Maw, U. M. (2018). The Development of National Waste Management Strategy and Action Plan in Myanmar 8th Regional 3Rs Forum. Indore, Madhya Pradesh, India: Ministry of Natural Resources and Environmental Conservation Environmental Conservation Department Search; The United Nations Centre for Regional Development. Retrieved from https://www.uncrd.or.jp/content/doc-uments/6285Country-G-2-Myanmar.pdf
McFall-Johnsen, M., Woodward, A., & US, B. I. (8 August, 2019). Our food system accounts for a whop-ping 37% of greenhouse-gas emissions, a UN report found. But it could also offer a solution to the climate crisis. Retrieved 9 September, 2019, from Business Insider Singapore: https://www.businessinsider.sg/food-system-role-in-climate-crisis-possible-solutions-2019-8/

Sustainable consumption and production66
MEWR. (2019). Zero Waste Masterplan. Singapore: Ministry of the Environment and Water Resources; National Environment Agency.
Ministry of Energy and Mines, L. P. (2018). Lao PDR Energy Statistics 2018. Economic Research Institute for ASEAN and East Asia. Retrieved from http://www.eria.org/uploads/media/0_Lao_PDR_Ener-gy_Statistics_2018_complete_book.pdf
Mohan, M. (6 August, 2019). About 30% of Singapore’s recyclable waste exported overseas in 2018: Masagos. Retrieved 19 November, 2019, from CNA: https://www.channelnewsasia.com/news/singapore/singapore-recyclable-waste-exported-overseas-in-2018-11786580
Moran, D., Wood, R., Hertwich, E., Kim Mattson, J. F., Schanes, K., & Barrett, J. (13 December, 2018). Quantifying the potential for consumer-oriented policy to reduce European and foreign carbon emissions. Climate Policy. doi: https://doi.org/10.1080/14693062.2018.1551186
National Intelligence Council. (2009). Southeast Asia and Pacific Islands: The Impact of Climate Change to 2030 A Commissioned Research Report. Joint Global Change Research Institute; Battelle Me-morial Institute, Pacific Northwest Division; Scitor Corporation .
NEA. (April, 2001). National Recycling Programme. Retrieved 8 November, 2019, from Nation-al Environment Agency: https://www.nea.gov.sg/our-services/waste-management/3r-pro-grammes-and-resources/national-recycling-programme
NEA. (2018). Waste Statistics and Overall Recycling. Retrieved 8 November, 2019, from National En-vironment Agency: https://www.nea.gov.sg/our-services/waste-management/waste-statis-tics-and-overall-recycling
NEA. (2018). Waste Statistics and Overall Recycling. Retrieved from National Environment Agency: https://www.nea.gov.sg/our-services/waste-management/waste-statistics-and-overall-recycling
NEA. (1 August, 2019). About 18,000 Households Eligible To Receive Free Recycling Bins. Retrieved 8 November, 2019, from National Environment Agency: https://www.nea.gov.sg/media/news/news/index/about-18-000-households-eligible-to-receive-free-recycling-bins
NEA. (2019). The Energy Label. Retrieved 7 November, 2019, from National Environmental Agen-cy: https://www.nea.gov.sg/our-services/climate-change-energy-efficiency/energy-efficiency/household-sector/the-energy-label
NEA. (2019). Waste Minimisation and Recycling. Retrieved from National Environment Agency: https://www.nea.gov.sg/our-services/waste-management/3r-programmes-and-resources/waste-mini-misation-and-recycling
NEA. (18 February, 2020). National Recycling Programme. Retrieved from National Environment Agen-cy: https://www.nea.gov.sg/our-services/waste-management/3r-programmes-and-resources/national-recycling-programme
Novastria, R. O. (6 Feburary, 2019). A green fiscal policy for recycling industry. Retrieved 8 November, 2019, from The Jakarta Post: https://www.thejakartapost.com/academia/2019/02/06/a-green-fis-cal-policy-for-recycling-industry.html
Ocean Conservancy. (2017). Stemming the Tide: Land-based strategies for a plastic- free ocean. McK-insey Center for Business and Environment. Retrieved 29 January, 2020, from https://oceancon-

Sustainable consumption and production 67
servancy.org/wp-content/uploads/2017/04/full-report-stemming-the.pdf
Oh, T. (30 August, 2019). Singapore aims to cut daily waste sent to landfill by 30% by 2030 to extend Semakau’s lifespan. Retrieved 19 November, 2019, from TODAY Singapore: https://www.today-online.com/singapore/singapore-aims-cut-daily-waste-sent-landfill-30-2030-extend-semakaus-lifespan
ORBIS. (13 January, 2016). ASEAN 2025: Forging Ahead Together. Retrieved 27 December, 2019, from Open Repository Base on International Strategic Studies: https://espas.secure.europarl.europa.eu/orbis/document/asean-2025-forging-ahead-together
Paing, A. T., Aye, M. P., Yee, M. W., & Thaw, W. W. (2015). Effective energy efficiency policy implemen-tation targeting “New Modern Energy Consumer” in the Greater Mekong Subregion Household energy efficiency: a socio-economic perspective. Myanmar Engineering Society.
Pariatamby, A. (2017). State of the 3Rs in Asia and the Pacific Country Chapter: Malaysia. Kuala Lum-pur, Malaysia: The Secretariat of the Regional 3R Forum in Asia and the Pacific; United Nations Centre for Regional Development; Institute for Global Environmental Strategies; Ministry of the Environment, Government of Japan.
Pearse, W. (6 August, 2010). A Look at Vietnam’s Plastic Craft Villages. Retrieved 8 November, 2019, from Our World: https://ourworld.unu.edu/en/a-look-at-vietnams-plastic-craft-villages
Post, B. (23 August, 2019). Ministry of Energy to hold ‘AMEM 2019’. Retrieved 6 September, 2019, from Bangkok Post: https://www.bangkokpost.com/thailand/pr/1735467/ministry-of-ener-gy-to-hold-amem-2019
PPCA, IGES, N., Environment, U., & CCCA. (2018). Waste Management Strategy and Action Plan of Phnom Penh 2018-2035 . Phnom Penh: Phnom Penh Capital Administration, Kingdom of Cambo-dia.
Prasitpianchai, S. (August, 2014). Lao PDR to Develop an Energy Standards & Labelling Program. Re-trieved 11 November, 2019, from International Institute for Energy Conservation: http://www.iiec.org/news/568-lao-pdr-to-develop-an-energy-standards-labelling-program
Ritchie, H. (4 December, 2018). Global inequalities in CO₂ emissions, based on consumption. Re-trieved 5 September, 2019, from Our World in Data: https://ourworldindata.org/global-inequal-ities-co2-consumption
Rogers, K. (10 January, 2019). Asia-Pacific’s plastic problem ignites waste management movement. Retrieved 13 September, 2019, from Devex: https://www.devex.com/news/asia-pacific-s-plas-tic-problem-ignites-waste-management-movement-94115
Schmalensee, R. (30 August, 2012). From “Green Growth” to sound policies: An overview. Energy Economics, 34.
Secretariat, T. A. (2019). ASEAN Key Figures 2019. Jakarta: The ASEAN Secretariat. Retrieved 16 Janu-ary, 2020, from https://www.aseanstats.org/publication/asean-key-figures-2019/
SEPO. (2017). Philippine Solid Wastes At A Glance. Pasay, Philippines: Senate of the Philippines. Re-trieved from https://www.senate.gov.ph/publications/SEPO/AAG_Philippine%20Solid%20Wastes_Nov2017.pdf

Sustainable consumption and production68
Sethy, S. (2017). State of the 3Rs in Asia and the Pacific Country Chapter: The Kingdom of Cambodia. Phnom Penh, Cambodia: The Secretariat of the Regional 3R Forum in Asia and the Pacific; United Nations Centre for Regional Development; Institute for Global Environmental Strategies; Ministry of the Environment, Government of Japan.
Singstat. (2018). ASEAN Statistical Highlights 2018. Singapore: Department of Statistics Singapore. Retrieved from https://www.singstat.gov.sg/-/media/files/publications/reference/asean-statisti-cal-highlights-2018.pdf
Sreenivasan, J., Govindan, M., Chinnasami, M., & Kadiresu, I. (2012). Solid Waste Management in Ma-laysia – A Move Towards Sustainability. In L. F. Rebellon, Waste Management - An Integrated Vision. IntechOpen. doi:10.5772/50870
Staff Reporter. (30 August, 2018). ASEAN to become world’s fourth largest economy by 2030: Singa-pore PM Lee. Retrieved 29 August, 2019, from Singapore Business Review: https://sbr.com.sg/economy/asia/asean-become-worlds-fourth-largest-economy-2030-singapore-pm-lee
Storey, D., Aleluia, J., Kim, S., Lee, J., Peterson, A. M., & Xu, Q. (2018). Solid Waste Management in Vientiane, Lao P.D.R. South Korea: Global Green Growth Institute .
Styllis, G. (5 June, 2018). Thailand falling behind in global battle with plastic waste. Retrieved 8 Novem-ber, 2019, from Nikkei Asian Review: https://asia.nikkei.com/Economy/Thailand-falling-behind-in-global-battle-with-plastic-waste
Sudibyo, H., Pradana, Y. S., Budiman, A., & Budhijanto, W. (December, 2017). Municipal Solid Waste Management in Indonesia - A Study about Selection of Proper Solid Waste Reduction Method in D.I. Yogyakarta Province. Energy Procedia, 143, 494-499. doi:https://doi.org/10.1016/j.egy-pro.2017.12.716
Suruhanjaya Tenaga Energy Comission. (2019). Guideline for Energy Efficiency Label. Retrieved 7 No-vember, 2019, from Suruhanjaya Tenaga Energy Comission: https://www.st.gov.my/web/con-sumer/details/7/2
Tan, A. (5 September, 2019). New environment law compels businesses to reduce e-waste, packaging & food waste. Retrieved 15 December, 2019, from Mothership: https://mothership.sg/2019/09/environment-law-singapore-resource-sustainability-bill-passed-parliament/
Thang, N. T. (2017). State of the 3Rs in Asia and the Pacific Country Chapter: The Socialist Republic of Vietnam. Hanoi, Vietnam: The Secretariat of the Regional 3R Forum in Asia and the Pacific; United Nations Centre for Regional Development; Institute for Global Environmental Strategies; Ministry of the Environment, Government of Japan.
Thien, U. H., Maw, U. M., Thin, N. N., Latt, U. K., Onogawa, K., Premakumara, D. G., . . . Hlaing, O. M. (2018). National Waste Management Strategy and Action Plan for Myanmar (2017-2030). Nay Pyi Taw: Environmental Conservation Department (ECD), Ministry of the Natural Resources and Environmental Conservation (MONREC), the Republic of the Union of Myanmar,.
TODAY Singapore. (11 March, 2014). Energy labels to be revised from Sept 1. Retrieved 7 November, 2019, from TODAY Singapore: https://www.todayonline.com/singapore/energy-labels-be-re-vised-sept-1

Sustainable consumption and production 69
Vibol, S., & Kunthy, S. (2014). Effective energy efficiency policy implementation targeting “New Modern Energy Consumer” in the Greater Mekong Subregion. Royal University of Agriculture. Retrieved 7 November, 2019, from http://www.meconproject.com/wp-content/uploads/report/[Task%202-Market%20survey]%20Cambodia%20country%20report.pdf
Vietnam Communist Party. (2013). Resolution No. 24-NQ/TW. Hanoi, Vietnam : Vietnam Commu-nist Party. Retrieved from http://nama-vietnam.vn/2013/06/03/resolution-24nq-tw-active-re-sponse-to-climate-change-improvement-of-natural-resource-management-and-environmen-tal-protection/
Vila, A. (18 October, 2018). Philippines plastic pollution: why so much waste ends up in oceans. Re-trieved 8 November, 2019, from South China Morning Post: https://www.scmp.com/lifestyle/health/article/2168819/philippines-plastic-pollution-why-so-much-waste-ends-oceans
Waheed, R., Sarwar, S., & Wei, C. (November, 2019). The survey of economic growth, energy con-sumption and carbon emission. Energy Reports, 5, 1103-1115. doi:https://doi.org/10.1016/j.egyr.2019.07.006
Wang, S., Wang, W., & Yang, H. (2018). Comparison of Product Carbon Footprint Protocols: Case Study on Medium-Density Fiberboard in China. International Journal on Environmental Research and Public Health, 15(2060). Retrieved from https://www.mdpi.com/1660-4601/15/10/2060/pdf
Wang, Y., Chen, L., & Kubota, J. (20 January, 2016). The relationship between urbanization, energy use and carbon emissions: evidence from a panel of Association of Southeast Asian Nations (ASEAN) countries. Journal of Cleaner Production, 112(2), 1368-1374. Retrieved from https://www.sci-encedirect.com/science/article/pii/S0959652615007702
Wasil, W. (11 December, 2018). ‘Dump your e-waste with us, save the environment’. Retrieved 8 No-vember, 2019, from The Scoop: https://thescoop.co/2018/12/11/dump-your-e-waste-with-us-save-the-environment/
Wichai-utcha, N., & Chavalparit, O. (2019). 3Rs Policy and plastic waste management in Thailand. Jour-nal of Material Cycles and Waste Management, 21, 10–22. Retrieved from https://link.springer.com/article/10.1007/s10163-018-0781-y
Wong, A. (9 March, 2017). Trash to cash: collecting Brunei’s waste to export abroad. Retrieved 8 No-vember, 2019, from Biz Brunei: https://www.bizbrunei.com/2017/03/trash-cash-collecting-bru-neis-waste-export-abroad-a-global-green-recycle/
Wong, P. (18 August, 2019). It will cost S$100b or more over next 50 to 100 years to protect Singapore against rising sea levels: PM Lee. (W. P. TING, Editor) Retrieved 29 August, 2019, from TODAY Singapore: https://www.todayonline.com/singapore/it-will-cost-s100b-or-more-over-next-50-to-100-years-protect-singapore-against-rising-sea-levels-pm-lee
Yahaya, N. (2008). Solid waste management in Malaysia: policy, issues and strategies. EA-SWMC EU - Asia Solid Waste Management Cycle Conference, (pp. 23-28). Retrieved from https://www.re-searchgate.net/publication/288900251_Solid_waste_management_in_Malaysia_policy_issues_and_strategies