1 statistics for clinical trials in neurotherapeutics barbara c. tilley, ph.d. barbara c. tilley,...
TRANSCRIPT
11
Statistics for Statistics for Clinical Trials in Clinical Trials in NeurotherapeuticsNeurotherapeutics
Barbara C. Tilley, Ph.D.Barbara C. Tilley, Ph.D. Medical University of South Medical University of South CarolinaCarolina

22
Funding:Funding:
NIA Resource Center on Minority Aging5 P30 AG21677
NINDS Parkinson’s Disease Statistical Center U01NS043127 and U01NS43128
33
Sample SizeSample Size

44
Issues in Issues in NeurotherapeuticsNeurotherapeutics What is the outcome?What is the outcome? How will this be measuredHow will this be measured
– One or many measures of outcome?One or many measures of outcome? How will you analyze the data?How will you analyze the data?
(Nquery $700, STPLAN free, etc.)(Nquery $700, STPLAN free, etc.)

55
Sample Size: Sample Size: Putting it all togetherPutting it all together
Continuous (Normal) DistributionContinuous (Normal) Distribution
Need all but one: Need all but one: , , , , 22, , , N , N Z Z = 1.96 (2 sided, 0.05);= 1.96 (2 sided, 0.05); ZZ = 1.645 (always one-sided, 0.05,= 1.645 (always one-sided, 0.05, 95% power)95% power) = difference between means= difference between means 22 = pooled variance= pooled variance
2
22
)Z4(Z2n

66
Adjusting for Adjusting for Drop-outs/Drop-insDrop-outs/Drop-ins
10% dropout, increasing 10% dropout, increasing sample size by 10% is not sample size by 10% is not enoughenough
Use: 1/(1-R)Use: 1/(1-R)22
Friedman, Furburg, DeMetsFriedman, Furburg, DeMets

77
Sample Size for Sample Size for Multiple Primary Multiple Primary OutcomesOutcomes Choose largestChoose largest
sample size for anysample size for any
single outcome.single outcome. If multiple aims, useIf multiple aims, use
largest sample size forlargest sample size for
any aim. any aim.

88
Sample Size: Sample Size: Food for ThoughtFood for Thought
Is detectable difference Is detectable difference biologically/clinically meaningful?biologically/clinically meaningful?
Is sample size too small to be Is sample size too small to be believable? WHERE DID YOU GET believable? WHERE DID YOU GET the estimate????the estimate????
Report power (for design), not Report power (for design), not conditional power conditional power for negative for negative study.study.

99
Sample Size: Sample Size: Keeping It SmallKeeping It Small
Study continuous outcomeStudy continuous outcome (if variability does not increase)(if variability does not increase)
Updrs Score rather “above or below cut-Updrs Score rather “above or below cut-point”point”
Study surrogate outcome whereStudy surrogate outcome where effect is largeeffect is large
Rankin at 3 months rather than stroke Rankin at 3 months rather than stroke mortalitymortality
Reduce variability (ANCOVA, training, Reduce variability (ANCOVA, training, equipment, choosing model)equipment, choosing model)
1010
Sample Size: KeepingSample Size: Keeping It Small It Small Difference between two means = Difference between two means =
11
Standard deviation = Standard deviation = 22; ; N = N = 6464/group/group
Standard deviation = Standard deviation = 11; ; N = N = 1717/group/group

1111
AnalysisAnalysis
Parametric?Parametric?– NormalNormal– BinomialBinomial
Nonparmetric?Nonparmetric?– RankedRanked

1212
Distribution of Distribution of Barthel IndexBarthel Index
05
101520253035404550
rt-PA
Placebo
100

1313
Sample SizeSample Size
Sample size to detect effect of sizeSample size to detect effect of sizeobserved in NINDS t-PA Stroke Trialobserved in NINDS t-PA Stroke Trial BarthelBarthel::
Non-parametric N = 507Non-parametric N = 507Binary N = 335Binary N = 335
RankinRankin::Non-parametric N = 394Non-parametric N = 394Binary N = 286Binary N = 286

1414
Multiple ComparisonsMultiple Comparisons
Different questions, can argueDifferent questions, can argue no adjustment (O’Brien, 1983)no adjustment (O’Brien, 1983)
– Effect on blood pressureEffect on blood pressure– Effect on quality of lifeEffect on quality of life
All pair-wise comparisons or All pair-wise comparisons or multiple measures of same multiple measures of same outcome, adjustoutcome, adjust
– Pairwise comparisons ofPairwise comparisons ofDrugs A, B, C (same outcome)Drugs A, B, C (same outcome)
1515
Multiple Multiple ComparisonsComparisons
Bonferroni (or less conservative Bonferroni (or less conservative Simes, or Hockberg)Simes, or Hockberg)– /#tests = 0.05/5 = 0.01/#tests = 0.05/5 = 0.01
– Sample size, use adjusted Sample size, use adjusted ANOVA methods – Tukey’s, etc.ANOVA methods – Tukey’s, etc.
– Sample size for ANOVASample size for ANOVA

1616
Bonferroni for Different Bonferroni for Different Primary Outcomes, Same Primary Outcomes, Same ConstructConstruct
All outcomes measure same constructAll outcomes measure same construct– Stroke recoveryStroke recovery– PD progressionPD progression
May lack power when most measures May lack power when most measures of efficacy are improved, but no single of efficacy are improved, but no single measure is overwhelmingly so.measure is overwhelmingly so.
Problem exacerbated when outcomes Problem exacerbated when outcomes are highly correlated.are highly correlated.

1717
Use Global Tests Use Global Tests When:When: No one outcome sufficient or No one outcome sufficient or
desirabledesirable Outcome is difficult to measure Outcome is difficult to measure
and combination of correlated and combination of correlated outcomes usefuloutcomes useful
1818
Properties of Properties of Global TestGlobal Test If all outcome measures perfectly If all outcome measures perfectly
correlated, correlated, test statistic, p-value same as for test statistic, p-value same as for
single (univariate) test single (univariate) test power = power of univariate testpower = power of univariate test
Assumes common dose effectAssumes common dose effect Power increases as correlation Power increases as correlation
among outcomes decreasesamong outcomes decreases

1919
O’Brien’s Non-O’Brien’s Non-parametric Procedure parametric Procedure (Biomet., 1984)(Biomet., 1984)
Separately rank each outcome in Separately rank each outcome in the two treatment groups the two treatment groups combined.combined.
Sum ranks for each subject.Sum ranks for each subject. Compare mean ranks in the two Compare mean ranks in the two
treatment groups usingtreatment groups using– Wilcoxon or t-test Wilcoxon or t-test – ANOVA if more than two treatmentsANOVA if more than two treatments

2020
Sample Size forSample Size forGlobal TestGlobal Test Use largest sample size for single Use largest sample size for single
outcomeoutcome

2121
NINDS t-PA Stroke NINDS t-PA Stroke Trial Binary Outcomes Trial Binary Outcomes (Part II)(Part II)
Outcome rt-PA
Placebo
Odds R. 95% C.L. P
Barthel 50 38 1.63 1.06-2.49 0.03
Rankin 39 26 1.68 1.09-2.59 0.02
Glasgow 44 32 1.64 1.06-2.53 0.03
NIHSS 31 20 1.72 1.05-2.84 0.03
Global 1.73 1.16-2.60 0.008
2222
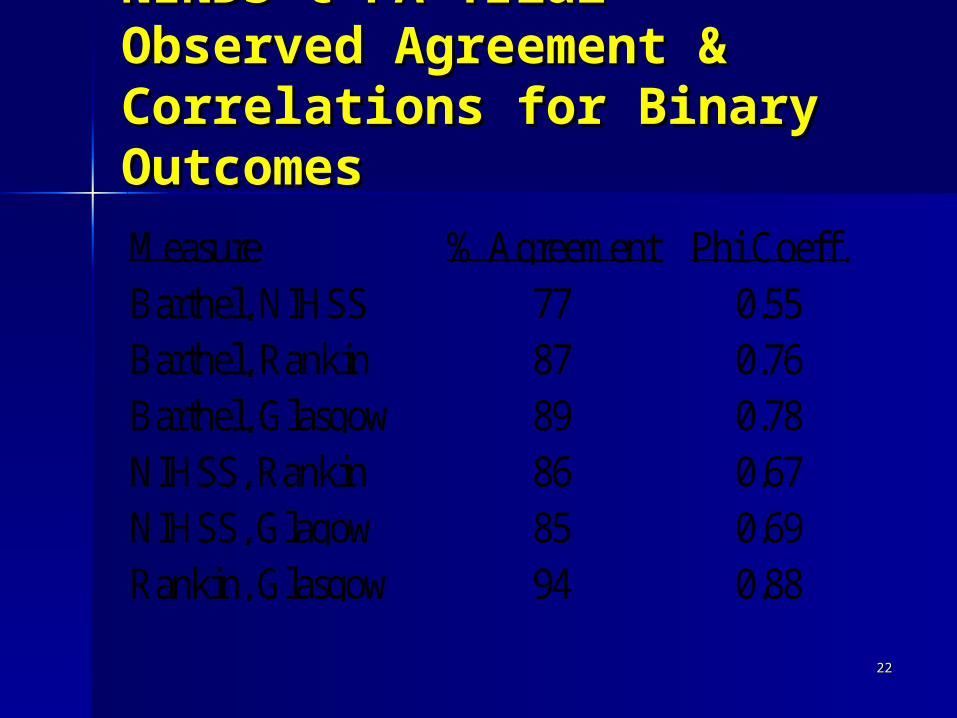
NINDS t-PA Trial NINDS t-PA Trial Observed Agreement & Observed Agreement & Correlations for Binary Correlations for Binary OutcomesOutcomesMeasure % Agreement Phi Coeff.Barthel, NIHSS 77 0.55Barthel, Rankin 87 0.76Barthel, Glasgow 89 0.78NIHSS, Rankin 86 0.67NIHSS, Glagow 85 0.69Rankin, Glasgow 94 0.88

2323
RandomizationRandomization

2424
RandomizationRandomization
StratificationStratification– Age, prior stroke, years with PD, siteAge, prior stroke, years with PD, site– Greatest gain if N < 20Greatest gain if N < 20– Too many strata, difficult to balanceToo many strata, difficult to balance
3 age x 2 years with PD x gender = 123 age x 2 years with PD x gender = 12 Blocking – balance number in each Blocking – balance number in each
treatment grouptreatment group– Important if number expected per site is Important if number expected per site is
smallsmall Minimization Minimization
– Can be complicated to implement, cause Can be complicated to implement, cause delays delays

2525
Interim AnalysesInterim Analyses
Who?Who? Why?Why? When?When? How?How?
2626
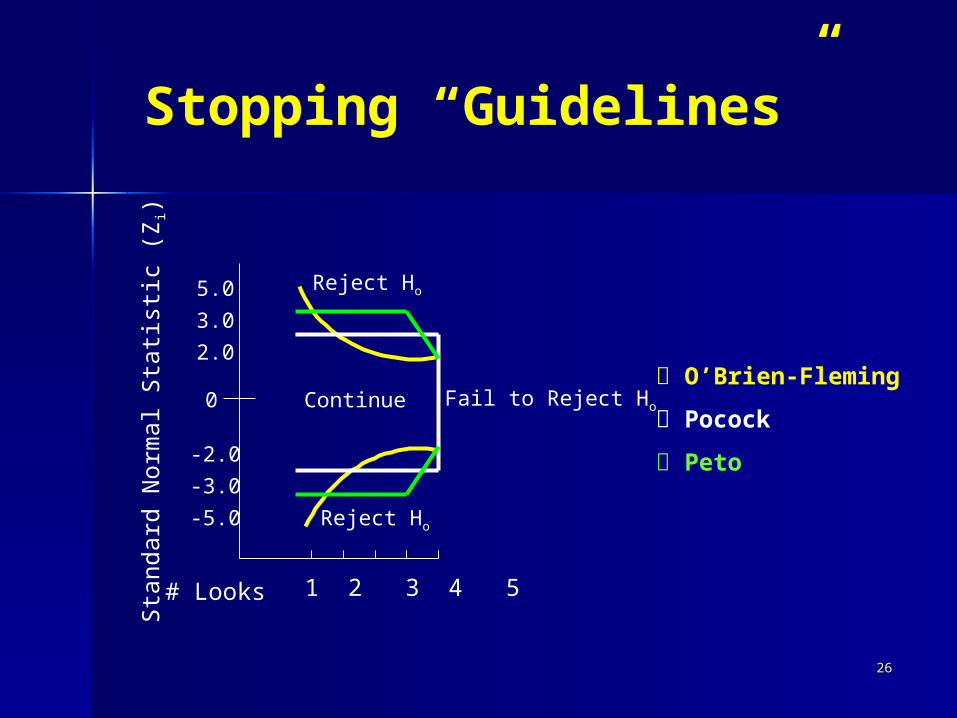
1 2 3 4 5 # Looks
5.0
3.0
2.0
-2.0
-3.0
-5.0
Sta
ndard
Norm
al Sta
tist
ic (
Zi)
Reject Ho
Reject Ho
Continue Fail to Reject Ho
O’Brien-Fleming
Pocock
Peto
Stopping “Guidelines”
0

2727
Intent-to-Treat (ITT)Intent-to-Treat (ITT)
Intent-to-treat means Intent-to-treat means analyzinganalyzing
ALLALL patients as randomized. patients as randomized.Patients lost to follow-up (LTF)Patients lost to follow-up (LTF)Patients who do not adhere to Patients who do not adhere to
treatmenttreatmentPatients who were randomized Patients who were randomized
and did not receive treatmentand did not receive treatmentPatients incorrectly randomizedPatients incorrectly randomized
2828
ImputationImputation
Definition - replacing a value for Definition - replacing a value for those lost to follow-up or not those lost to follow-up or not adhering.adhering.
Imputation may or may not be Imputation may or may not be ITT.ITT.

2929
Optimal ApproachOptimal Approach
MAKE IMPUTATION UNECESSARY!MAKE IMPUTATION UNECESSARY!
3030
Optimal Approach Optimal Approach ContinuedContinued Make follow-up a high priorityMake follow-up a high priority Monitor follow-up closelyMonitor follow-up closely Build in patient incentives Build in patient incentives
– ““gifts” for patients (t-shirts, mugs, gifts” for patients (t-shirts, mugs, etc.)etc.)
– free parking, meal ticketfree parking, meal ticket– TransportationTransportation
Follow even those off treatmentFollow even those off treatment

3131
Hypertension Detection and Hypertension Detection and Follow-up Program/MRFITFollow-up Program/MRFIT
Outcome was mortalityOutcome was mortality HDFP 21/10,940HDFP 21/10,940 MRFIT 30/12,866MRFIT 30/12,866 Used Death Index, Social Used Death Index, Social
Security, detectivesSecurity, detectives

3232
NINDS t-PA Stroke NINDS t-PA Stroke TrialTrial Four 3-month outcomes Four 3-month outcomes
– Barthel,NIHSS,GOS, RankinBarthel,NIHSS,GOS, Rankin NINDS Project Officer pushed for NINDS Project Officer pushed for
complete ascertainmentcomplete ascertainment Study staff made house calls, searched Study staff made house calls, searched
medical recordsmedical records 5/612 (<1%) lost to follow-up on at 5/612 (<1%) lost to follow-up on at
least one of the four outcome measuresleast one of the four outcome measures Used worst value possibleUsed worst value possible

3333
NET-PD Futility StudiesNET-PD Futility StudiesLTF for 1-year outcomeLTF for 1-year outcome(Used worst outcome in assigned group)(Used worst outcome in assigned group)
FS-1FS-1 3/ 3/200200– Creatine 2Creatine 2– Minocycline 0Minocycline 0– Placebo 1Placebo 1
FS-2FS-2 4/ 4/213213– GPI 3GPI 3
– CoQCoQ10 10 11
– Placebo 0Placebo 0

3434
Handling Missing Handling Missing ValuesValues Why?Why? How?How?

3535
When Data Are When Data Are Missing:Missing:Common ApproachesCommon ApproachesApproach ITT Imputation
Completers NO NO
Missing at Random ? NO
Last Obs. Carried Forward
YES YES
Worst Case YES YES
Best/Worst YES YES
Rubin (1998) NO YES
Little & Lau/Others YES YES

3636
Subgroup AnalysesSubgroup Analyses (Sub-set) (Sub-set) Pre-specified based on rationalePre-specified based on rationale
– NINDS t-PA Stroke TrialNINDS t-PA Stroke Trial Those randomized 0-90 minutes and 91-Those randomized 0-90 minutes and 91-
180 minutes from stroke onset180 minutes from stroke onset
Post-hoc in the presence of Post-hoc in the presence of interactioninteraction– (Yusuf, 1991)(Yusuf, 1991)

3737
Subgroup AnalysesSubgroup Analyses
The more subgroups examined, The more subgroups examined, the more likely analyses will lead the more likely analyses will lead to finding a difference by chance to finding a difference by chance alone.alone. 10 mutually exclusive subgroups;10 mutually exclusive subgroups; 20% chance that in one group the 20% chance that in one group the
treatment will be better than control treatment will be better than control and that the converse will be true in and that the converse will be true in anotheranother

3838
Example of Interaction Example of Interaction (Effect Modification) (Effect Modification)
0
10
20
30
40
50
60
Placebo Treatment
% M
ort
alit
y Men
Women

3939
Example of InteractionExample of Interaction(Effect Modification)(Effect Modification)
0
10
20
30
40
50
60
Placebo Treatment
% M
ort
alit
y
Men
Women
4040
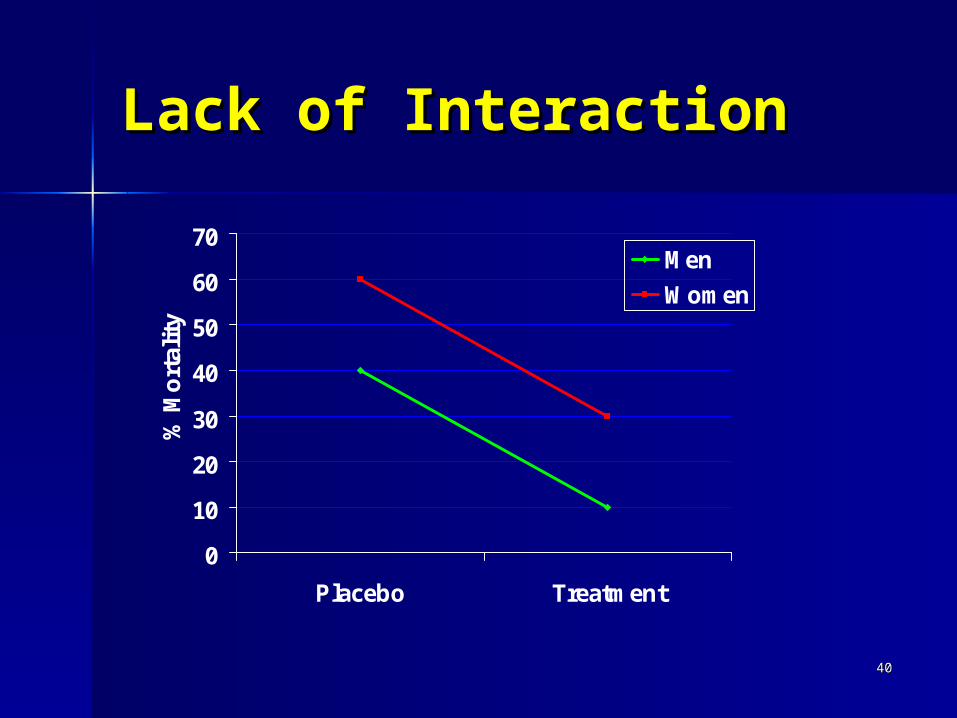
Lack of InteractionLack of Interaction
0
10
20
30
40
50
60
70
Placebo Treatment
% M
ort
alit
y
Men
Women

4141
Trial of Org10172 for Trial of Org10172 for Stroke (TOAST) TrialStroke (TOAST) Trial
0
10
20
30
40
50
60
70
80
90
Placebo Org 10172
% 3
mo
nth
Fav
. O
utc
om
eMen
Women
N = 379(M) 238 (F) N=372(M) 239 (F)
Test for interaction p = 0.251

4242
Pooled AnalysisPooled AnalysisCarotid Carotid EndarterectomyEndarterectomy
0
10
20
Medical Surgical
% w
/ P
rim
ary
Ou
tco
me
Men
Women
N (men) 4175 N(women) 1718 Test for interaction p = 0.007 (Cox model)
Rothwell, 2004 NASCET &ECSTRothwell, 2004 NASCET &ECST

4343
Pooled Analysis Pooled Analysis ECASS, Atlantis, NINDSECASS, Atlantis, NINDS Kent 2005Kent 2005
0
10
20
30
40
50
Placebo t-PA
% M
RS
<=
1Men
Women
N (men) 4175 N(women) 1718 Test for interaction p = 0.04 (logistic model)

4444

4545
ReferencesReferences
Rubin, DB. More powerful randomization-based p-values in Rubin, DB. More powerful randomization-based p-values in double blind trials with non-compliance. Statistics in double blind trials with non-compliance. Statistics in Medicine (1998) 17:317-385.Medicine (1998) 17:317-385.
Little R, Yau L. Intent-to-treat analysis for longitudinal Little R, Yau L. Intent-to-treat analysis for longitudinal studies with drop-outs. Biometrics (1996) 52:1324-1333.studies with drop-outs. Biometrics (1996) 52:1324-1333.
NINDS t-PA Stroke Trial Study Group. Tissue Plasminogen NINDS t-PA Stroke Trial Study Group. Tissue Plasminogen Activator for Acute Stroke (1995) 333:1581-1587.Activator for Acute Stroke (1995) 333:1581-1587.
Curb JD, et al. Ascertainment of vital status through the Curb JD, et al. Ascertainment of vital status through the national death index and social security administration. A J national death index and social security administration. A J Epi (1985)121:754-766.Epi (1985)121:754-766.
Multiple Risk Factor Intervention Trial Research Group. Multiple Risk Factor Intervention Trial Research Group. Multiple risk factor intervention trial: risk factor changes and Multiple risk factor intervention trial: risk factor changes and mortality results. JAMA (1982) 248:1466-77.mortality results. JAMA (1982) 248:1466-77.

4646
EXTRA slides not EXTRA slides not presentedpresented

4747
CompletersCompleters
Retain only those patients who Retain only those patients who remain on treatmentremain on treatment
Was used frequently in past in Was used frequently in past in trials in rheumatoid arthritistrials in rheumatoid arthritis
Not intent-to-treatNot intent-to-treat Obvious potential for biasObvious potential for bias
– patients not responding to treatment patients not responding to treatment drop-outdrop-out

4848
Last Observation Last Observation Carried ForwardCarried Forward For those missing a final value, For those missing a final value,
use most recent previous use most recent previous observation.observation.
Potential for bias in disease with Potential for bias in disease with downward coursedownward course

4949
Worst case Worst case
Replace missing values with worst Replace missing values with worst outcomeoutcome– assumes that those who are lost to assumes that those who are lost to
follow-up were not successfully follow-up were not successfully treatedtreated
– generally variance is not inflatedgenerally variance is not inflated– could inflate or deflate differencescould inflate or deflate differences

5050
Best Case/Worst CaseBest Case/Worst Case
Replace missing values in Replace missing values in treatment group by worst outcome treatment group by worst outcome and missing values in comparison and missing values in comparison group with best outcome.group with best outcome.– Rarely usedRarely used– Generally overly conservative as both Generally overly conservative as both
treatment and placebo group drop-out treatment and placebo group drop-out for lack of efficacy.for lack of efficacy.

5151
Missing at RandomMissing at Random
Drop-out at time t does not depend Drop-out at time t does not depend on unobserved outcomes at times on unobserved outcomes at times t’t’>> t, after conditioning on data up t, after conditioning on data up to time t.to time t.
Example:Example:– a patient misses follow-up visit a patient misses follow-up visit
because she is not feeling well (small because she is not feeling well (small TIA’s) then has a major stroke a week TIA’s) then has a major stroke a week later.later.
5252
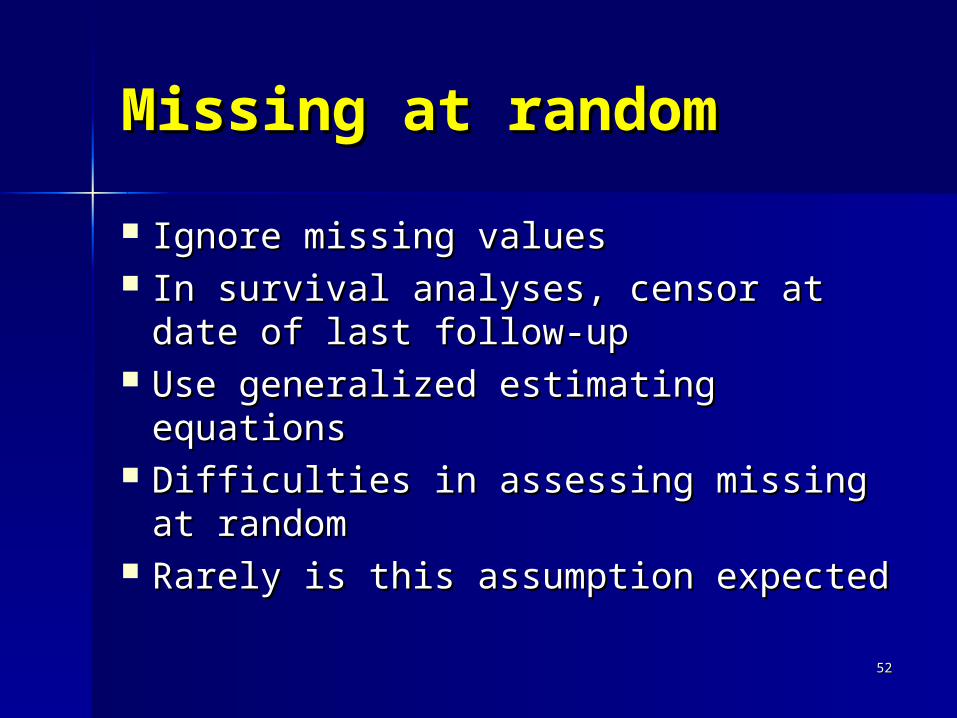
Missing at randomMissing at random
Ignore missing valuesIgnore missing values In survival analyses, censor at date In survival analyses, censor at date
of last follow-upof last follow-up Use generalized estimating Use generalized estimating
equations equations Difficulties in assessing missing at Difficulties in assessing missing at
randomrandom Rarely is this assumption expectedRarely is this assumption expected
5353
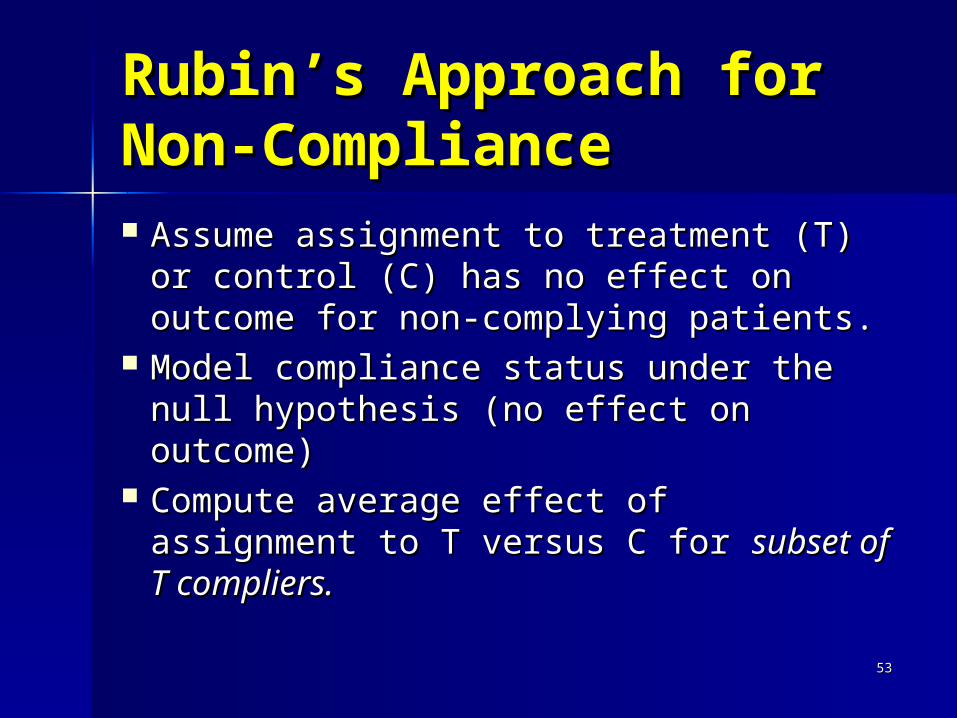
Rubin’s Approach for Rubin’s Approach for Non-ComplianceNon-Compliance Assume assignment to treatment (T) Assume assignment to treatment (T)
or control (C) has no effect on or control (C) has no effect on outcome for non-complying patients.outcome for non-complying patients.
Model compliance status under the Model compliance status under the null hypothesis (no effect on null hypothesis (no effect on outcome)outcome)
Compute average effect of Compute average effect of assignment to T versus C for assignment to T versus C for subset subset of T compliers.of T compliers.
5454
Rubin’s Approach Rubin’s Approach ContinuedContinued Few studies have “pure” non-Few studies have “pure” non-
compliers.compliers. Pure non-compliersPure non-compliers
– those refusing surgery in surgical trialthose refusing surgery in surgical trial– those refusing medication after those refusing medication after
randomizationrandomization If patients take some medication, If patients take some medication,
there may be carryover treatment there may be carryover treatment effectseffects

5555
Little’s Approach to Little’s Approach to ImputationImputation Uses multiple imputation for patients Uses multiple imputation for patients
who are missing information based on who are missing information based on actual dose after drop-out if known or actual dose after drop-out if known or assumption.assumption.
Accounts for uncertainty in parameter Accounts for uncertainty in parameter estimates.estimates.– Model parameters drawn from posterior Model parameters drawn from posterior
distn’, then missing values drawn from distn’, then missing values drawn from predictive distn’ conditional on drawn predictive distn’ conditional on drawn parameters.parameters.

5656
Geller, et alGeller, et al
Raynaud’s Treatment StudyRaynaud’s Treatment Study Model missing values using patient Model missing values using patient
covariates at baseline to identify covariates at baseline to identify similar patient(s) with follow-up similar patient(s) with follow-up (neighbor)(neighbor)
Weights neighbor, sets weight for Weights neighbor, sets weight for missing patient to zero missing patient to zero
(Propensity Score)(Propensity Score)

5757
Sample Size for Sample Size for Composite Favorable Composite Favorable Outcome*Outcome*
Comp.Outcome rt-PA Placebo N/Group
At least 1 0.54 0.41 309
At least 2 0.43 0.32 405
At least 3 0.39 0.27 321
All four 0.27 0.16 289
*Power 90%, = 0.05, two-sided test

5858
LTF Groups And Imputation Methods in WARSS
GroupGroup Sample ReasonSample Reason
for LTF for LTF MethodMethod
1 Endpoint Imminent1 Endpoint Imminent““Terminal ALS” on CRF Terminal ALS” on CRF oror
rapidly worsening rapidly worsening symptoms symptoms
Impute endpointImpute endpoint
at LTFat LTF
2 Cause of LTF2 Cause of LTF
is is independent of independent of timetime
to future endpointto future endpoint
Daughter moves Daughter moves
to Puerto Rico, patient to Puerto Rico, patient moves with hermoves with her
Censor at LTFCensor at LTF
3 Cause of LTF 3 Cause of LTF is is notnot
independent of time independent of time toto
future endpointfuture endpoint
Patient has a seriesPatient has a series
of TIAs, is then LTFof TIAs, is then LTF
Model time to Model time to endpoint (multiple endpoint (multiple
imputation)imputation)

5959
Baseline risk factorsAgeNo College Education Low or High ETOH Consumption Sedentary life style Hx Diabetes Hx Cardiac Disease Hx Diabetes and Hx Stroke Hx Diabetes and Glasgow <5
Among the 12 group 3 patients: Primary endpoints imputed for 2 patients Event-free follow-up imputed for 10 patients
Variables in The Imputation Model