1 pedestrian traffic study pittsburgh downtown partnership fall 2006 prepared by: strategic metrics...
TRANSCRIPT
1
Pedestrian Traffic Study
Pittsburgh Downtown PartnershipFall 2006
Prepared by: STRATEGIC METRICS GROUP
www.strategicmetricsgroup.com 412.480.4332

2
SUMMARY OF KEY FINDINGSSUMMARY OF KEY FINDINGS
Traffic volume varies greatly across the 8 locations. The daily average traffic count is 4,557 pedestrians; with the highest count on Smithfield and the lowest at Market Square (Clock).
Saturday traffic (1,847) is significantly less than weekday (5,755).
Those working downtown comprise the majority (59%) of the pedestrian base.
Pedestrians spend an average of $47 a week downtown:- Retail $19 - Food $24 - Services $4
Downtown residents are a small, but important group. While small in number (just 3% of pedestrian base), residents spend substantially more downtown than all other pedestrian groups.
3
SUMMARY OF KEY FINDINGSSUMMARY OF KEY FINDINGS
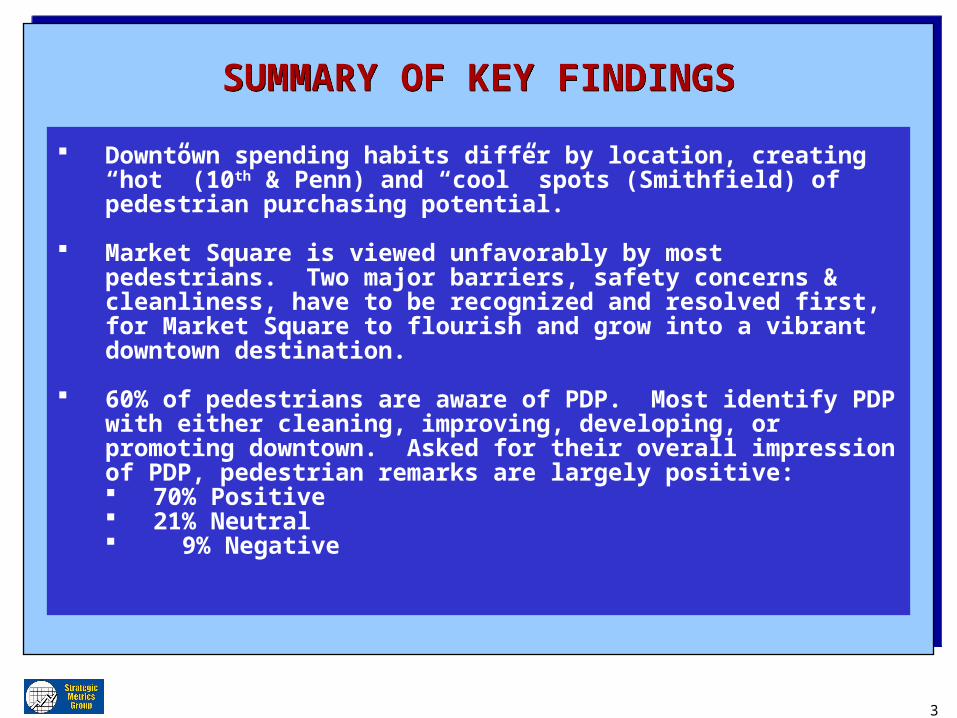
Downtown spending habits differ by location, creating “hot” (10th & Penn) and “cool” spots (Smithfield) of pedestrian purchasing potential.
Market Square is viewed unfavorably by most pedestrians. Two major barriers, safety concerns & cleanliness, have to be recognized and resolved first, for Market Square to flourish and grow into a vibrant downtown destination.
60% of pedestrians are aware of PDP. Most identify PDP with either cleaning, improving, developing, or promoting downtown. Asked for their overall impression of PDP, pedestrian remarks are largely positive: 70% Positive 21% Neutral 9% Negative
4
1. Methodology and Sampling
2. Pedestrian Traffic Data
3. Pedestrian Survey Findings
4. Location & Pedestrian Profiles
5. Key Findings & Summary
1. Methodology and Sampling
2. Pedestrian Traffic Data
3. Pedestrian Survey Findings
4. Location & Pedestrian Profiles
5. Key Findings & Summary
5
WHO WAS COUNTED AND SURVEYEDWHO WAS COUNTED AND SURVEYED
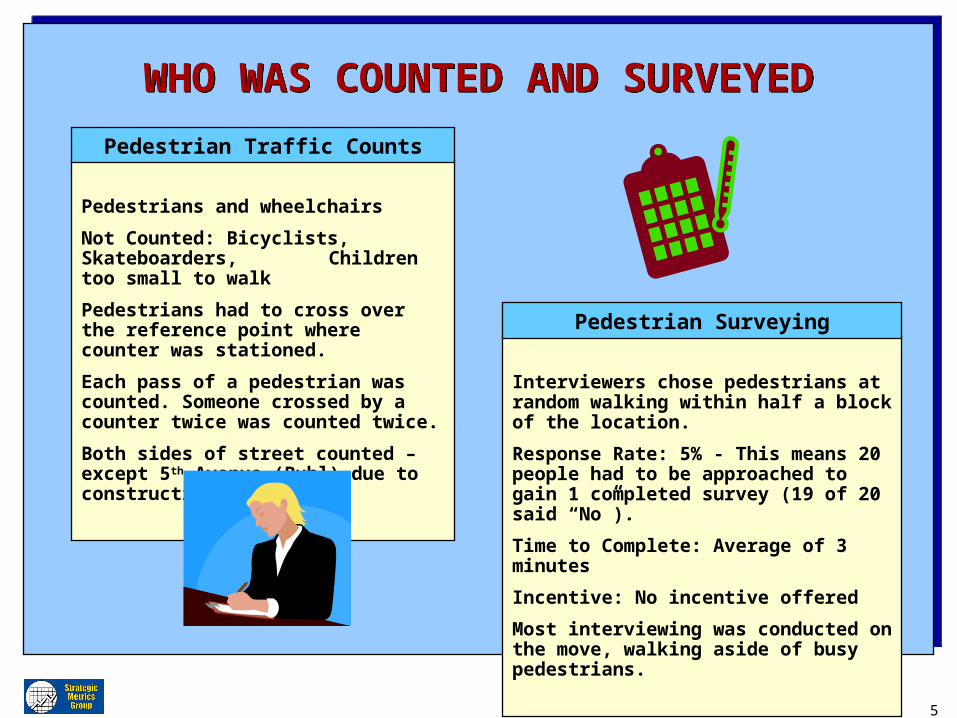
Pedestrians and wheelchairs
Not Counted: Bicyclists, Skateboarders, Children too small to walk
Pedestrians had to cross over the reference point where counter was stationed.
Each pass of a pedestrian was counted. Someone crossed by a counter twice was counted twice.
Both sides of street counted – except 5th Avenue (Buhl) due to construction.
Pedestrian Traffic Counts
Interviewers chose pedestrians at random walking within half a block of the location.
Response Rate: 5% - This means 20 people had to be approached to gain 1 completed survey (19 of 20 said “No”).
Time to Complete: Average of 3 minutes
Incentive: No incentive offered
Most interviewing was conducted on the move, walking aside of busy pedestrians.
Pedestrian Surveying
6
EIGHT TARGET LOCATIONSSTUDIED IN TWO PHASES
EIGHT TARGET LOCATIONSSTUDIED IN TWO PHASES
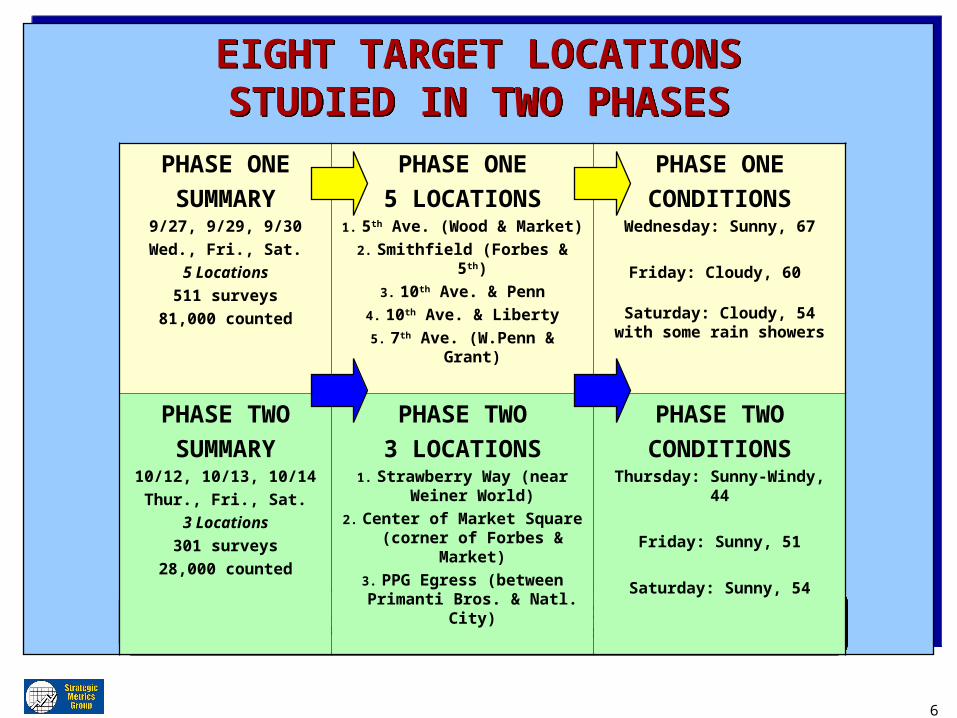
Surveying and counting were both conducted throughout entire 12 hour day (7:00 AM to 7:00 PM).
Surveying and counting were both conducted throughout entire 12 hour day (7:00 AM to 7:00 PM).
PHASE ONE
SUMMARY9/27, 9/29, 9/30
Wed., Fri., Sat.
5 Locations
511 surveys
81,000 counted
PHASE ONE
5 LOCATIONS1. 5th Ave. (Wood & Market)
2. Smithfield (Forbes & 5th)
3. 10th Ave. & Penn
4. 10th Ave. & Liberty
5. 7th Ave. (W.Penn & Grant)
PHASE ONE
CONDITIONSWednesday: Sunny, 67
Friday: Cloudy, 60
Saturday: Cloudy, 54 with some rain showers
PHASE TWO
SUMMARY10/12, 10/13, 10/14
Thur., Fri., Sat.
3 Locations
301 surveys
28,000 counted
PHASE TWO
3 LOCATIONS1. Strawberry Way (near Weiner
World)
2. Center of Market Square (corner of Forbes & Market)
3. PPG Egress (between Primanti Bros. & Natl. City)
PHASE TWO
CONDITIONSThursday: Sunny-Windy, 44
Friday: Sunny, 51
Saturday: Sunny, 54
7
COUNTER’S REFERENCE POINT AT EACH LOCATION
COUNTER’S REFERENCE POINT AT EACH LOCATION
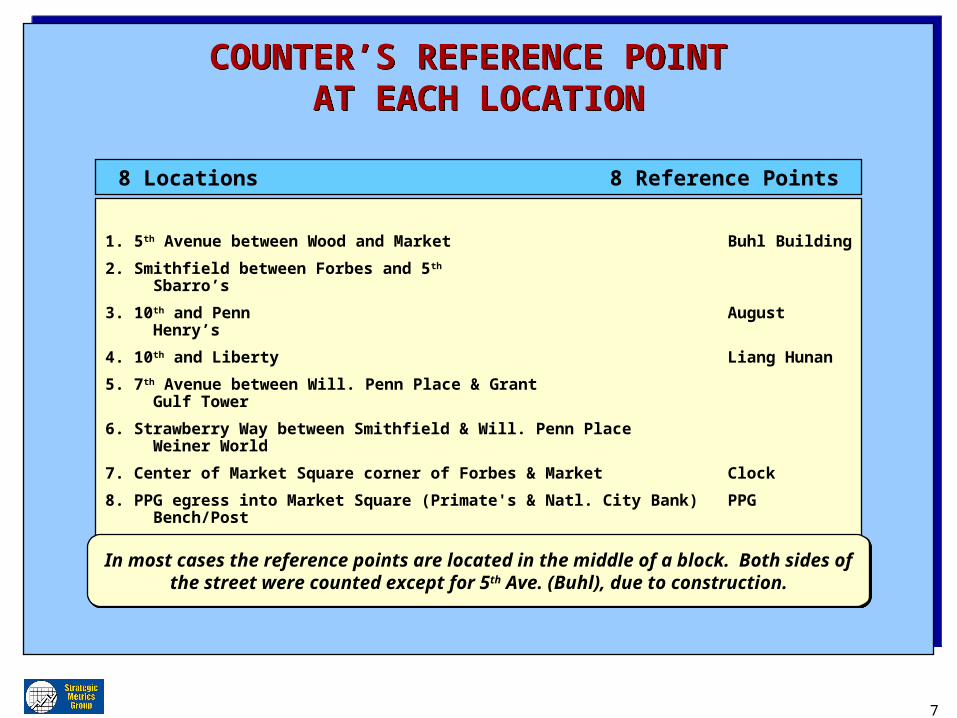
1. 5th Avenue between Wood and Market Buhl Building
2. Smithfield between Forbes and 5th Sbarro’s
3. 10th and Penn August Henry’s
4. 10th and Liberty Liang Hunan
5. 7th Avenue between Will. Penn Place & Grant Gulf Tower
6. Strawberry Way between Smithfield & Will. Penn Place Weiner World
7. Center of Market Square corner of Forbes & Market Clock
8. PPG egress into Market Square (Primate's & Natl. City Bank) PPG Bench/Post
8 Locations 8 Reference Points
In most cases the reference points are located in the middle of a block. Both sides of the street were counted except for 5th Ave. (Buhl), due to construction.
In most cases the reference points are located in the middle of a block. Both sides of the street were counted except for 5th Ave. (Buhl), due to construction.
8
1. Methodology and Sampling
2. Pedestrian Traffic Data
3. Pedestrian Survey Findings
4. Location & Pedestrian Profiles
5. Key Findings & Summary
1. Methodology and Sampling
2. Pedestrian Traffic Data
3. Pedestrian Survey Findings
4. Location & Pedestrian Profiles
5. Key Findings & Summary

9
TOTAL PEDESTRIAN TRAFFIC COUNT8 Locations
TOTAL PEDESTRIAN TRAFFIC COUNT8 Locations
0
2,000
4,000
6,000
8,000
10,000
0
2,000
4,000
6,000
8,000
10,000
n =109,356
A total of 109,356 pedestrians were counted over the entire project. Peak volume times include 8 AM, 5 PM, and the lunch or mid-day hour.
Time of Day
# of Pedestrians
10
TOTAL COUNT BY LOCATION3 Day Pedestrian Totals
TOTAL COUNT BY LOCATION3 Day Pedestrian Totals
16,767 16,62915,633
11,0039,758
7,205
4,405
27,956
0
5,000
10,000
15,000
20,000
25,000
30,000
35,000
Smithfield MS PPG 10th Lib 5th Ave. 7th Ave. 10th Penn Strawberry MS Clock
16,767 16,62915,633
11,0039,758
7,205
4,405
27,956
0
5,000
10,000
15,000
20,000
25,000
30,000
35,000
Smithfield MS PPG 10th Lib 5th Ave. 7th Ave. 10th Penn Strawberry MS Clock
OverallLocation Average
13,670
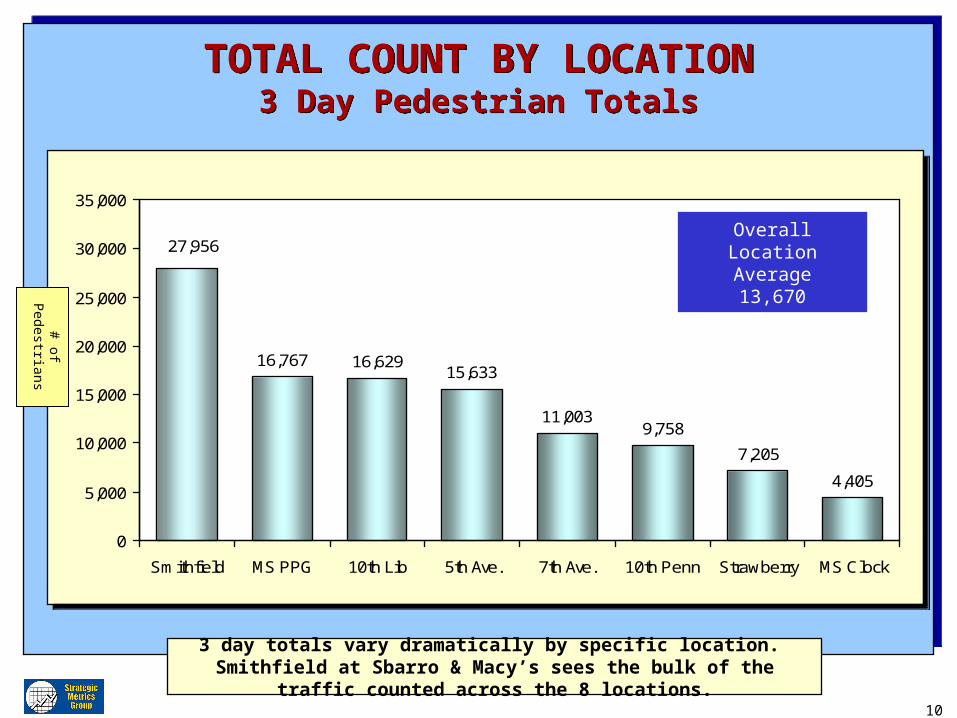
3 day totals vary dramatically by specific location. Smithfield at Sbarro & Macy’s sees the bulk of the traffic counted across the 8 locations.
# of Pedestrians
11
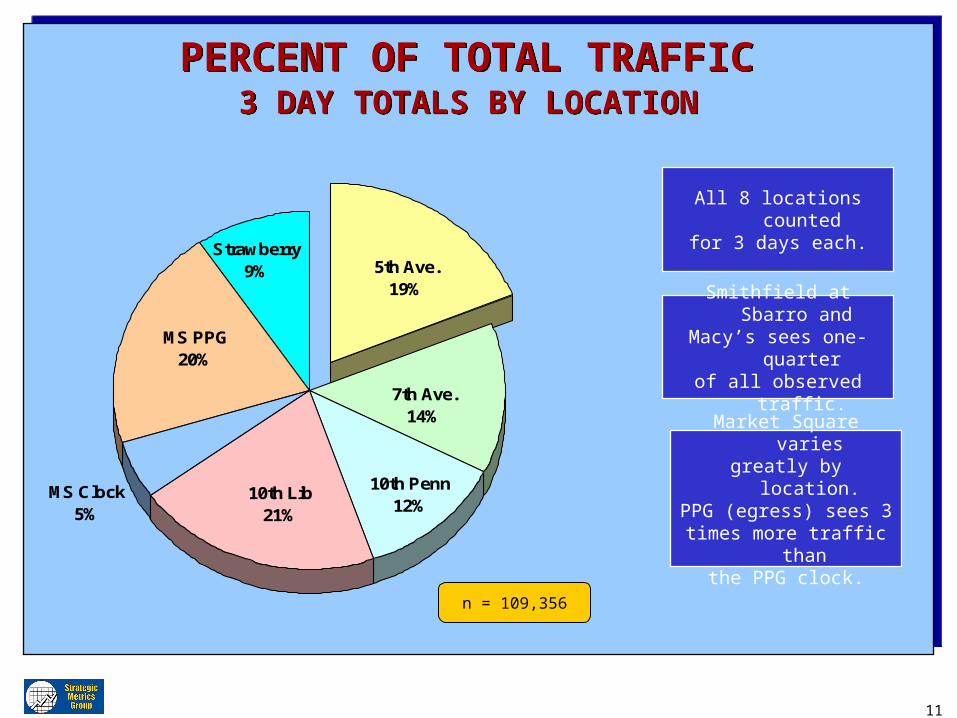
PERCENT OF TOTAL TRAFFIC 3 DAY TOTALS BY LOCATION
PERCENT OF TOTAL TRAFFIC 3 DAY TOTALS BY LOCATION
n = 109,356
All 8 locations countedfor 3 days each.
10th Penn12%
7th Ave.14%
5th Ave.19%
MS PPG20%
Strawberry9%
MS Clock5%
10th Lib21%
Smithfield at Sbarro and Macy’s sees one-quarter
of all observed traffic.
Market Square variesgreatly by location.
PPG (egress) sees 3times more traffic than
the PPG clock.

12
AVERAGE DAILY COUNT BY LOCATIONMean Number of Pedestrians
AVERAGE DAILY COUNT BY LOCATIONMean Number of Pedestrians
5,589 5,5435,211
3,6683,253
2,402
1,468
9,319
0
2,000
4,000
6,000
8,000
10,000
12,000
Smithfield MS PPG 10th Lib 5th Ave. 7th Ave. 10th Penn Strawberry MS Clock
5,589 5,5435,211
3,6683,253
2,402
1,468
9,319
0
2,000
4,000
6,000
8,000
10,000
12,000
Smithfield MS PPG 10th Lib 5th Ave. 7th Ave. 10th Penn Strawberry MS Clock
Overall DailyLocation Average
4,557
Each location average is based on a 3 day average – 2 weekdays and a Saturday.
# of Pedestrians
13
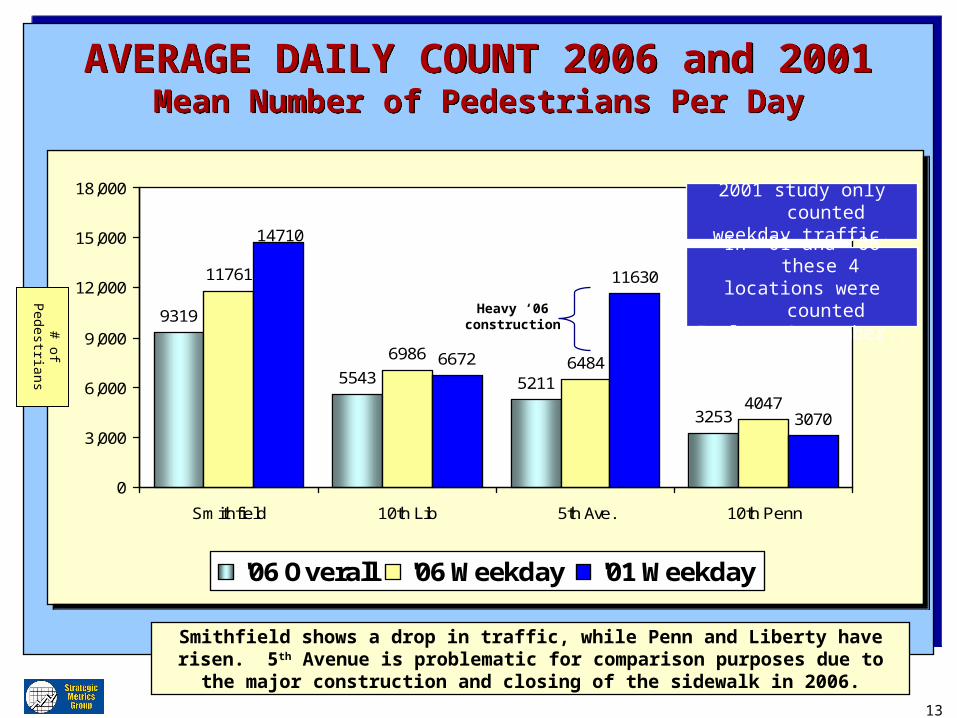
AVERAGE DAILY COUNT 2006 and 2001Mean Number of Pedestrians Per Day
AVERAGE DAILY COUNT 2006 and 2001Mean Number of Pedestrians Per Day
9319
5543 5211
3253
11761
69866484
4047
6672
11630
3070
14710
0
3,000
6,000
9,000
12,000
15,000
18,000
Smithfield 10th Lib 5th Ave. 10th Penn
'06 Overall '06 Weekday '01 Weekday
9319
5543 5211
3253
11761
69866484
4047
6672
11630
3070
14710
0
3,000
6,000
9,000
12,000
15,000
18,000
Smithfield 10th Lib 5th Ave. 10th Penn
'06 Overall '06 Weekday '01 Weekday
Smithfield shows a drop in traffic, while Penn and Liberty have risen. 5 th Avenue is problematic for comparison purposes due to the major construction and closing of
the sidewalk in 2006.
# of Pedestrians
Heavy ‘06construction
2001 study only countedweekday traffic.
In ’01 and ’06 these 4 locations were counted
In late September..
14
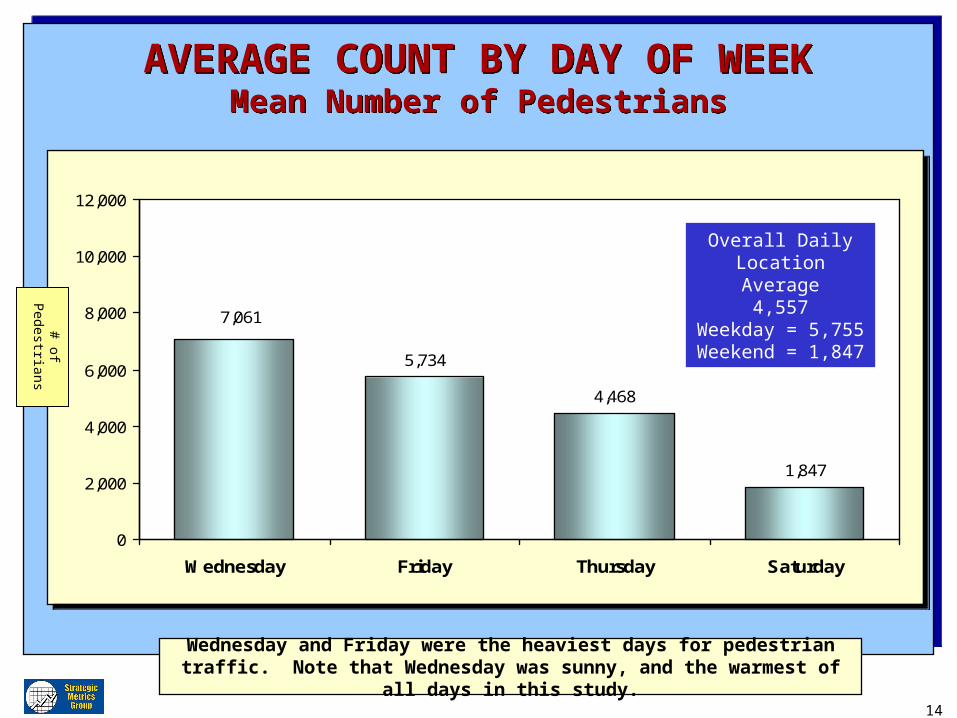
AVERAGE COUNT BY DAY OF WEEKMean Number of Pedestrians
AVERAGE COUNT BY DAY OF WEEKMean Number of Pedestrians
5,734
4,468
1,847
7,061
0
2,000
4,000
6,000
8,000
10,000
12,000
Wednesday Friday Thursday Saturday
5,734
4,468
1,847
7,061
0
2,000
4,000
6,000
8,000
10,000
12,000
Wednesday Friday Thursday Saturday
Wednesday and Friday were the heaviest days for pedestrian traffic. Note that Wednesday was sunny, and the warmest of all days in this study.
Overall DailyLocation Average
4,557Weekday = 5,755Weekend = 1,847
# of Pedestrians
15
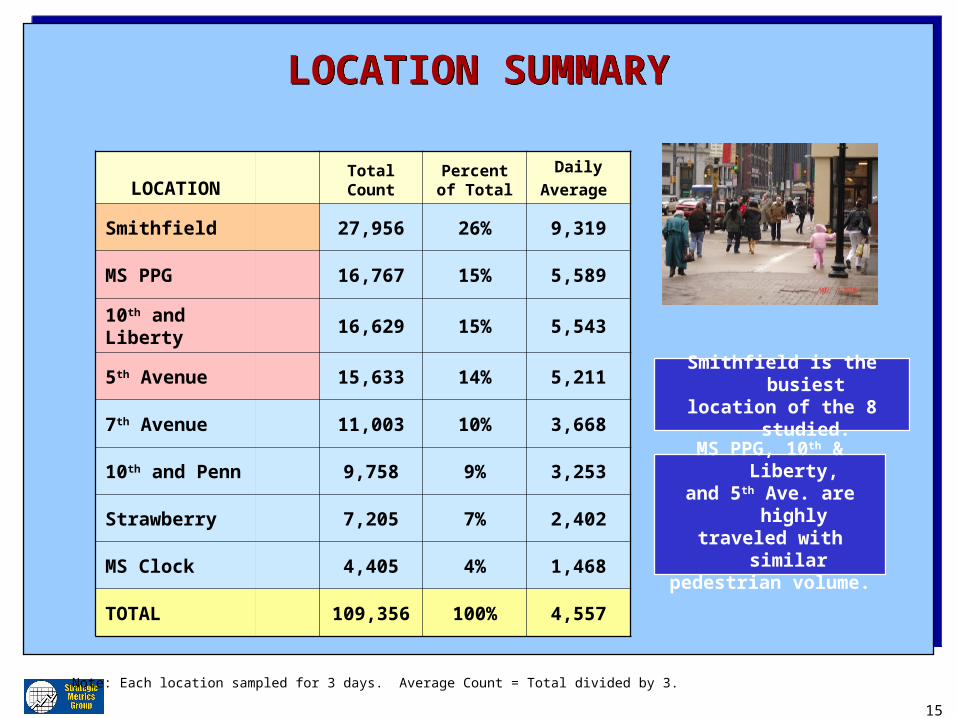
LOCATION SUMMARYLOCATION SUMMARY
LOCATIONTotal Count
Percent of Total
Daily
Average
Smithfield 27,956 26% 9,319
MS PPG 16,767 15% 5,589
10th and Liberty 16,629 15% 5,543
5th Avenue 15,633 14% 5,211
7th Avenue 11,003 10% 3,668
10th and Penn 9,758 9% 3,253
Strawberry 7,205 7% 2,402
MS Clock 4,405 4% 1,468
TOTAL 109,356 100% 4,557
Note: Each location sampled for 3 days. Average Count = Total divided by 3.
Smithfield is the busiestlocation of the 8 studied.
MS PPG, 10th & Liberty,and 5th Ave. are highlytraveled with similar pedestrian volume.
16
Wed Smith
Fri Smith
Thu MS PPG
Fri 5th Ave
Wed 10/Lib
Fri 10/Lib
Fri MS PPG
Wed 5th Ave
Wed 7th Ave
Fri 7th Ave
Sat Smith
Wed 10/Penn
Fri 10/Penn
Fri Straw
Thu Straw
Sat 5th Ave
Sat 10/Lib
Thu MS Clock
Fri MS Clock
Sat MS PPG
Sat 10/Penn
Sat 7th Ave
Sat MS Clock
Sat Straw
Wed Smith
Fri Smith
Thu MS PPG
Fri 5th Ave
Wed 10/Lib
Fri 10/Lib
Fri MS PPG
Wed 5th Ave
Wed 7th Ave
Fri 7th Ave
Sat Smith
Wed 10/Penn
Fri 10/Penn
Fri Straw
Thu Straw
Sat 5th Ave
Sat 10/Lib
Thu MS Clock
Fri MS Clock
Sat MS PPG
Sat 10/Penn
Sat 7th Ave
Sat MS Clock
Sat Strawn = 109,356
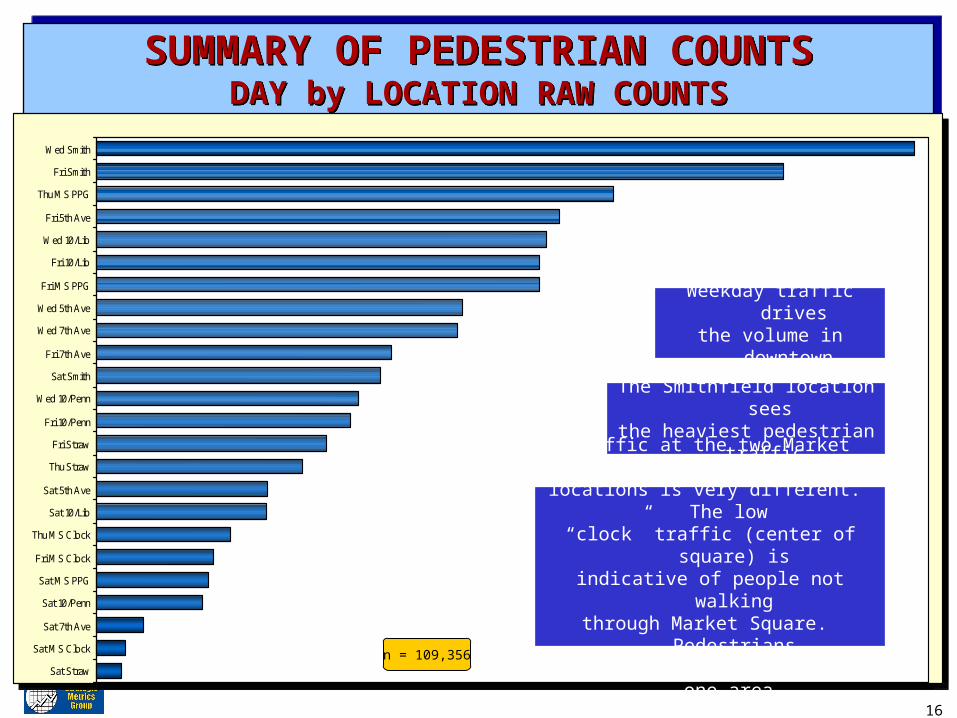
SUMMARY OF PEDESTRIAN COUNTSDAY by LOCATION RAW COUNTS
SUMMARY OF PEDESTRIAN COUNTSDAY by LOCATION RAW COUNTS
Weekday traffic drivesthe volume in downtown.
The Smithfield location seesthe heaviest pedestrian traffic.
Traffic at the two Market Square locations is very different. The low “clock” traffic (center of square) isindicative of people not walking
through Market Square. Pedestrianswalk the perimeter or stay in one area.

17
COUNT OF ALL TRAFFICCOUNT OF ALL TRAFFIC
WED THURFRI SAT TOTAL
Smithfield 12,785 NC 10,736 4,435 27,956
5th Avenue 5,731 NC 7,237 2,665 15,633
7th Avenue 5,648 NC 4,615 740 11,003
10th and Penn 4,110 NC 3,984 1,664 9,758
10th and Liberty 7,032 NC 6,939 2,658 16,629
Market Square Clock
NC 2,099 1,843 463 4,405
Market Square PPG
NC 8,079 6,935 1,753 16,767
Strawberry Way NC 3,227 3,583 395 7,205
TOTAL 35,306 13,405 45,872 14,773 109,356
n = 109,356Note: NC = “not counted”. Phase 1 counted on Wed., Phase 2 on Thur..
18
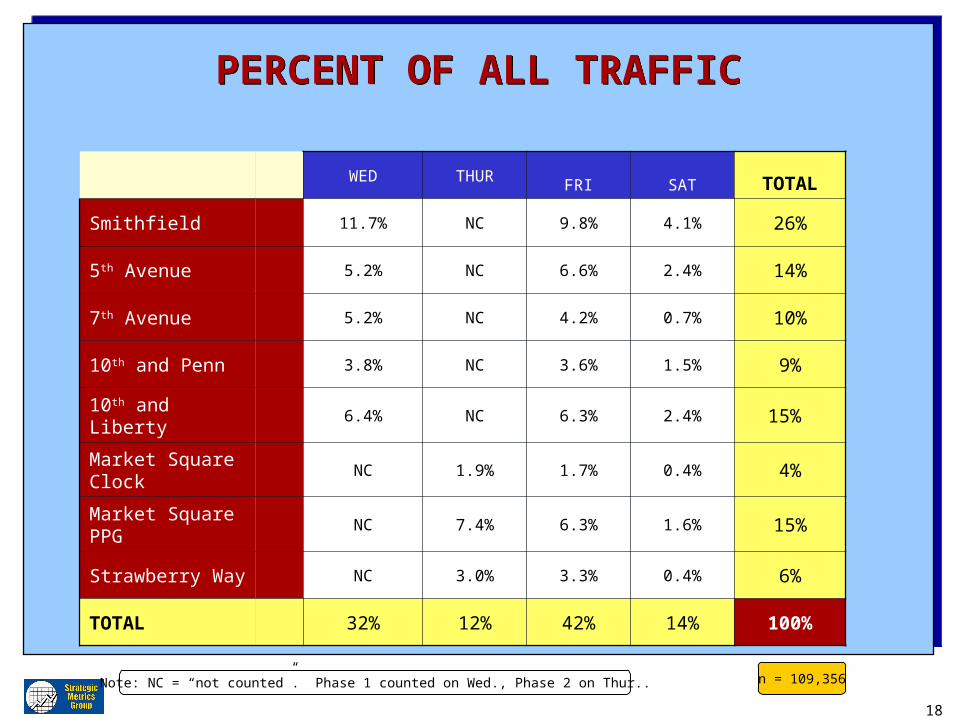
PERCENT OF ALL TRAFFICPERCENT OF ALL TRAFFIC
WED THURFRI SAT TOTAL
Smithfield 11.7% NC 9.8% 4.1% 26%
5th Avenue 5.2% NC 6.6% 2.4% 14%
7th Avenue 5.2% NC 4.2% 0.7% 10%
10th and Penn 3.8% NC 3.6% 1.5% 9%
10th and Liberty 6.4% NC 6.3% 2.4% 15%
Market Square Clock
NC 1.9% 1.7% 0.4% 4%
Market Square PPG
NC 7.4% 6.3% 1.6% 15%
Strawberry Way NC 3.0% 3.3% 0.4% 6%
TOTAL 32% 12% 42% 14% 100%
n = 109,356Note: NC = “not counted”. Phase 1 counted on Wed., Phase 2 on Thur..
19
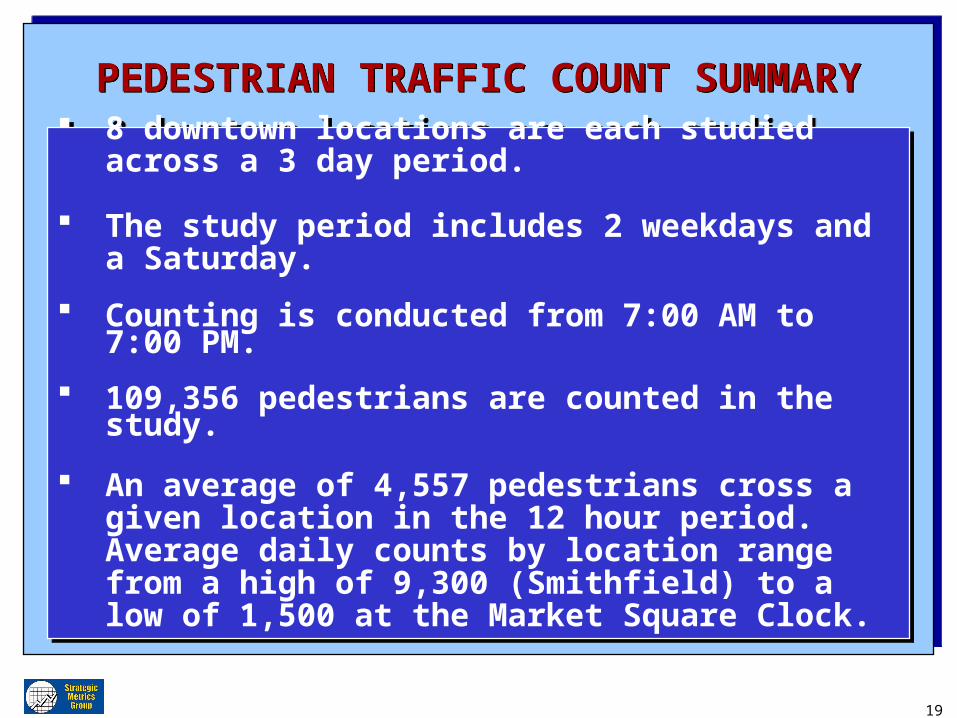
PEDESTRIAN TRAFFIC COUNT SUMMARYPEDESTRIAN TRAFFIC COUNT SUMMARY
8 downtown locations are each studied across a 3 day period.
The study period includes 2 weekdays and a Saturday.
Counting is conducted from 7:00 AM to 7:00 PM.
109,356 pedestrians are counted in the study.
An average of 4,557 pedestrians cross a given location in the 12 hour period. Average daily counts by location range from a high of 9,300 (Smithfield) to a low of 1,500 at the Market Square Clock.
20
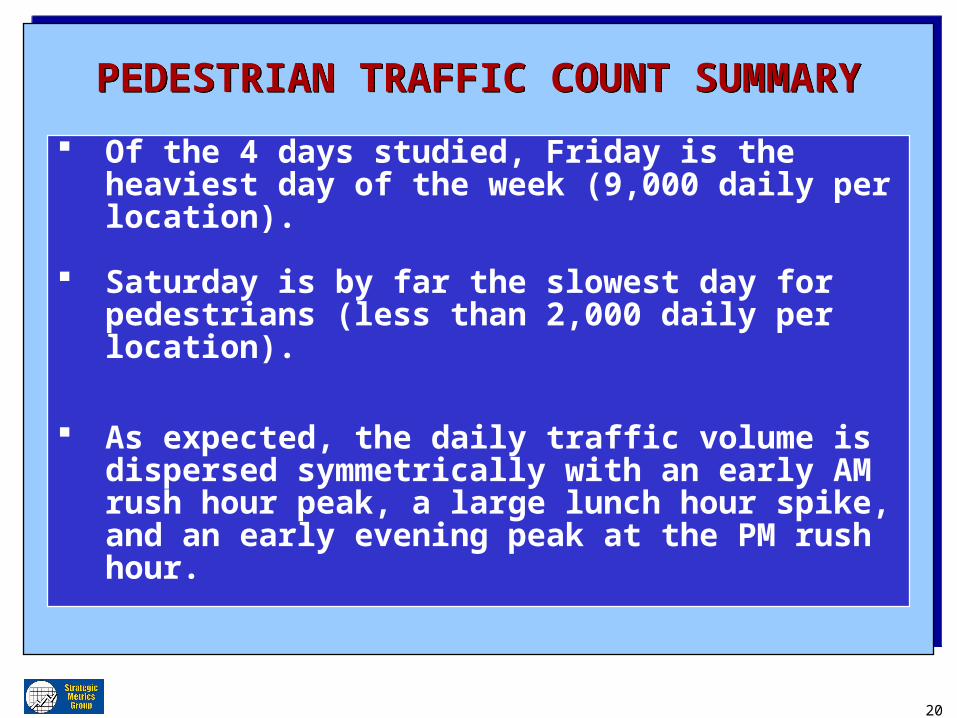
PEDESTRIAN TRAFFIC COUNT SUMMARYPEDESTRIAN TRAFFIC COUNT SUMMARY
Of the 4 days studied, Friday is the heaviest day of the week (9,000 daily per location).
Saturday is by far the slowest day for pedestrians (less than 2,000 daily per location).
As expected, the daily traffic volume is dispersed symmetrically with an early AM rush hour peak, a large lunch hour spike, and an early evening peak at the PM rush hour.
21
PRESENTATION OVERVIEW PRESENTATION OVERVIEW
1. Methodology and Sampling
2. Pedestrian Traffic Data
3. Pedestrian Survey Findings
4. Location & Pedestrian Profiles
5. Key Findings & Summary
1. Methodology and Sampling
2. Pedestrian Traffic Data
3. Pedestrian Survey Findings
4. Location & Pedestrian Profiles
5. Key Findings & Summary
22
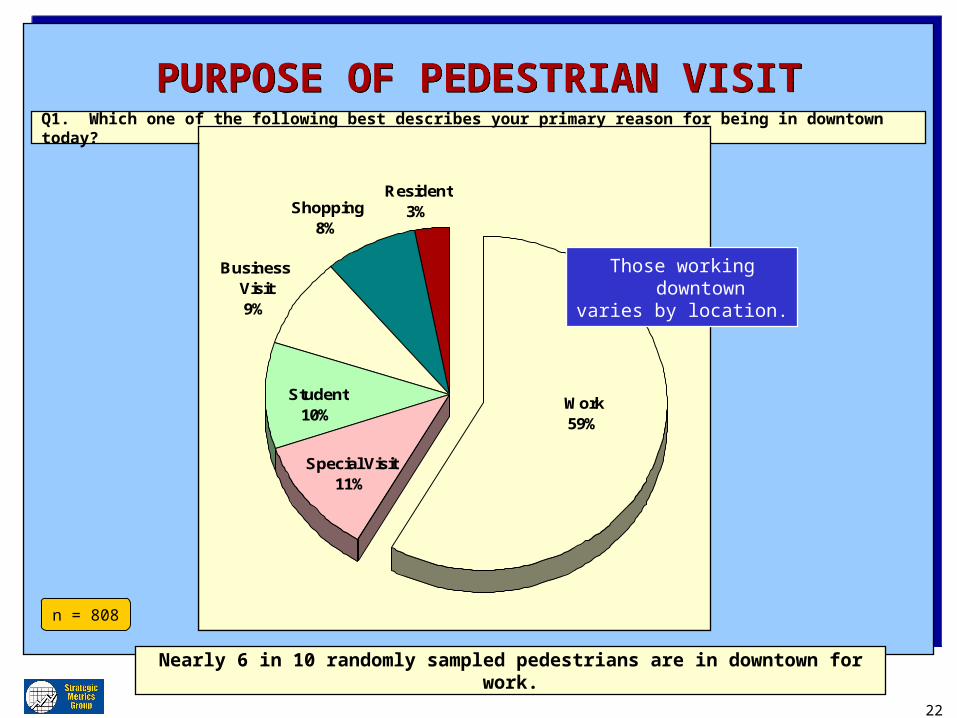
PURPOSE OF PEDESTRIAN VISITPURPOSE OF PEDESTRIAN VISITQ1. Which one of the following best describes your primary reason for being in downtown today?
n = 808
Shopping8%
Resident3%
Business Visit9%
Work59%
Special Visit11%
Student10%
Nearly 6 in 10 randomly sampled pedestrians are in downtown for work.
Those working downtown varies by location.
23
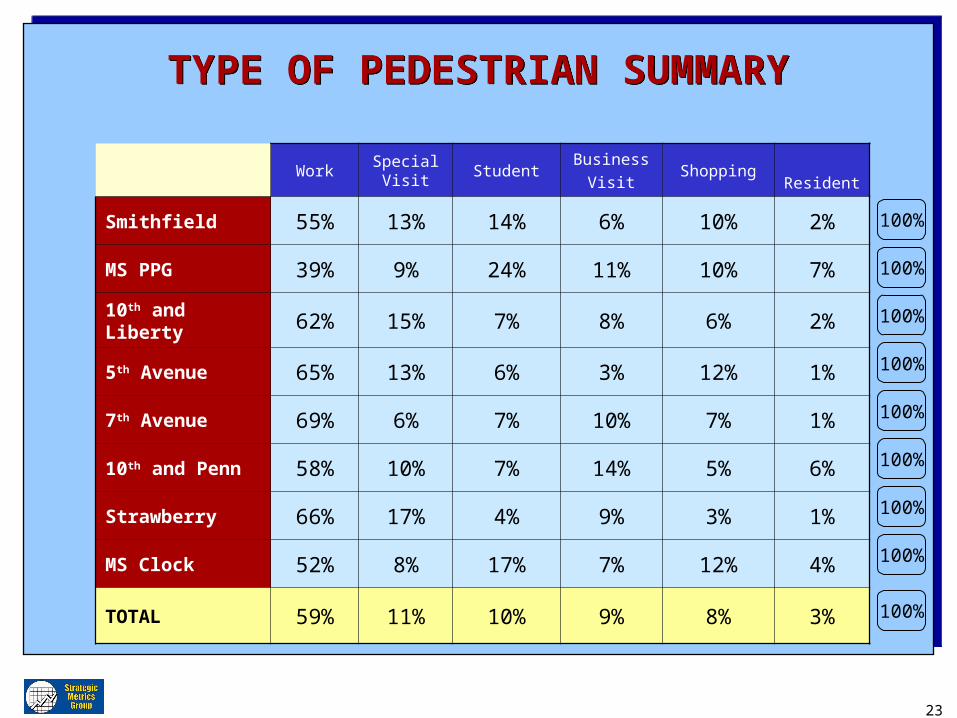
TYPE OF PEDESTRIAN SUMMARYTYPE OF PEDESTRIAN SUMMARY
WorkSpecial
VisitStudent
Business
VisitShopping
Resident
Smithfield 55% 13% 14% 6% 10% 2%
MS PPG 39% 9% 24% 11% 10% 7%
10th and Liberty 62% 15% 7% 8% 6% 2%
5th Avenue 65% 13% 6% 3% 12% 1%
7th Avenue 69% 6% 7% 10% 7% 1%
10th and Penn 58% 10% 7% 14% 5% 6%
Strawberry 66% 17% 4% 9% 3% 1%
MS Clock 52% 8% 17% 7% 12% 4%
TOTAL 59% 11% 10% 9% 8% 3% 100%
100%
100%
100%
100%
100%
100%
100%
100%
24
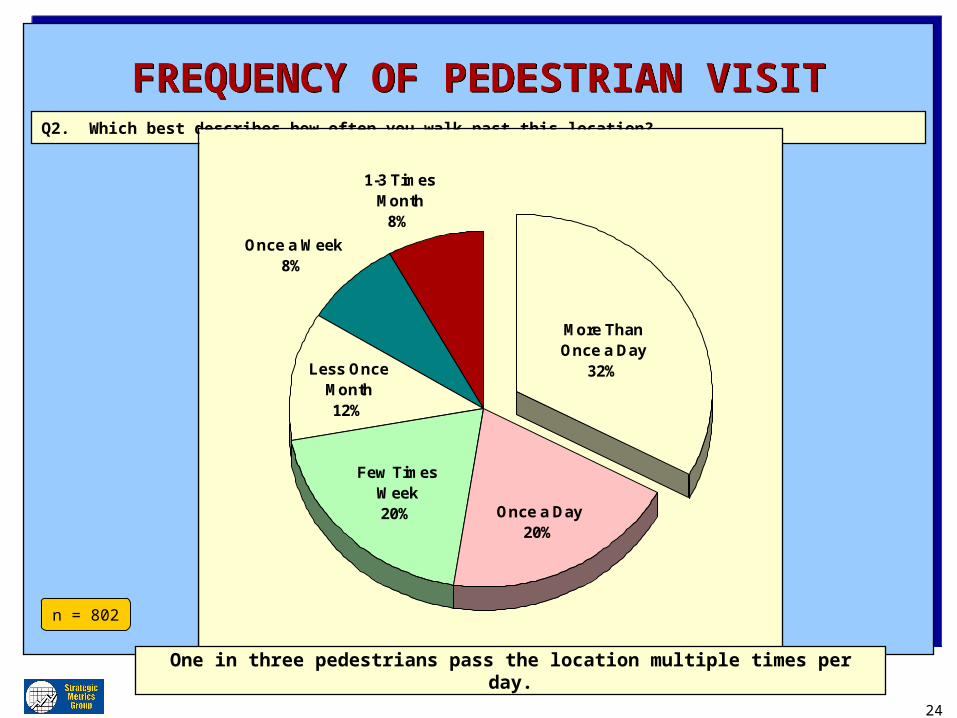
FREQUENCY OF PEDESTRIAN VISITFREQUENCY OF PEDESTRIAN VISITQ2. Which best describes how often you walk past this location?
n = 802
Once a Week8%
1-3 Times Month
8%
Less Once Month12%
More Than Once a Day
32%
Once a Day20%
Few Times Week20%
One in three pedestrians pass the location multiple times per day.
25
VISIT PURPOSE SUMMARYVISIT PURPOSE SUMMARY
The largest block of pedestrians surveyed (59%) are downtown because they work downtown. Special Visitors (11%) and Students (10%) comprise the second largest block of downtown pedestrians.
Business visitors (9%), Shoppers (8%), and Residents (3%) comprise the third, and smallest group of pedestrians.
7th Avenue (Gulf) and Strawberry Way (Weiner World) see more work force pedestrians than the other 6 locations. Market Square Clock and Market Square PPG (National City) see the lowest percentage of downtown work force pedestrians.
26
VISIT FREQUENCY SUMMARYVISIT FREQUENCY SUMMARY
Half of those surveyed walk by the location once a day or more. One-third pass by the location multiple times per day.
The number of repeated passes pedestrians make past a location is linked to the purpose of the downtown visit.
Downtown workers and residents make more frequent and repeated passes by locations than all other groups.
Shoppers and Special Visitors (Dining, Theatre, Sporting Event) make the lowest number of passes by a location.
27
DOLLARS SPENT - DOWNTOWN RETAILAmount Spent in a Typical Week
DOLLARS SPENT - DOWNTOWN RETAILAmount Spent in a Typical Week
4%
18% 17%
6%2%
53%
0%
20%
40%
60%
80%
$0 $1 - 5 $6 - 20 $21 - 50 $51 - 100 $101 +
% o
f R
espo
nden
ts
4%
18% 17%
6%2%
53%
0%
20%
40%
60%
80%
$0 $1 - 5 $6 - 20 $21 - 50 $51 - 100 $101 +
% o
f R
espo
nden
ts
n = 812
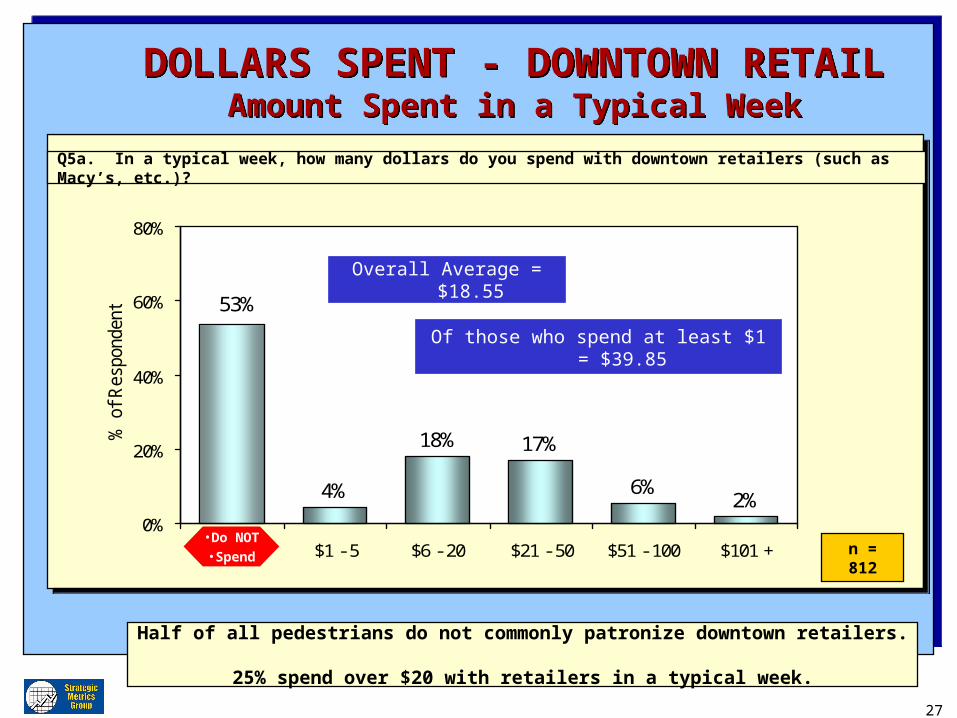
Half of all pedestrians do not commonly patronize downtown retailers. 25% spend over $20 with retailers in a typical week.
Q5a. In a typical week, how many dollars do you spend with downtown retailers (such as Macy’s, etc.)?
Overall Average = $18.55
Of those who spend at least $1 = $39.85
•Do NOT•Spend
28
DOLLARS SPENT ON - FOOD/BEVERAGEAmount Spent in a Typical Week
DOLLARS SPENT ON - FOOD/BEVERAGEAmount Spent in a Typical Week
10%
31% 29%
6%2%
22%
-20%
0%
20%
40%
60%
$0 $1 - 5 $6 - 20 $21 - 50 $51 - 100 $101 +
% o
f R
espo
nden
ts
10%
31% 29%
6%2%
22%
-20%
0%
20%
40%
60%
$0 $1 - 5 $6 - 20 $21 - 50 $51 - 100 $101 +
% o
f R
espo
nden
ts
n = 812
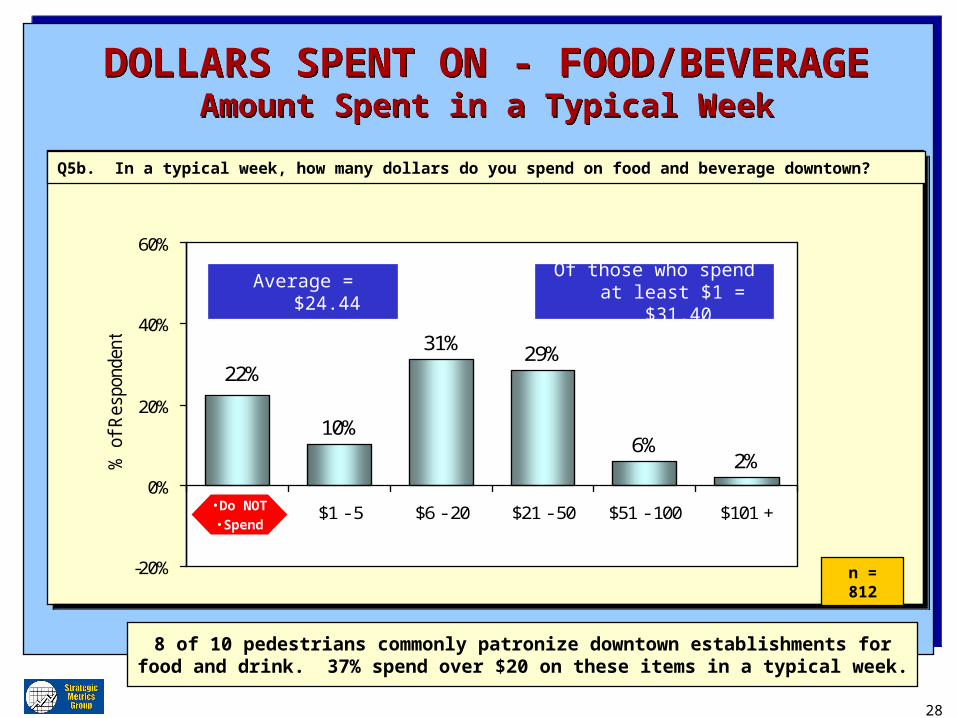
8 of 10 pedestrians commonly patronize downtown establishments for food and drink. 37% spend over $20 on these items in a typical week.
Q5b. In a typical week, how many dollars do you spend on food and beverage downtown?
Average = $24.44Of those who spend at
least $1 = $31.40
•Do NOT•Spend
29
DOLLARS SPENT ON SERVICESAmount Spent in a Typical Week
DOLLARS SPENT ON SERVICESAmount Spent in a Typical Week
4%10%
3% 1% 0%
82%
0%
20%
40%
60%
80%
100%
$0 $1 - 5 $6 - 20 $21 - 50 $51 - 100 $101 +
% o
f R
espo
nden
ts
4%10%
3% 1% 0%
82%
0%
20%
40%
60%
80%
100%
$0 $1 - 5 $6 - 20 $21 - 50 $51 - 100 $101 +
% o
f R
espo
nden
ts
n = 812
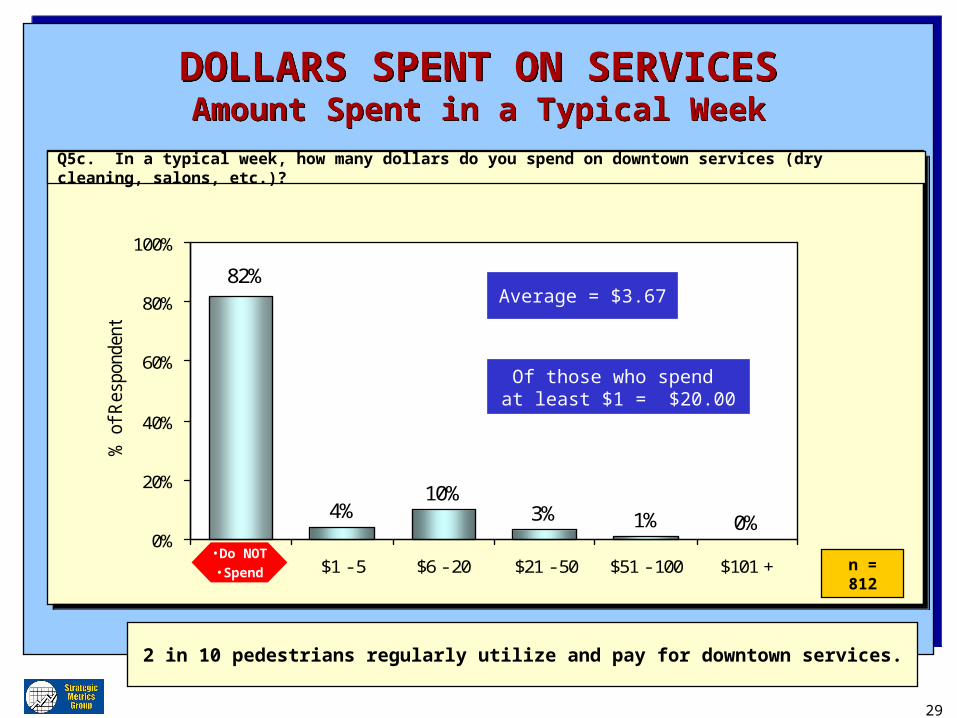
2 in 10 pedestrians regularly utilize and pay for downtown services.
Q5c. In a typical week, how many dollars do you spend on downtown services (dry cleaning, salons, etc.)?
Average = $3.67
Of those who spend at least $1 = $20.00
•Do NOT•Spend
30
$21 $21 $19 $17 $19 $12 $16
$37$30 $25 $26
$22 $21$18 $17
$3 $4 $4$6 $3
$4 $1
$21
$4
$0
$15
$30
$45
$60
$75
$90
Retail Food & Bev Services
$21 $21 $19 $17 $19 $12 $16
$37$30 $25 $26
$22 $21$18 $17
$3 $4 $4$6 $3
$4 $1
$21
$4
$0
$15
$30
$45
$60
$75
$90
Retail Food & Bev Services
n = 812
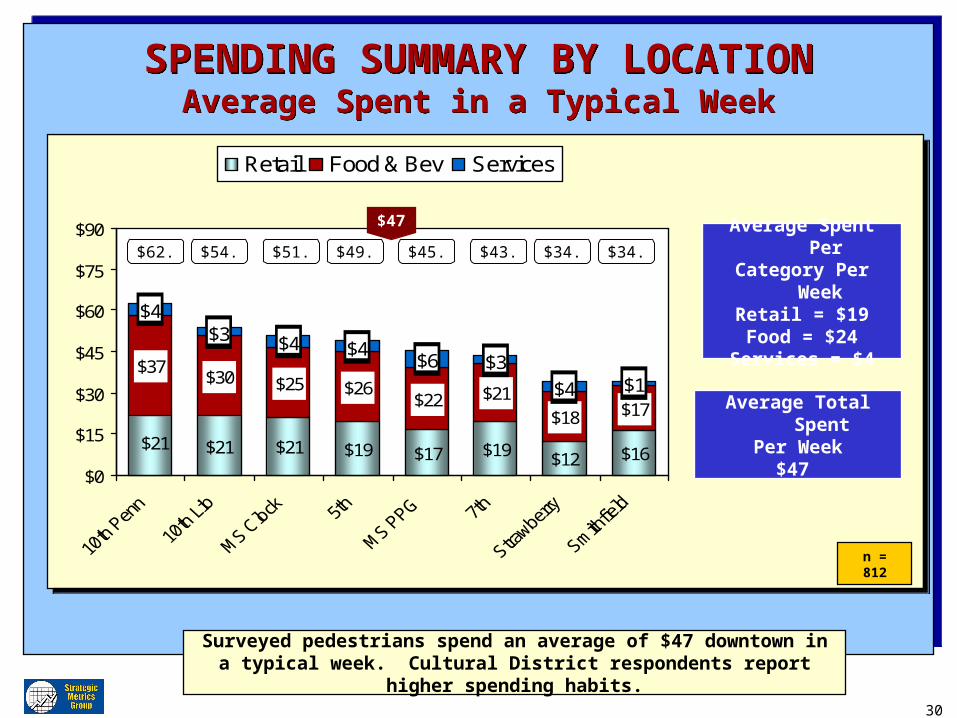
Surveyed pedestrians spend an average of $47 downtown in a typical week. Cultural District respondents report higher spending habits.
Average Spent PerCategory Per Week
Retail = $19Food = $24
Services = $4
SPENDING SUMMARY BY LOCATIONAverage Spent in a Typical Week
SPENDING SUMMARY BY LOCATIONAverage Spent in a Typical Week
$62. $54. $51. $49. $43.$45. $34. $34.
Average Total SpentPer Week
$47
$47
31
$39$20 $16 $14 $12
$60
$17
$25 $26$17 $22$42
$2$5$4$1
$3
$4
$0
$20
$40
$60
$80
$100
$120
$140
Retail Food & Bev Services
$39$20 $16 $14 $12
$60
$17
$25 $26$17 $22$42
$2$5$4$1
$3
$4
$0
$20
$40
$60
$80
$100
$120
$140
Retail Food & Bev Services
n = 808
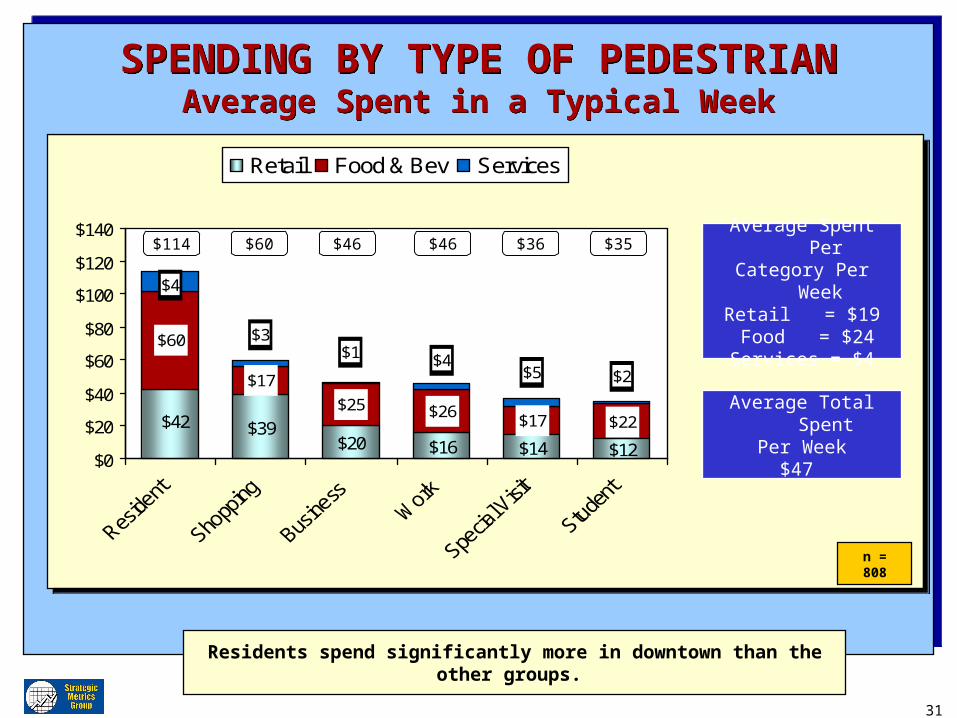
Residents spend significantly more in downtown than the other groups.
Average Spent PerCategory Per Week
Retail = $19 Food = $24Services = $4
SPENDING BY TYPE OF PEDESTRIANAverage Spent in a Typical Week
SPENDING BY TYPE OF PEDESTRIANAverage Spent in a Typical Week
$114 $60 $46$46 $36 $35
Average Total SpentPer Week
$47
32
PEDESTRIAN ECONOMICSWeekly Scenario
PEDESTRIAN ECONOMICSWeekly Scenario
% of Traffic
Volume
Avg. Daily Ped Count
Per Person
Average $
Total Dollars
% of Dollar Volume
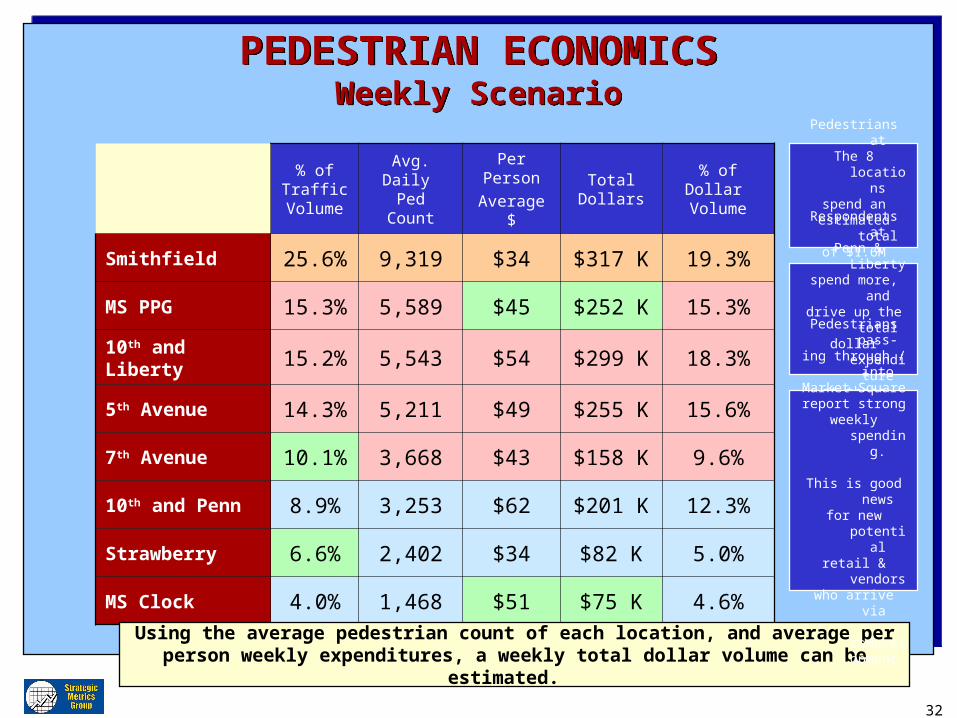
Smithfield 25.6% 9,319 $34 $317 K 19.3%
MS PPG 15.3% 5,589 $45 $252 K 15.3%
10th and Liberty 15.2% 5,543 $54 $299 K 18.3%
5th Avenue 14.3% 5,211 $49 $255 K 15.6%
7th Avenue 10.1% 3,668 $43 $158 K 9.6%
10th and Penn 8.9% 3,253 $62 $201 K 12.3%
Strawberry 6.6% 2,402 $34 $82 K 5.0%
MS Clock 4.0% 1,468 $51 $75 K 4.6%
Using the average pedestrian count of each location, and average per person weekly expenditures, a weekly total dollar volume can be estimated.
Pedestrians atThe 8 locations
spend anestimated total
of $1.6M weekly.
Respondents at Penn & Liberty
spend more, anddrive up the totaldollar expenditureat these locations.
Pedestrians pass-ing through / intoMarket Squarereport strong
weekly spending.
This is good newsfor new potentialretail & vendorswho arrive via
redevelopment.
33
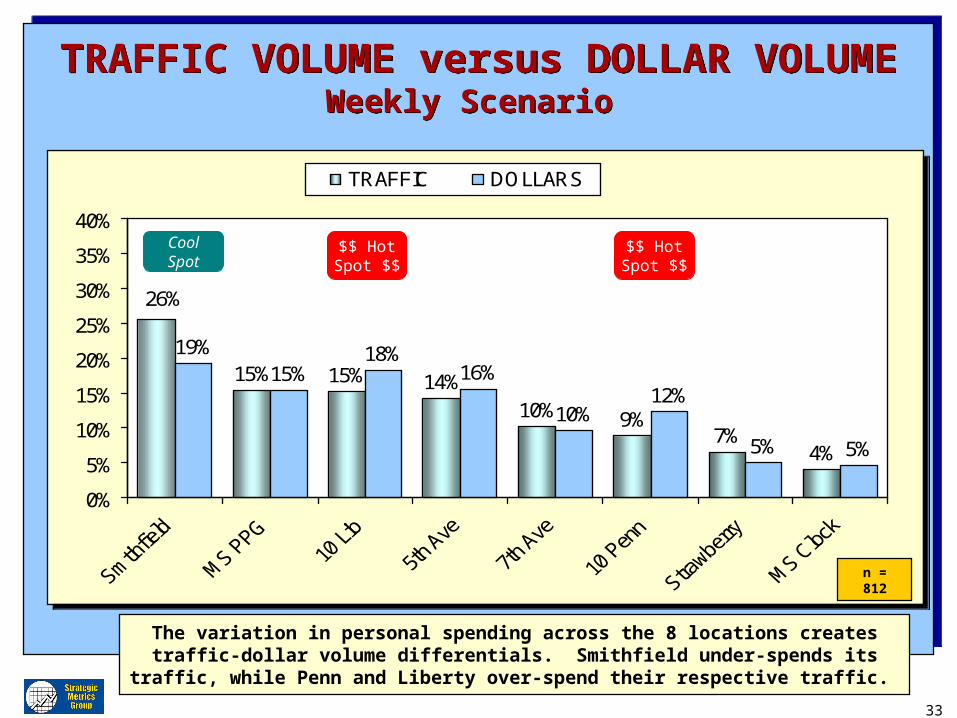
TRAFFIC VOLUME versus DOLLAR VOLUMEWeekly Scenario
TRAFFIC VOLUME versus DOLLAR VOLUMEWeekly Scenario
15% 15% 14%
10% 9%7%
4%
19%15%
18%16%
10%12%
5% 5%
26%
0%
5%
10%
15%
20%
25%
30%
35%
40%
TRAFFIC DOLLARS
15% 15% 14%
10% 9%7%
4%
19%15%
18%16%
10%12%
5% 5%
26%
0%
5%
10%
15%
20%
25%
30%
35%
40%
TRAFFIC DOLLARS
n = 812
The variation in personal spending across the 8 locations creates traffic-dollar volume differentials. Smithfield under-spends its traffic, while Penn and Liberty over-spend
their respective traffic.
CoolSpot
$$ HotSpot $$
$$ HotSpot $$
34
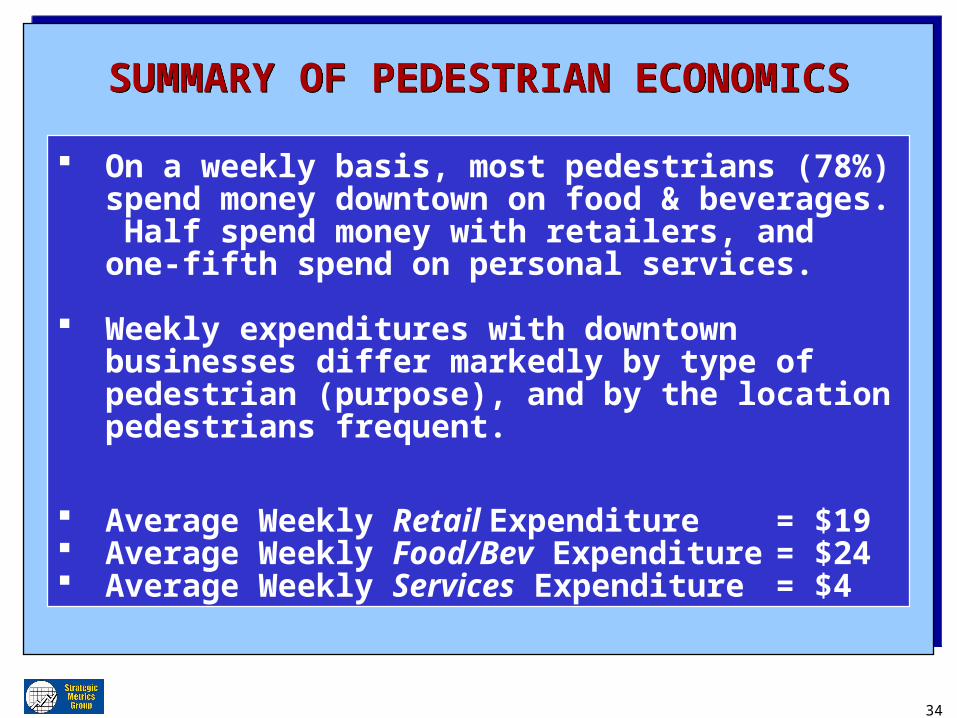
SUMMARY OF PEDESTRIAN ECONOMICSSUMMARY OF PEDESTRIAN ECONOMICS
On a weekly basis, most pedestrians (78%) spend money downtown on food & beverages. Half spend money with retailers, and one-fifth spend on personal services.
Weekly expenditures with downtown businesses differ markedly by type of pedestrian (purpose), and by the location pedestrians frequent.
Average Weekly Retail Expenditure = $19 Average Weekly Food/Bev Expenditure = $24 Average Weekly Services Expenditure = $4
35
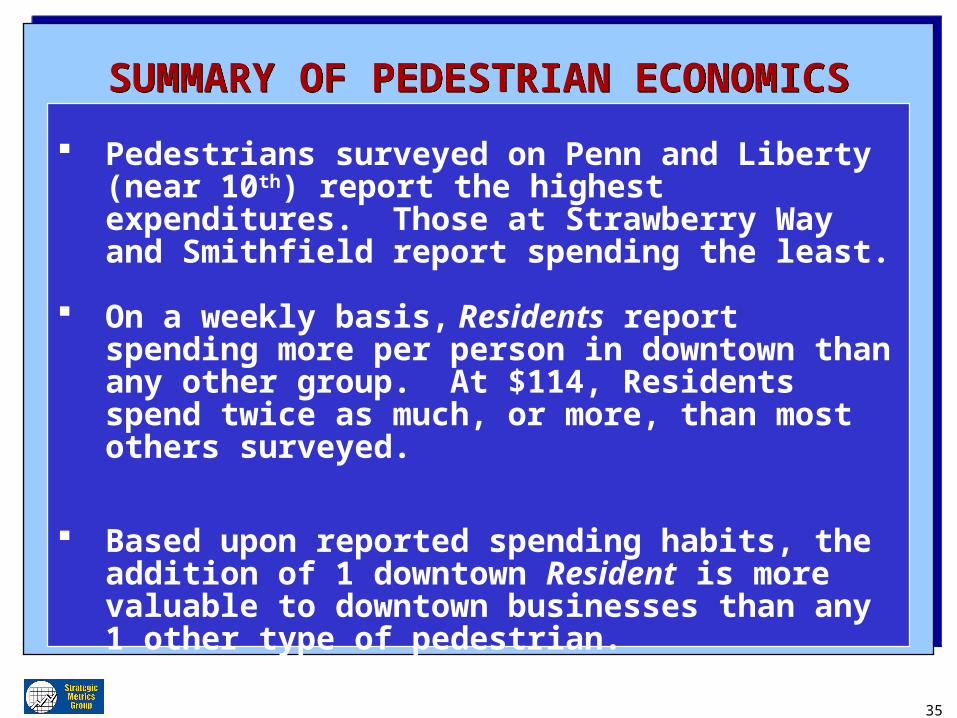
SUMMARY OF PEDESTRIAN ECONOMICSSUMMARY OF PEDESTRIAN ECONOMICS
Pedestrians surveyed on Penn and Liberty (near 10th) report the highest expenditures. Those at Strawberry Way and Smithfield report spending the least.
On a weekly basis, Residents report spending more per person in downtown than any other group. At $114, Residents spend twice as much, or more, than most others surveyed.
Based upon reported spending habits, the addition of 1 downtown Resident is more valuable to downtown businesses than any 1 other type of pedestrian.
36
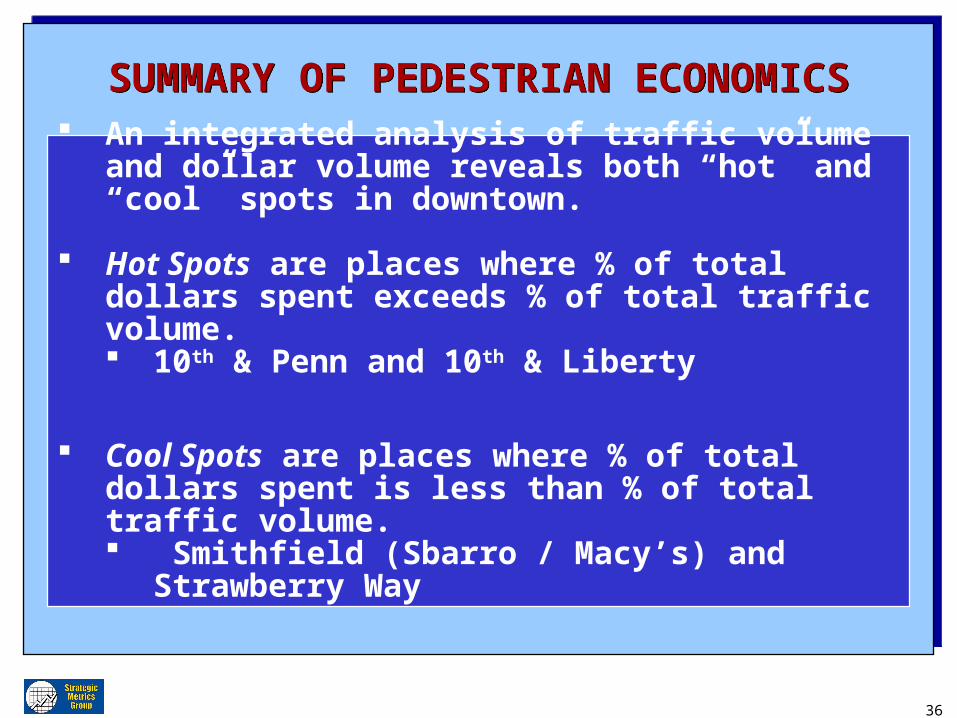
SUMMARY OF PEDESTRIAN ECONOMICSSUMMARY OF PEDESTRIAN ECONOMICS
An integrated analysis of traffic volume and dollar volume reveals both “hot” and “cool” spots in downtown.
Hot Spots are places where % of total dollars spent exceeds % of total traffic volume. 10th & Penn and 10th & Liberty
Cool Spots are places where % of total dollars spent is less than % of total traffic volume. Smithfield (Sbarro / Macy’s) and Strawberry Way
37
SUMMARY OF PDP IDENTITY & PERCEPTIONSSUMMARY OF PDP IDENTITY & PERCEPTIONS
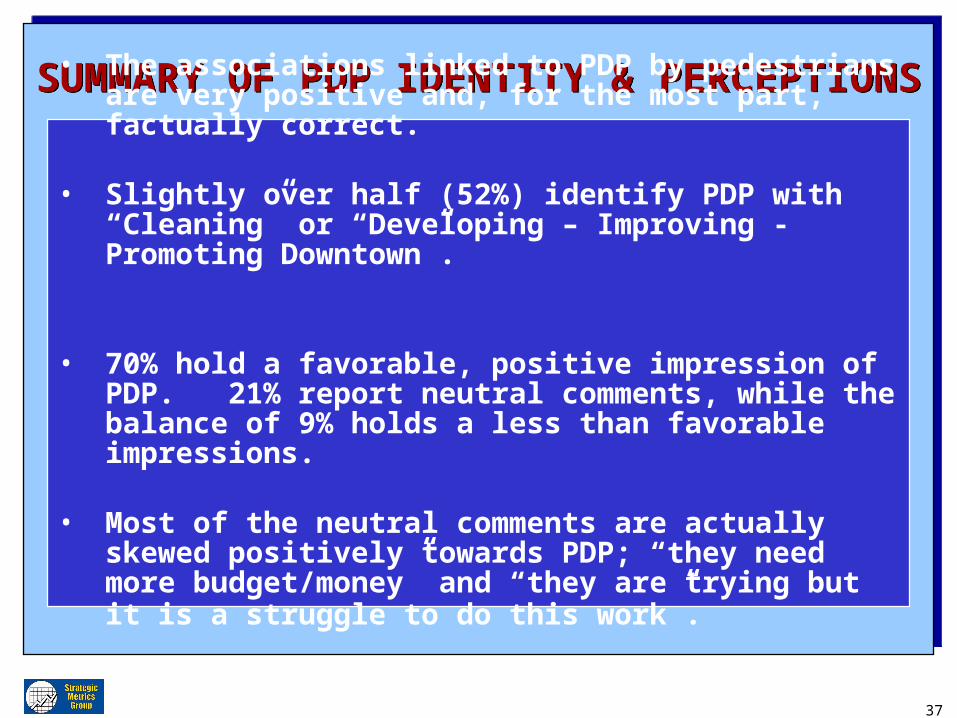
• The associations linked to PDP by pedestrians are very positive and, for the most part, factually correct.
• Slightly over half (52%) identify PDP with “Cleaning” or “Developing – Improving - Promoting Downtown”.
• 70% hold a favorable, positive impression of PDP. 21% report neutral comments, while the balance of 9% holds a less than favorable impressions.
• Most of the neutral comments are actually skewed positively towards PDP; “they need more budget/money” and “they are trying but it is a struggle to do this work”.
38
PERCEPTIONS
of
MARKET SQUARE
PERCEPTIONS
of
MARKET SQUARE
.
39
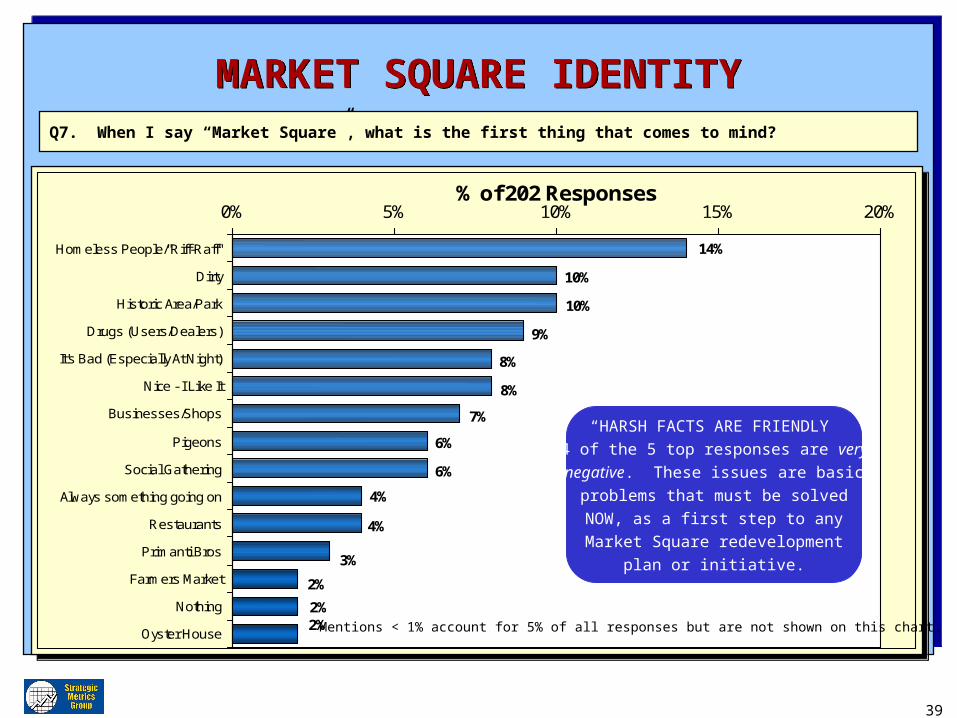
MARKET SQUARE IDENTITYMARKET SQUARE IDENTITYQ7. When I say “Market Square”, what is the first thing that comes to mind?
6%
6%
4%
4%
3%
2%
2% 2%
7%
8%
8%
9%
10%
14%
10%
0% 5% 10% 15% 20%
Homeless People/"Riff-Raff"
Dirty
Historic Area/Park
Drugs (Users/Dealers)
It's Bad (Especially At Night)
Nice - I Like It
Businesses/Shops
Pigeons
Social Gathering
Always something going on
Restaurants
Primanti Bros
Farmers Market
Nothing
Oyster House
% of 202 Responses
6%
6%
4%
4%
3%
2%
2% 2%
7%
8%
8%
9%
10%
14%
10%
0% 5% 10% 15% 20%
Homeless People/"Riff-Raff"
Dirty
Historic Area/Park
Drugs (Users/Dealers)
It's Bad (Especially At Night)
Nice - I Like It
Businesses/Shops
Pigeons
Social Gathering
Always something going on
Restaurants
Primanti Bros
Farmers Market
Nothing
Oyster House
% of 202 Responses
“HARSH FACTS ARE FRIENDLY”4 of the 5 top responses are very
negative. These issues are basic
problems that must be solved
NOW, as a first step to any
Market Square redevelopment
plan or initiative.
Mentions < 1% account for 5% of all responses but are not shown on this chart.

40
IMPROVING MARKET SQUAREIMPROVING MARKET SQUARE
4%
4%
4%
2%
2%
2%
1%
4%
4%
10%
10%
18%
19%
13%
0% 5% 10% 15% 20% 25%
More events
Keep Out Homeless/"Riff Raff"/Solicitors
Clean it up
More shops/restaurants
More Police
Get Rid of Drugs (Users/Dealers)
Get Rid of Pigeons
Grocery/Food Store/Market
Nothing
Make More Park Like
Eliminate/Lower Parking Fees
Repair Pavement
Get Rid of Road
Allow buskers/busking
% of 217 Responses
4%
4%
4%
2%
2%
2%
1%
4%
4%
10%
10%
18%
19%
13%
0% 5% 10% 15% 20% 25%
More events
Keep Out Homeless/"Riff Raff"/Solicitors
Clean it up
More shops/restaurants
More Police
Get Rid of Drugs (Users/Dealers)
Get Rid of Pigeons
Grocery/Food Store/Market
Nothing
Make More Park Like
Eliminate/Lower Parking Fees
Repair Pavement
Get Rid of Road
Allow buskers/busking
% of 217 Responses
Mentions < 1% account for 3% of all responses but are not shown on this chart.
Q8. What would help make Market Square a more interesting and appealing place for you to visit?
Core ImprovementsHalf of the suggested
improvements refer directly to
safety, cleanliness, and
the drug/criminal element.
Other ImprovementsMore events, shops,
restaurants, grocery / markets.
41
MARKET SQUARE SUMMARYMARKET SQUARE SUMMARY
2 core problems are currently hurting Market Square’s image and potential to be a thriving, vibrant downtown destination :
SAFETY and CLEANLINESS
The first step of any redevelopment plan must include the recognition and resolution of these very basic, yet very important concerns.
Some respondents do identify and describe Market Square in more positively: “HISTORIC”, “SOCIAL GATHERING”, “ALWAYS SOMETHING GOING ON”.
The improvements cited by respondents reinforce the safety and cleanliness issues. In addition, more shops, restaurants, and markets will make Market Square more appealing.
42
SMG OBSERVATIONSOF MARKET SQUARESMG OBSERVATIONSOF MARKET SQUARE
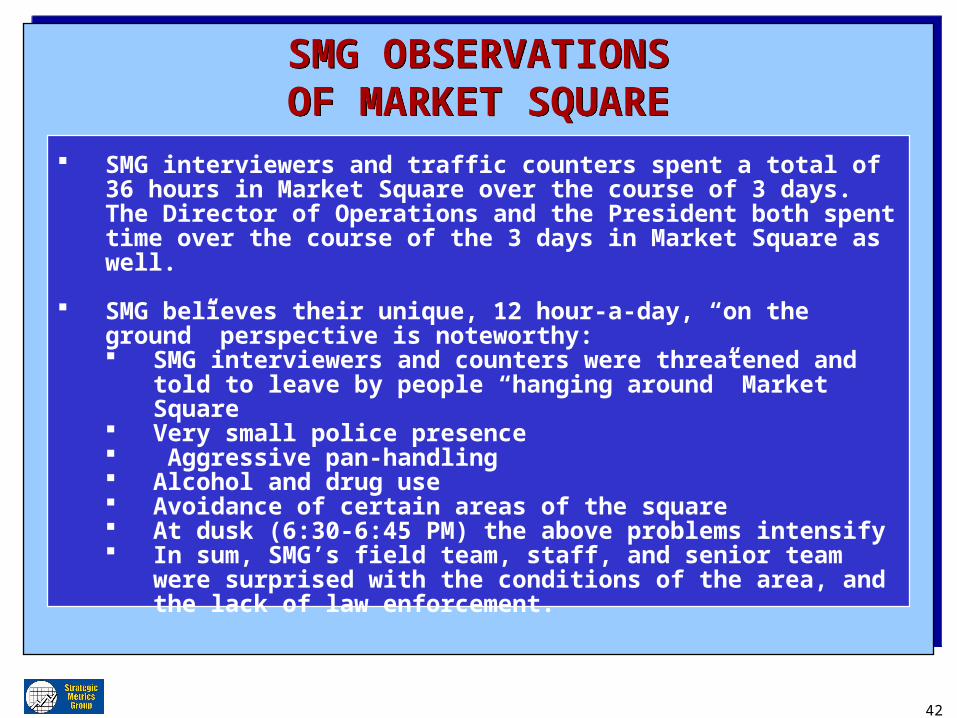
SMG interviewers and traffic counters spent a total of 36 hours in Market Square over the course of 3 days. The Director of Operations and the President both spent time over the course of the 3 days in Market Square as well.
SMG believes their unique, 12 hour-a-day, “on the ground” perspective is noteworthy: SMG interviewers and counters were threatened and told to leave
by people “hanging around” Market Square Very small police presence Aggressive pan-handling Alcohol and drug use Avoidance of certain areas of the square At dusk (6:30-6:45 PM) the above problems intensify In sum, SMG’s field team, staff, and senior team were surprised
with the conditions of the area, and the lack of law enforcement.
43
PRESENTATION OVERVIEW PRESENTATION OVERVIEW
1. Methodology and Sampling
2. Pedestrian Traffic Data
3. Pedestrian Survey Findings
4. Location & Pedestrian Profiles
5. Key Findings & Summary
1. Methodology and Sampling
2. Pedestrian Traffic Data
3. Pedestrian Survey Findings
4. Location & Pedestrian Profiles
5. Key Findings & Summary
44
DEMOGRAPHICS – ALL RESPONDENTS DEMOGRAPHICS – ALL RESPONDENTS
21%18%
22%15%
5%1%
18%
0%
20%
40%
60%
<24 25-34 35-44 45-54 55-64 65-74 75+
% o
f Res
pond
ents
21%18%
22%15%
5%1%
18%
0%
20%
40%
60%
<24 25-34 35-44 45-54 55-64 65-74 75+
% o
f Res
pond
ents
32%
19%
9% 10%
30%
0%
20%
40%
60%
<25K 25-49K 50-74K 75-99K 100K +
% o
f Res
pond
ents
32%
19%
9% 10%
30%
0%
20%
40%
60%
<25K 25-49K 50-74K 75-99K 100K +
% o
f Res
pond
ents
47%53%
0%
20%
40%
60%
80%
100%
Male Female
% o
f Res
pond
ents
47%53%
0%
20%
40%
60%
80%
100%
Male Female
% o
f Res
pond
ents
AGE GROUPAGE GROUP INCOMEINCOME
GENDERGENDER
19%
3%
78%
0%
20%
40%
60%
80%
100%
Solo 2 3+
% o
f Res
pond
ents
19%
3%
78%
0%
20%
40%
60%
80%
100%
Solo 2 3+
% o
f Res
pond
ents
PARTY SIZEPARTY SIZE
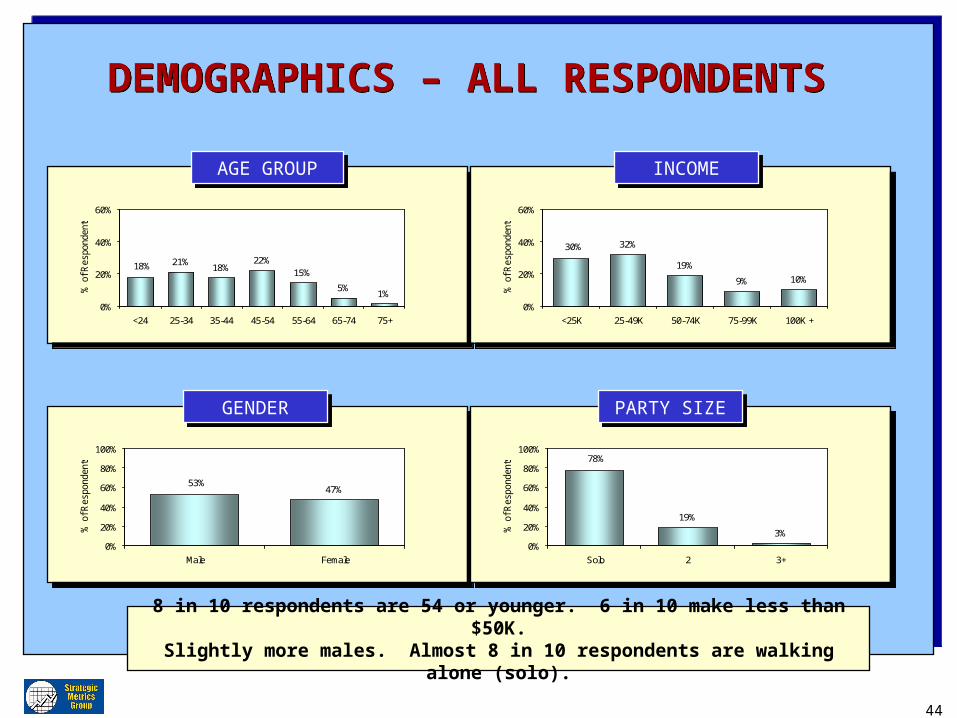
8 in 10 respondents are 54 or younger. 6 in 10 make less than $50K.Slightly more males. Almost 8 in 10 respondents are walking alone (solo).
45
CHARACTERISTICS OF 8 LOCATIONSCHARACTERISTICS OF 8 LOCATIONS
% of Traffic
Volume
PDP
Awareness
Weekly
Downtown
$ Spent
Income Age
Smithfield 25.6% 64% $34 Second Lowest
Second Youngest
MS PPG 15.3% 50% $45 Lowest Youngest
10th and Liberty 15.2% 57% $54 Average Average
5th Avenue 14.3% 74% $49 Highest Oldest
7th Avenue 10.1% 54% $43 Average Average
10th and Penn 8.9% 64% $62 Second Highest
Second Oldest
Strawberry 6.6% 63% $34 Average Average
MS Clock 4.0% 57% $51 Average Average
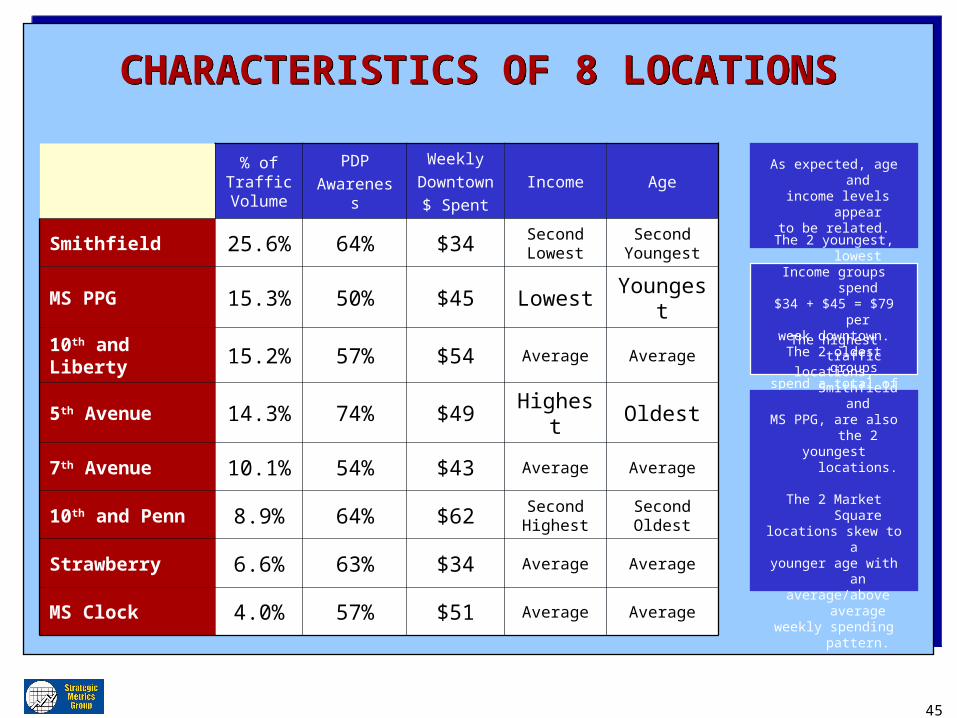
As expected, age and income levels appear
to be related.
The 2 youngest, lowestIncome groups spend$34 + $45 = $79 per
week downtown.The 2 oldest groups
spend a total of $111.
The highest traffic locations, Smithfield andMS PPG, are also the 2
youngest locations.
The 2 Market Squarelocations skew to a younger age with an
average/above averageweekly spending pattern.
46
PRESENTATION OVERVIEW PRESENTATION OVERVIEW
1. Methodology and Sampling
2. Pedestrian Traffic Data
3. Pedestrian Survey Findings
4. Location & Pedestrian Profiles
5. Key Findings & Summary
1. Methodology and Sampling
2. Pedestrian Traffic Data
3. Pedestrian Survey Findings
4. Location & Pedestrian Profiles
5. Key Findings & Summary
47
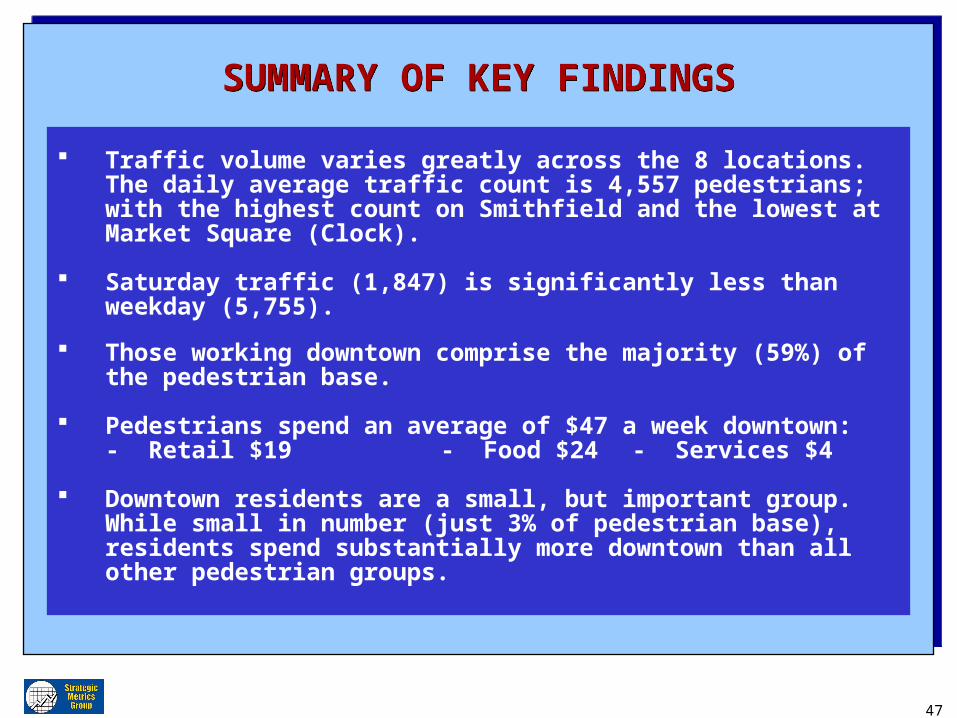
SUMMARY OF KEY FINDINGSSUMMARY OF KEY FINDINGS
Traffic volume varies greatly across the 8 locations. The daily average traffic count is 4,557 pedestrians; with the highest count on Smithfield and the lowest at Market Square (Clock).
Saturday traffic (1,847) is significantly less than weekday (5,755).
Those working downtown comprise the majority (59%) of the pedestrian base.
Pedestrians spend an average of $47 a week downtown:- Retail $19 - Food $24 - Services $4
Downtown residents are a small, but important group. While small in number (just 3% of pedestrian base), residents spend substantially more downtown than all other pedestrian groups.

48
SUMMARY OF KEY FINDINGSSUMMARY OF KEY FINDINGS
Downtown spending habits differ by location, creating “hot” (10th & Penn) and “cool” spots (Smithfield) of pedestrian purchasing potential.
Market Square is viewed unfavorably by most pedestrians. Two major barriers, safety concerns & cleanliness, have to be recognized and resolved first, for Market Square to flourish and grow into a vibrant downtown destination.
60% of pedestrians are aware of PDP. Most identify PDP with either cleaning, improving, developing, or promoting downtown. Asked for their overall impression of PDP, pedestrian remarks are largely positive: 70% Positive 21% Neutral 9% Negative