1 long-term cycling of carbon-based supercapacitors in aqueous media v
TRANSCRIPT

1
LONG-TERM CYCLING OF CARBON-BASED SUPERCAPACITORS IN AQUEOUS
MEDIA
V. Ruiz, R. Santamaría, M. Granda and C. Blanco*
Instituto Nacional del Carbón, CSIC, Apdo. 73, 33080-Oviedo, Spain
Abstract.-
The behaviour of mesophase-derived electrodes on long-duration cycling conditions
was studied in 1M sulfuric acid and 6M potassium hydroxide. Variation in the specific
capacitance values with the number of cycles shows a good cycling life performance in acidic
media but very poor in an alkaline electrolyte. The total loss of capacitance after 7,000 cycles
in acidic media is 8 % at 0.6 V and 16 % at 1 V, whereas in the basic electrolyte the reduction
in the capacitance values is 72 %, even at a very small operating voltage (0.6 V). This
behaviour was associated to the strong oxidation of the positive electrode caused by the
progressive shift of the working potential towards very positive potential values during
cycling.
Key words: Activated carbon, electrochemical capacitor, double layer, pseudocapacitance,
long-term cycling
*Corresponding author: [email protected]; Tlf: +34 985119090; Fax.: + 34 985 297662

2
1.- INTRODUCTION
Electrochemical double layer capacitors (EDLC’s) are energy storage devices with a
wide range of applications related to their fast energy delivery (e.g. telecommunications
systems, maintenance-free traffic lights, uninterruptible power sources, and hybrid electric
vehicles among others) [1]. The storage of energy in electrochemical capacitors can arise
from either electrostatic charging or from pseudocapacitative chage-discharge [2]. In the first
case, electrolyte ions are accumulated at the electrode/electrolyte interface forming the so-
called double layer in a similar way as in conventional capacitors. By utilizing high surface
area electrodes the amount of charge stored, and consequently the capacitance of the device,
is several orders of magnitude higher than that of conventional electrolytic capacitors. In the
second case, pseudocapacitance arises from faradaic processes of electroactive species, such
as polymeric materials [3], metal oxides [4,5] and certain functionalities at the surface of
carbon materials [6,7,8].
It is generally believed that pseudocapacitance in carbon materials is largely based on
the redox reactions of surface quinoid functionalities, whose reduction requires protons to
proceed [9,10]. Nevertheless, some other oxygenated functional groups might be
electrochemically active at the working potentials of the acidic solutions, such as some pyrone
groups [11,6]. Therefore, and as may be expected, faradic phenomena have a large
dependence on the pH of the solution. In this sense, enormous differences in capacitance
values can be found depending on the electrolyte used. For carbon materials in neutral
solutions, specific capacitance values between 8-12 μF cm-2 have been reported and between
15-20 μF cm-2 in the case of acidic media [12]. Despite that its study is not so frequent, redox
reactions in basic media are also possible [13].

3
As a general trend, for the same active electrode material, higher capacitance values
are found in acidic media compared to those obtained in basic media. Despite that this
tendency is followed by the majority of the materials [14,7], a few examples can be found
following the opposite trend. Rojo et.al. [15] reported capacitance values for activated carbon
nanofibers of about 60 F g-1 when 6M KOH was used as electrolyte and of around 40 F g-1
when using 2M H2SO4. This difference was attributed by the authors to the larger sizes of the
hydrated H3O+ and HSO4- ions compared to the hydrated K+ and OH- ions [16,17]. However,
the different redox activity in each media seems to be a more plausible explanation, as the
average pore size of the active material is large enough to allow the access of the ions
compared. The work carried out by Pietrzak et al. [18] reported that samples containing
significant amounts of nitrogen showed higher capacitance values in alkaline media than in
acidic media due to the presence of pseudofaradaic reactions of the nitrogen functional
groups.
In general terms, the presence of the so-called pseudocapacitance has been related in
literature to poor cycle life [19] contrary to what occurs in organic media, where only purely
charge separation occurs and good cycling stability is typically reported [20]. Investigations in
this field are rarely reported, despite that the cyclability of supercapacitors is a property of
mayor importance. The present work investigates the effect of the electrolyte (basic or acidic)
in the long-term stability of carbon-based supercapacitors.

4
2.- EXPERIMENTAL
2.1.- Active material.-
The activated carbon M-AC was obtained by chemical activation of a mesophase-
derived pitch (AR24) using potassium hydroxide in a proportion of 3:1 (KOH:AR24). The
activation procedure has been previously described [21]. Physical adsorption of nitrogen at
77 K was carried out in order to characterize the porous texture of the activated carbon and
carbon-based electrodes. Isotherms were performed in an ASAP 2020 Micromeritics
volumetric system using around 50 mg of sample for each measurement. The apparent
specific surface area was determined from the N2-adsorption isotherm using the BET
equation. The total micropore volume (VN2) was calculated by applying the Dubinin-
Radushkevich (DR) equation to the N2-adsorption isotherms [22]. The microporous surface
area was obtained from the equation: Smic(m2 g-1)=2000VN2(cm3 g-1)/L0 (nm), where L0
represents the average micropore width [23].
The electro-oxidation of the activated carbon M-AC was carried out in a conventional
three-electrode system. Around 100 mg of material was subjected to +0.4 V vs. NHE in a N2
bubbling solution of 6M KOH. Then the sample was washed using distilled water and dried in
a vacuum oven at 110 °C overnight. The resultant material was labelled EO-M-AC+0.4. The
amount of oxygen functional groups in the sample was evaluated by means of temperature-
programmed desorption (TPD). About 150 mg of sample was placed in a U-shaped quartz cell
and heat treated to 1000 ºC at an increasing temperature of 10 ºC min-1. On-line mass
spectrometry was used to measure the decomposition products (CO and CO2).

5
The oxygen content of the activated carbons was directly determined using a LECO-
TF-900 furnace coupled to a LECO-CHNS-932 microanalyzer.
2.2.-Electrode preparation and electrochemical measurements.-
Disk type electrodes of 12 mm in diameter were prepared using 10 wt. % of
polyvinylidene fluoride (PVDF) as binder and 90 wt. % of active material. The electrodes
were dried overnight before the cell assembly. Gold disks were used as current collectors and
glassy fiber disks as separators.
The electrochemical tests were performed in PFA (polyfluoroalkoxy) “T”-type
Swagelok® cells In this configuration a two-electrode cell is assembled and in the third end
connection a reference electrode is incorporated. This configuration allows the potential at
which anode and cathode are operating to be determined, as these can be monitored
throughout the two-electrode experiments. The reference electrodes used were Hg/Hg2SO4 or
Hg/HgO depending on the electrolytic media used, where one of the carbon electrodes acted
as counter electrode. Aqueous solutions of 1M sulfuric acid, 6M potassium hydroxide and 1M
LiCl where used as electrolytes.
The electrochemical measurements were conducted in a Biologic multichannel
potenciostat. Galvanostatic cycling at a current load of 500 mA g-1 was performed for the
long-term cycling experiments at two different operating voltages: 0.6 and 1 V. The
capacitance of the system was obtained applying the equation: Ccell (F) = )dtdV/(I 1− to the
galvanostatic cycles performed at constant current, I, (avoiding the ohmic drop). The specific
capacitance values for the electrode, C (F g-1), was obtained from the following expression:

6
C= 2Ccell/m, where m is the mass of active material in the lightest electrode. Cyclic
voltammetry was also carried at a scan rate of 1 mV s-1. Impedance spectroscopy analyses
were conducted at 0 V, in the completely discharged state, varying frequencies between
1 mHz-100 kHz with an amplitude of ±10 mV.
3.- RESULTS AND DISCUSSION
The textural and chemical properties of the active material used in the present study
(M-AC) have been described elsewhere [7]. M-AC is mainly a microporous material, with a
microporous surface area of 1531 m2 g-1 and an apparent BET area of 2000 m2g-1. Regarding
its chemical properties, M-AC has a significant amount of oxygenated functionalities
(3.5 wt. % obtained by elemental analysis).
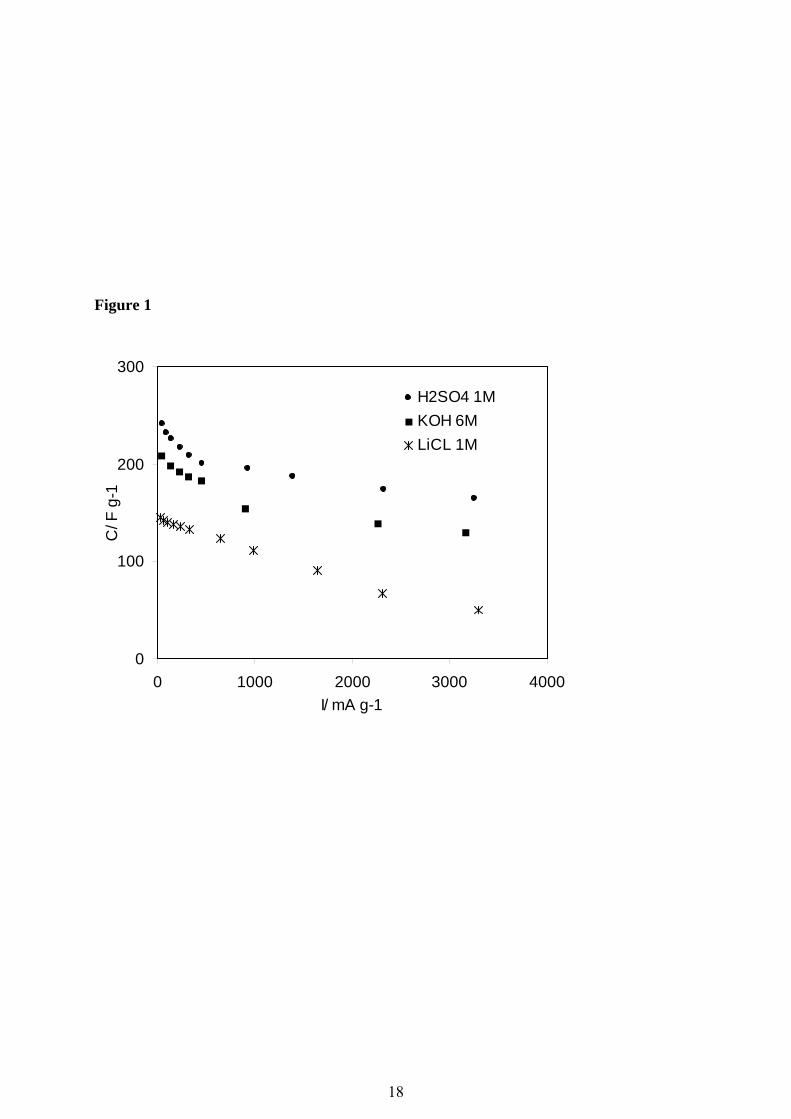
Figure 1 shows the specific capacitance values at increasing current densities obtained
for M-AC in three aqueous electrolytes: 1M H2SO4, 6M KOH and 1M LiCl. At the lowest
current density measured (0.88 mA cm-2 / 40 mA g-1) the specific capacitance values obtained
were: 242, 208 and 145 F g-1 for H2SO4, KOH and LiCl, respectively. These differences in
capacitance might arise either from the different accessibility of the ions into the porous
network or from the dissimilar chemical reactions occurring onto the carbon surface. M-AC
has an average pore size of 0.97 nm as described in ref. [7]. In addition to this, the ions used
in this study have stokes radius [24] lower than 0.24 nm (radius of the solvated species).
Thus, the problems of accessibility of the ions can not be taken into account as demonstrated
elsewhere for aqueous solutions [25,26]. In the absence of any faradic processes, capacitance
values should be similar for the three electrolytes. Therefore, differences found in the
electrochemical behaviour of M-AC can only be assigned to its different faradic contribution

7
in each electrolyte. Based on these results, acidic media is expected to favour a higher
contribution of pseudocapacitance, followed by the basic, followed by the neutral electrolyte.
This circumstance has been explained in the literature based on the activity of the
quinone/hydroquinone couple in the presence of protons [10]. The presence of
pseudocapacitance in KOH has not been studied in such detail as those occurring in acidic
media. Nonetheless, some studies, as those carried out by Andreas et al. [10] report a 40 %
loss of capacitance when varying the pH of the electrolyte from 14 to 5.
Capacitance values for LiCl appear to be very dependent on the current load. This
indicates diffusion issues of the ions due to its lower ionic conductivity. For this reason, the
long-term experiments were not conducted in this electrolyte.
The presence of pseudocapacitance in acidic and basic media is also evidenced from
the cyclic voltamograms obtained in a three-electrode configuration (Figure 2a and 2b). The
voltage window in which the positive and negative electrode are operating in a two-electrode
configuration are also incorporated on top of the X-axis. For both electrolytes, a clear
deviation of the ideal rectangular shape is observed. In the acidic media (Figure 2a), the CV
response exhibits a set of anodic and cathodic peaks which are pseudocapacitive in nature
attributable to the oxidation/reduction of some surface functionalities on the carbon [7]. The
redox reactions occur both in the anodic and cathodic regions, which means that this
pseudocapacitance is readily used in a symmetric cell. However, in the case of the alkaline
medium the redox reaction of surface groups shifts to negative potentials (Figure 2b). As
previously reported [7], the poorest performance of the positive electrode in basic media
limits the capacitance of the whole device in the two-electrode configuration. This explains
why the capacitance values in sulfuric acid are higher than in potassium hydroxide.

8
The large contribution of pseudocapacitance both in acidic and basic media, deduced
from Figures 1 and 2, is expected to negatively affect the long-term behaviour of the
supercapacitors [19]. The variation in the specific capacitance values of M-AC during cycling
is represented in Figure 3 and the specific capacitance values obtained for the first and last
cycles are summarised in Table 1. The capacitance values in sulfuric acid are rather stable,
with a reduction of only 8 % after 7,000 cycles at 0.6 V, and 16 % at 1 V. As expected, the
reduction is higher at higher voltage window, as the participation of faradaic currents (e.g.
redox reactions, aqueous-solution decomposition, moderate carbon oxidation [1,27,28]) that
incorporate irreversibility into the electrochemical cell is more evident. On the contrary, the
long-term cycling in basic media, even at 0.6 V, was rather poor with a reduction in the
capacitance values of 72 % after 7,000 cycles. This reduction is dramatic after 6,000 cycles.
The poor electrochemical behaviour of M-AC in KOH after 7,000 cycles is clearly
evidenced by the distortion of the shape of the cyclic voltammograms and galvanostatic
charge-discharge curves (Figure 4a and b, respectively). At the initial stages of cycling, CV
and charge-discharge profiles show the typical behaviour of EDLC’s. However, after several
cycles, this behaviour is distorted.
These results suggest that the testing of active materials during a significant period of
time is of vital importance in order to evaluate their suitability to actuate in real operation
conditions.
For a deeper understanding of the changes occurring in the cell, impedance
spectroscopy measurements were carried out. Figure 4c represents the Nyquist plot obtained

9
after the first, 6,000th and 7,000th cycles and Figure 4d shows the amplitude of each spectrum
in the high-frequency region. The increase in the diameter of the semicircle in the medium-
high range of frequencies indicates a worsening in the intrinsic resistance of the active
material. At low frequencies, the impedance should be a vertical line parallel to the imaginary
axis, which corresponds to the capacitive behaviour of the material. However, there is a great
deviation form the theoretical performance that becomes particularly noticeable after 7,000
cycles. The same type of experiments performed in acidic media show a much lower variation
in the electrochemical behaviour with cycling (Figure 4e). Although some alteration on the
impedance spectra are expected [29,30], the great modification observed in KOH clearly
indicates the degradation of the electrochemical system.
In order to achieve a better understanding of the different extent of degradation
observed in the different media, the variation in the voltages at which the positive and
negative electrodes are operating was monitored during the long-term experiments. Figure 5a
shows a charge-discharge cycle obtained in sulfuric acid (cell voltage, right Y-axis) and the
voltage profile where anode and cathode are operating (left Y-axis). When the cell is in the
completely discharged state (0 V, right Y-axis) anode and cathode stand at the same potential
(+0.48 V vs NHE), that may be defined as equilibrium potential or rest potential (which is
characteristic of the active material and media used). When the supercapacitor is in the
completely charged state (0.6 V) the positive electrode reaches +0.77 V vs NHE, whereas the
negative electrode decreases to +0.18 V vs NHE. Thus, the overall cell voltage (0.6 V) is
evenly distributed between anode and cathode (0.3 V each electrode) (see summary in
Table 2), splitting the total range of voltage into two equal parts. It was found that these
values did not change during cycling. On the contrary, in basic media the operating potential
of each electrode vary visibly after the long-term cycling experiments towards more positive

10
values (Figure 5b). Additionally, the positive electrode increases very importantly its
operating voltage (ΔV), from 0.35 in the first cycle, to 0.5 V after 7,000 cycles, while in the
negative electrode this is reduced from 0.22 to only 0.07 V. This indicates that the capacitance
of the positive electrode is decreasing with cycling. Considering the shift of this electrode to
very positive potentials, it is reasonable to assign its degradation to irreversible oxidation of
the active material, which is agreement with other authors [13,31].
With the aim of studying the alterations suffered by M-AC upon cycling, the activated
carbon was subjected to +0.4V vs. NHE to simulate the processes occurring in the positive
electrode in a two-electrode cell after subjected to long-cycling experiments. The oxygen
content determined by direct elemental analysis increased drastically, from 3.5 wt. % in the
starting material up to 15 wt. % in EO-M-AC+0.4. Figure 6 shows the curves corresponding
to CO and CO2 evolution for the activated carbon (M-AC) and for the resultant electro-
oxidized sample (EO-M-AC+0.4). The amount of CO-evolving groups does not change
substantially, whereas the groups responsible for the CO2 evolution significantly increased
(from 0.2 to 0.8 mmol/g). When moderate oxidation takes place, the morphology of the
carbon material does not change significantly, although some oxygen functional groups can
be created at the surface of the material (i.e., hydroxyl groups) that could lead to an
improvement in wettability [32] and/or could lead to enhanced specific capacitance values
[33]. However, a strong oxidation can lead to deeper structural modifications that can cause
the degradation of the carbon material (i.e. carboxy groups) [34], producing carbon corrosion
products (CO and CO2) together with oxygen [35,36]. Additionally, the evolution of CO2 in
basic media produces carbonate ions (CO32-) obstructing and retarding the ions mobility in
porous materials [31].
11
On the view of these results, the huge decrease in capacitance values observed in KOH
(especially after 6,000 cycles) can be attributed to the oxidation of the positive electrode,
which becomes drastic after over passing a given potential.
4.- CONCLUSIONS
AC-M demonstrated an extremely poor long-term cycling performance in KOH,
especially after 6,000 cycles, even at a low operating voltage window, 0.6 V. This behaviour
was associated to the strong oxidation of the positive electrode caused by the progressive shift
of the working potential towards very positive potentials during cycling.
On the contrary, the performance of AC-M during long-term cycling in sulfuric acid
was good, with a reduction of specific capacitance values of only 8 % after 7,000
galvanostatic cycles at 0.6 V and 16 % at 1 V, despite the high contribution of
pseudocapacitance present in this media. In this electrolyte no change of the working
potentials of each electrode has been observed.
Acknowledgements.- This work has been performed with financial support from MEC
(project MAT2007-61467) and FICYT (project IB05-086-C1). V. Ruiz acknowledges a
predoctoral research grant from FICYT.

12
REFERENCES
[1] R.Kötz and M. Carlem, Electrochim. Acta 45 (2000) 2483.
[2] B. E. Conway, Electrochemical Supercapacitors, Scientific Fundamentals and
Technological Applications, Kluwer Academics/Plenum New York, 1999.
[3[ C. Peng, S. Zhang, D. Jewell, G. Chen, Prog. Nat. Sci. 18, issue 7 (2008) 777.
[4] C-C Hu, Y.H. Huang, K-H Chang, J. Power Sources 108 (2002) 117.
[5] K.W. Nam, K.B. Kim, J. Electrochem. Soc. 149 (2002) A346.
[6] M. Seredych, D. Hulicova-Jurcakova, G.Q. Lub, T.J. Bandosz, Carbon 46 (2008) 1475
[7] V. Ruiz, C. Blanco, E. Raymundo-Piñero, V. Khomenko, F. Béguin, R. Santamaría,
Electrochim. Acta 52 (2007) 4969.
[8] G. Lota, K. Lota, E. Frackowiak, Electrochem. Commun. 9, Issue 7 (2007) 1828.
[9] C.A. León y León, L.R. Radovic. Interfacial Chemistry and Electrochemistry of Carbon
Surfaces. In Chemistry and Physics of Carbon; P. A. Thrower, Ed.; Marcel Dekker: New
York, 1994; Vol. 24, p 213
[10] H. A. Andreas, B. E. Conway, Electrochim. Acta 51 (2006) 6510.
[11] E. Fuente, J.A. Menéndez, D. Suárez, M.A. Montes-Morán, Langmuir 19 (2003) 3505.
[12] A. Soffer, M. Folman, J. Electroanal. Chem. 38 (1972) 25.
[13] M. Zuleta, P. Björnbom, A. Lundblad, J. Electrochem. Soc. 153 (2006) A48.
[14] K. Jurewicz, C. Vix-Guterl, E. Frackowiak, S. Saadallah, M. Reda, J. Parmentier, J.
Patarin, F. Béguin, J. Phys. Chem. Solids 65 (2004) 287.
[15] C. Merino, P. Soto, E. Vilaplana-Ortego, J. M. Gómez de Salazar, F. Pico, J. M. Rojo,
Carbon 43 (2005) 551.
[16] D. Qu, H. Shi, J. Power Sources 74 (1998) 99.
[17] M. Endo, T. Takeda, Y. J. Kim, K. Koshiba K. Ishii, Carbon Sci. 1 (2001) 117.
[18] R. Pietrzak, K. Jurewicz, P. Nowicki, K. Babeł, H. Wachowska, Fuel 86 (2007) 1086.

13
[19] K. Kierzek, E. Frackowiak, G. Lota, G. Gryglewicz, J. Machnikowski Electrochim. Acta
49 (2004) 515.
[20] C. Portet, P.L. Taberna, P. Simon, E. Flahaut, C. Laberty-Robert, Electrochim. Acta 50
(2005) 4174.
[21] E. Mora, V. Ruiz, R. Santamaría, C. Blanco, M. Granda, R. Menéndez, J.M. Juárez-
Galán, F. Rodríguez-Reinoso, J. Power Sources 156 (2006) 719.
[22] M. M. Dubinin, D. A Cadenhead (Ed.), “Progress in Surface and Membrane Science”,
Vol. 9, Academic Press, London, 1975.
[23] H. F. Stoeckli, en J. W. Patrick (Ed.), “Porosity in carbons”, Edward Arnold, London,
Ch.3, 1995.
[24] R.H. Stokes, R.A. Robinson. “The Stokes and Robinson hydration theory: A
modification with application to concentrated electrolyte solutions”. Eds. Springer
Netherlands. Vol. 11, 1982.
[25] G. Salitra, A. Soffer, L. Eliad, Y. Cohen, D. Aurbach, J. Electrochem. Soc. 147, Issue 7
(2000) 2486.
[26] V. Ruiz, C. Blanco, R. Santamaría, J.M. Juárez-Galán, A. Sepúlveda-Escribano, F.
Rodríguez-Reinoso, Microporous Mesoporous Mater. 110 (2008) 431.
[27] T. Momma, X. Liu, T. Osaka, Y. Ushio, Y. Sawada, J. Power Sources 60 (1996) 249.
[28] Y. Shao, G. Yin, J. Zhang, Y. Gao, Electrochim. Acta 51 (2006) 5853.
[29] V. Ruiz, C. Blanco, M. Granda, R. Santamaría, Electrochim. Acta 54 (2008) 305.
[30] E. Frackowiak, J. Braz. Chem. Soc.17 (6) São Paulo Sept./Oct. 2006
[31] A. Rolla, A. Sadkowski, J. Wild and P. Zóltowski, J. Power Sources 5 (1980) 189.
[32] K. Horita, Y. Nishibori, and T. Oshima, Carbon 34 (1996) 217.
[33] J. Koresh and A. Soffer, J. Electrochem. Soc. 124 (1977) 1379.

14
[34] M. Nakahara, K. Shimizu, J. Mater. Sci. 27(1992) 1207.
[35] N. L. Weinberg, T. B. Reddy, J. Appl. Electrochem. 3 (1973) 73.
[36] Z.R. Yue, W. Jiang, L. Wang, S.D. Gardner, C.U. Pittman Jr., Carbon 37 (1999) 1785.
15
TABLES
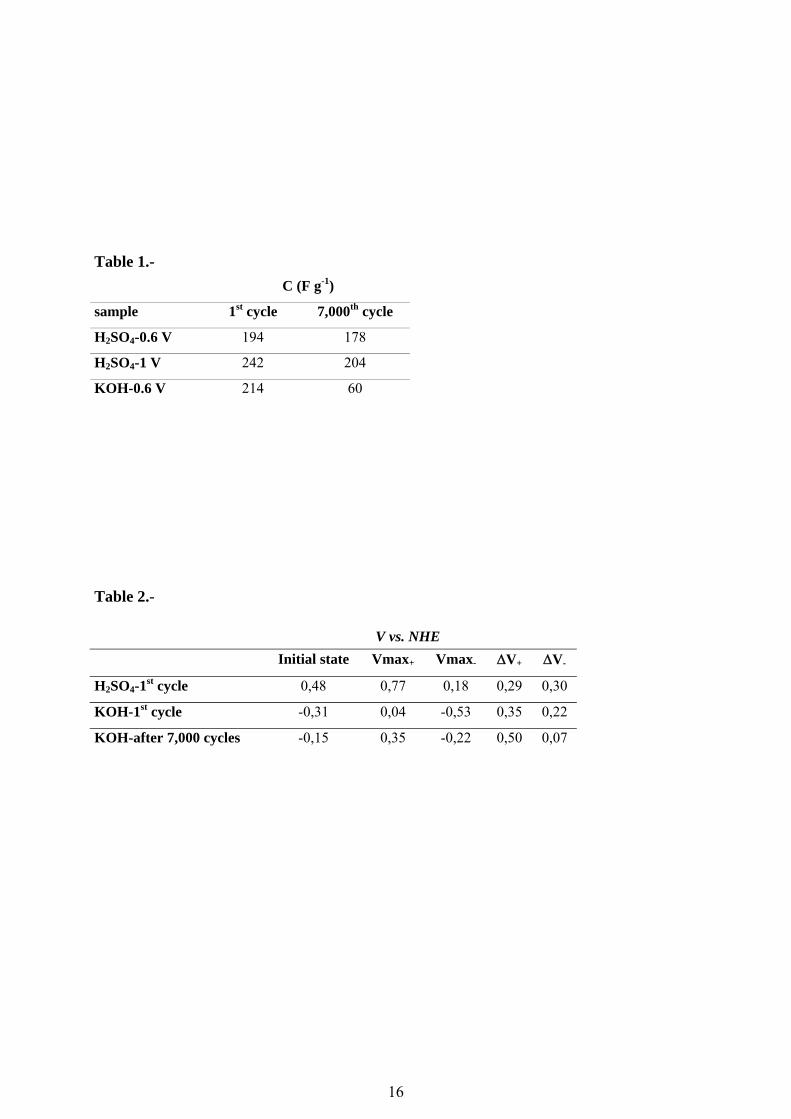
Table 1.- Specific capacitance values with the number of cycles performed at 0.6 and 1 V.
Current load 500 mA g-1.
Table 2.- Working potential values for positive and negative electrodes in H2SO4 and KOH.
16
Table 1.-
Table 2.-
V vs. NHE Initial state Vmax+ Vmax- ΔV+ ΔV-
H2SO4-1st cycle 0,48 0,77 0,18 0,29 0,30
KOH-1st cycle -0,31 0,04 -0,53 0,35 0,22
KOH-after 7,000 cycles -0,15 0,35 -0,22 0,50 0,07
C (F g-1)
sample 1st cycle 7,000th cycle
H2SO4-0.6 V 194 178
H2SO4-1 V 242 204
KOH-0.6 V 214 60

17
FIGURES
Figure 1.- Variation in the specific capacitance values with current density obtained in 1M
H2SO4, 6M KOH and 1M LiCl. Operating voltage 0.6 V.
Figure 2.- Cyclic voltammograms in a three-electrode cell performed in: a) H2SO4, b) KOH
and c) LiCl at a scan rate of 2 mV s-1.
Figure 3.- Variation in the specific capacitance values with the number of cycles obtained for
H2SO4 (at 0.6 and 1 V) and for KOH at 0.6 V. Current load 500 mA g-1.
Figure 4.- Effect of cyclability performed for M-AC in basic media: a) cyclic
voltammograms at 1 mV s-1 b) galvanostatic cycles at 500 mA g-1, c) Nyquist plots and d)
high frequency region of the Nyquist plots and e) high frequency region of the Nyquist plots
for M-AC in H2SO4
Figure 5.- a) Galvanostatic cycle for M-AC in H2SO4 at 0.6 V (right Y-axis) and the
potentials of work for the positive and negative electrodes (dash-line in left Y-axis). b)
Galvanostatic cycle for M-AC in KOH at 0.6 V (right Y-axis) and potentials of work for the
positive and negative electrodes (left Y-axis) before and after the long-term cycling. (a.u.=
arbitrary units). Current load 100 mA g-1.
Figure 6.- TPD profiles for the electro-oxidation of activated carbon. a) CO and b) CO2
evolution curves.
18
Figure 1
0
100
200
300
0 1000 2000 3000 4000I/ mA g-1
C/ F
g-1
H2SO4 1MKOH 6MLiCL 1M

19
Figure 2
a) b)
-400
-300
-200
-100
0
100
200
300
400
0 0,2 0,4 0,6 0,8 1 1,2V(V) vs NHE
C/ F
g-1
Serie1Serie2
-400
-300
-200
-100
0
100
200
300
400
-1 -0,8 -0,6 -0,4 -0,2 0 0,2 0,4
V(V) vs NHE
C/ F
g-1
Serie2Serie5CV in a 3-electrode cell in KOH Operating voltage in the 2-electrode cell
CV in a 3-electrode cell in H2SO4 Operating voltage in the 2-electrode cell

20
Figure 3
0
100
200
300
0 2000 4000 6000cycle number
C/ F
g-1
KOH-0.6 VH2SO4-0.6 Ve-a71V-13%
KOH 0.6 V H2SO4 0.6 V H2SO4 1.0 V

21
Figure 4
a) b)
c) d)
0
50
100
0 50 100Z'/ ohm
- Z''/
ohm
e)
0
2
4
6
0 1 2 3 4 5 6Z'(ohm)
-Z''(
ohm
)
0
5
10
15
0 5 10 15Z'/ ohm
- Z''/
ohm
0,0
0,2
0,4
0,6
0 100 200 300time/ sce
ll po
tent
ial/
V
1st cycle
6,000th cycle
7,000th cycle
1st cycle 6,000th cycle
7,000th cycle
-400
-200
0
200
400
0,0 0,2 0,4 0,6cell potential/ V
C/ F
g-1
1st cycleafter 2,000 cyclesafter 7,000 cycles
Cell voltage/ V
1st cycle
10,000th cycle

22
Figure 5
a)
0
0,2
0,4
0,6
0,8
1
V v
s N
HE
0
0,1
0,2
0,3
0,4
0,5
0,60 2 4 6 8 10
cell
pote
ntia
l/ V
b)
-0,7
-0,5
-0,3
-0,1
0,1
0,3
0,5
V v
s N
HE
0
0,2
0,4
0,60 2 4 6 8 10
cell
pote
ntia
l/ V
1st cycle after 7,000 cycles
a.u.
a.u.
Cell
vol
tage
/ VC
ell v
olta
ge/ V

23
Figure 6
a)
b)
0.E+00
2.E-07
4.E-07
6.E-07
0 200 400 600 800 1000 1200
Temperature (ºC)
mm
ol/g
s*
M-AC
EO-M-AC+0.4V
0.E+00
2.E-07
4.E-07
0 200 400 600 800 1000 1200
Temperature (ºC)
mm
ol/g
*s
M-AC
EO-M-AC_+0.4