1* arzu ÇİÇek2 kazım uysal 3, cem tokatli naime arslan
TRANSCRIPT

1 * Corresponding Author: Eskişehir Vocational School, Environmental Protection and Control Program, Eskişehir Osmangazi University, Eskişehir, Turkey. E-mail: [email protected] 2 Applied Environmental Research Centre, Anadolu University, Eskişehir, Turkey. E- mail: [email protected] 3 Departments of Biology, Faculty of Arts and Sciences, Dumlupınar University, Kütahya, Turkey. E-mail: kuysal@[email protected] 4 Ipsala Vocational School, Department of Laboratory Technology, Trakya University, Ipsala/Edirne, Turkey. E-mail: [email protected] 5 Department of Biology, Faculty of Arts and Sciences, Eskişehir Osmangazi University, Eskişehir, Turkey. E-mail: [email protected], [email protected]
Anadolu Üniversitesi Bilim ve Teknoloji Dergisi C- Yaşam Bilimleri ve Biyoteknoloji Anadolu University Journal of Science and Technology C- Life Science and Biotechnology 2016 - Cilt: 4 Sayı: 2 Sayfa: 81 - 93
DOI: 10.18036/btdc.35567
Geliş: 30 Temmuz 2015 Düzeltme: 22 Mart 2016 Kabul: 25 Mart 2016
EVALUATION OF SURFACE WATER QUALITY IN PORSUK STREAM
Esengül KÖSE1*, Arzu ÇİÇEK2, Kazım UYSAL 3, Cem TOKATLI4,
Naime ARSLAN5, Özgür EMİROĞLU5
Abstract
Porsuk Stream passing from the borders of Eskişehir and Kütahya has a significant water supply, feeds Sakarya River, which has an important water potential in Turkey. In particular, Porsuk Stream is used as domestic water in the Eskişehir Provinces. Therefore, determination of water quality of Porsuk Stream has a great importance for the health of ecosystems for the region. Water samples were collected seasonally (May 2010 – February 2011) from 13 stations selected on the Porsuk Stream and temperature, pH, dissolved oxygen, salinity, conductivity, ammonium nitrogen, nitrite nitrogen, nitrate nitrogen, sulphate, phosphate, chemical oxygen demand, biochemical oxygen demand, total phosphorus, total chlorine, calcium, magnesium, sodium, potassium parameters were investigated. The detected physicochemical parameters were statistically compared among the stations and the effective factors were classified by using the Factor Analysis (FA). Also, Cluster Analysis (CA) was applied to the results to classify the stations according to physicochemical characteristics by using the PAST package program. The data observed were evaluated with national and international water quality criteria. This study presents the necessity and usefulness of statistical techniques such as CA, FA and One-Way ANOVA in order to get better information about the surface water quality monitoring studies.
Keywords: Water Quality, Porsuk Stream, Factor Analysis, Custer Analysis, ICP-OES.
PORSUK ÇAYI YÜZEY SUYU KALİTESİNİN DEĞERLENDİRİLMESİ
Özet Porsuk Çayı, Kütahya ve Eskişehir il sınırlarından geçerek Türkiye’nin önemli su potansiyellerinden
biri olan Sakarya Nehri’ni besleyen önemli bir akarsudur. Özellikle, Eskişehir iline kadar olan kısmının kullanma suyu olarak değerlendirilmesi nedeni ile Porsuk Çayı’nın su kalitesinin belirlenmesi bölgede bulunan ekosistemlerin sağlığı açısından büyük önem arz etmektedir. Su örnekleri Porsuk Çayı üzerinde seçilen 13 istasyondan (Mayıs 2010- Şubat 2011) mevsimsel olarak toplanmış ve sıcaklık, pH, çözünmüş oksijen, tuzluluk, iletkenlik, amonyum nitrojen, nitrit nitrojen, nitrat nitrojen, sülfat, fosfat, kimyasal oksijen ihtiyacı, biyokimyasal oksijen ihtiyacı, toplam fosfor, toplam klor, kalsiyum, magnezyum, sodyum, potasyum parametreleri belirlenmiştir. Tespit edilen fizikokimyasal parametreler istasyonlar arasında istatistiksel olarak karşılaştırılmış ve Faktör Analizi kullanılarak etkili faktörler sınıflandırılmıştır. Aynı zamanda, Past istatistik programı kullanılarak suda ölçülen parametrelere göre istasyonların benzerliğini belirlemek amacı ile kümeleme analizi uygulanmıştır. Elde edilen veriler uluslar arası ve ulusal su kalite kriterleri ile karşılaştırılmıştır. Bu çalışma, yüzey suyu izleme çalışmaları hakkında daha iyi bilgi edinebilmek için Kümeleme Analizi (CA), Faktör Analizi (FA) ve tek yönlü varyans analizi (One-Way ANOVA) gibi istatistiksel tekniklerin kullanımı ve gerekliliğini göstermiştir.
Anahtar Kelimeler: Su Kalitesi, Porsuk Çayı, Faktör Analizi, Kümeleme Analizi, ICP-OES.
E. Köse et al. / Anadolu Univ. J.of Sci. and Tech. – C – Life Sci. and Biyotech. 4 (2) – 2016
82
1. INTRODUCTION
Freshwater systems play an important role in assimilation or transporting domestic, and industrial wastewater and runoff from agricultural region. Domestic and industrial wastewater discharge constitutes a significant constant polluting source, whereas surface runoff is seasonal differences largely affected in the river basin. Seasonal variations in rains, surface runoff, interflow, groundwater flow and pumped in and outflows have a strong effect on river discharge and subsequently, on the concentration of pollutants in river water. The effective pollution control and water resource management in fresh water systems such as river and lake of a region required to identify the pollution sources and their quantitative contributions [1-2].
The problems of interpretation, characteristic changes in surface water quality parameters, and indicator parameter identification can be approached through the use of multivariate statistical techniques such as cluster analysis (CA) and factor analysis (FA). In recent years, multivariate statistical techniques have been used in surface and ground water pollution studies [2-9].
The aim of in the present study, water quality
parameters (temperature, pH, dissolved oxygen, salinity, electrical conductivity, ammonium nitrogen, nitrite nitrogen, nitrate nitrogen sulphate, phosphate, chemical oxygen demand, biochemical oxygen demand, total chlorine, calcium, total phosphorus, potassium and sodium) of Porsuk Stream (an important branches of Sakarya River) was evaluated by using some statistical techniques.
2. MATERIAL AND METHODS 2.1. Study Area
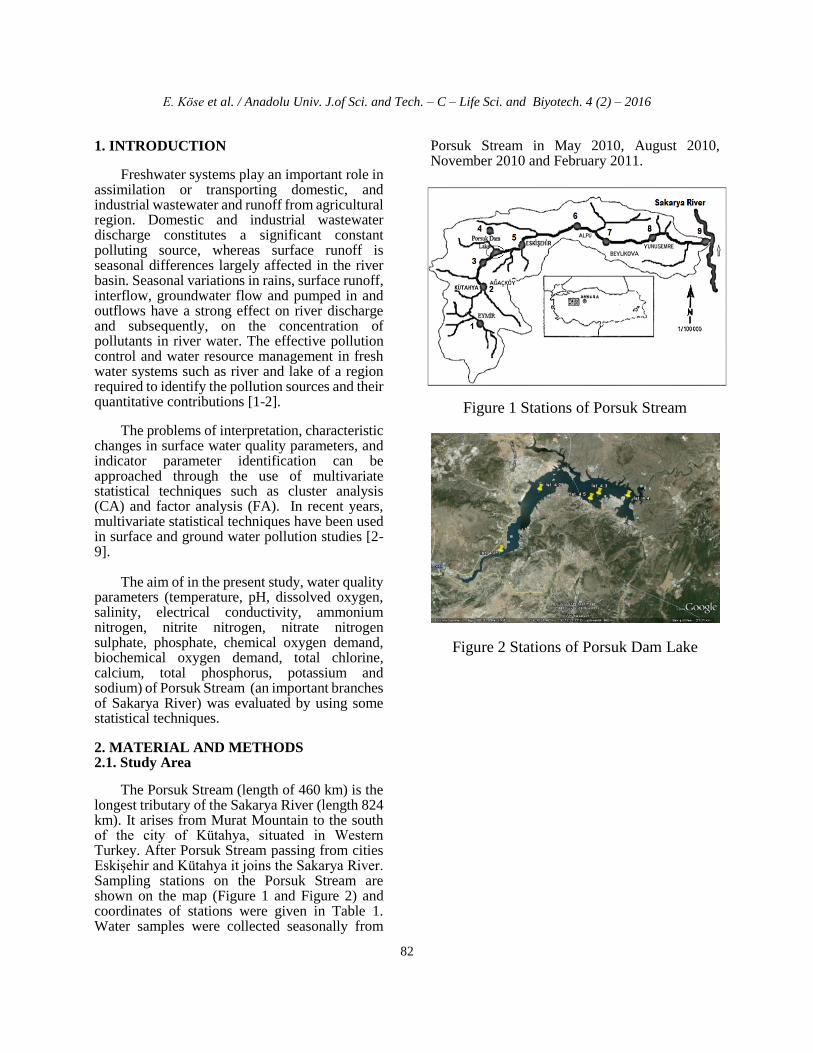
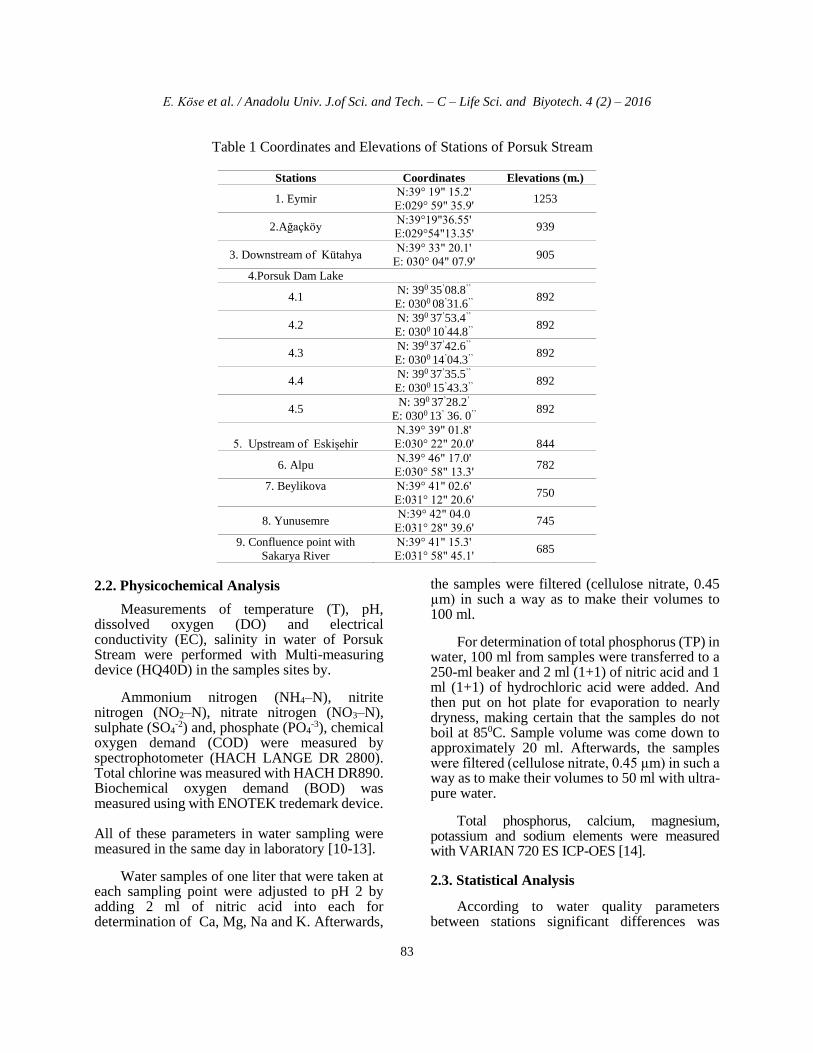
The Porsuk Stream (length of 460 km) is the longest tributary of the Sakarya River (length 824 km). It arises from Murat Mountain to the south of the city of Kütahya, situated in Western Turkey. After Porsuk Stream passing from cities Eskişehir and Kütahya it joins the Sakarya River. Sampling stations on the Porsuk Stream are shown on the map (Figure 1 and Figure 2) and coordinates of stations were given in Table 1. Water samples were collected seasonally from
Porsuk Stream in May 2010, August 2010, November 2010 and February 2011.
Figure 1 Stations of Porsuk Stream
Figure 2 Stations of Porsuk Dam Lake
E. Köse et al. / Anadolu Univ. J.of Sci. and Tech. – C – Life Sci. and Biyotech. 4 (2) – 2016
83
Table 1 Coordinates and Elevations of Stations of Porsuk Stream
Stations Coordinates Elevations (m.)
1. Eymir N:39° 19" 15.2'
E:029° 59" 35.9' 1253
2.Ağaçköy N:39°19"36.55'
E:029°54"13.35' 939
3. Downstream of Kütahya N:39° 33" 20.1'
E: 030° 04" 07.9' 905
4.Porsuk Dam Lake
4.1 N: 390 35’08.8’’
E: 0300 08’31.6’’ 892
4.2 N: 390 37’53.4’’
E: 0300 10’44.8’’ 892
4.3 N: 390 37’42.6’’
E: 0300 14’04.3’’ 892
4.4 N: 390 37’35.5’’
E: 0300 15’43.3’’ 892
4.5 N: 390 37’28.2’
E: 0300 13’ 36. 0’’ 892
5. Upstream of Eskişehir
N.39° 39" 01.8'
E:030° 22" 20.0'
844
6. Alpu N.39° 46" 17.0'
E:030° 58" 13.3' 782
7. Beylikova
N:39° 41" 02.6'
E:031° 12" 20.6' 750
8. Yunusemre N:39° 42" 04.0
E:031° 28" 39.6' 745
9. Confluence point with
Sakarya River
N:39° 41" 15.3'
E:031° 58" 45.1' 685
2.2. Physicochemical Analysis
Measurements of temperature (T), pH, dissolved oxygen (DO) and electrical conductivity (EC), salinity in water of Porsuk Stream were performed with Multi-measuring device (HQ40D) in the samples sites by.
Ammonium nitrogen (NH4–N), nitrite nitrogen (NO2–N), nitrate nitrogen (NO3–N), sulphate (SO4
-2) and, phosphate (PO4-3), chemical
oxygen demand (COD) were measured by spectrophotometer (HACH LANGE DR 2800). Total chlorine was measured with HACH DR890. Biochemical oxygen demand (BOD) was measured using with ENOTEK tredemark device. All of these parameters in water sampling were measured in the same day in laboratory [10-13].
Water samples of one liter that were taken at each sampling point were adjusted to pH 2 by adding 2 ml of nitric acid into each for determination of Ca, Mg, Na and K. Afterwards,
the samples were filtered (cellulose nitrate, 0.45 µm) in such a way as to make their volumes to 100 ml.
For determination of total phosphorus (TP) in water, 100 ml from samples were transferred to a 250-ml beaker and 2 ml (1+1) of nitric acid and 1 ml (1+1) of hydrochloric acid were added. And then put on hot plate for evaporation to nearly dryness, making certain that the samples do not boil at 850C. Sample volume was come down to approximately 20 ml. Afterwards, the samples were filtered (cellulose nitrate, 0.45 µm) in such a way as to make their volumes to 50 ml with ultra-pure water.
Total phosphorus, calcium, magnesium, potassium and sodium elements were measured with VARIAN 720 ES ICP-OES [14].
2.3. Statistical Analysis
According to water quality parameters between stations significant differences was
E. Köse et al. / Anadolu Univ. J.of Sci. and Tech. – C – Life Sci. and Biyotech. 4 (2) – 2016
84
determined with Analysis of variance (One-way ANOVA) (p<0.05). Also, water quality data sets of Porsuk Stream were performed cluster analysis. Cluster analysis (CA) is a group of multivariate techniques and CA classifies of river water quality parameters so that each parameters is similar to the others in the cluster with respect to a predetermined selection criterion [1,7]. Factor analysis (FA) was used to obtain a smaller number of variables for the evaluation of surface water quality of Porsuk Stream . Many studies have determined that CA and FA techniques reliably classifies surface water of aquaticsytems as river, stream and lake. [1,2, 5,6, 15-18]
One- way ANOVA, Factor Analysis (FA) techniques were carried out with SPSS 17 packed program. CA was performed using PAST Bray Curtis Program.
3. RESULTS
3.1. One-way ANOVA Analysis
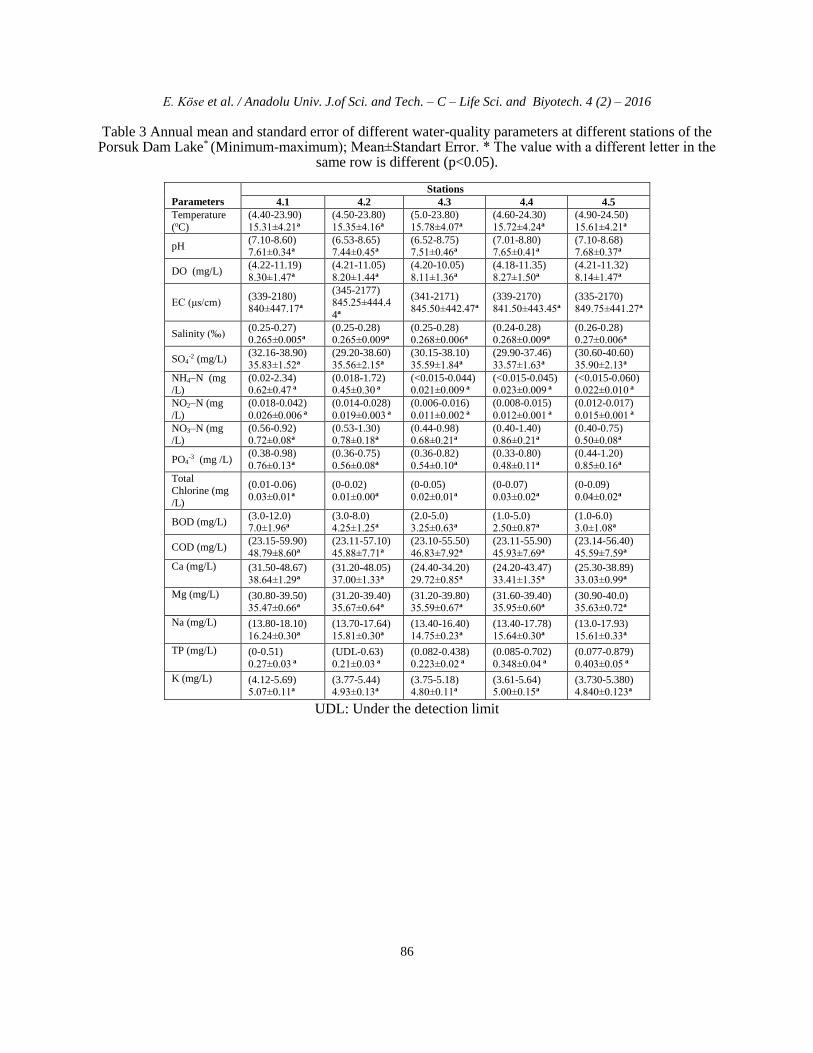
The annual mean water quality parameters results of Porsuk Stream stations and Porsuk Dam Lake stations were given Table 2 and 3. In Table 2, the data of station 4th. (The Porsuk Dam Lake) were shown by calculating the average rates of 4.1-4.5th stations.
According to annual mean temperature, pH, conductivity, total chlorine, nitrite nitrogen, nitrate nitrogen, COD parameters wasn’t found statistical difference (p>0.05; Table 2). Also, there weren’t statistical difference to all water quality parameters among stations of Porsuk Dam Lake (p>0.05; Table 3).
According to annual mean dissolved oxygen parameter, the lowest dissolved oxygen was found respectively in stations 3rd, 6th, 7th and 8th. Especially dissolved oxygen levels at stations 3rd and 6th were significantly lower than 1st, 2nd, 4th and 5th stations (p<0.05, Table 2). The lowest dissolved oxygen level was found in station 3rd in winter season (1.96 mg/L).
The highest sulfate levels were determined among stations in station 9th in spring, summer and winter seasons. According to the annual mean sulfate levels, station 9th were higher than other stations (p<0.05; Table 2). Station 3rd was higher than stations 1st, 2nd, 4th and 5th for BOD and ammonium nitrogen parameters.
The highest total chlorine was determined 0.28 mg/L in autumn season and Ca values were determined as 201 mg/L in station 9th in winter season (Table 2). 3.2. Cluster Analysis
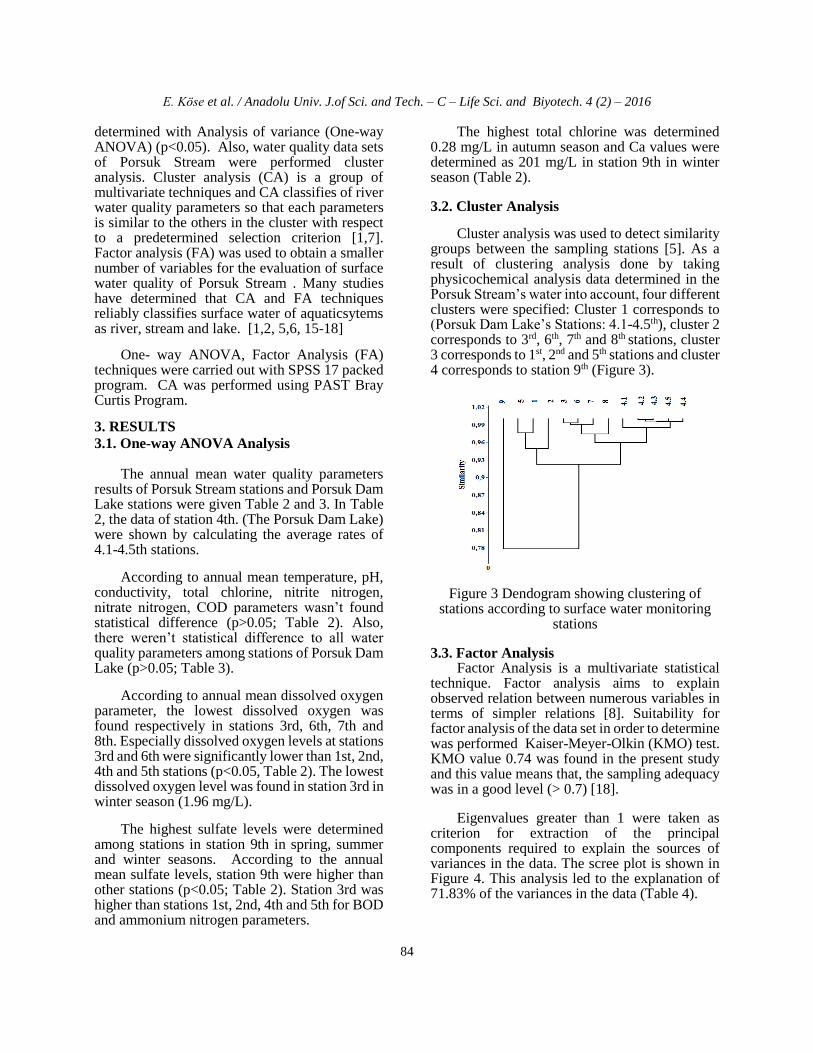
Cluster analysis was used to detect similarity groups between the sampling stations [5]. As a result of clustering analysis done by taking physicochemical analysis data determined in the Porsuk Stream’s water into account, four different clusters were specified: Cluster 1 corresponds to (Porsuk Dam Lake’s Stations: 4.1-4.5th), cluster 2 corresponds to 3rd, 6th, 7th and 8th stations, cluster 3 corresponds to 1st, 2nd and 5th stations and cluster 4 corresponds to station 9th (Figure 3).
Figure 3 Dendogram showing clustering of stations according to surface water monitoring
stations
3.3. Factor Analysis Factor Analysis is a multivariate statistical
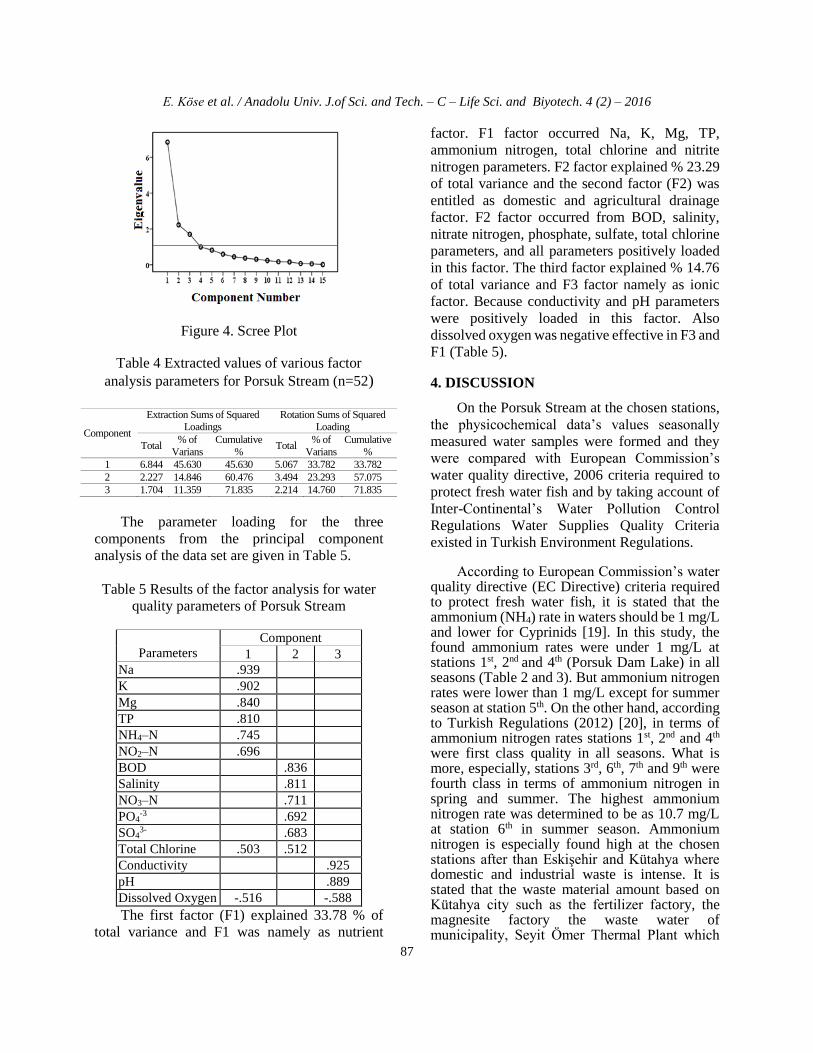
technique. Factor analysis aims to explain observed relation between numerous variables in terms of simpler relations [8]. Suitability for factor analysis of the data set in order to determine was performed Kaiser-Meyer-Olkin (KMO) test. KMO value 0.74 was found in the present study and this value means that, the sampling adequacy was in a good level (> 0.7) [18].
Eigenvalues greater than 1 were taken as
criterion for extraction of the principal components required to explain the sources of variances in the data. The scree plot is shown in Figure 4. This analysis led to the explanation of 71.83% of the variances in the data (Table 4).
E. Köse et al. / Anadolu Univ. J.of Sci. and Tech. – C – Life Sci. and Biyotech. 4 (2) – 2016
85
Table 2. Annual mean and standard error of different water-quality parameters at different stations of the
Porsuk Stream*
(Minimum-maximum); Mean±Standard Error. * The value with a different letter in the same row is different (p<0.05)
Parameters Stations
1 2 3 4 5 6 7 8 9
Temperature
(oC)
(4.80-19.70)
12.48±3.62a
(7.20-20.80)
14.93±3.11a
(10.30-22.60)
15.73±2.86a
(4.40-24.50)
15.55±1.66a
(4.80-12.50)
10.03±1.76a
(8.30-22.30)
14.95±3.22a
(6.80-25.20)
15.93±4.32a
(6.20-27.90)
16.43±4.94a
(6.30-25)
16.50±4.47a
pH (7.31-8.02)
7.65±0.18a
(7.31-8.20)
7.78±0.45a
(7.15-8.20)
7.78±0.23a
(6.52-8.80)
7.58±0.16a
(7.07-8.10)
7.61±0.22a
(7.11-7.64)
7.43±0.12a
(7.38-7.84)
7.58±0.10a
(7.11-7.90)
7.46±0.17a
(7.11-8.38)
7.60±0.27a
DO (mg/L) (7.74-12.13)
9.52±1.01a
(8.45-10.75)
9.12±0.55a
(1.96-3.40)
2.74±0.35b
(4.18-11.35)
8.20±0.58a
(6.50-11.58)
8.64±1.08a
(2.16-3.36)
2.96±0.28b
(3.47-5.95)
4.59±0.65b
(3.90-8)
5.80±1.09ab
(5.21-9.77)
7.25±1.16a
EC (μs/cm) (326-1767) 745.25±342.4a
(397-1839) 805±345.63a
(537-1425) 830.5±202.5a
(335-2180) 844.40±176.34a
(347-1776) 745.50±344.06a
(715-1142) 833±103.48a
(697-1091) 827.5±1149.7a
(637-1293) 864.7±149.6a
(825-1500) 1149.7±139.6a
Salinity (‰) (0.27-0.33)
0.29±0.01a
(0.27-0.33)
0.30±0.01a
(0.37-0.41)
0.40±0.009ab
(0.24-0.28)
0.27±0.00a
(0.27-0.33)
0.31±0.015a
(0.49-0.53)
0.51±0.008b
(0.47-0.54)
0.51±0.01b
(0.44-0.53)
0.48±0.01b
(0.69-0.94)
0.77±0.06c
SO4-2 (mg/L)
(12.70-15)
14.23±2.91a
(4.97-16.10)
9.57±2.91a
(54.60-75.30)
67.43±5.60b
(29.20-40.60)
35.29±0.77a
(22.70-34.80)
30.73±3.48a
(60.80-66.90)
64.70±1.69b
(34.80-71)
58.23±10.16b
(44-78.60)
61.27±8.65b
(51.60-366)
201.20±78.88c
NH4–N (mg
/L)
(<0.015-0.024)
0.009±0.00a
(<0.015-0.059)
0.027±0.01a
(0.057-7.60)
2.78±1.78b
(<0.015-0.09)
0.017±0.00a
(0.015-1.58)
0.46±0.37a
(0.024-10.70)
4.41±2.64b
(0.024-8.16)
4.0±2.29b
(0.025-4.23)
2.13±1.21b
(0.028-2.45)
1.02±0.59b
NO2–N (mg
/L)
(0.001-0.018)
0.011±0.004a
(0.004-0.015)
0.009±0.00a
(0.037-0.156)
0.081±0.03a
(0.003-0.042)
0.012±0.00a
(0.025-0.046)
0.035±0.01a
(0.036-0.166)
0.093±0.03a
(0.040-0.256)
0.108±0.05a
(0.033-0.375)
0.127±0.08a
(0.009-0.137)
0.084±0.03a
NO3–N (mg
/L)
(0.40-1.40)
0.95±0.21a
(0.80-3.0)
1.40±0.53a
(0.20-3.70)
1.825±0.72a
(0.10-1.40)
0.66±0.08a
(0.90-1.80)
1.190±0.20a
(1-2.10)
1.48±0.22a
(0.30-2.30)
1.52±0.48a
(0.60-2.80)
1.55±0.45a
(0.90-3.04)
1.81±0.48a
PO4-3 (mg /L)
(0.16-1.23)
0.53±0.24a
(0.15-0.58)
0.38±0.09a
(1.18-3.06)
1.85±0.42bc
(0.33-1.20)
0.64±0.06a
(0.61-1.62)
1.22±0.22ab
(2-2.65)
2.46±0.15c
(2.58-3.25)
2.81±0.15c
(1.94-2.90)
2.50±0.20c
(1.58-2.87)
2.45±0.30c
Total Chlorine
(mg /L)
(0-0.05)
0.028±0.01a
(0-0.07)
0.035±0.01a
(0.020-0.170)
0.12±0.03a
(0-0.09)
0.03±0.01a
(0-0.14)
0.053±0.03a
(0.02-0.20)
0.08±0.04a
(0.05-0.18)
0.10±0.03a
(0.03-0.13)
0.078±0.03a
(0.07-0.28)
0.15±0.05a
BOD (mg/L) (0-1)
0.25±0.0a
(0-3)
1±0.71a
(11-28)
19±3.76b
(0-12)
3.55±0.71c
(2-14)
5.50±2.84c
(10-24)
15.25±3.09bc
(8-23)
16.75±3.15bc
(10-19)
13.75±2.25bc
(13-27)
18.25±3.20b
COD (mg/L) (<5-43.60)
21.78±12.57a
(<5- 45.40)
32.03±9.59a
(11.80-70.10)
49.38±10.50a
(23.10-69.70)
47.38±3.34a
(5.09-54.60)
40.75±11.94a
(23.06-67.80)
54.02±9.34a
(19.60-69.70)
54.25±9.66a
(25.30-79.30)
58.40±9.15a
(25.80-80.80)
54.08±7.95a
Ca (mg/L) (54.50–181)
93.53±10.17a (52.50–85)
89.60±48.48a (69–179)
107.01±7.56a (24.20–48.67)
34.13±0.61b (33.70–52.40)
45.95±1.35b (33.77–75.50)
52.91±3.08b (33.70–74.50)
52.46±2.84b (52.70–73.40)
61.41±1.7ab (57–201)
118.11±8.62a
Mg (mg/L) (19.80-27.20) 23.72±0.59a
(19.70-27.20) 23.74±0.60a
(25.30-37.70) 32.04±1.06a
(30.80-40) 35.78±0.29a
(34.70-42.10) 38.21±0.50a
(34.70-53.50) 42.89±1.36a
(34.70-53.90) 45.32±1.53a
(42-54) 46.47±0.95a
(46.50-176) 109.40±9.89b
Na (mg/L) (7.85-10.40)
8.92±0.16a
(7.69-10.40)
8.70±0.19a
(17.40-31.40)
22.78±1.07a
(13-18.10)
15.50±0.13a
(12.7016.50)
14.35±0.24a
(12.70-65.56)
40.98±3.79a
(UDL-56.43)
25.90±4.33a
(35.20-54.50)
46.19±1.24a
(67.70-395)
197.78±24.72b
TP (mg/L) (UDL-0.174)
0.079±0.013a
(UDL-0.20)
0.10±0.01a
(0.750-3.97)
1.68±0.22b
(UDL-0.71)
0.26±0.01a
(UDL-1.60)
0.63±0.09a
(UDL -2.81)
1.49±0.20b
(UDL-4.12)
2.13±0.30b
(0.92-4.41)
2.49±0.31b
(UDL-4.22)
1.47±0.32b
K (mg/L) (2.51-4.59)
3.26±0.14a
(0.71-2.58)
2.02±0.15a
(5.48-8.91)
6.57±0.27ab
(3.61-5.69)
4.91±0.05a
(3.79-5.65)
4.82±0.12a
(3.79-11.60)
7.74±0.70bc
(4.82-12.70)
9.72±0.61bc
(7.24-17.80)
11.51±0.80bc
(10.40-26.30)
16.70±1.21c
E. Köse et al. / Anadolu Univ. J.of Sci. and Tech. – C – Life Sci. and Biyotech. 4 (2) – 2016
86
Table 3 Annual mean and standard error of different water-quality parameters at different stations of the Porsuk Dam Lake* (Minimum-maximum); Mean±Standart Error. * The value with a different letter in the
same row is different (p<0.05).
Parameters
Stations
4.1 4.2 4.3 4.4 4.5
Temperature
(oC)
(4.40-23.90)
15.31±4.21a
(4.50-23.80)
15.35±4.16a
(5.0-23.80)
15.78±4.07a
(4.60-24.30)
15.72±4.24a
(4.90-24.50)
15.61±4.21a
pH (7.10-8.60) 7.61±0.34a
(6.53-8.65) 7.44±0.45a
(6.52-8.75) 7.51±0.46a
(7.01-8.80) 7.65±0.41a
(7.10-8.68) 7.68±0.37a
DO (mg/L) (4.22-11.19)
8.30±1.47a
(4.21-11.05)
8.20±1.44a
(4.20-10.05)
8.11±1.36a
(4.18-11.35)
8.27±1.50a
(4.21-11.32)
8.14±1.47a
EC (μs/cm) (339-2180)
840±447.17a
(345-2177) 845.25±444.4
4a
(341-2171)
845.50±442.47a
(339-2170)
841.50±443.45a
(335-2170)
849.75±441.27a
Salinity (‰) (0.25-0.27)
0.265±0.005a
(0.25-0.28)
0.265±0.009a
(0.25-0.28)
0.268±0.006a
(0.24-0.28)
0.268±0.009a
(0.26-0.28)
0.27±0.006a
SO4-2 (mg/L)
(32.16-38.90)
35.83±1.52a
(29.20-38.60)
35.56±2.15a
(30.15-38.10)
35.59±1.84a
(29.90-37.46)
33.57±1.63a
(30.60-40.60)
35.90±2.13a
NH4–N (mg /L)
(0.02-2.34) 0.62±0.47 a
(0.018-1.72) 0.45±0.30 a
(<0.015-0.044) 0.021±0.009 a
(<0.015-0.045) 0.023±0.009 a
(<0.015-0.060) 0.022±0.010 a
NO2–N (mg
/L)
(0.018-0.042)
0.026±0.006 a
(0.014-0.028)
0.019±0.003 a
(0.006-0.016)
0.011±0.002 a
(0.008-0.015)
0.012±0.001 a
(0.012-0.017)
0.015±0.001 a
NO3–N (mg /L)
(0.56-0.92) 0.72±0.08a
(0.53-1.30) 0.78±0.18a
(0.44-0.98) 0.68±0.21a
(0.40-1.40) 0.86±0.21a
(0.40-0.75) 0.50±0.08a
PO4-3 (mg /L)
(0.38-0.98)
0.76±0.13a
(0.36-0.75)
0.56±0.08a
(0.36-0.82)
0.54±0.10a
(0.33-0.80)
0.48±0.11a
(0.44-1.20)
0.85±0.16a
Total Chlorine (mg
/L)
(0.01-0.06)
0.03±0.01a
(0-0.02)
0.01±0.00a
(0-0.05)
0.02±0.01a
(0-0.07)
0.03±0.02a
(0-0.09)
0.04±0.02a
BOD (mg/L) (3.0-12.0) 7.0±1.96a
(3.0-8.0) 4.25±1.25a
(2.0-5.0) 3.25±0.63a
(1.0-5.0) 2.50±0.87a
(1.0-6.0) 3.0±1.08a
COD (mg/L) (23.15-59.90)
48.79±8.60a
(23.11-57.10)
45.88±7.71a
(23.10-55.50)
46.83±7.92a
(23.11-55.90)
45.93±7.69a
(23.14-56.40)
45.59±7.59a
Ca (mg/L) (31.50-48.67)
38.64±1.29a
(31.20-48.05)
37.00±1.33a
(24.40-34.20)
29.72±0.85a
(24.20-43.47)
33.41±1.35a
(25.30-38.89)
33.03±0.99a
Mg (mg/L) (30.80-39.50) 35.47±0.66a
(31.20-39.40) 35.67±0.64a
(31.20-39.80) 35.59±0.67a
(31.60-39.40) 35.95±0.60a
(30.90-40.0) 35.63±0.72a
Na (mg/L) (13.80-18.10)
16.24±0.30a
(13.70-17.64)
15.81±0.30a
(13.40-16.40)
14.75±0.23a
(13.40-17.78)
15.64±0.30a
(13.0-17.93)
15.61±0.33a
TP (mg/L) (0-0.51)
0.27±0.03 a
(UDL-0.63)
0.21±0.03 a
(0.082-0.438)
0.223±0.02 a
(0.085-0.702)
0.348±0.04 a
(0.077-0.879)
0.403±0.05 a
K (mg/L) (4.12-5.69) 5.07±0.11a
(3.77-5.44) 4.93±0.13a
(3.75-5.18) 4.80±0.11a
(3.61-5.64) 5.00±0.15a
(3.730-5.380) 4.840±0.123a
UDL: Under the detection limit
E. Köse et al. / Anadolu Univ. J.of Sci. and Tech. – C – Life Sci. and Biyotech. 4 (2) – 2016
87
Figure 4. Scree Plot
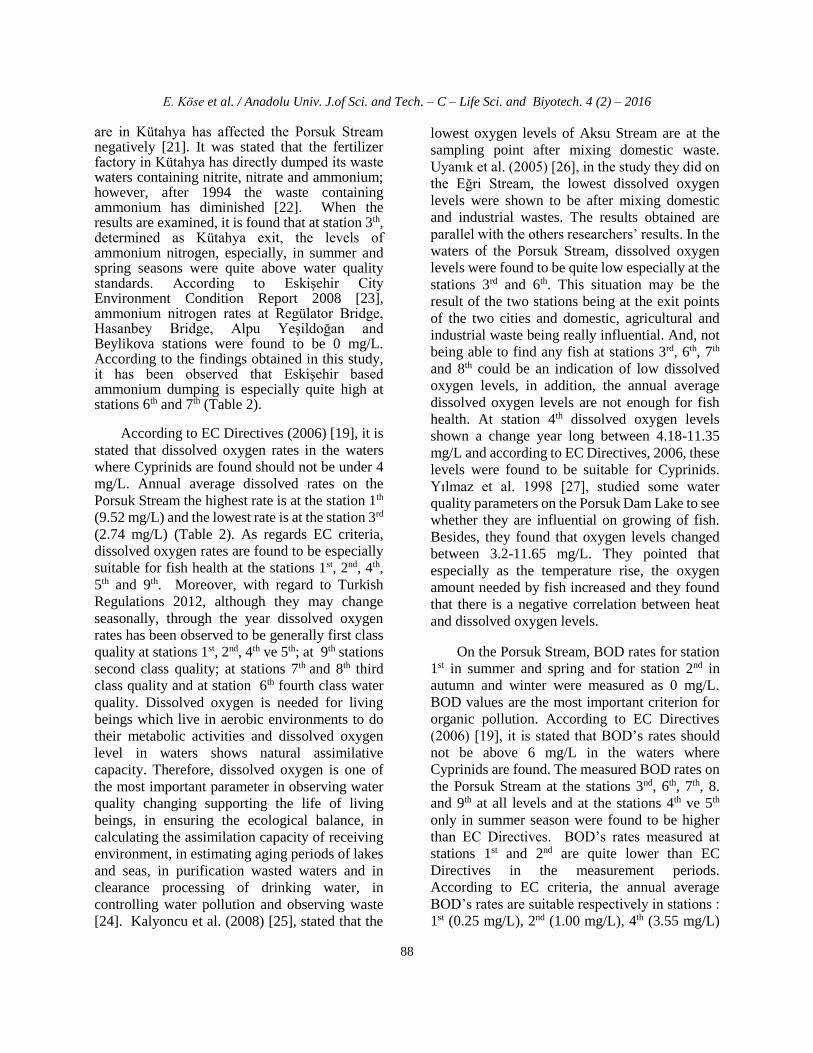
Table 4 Extracted values of various factor
analysis parameters for Porsuk Stream (n=52)
Component
Extraction Sums of Squared Loadings
Rotation Sums of Squared Loading
Total % of
Varians
Cumulative
% Total
% of
Varians
Cumulative
%
1 6.844 45.630 45.630 5.067 33.782 33.782
2 2.227 14.846 60.476 3.494 23.293 57.075
3 1.704 11.359 71.835 2.214 14.760 71.835
The parameter loading for the three
components from the principal component
analysis of the data set are given in Table 5.
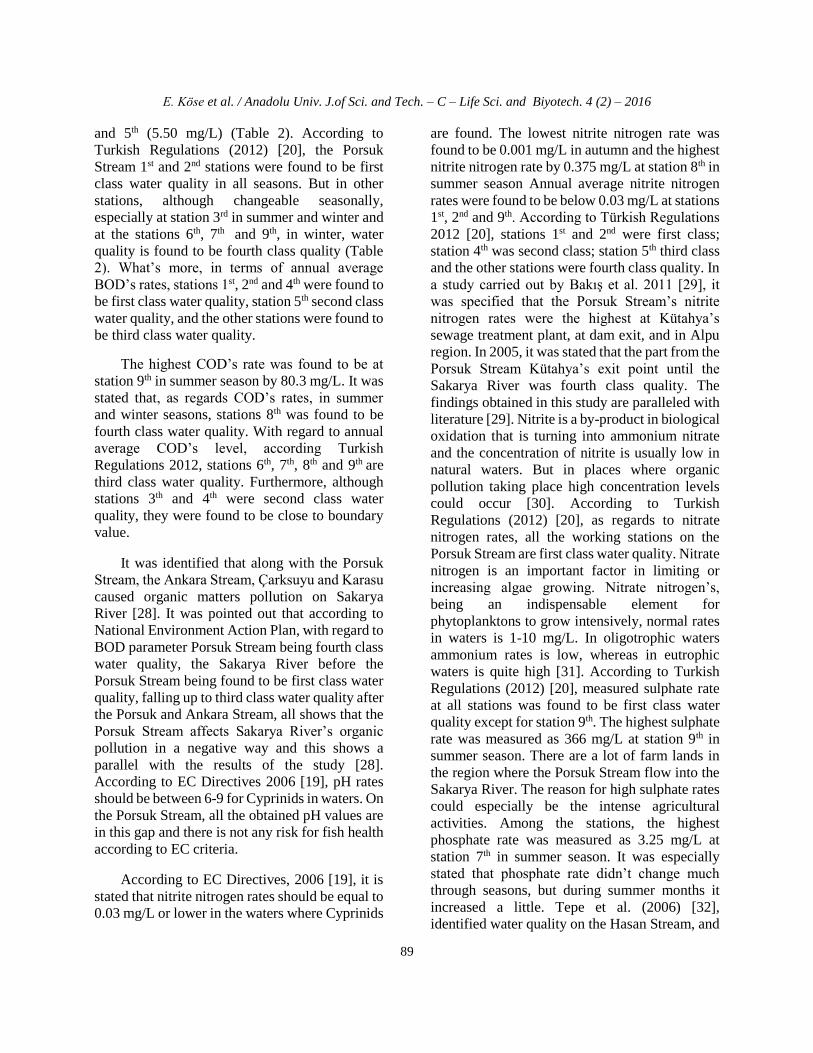
Table 5 Results of the factor analysis for water
quality parameters of Porsuk Stream
Parameters
Component
1 2 3
Na .939
K .902
Mg .840
TP .810
NH4–N .745
NO2–N .696
BOD .836
Salinity .811
NO3–N .711
PO4-3 .692
SO43- .683
Total Chlorine .503 .512
Conductivity .925
pH .889
Dissolved Oxygen -.516 -.588
The first factor (F1) explained 33.78 % of
total variance and F1 was namely as nutrient
factor. F1 factor occurred Na, K, Mg, TP,
ammonium nitrogen, total chlorine and nitrite
nitrogen parameters. F2 factor explained % 23.29
of total variance and the second factor (F2) was
entitled as domestic and agricultural drainage
factor. F2 factor occurred from BOD, salinity,
nitrate nitrogen, phosphate, sulfate, total chlorine
parameters, and all parameters positively loaded
in this factor. The third factor explained % 14.76
of total variance and F3 factor namely as ionic
factor. Because conductivity and pH parameters
were positively loaded in this factor. Also
dissolved oxygen was negative effective in F3 and
F1 (Table 5).
4. DISCUSSION
On the Porsuk Stream at the chosen stations,
the physicochemical data’s values seasonally
measured water samples were formed and they
were compared with European Commission’s
water quality directive, 2006 criteria required to
protect fresh water fish and by taking account of
Inter-Continental’s Water Pollution Control
Regulations Water Supplies Quality Criteria
existed in Turkish Environment Regulations.
According to European Commission’s water quality directive (EC Directive) criteria required to protect fresh water fish, it is stated that the ammonium (NH4) rate in waters should be 1 mg/L and lower for Cyprinids [19]. In this study, the found ammonium rates were under 1 mg/L at stations 1st, 2nd and 4th (Porsuk Dam Lake) in all seasons (Table 2 and 3). But ammonium nitrogen rates were lower than 1 mg/L except for summer season at station 5th. On the other hand, according to Turkish Regulations (2012) [20], in terms of ammonium nitrogen rates stations 1st, 2nd and 4th were first class quality in all seasons. What is more, especially, stations 3rd, 6th, 7th and 9th were fourth class in terms of ammonium nitrogen in spring and summer. The highest ammonium nitrogen rate was determined to be as 10.7 mg/L at station 6th in summer season. Ammonium nitrogen is especially found high at the chosen stations after than Eskişehir and Kütahya where domestic and industrial waste is intense. It is stated that the waste material amount based on Kütahya city such as the fertilizer factory, the magnesite factory the waste water of municipality, Seyit Ömer Thermal Plant which
E. Köse et al. / Anadolu Univ. J.of Sci. and Tech. – C – Life Sci. and Biyotech. 4 (2) – 2016
88
are in Kütahya has affected the Porsuk Stream negatively [21]. It was stated that the fertilizer factory in Kütahya has directly dumped its waste waters containing nitrite, nitrate and ammonium; however, after 1994 the waste containing ammonium has diminished [22]. When the results are examined, it is found that at station 3th, determined as Kütahya exit, the levels of ammonium nitrogen, especially, in summer and spring seasons were quite above water quality standards. According to Eskişehir City Environment Condition Report 2008 [23], ammonium nitrogen rates at Regülator Bridge, Hasanbey Bridge, Alpu Yeşildoğan and Beylikova stations were found to be 0 mg/L. According to the findings obtained in this study, it has been observed that Eskişehir based ammonium dumping is especially quite high at stations 6th and 7th (Table 2).
According to EC Directives (2006) [19], it is
stated that dissolved oxygen rates in the waters
where Cyprinids are found should not be under 4
mg/L. Annual average dissolved rates on the
Porsuk Stream the highest rate is at the station 1th
(9.52 mg/L) and the lowest rate is at the station 3rd
(2.74 mg/L) (Table 2). As regards EC criteria,
dissolved oxygen rates are found to be especially
suitable for fish health at the stations 1st, 2nd, 4th,
5th and 9th. Moreover, with regard to Turkish
Regulations 2012, although they may change
seasonally, through the year dissolved oxygen
rates has been observed to be generally first class
quality at stations 1st, 2nd, 4th ve 5th; at 9th stations
second class quality; at stations 7th and 8th third
class quality and at station 6th fourth class water
quality. Dissolved oxygen is needed for living
beings which live in aerobic environments to do
their metabolic activities and dissolved oxygen
level in waters shows natural assimilative
capacity. Therefore, dissolved oxygen is one of
the most important parameter in observing water
quality changing supporting the life of living
beings, in ensuring the ecological balance, in
calculating the assimilation capacity of receiving
environment, in estimating aging periods of lakes
and seas, in purification wasted waters and in
clearance processing of drinking water, in
controlling water pollution and observing waste
[24]. Kalyoncu et al. (2008) [25], stated that the
lowest oxygen levels of Aksu Stream are at the
sampling point after mixing domestic waste.
Uyanık et al. (2005) [26], in the study they did on
the Eğri Stream, the lowest dissolved oxygen
levels were shown to be after mixing domestic
and industrial wastes. The results obtained are
parallel with the others researchers’ results. In the
waters of the Porsuk Stream, dissolved oxygen
levels were found to be quite low especially at the
stations 3rd and 6th. This situation may be the
result of the two stations being at the exit points
of the two cities and domestic, agricultural and
industrial waste being really influential. And, not
being able to find any fish at stations 3rd, 6th, 7th
and 8th could be an indication of low dissolved
oxygen levels, in addition, the annual average
dissolved oxygen levels are not enough for fish
health. At station 4th dissolved oxygen levels
shown a change year long between 4.18-11.35
mg/L and according to EC Directives, 2006, these
levels were found to be suitable for Cyprinids.
Yılmaz et al. 1998 [27], studied some water
quality parameters on the Porsuk Dam Lake to see
whether they are influential on growing of fish.
Besides, they found that oxygen levels changed
between 3.2-11.65 mg/L. They pointed that
especially as the temperature rise, the oxygen
amount needed by fish increased and they found
that there is a negative correlation between heat
and dissolved oxygen levels.
On the Porsuk Stream, BOD rates for station
1st in summer and spring and for station 2nd in
autumn and winter were measured as 0 mg/L.
BOD values are the most important criterion for
organic pollution. According to EC Directives
(2006) [19], it is stated that BOD’s rates should
not be above 6 mg/L in the waters where
Cyprinids are found. The measured BOD rates on
the Porsuk Stream at the stations 3nd, 6th, 7th, 8.
and 9th at all levels and at the stations 4th ve 5th
only in summer season were found to be higher
than EC Directives. BOD’s rates measured at
stations 1st and 2nd are quite lower than EC
Directives in the measurement periods.
According to EC criteria, the annual average
BOD’s rates are suitable respectively in stations :
1st (0.25 mg/L), 2nd (1.00 mg/L), 4th (3.55 mg/L)
E. Köse et al. / Anadolu Univ. J.of Sci. and Tech. – C – Life Sci. and Biyotech. 4 (2) – 2016
89
and 5th (5.50 mg/L) (Table 2). According to
Turkish Regulations (2012) [20], the Porsuk
Stream 1st and 2nd stations were found to be first
class water quality in all seasons. But in other
stations, although changeable seasonally,
especially at station 3rd in summer and winter and
at the stations 6th, 7th and 9th, in winter, water
quality is found to be fourth class quality (Table
2). What’s more, in terms of annual average
BOD’s rates, stations 1st, 2nd and 4th were found to
be first class water quality, station 5th second class
water quality, and the other stations were found to
be third class water quality.
The highest COD’s rate was found to be at
station 9th in summer season by 80.3 mg/L. It was
stated that, as regards COD’s rates, in summer
and winter seasons, stations 8th was found to be
fourth class water quality. With regard to annual
average COD’s level, according Turkish
Regulations 2012, stations 6th, 7th, 8th and 9th are
third class water quality. Furthermore, although
stations 3th and 4th were second class water
quality, they were found to be close to boundary
value.
It was identified that along with the Porsuk
Stream, the Ankara Stream, Çarksuyu and Karasu
caused organic matters pollution on Sakarya
River [28]. It was pointed out that according to
National Environment Action Plan, with regard to
BOD parameter Porsuk Stream being fourth class
water quality, the Sakarya River before the
Porsuk Stream being found to be first class water
quality, falling up to third class water quality after
the Porsuk and Ankara Stream, all shows that the
Porsuk Stream affects Sakarya River’s organic
pollution in a negative way and this shows a
parallel with the results of the study [28].
According to EC Directives 2006 [19], pH rates
should be between 6-9 for Cyprinids in waters. On
the Porsuk Stream, all the obtained pH values are
in this gap and there is not any risk for fish health
according to EC criteria.
According to EC Directives, 2006 [19], it is
stated that nitrite nitrogen rates should be equal to
0.03 mg/L or lower in the waters where Cyprinids
are found. The lowest nitrite nitrogen rate was
found to be 0.001 mg/L in autumn and the highest
nitrite nitrogen rate by 0.375 mg/L at station 8th in
summer season Annual average nitrite nitrogen
rates were found to be below 0.03 mg/L at stations
1st, 2nd and 9th. According to Türkish Regulations
2012 [20], stations 1st and 2nd were first class;
station 4th was second class; station 5th third class
and the other stations were fourth class quality. In
a study carried out by Bakış et al. 2011 [29], it
was specified that the Porsuk Stream’s nitrite
nitrogen rates were the highest at Kütahya’s
sewage treatment plant, at dam exit, and in Alpu
region. In 2005, it was stated that the part from the
Porsuk Stream Kütahya’s exit point until the
Sakarya River was fourth class quality. The
findings obtained in this study are paralleled with
literature [29]. Nitrite is a by-product in biological
oxidation that is turning into ammonium nitrate
and the concentration of nitrite is usually low in
natural waters. But in places where organic
pollution taking place high concentration levels
could occur [30]. According to Turkish
Regulations (2012) [20], as regards to nitrate
nitrogen rates, all the working stations on the
Porsuk Stream are first class water quality. Nitrate
nitrogen is an important factor in limiting or
increasing algae growing. Nitrate nitrogen’s,
being an indispensable element for
phytoplanktons to grow intensively, normal rates
in waters is 1-10 mg/L. In oligotrophic waters
ammonium rates is low, whereas in eutrophic
waters is quite high [31]. According to Turkish
Regulations (2012) [20], measured sulphate rate
at all stations was found to be first class water
quality except for station 9th. The highest sulphate
rate was measured as 366 mg/L at station 9th in
summer season. There are a lot of farm lands in
the region where the Porsuk Stream flow into the
Sakarya River. The reason for high sulphate rates
could especially be the intense agricultural
activities. Among the stations, the highest
phosphate rate was measured as 3.25 mg/L at
station 7th in summer season. It was especially
stated that phosphate rate didn’t change much
through seasons, but during summer months it
increased a little. Tepe et al. (2006) [32],
identified water quality on the Hasan Stream, and

E. Köse et al. / Anadolu Univ. J.of Sci. and Tech. – C – Life Sci. and Biyotech. 4 (2) – 2016
90
they determined that phosphate levels increased
monthly during summer months. They explained
that this situation could be the result of using
phosphate fertilizers and increasing the transfer of
phosphorus in water to the soil by rooted above-
water plants growing during summer months. The
findings obtained from this study support this
situation. The lowest electricity conductivity rate
of the Porsuk Stream was measured as 326 μs/cm
at station 1st in winter season, while the highest
rate was measured as 2180 μs/cm at 4.1th station
in spring season. And the annual average
conducting rate was measured as 745.25 μs/cm at
station 1st. The reason for decreased conducting
rate at all stations in winter season could be
explained by increasing of rainfall.
Salinity values especially at stations 3rd, 6th,
7th and 9th were to be found higher than the other
stations in all seasons. The fertilizer both natural
and artificial used in agricultural lands, domestic
waste water and geologic structure of the river
bed could increase salinity rate. Because high
concentration of salt in water leads to aridity in
the soil, this is an unwanted circumstance [31].
The highest salinity rate in the Porsuk Stream’s
water was found to be as ‰ 0.94 at station 9th in
summer season. Because of its location at the last
point of the Porsuk Stream, station 9th is at a point
where the pollution loads accumulate and it can
be said that intensive agricultural activities
increase the salinity rate.
The pollution of Karaçay was analyzed with
physicochemical and biological parameters by
Kara et al. 2004 [33]. They specified that the rates
of nitrite, phosphate and conductivity were quite
high and dissolved oxygen rates were low at the
stations. They linked this condition with region
being under the influence of domestic, industrial
and pollution. The results obtained from this
study show parallels with literature knowledge
especially at stations 3rd, 6th, 7th and 8th.
In the field of study, the highest mean Ca
level was found to be as (78.40 mg/L) in spring
season at the station 3rd, at the station 9th in the
summer and autumn season and at the station 1th
it was found to be as (181 mg/L) in winter. Mg
was found to be the highest at station 9th in all
seasons and annual average Mg level was 109.40
mg/L at station 9th. On the Porsuk Dam Lake
(stations 4.1-4.5th), Ca levels showed a change at
the stations between 24.20 and 48.67. Also Mg
levels were determined between 30.80 and 40
mg/L (Table 3).
Sodium element was determined at the
highest level at station 9th in all seasons. It was
determined that according to Turkish
Regulations, as regards Na levels, in station 9th
was found to be fourth class in summer season
and in spring and winter to be third class quality.
According to Turkish Regulations [20], total
phosphorus levels, at stations 3rd, 6th, 7th and 8th in
all seasons, station 5th in summer season, and
station 9th in autumn and spring seasons were
found to be fourth class. On the Porsuk Dam
Lake, the determined average highest phosphorus
level was found to be at the station 4.5th in spring
season and the lowest level was found to be at
station 4.3th in summer season. Porsuk Dam Lake,
as for total phosphorus was found to be second
class quality in all seasons. The most important
resources of phosphorus in the fresh waters are
wastewaters and fertilizer. The extreme
increasing of phosphorus may lead to
eutrophication by accelerating vegetative
production [34].
At the Porsuk Stream’s stations the
determined potassium element was found to be
the highest at station 9th in spring, summer and
autumn seasons. At Porsuk Dam Lakes’ stations,
the stated average potassium element levels
showed a change between 4.80 mg/L and 5.07
mg/L all the year round.
According to BEBKA Environment
Condition Report 2011 [35], when Porsuk Stream
enters into Kütahya city, it is first class quality,
but after leaving the city it was stated that the
Stream water is first class quality in terms of
dissolved oxygen, BOD and COD levels while it
decreases fourth class quality in terms of
ammonia nitrogen. They added that when Porsuk
passed through Eskişehir city there was no

E. Köse et al. / Anadolu Univ. J.of Sci. and Tech. – C – Life Sci. and Biyotech. 4 (2) – 2016
91
discharge, but a bit after city center’s exit the
Porsuk Stream was under the pressure of
Eskişehir Organized Industrial Zone treated
wastewaters, some industrial establishment’s
purified wastewaters, wastewaters from
wastewater treatment plants of Eskişehir Water
and Sewerage Administration and animal
production, unpurified domestic and industrial
wastewaters before joining Sakarya River when it
passed through Alpu, Beylikova ve Yunusemre
towns.The results of this study are in parallels
with BEBKA Environment Report, (2011) [35].
According to factor analysis (FA) results
done by using measured water quality parameters
on the Porsuk Stream, three factors were
determined explaining % 71.83 of the total variant
(Table 4). Liu, et al. 2003 [36], classified factor
load as strong (< 0.75), moderate (middle) (0.75-
0.50) and weak (0.50-0.30). According to factor
analyzing results, in this study the first factor (F1)
% 33.78 of the total variant (Table 4). Because
Na, K, Mg and the total P parameters had a strong
positive load in factor 1. (F1), this factor was
named as nutrient factor (Table 5). In the second
factor explaining % 23.29 the total variant BOD,
salinity and nitrate nitrogen were strong positive
influential and as for phosphate, sulphate, and the
total chlorine were positive influential, this factor
was named as domestic and agricultural drainage
factor. The third factor explained % 14.76 of the
total variant, besides it had conductivity in F3 and
pH parameters had strong positive load and
dissolved oxygen was negative influential in this
factor (Table 5). Altın et al. (2009) [8],
determined a factor analysis by using certain
physicochemical parameters of Porsuk Stream
for ten years (1995-2005) on seasonal periods.
They reported that the Porsuk Stream was
exposed to organic, inorganic, mineral and
microbial pollution from domestic, industrial and
agricultural activities.
Cluster analysis can utilize for detect
similarity groups between the sampling stations
[8]. As a result of clustering analysis four
different clusters were specified in Porsuk Stream
(Figure 3). Stations 3rd, 6th, 7th and 8th were created
a cluster (cluster 2) (Figure 3). The water quality
of this stations is quite low and and they show a
high similarity to each other. The station 3rd is
located at the point where Kütahya’s industrial,
domestic and sewage flow into the Porsuk
Stream. While the Porsuk Stream passes through
Eskişehir city center, by taking the industrial
wastewaters and city’s sewage, it irrigates Alpu’s
and Beylikova’s lands and the remaining waters
joins into Sakarya River near Beyliköprü Bridge
[22, 37, 38]. Also, Porsuk Dam Lake stations
were formed a cluster and the first station (4.1th)
at entrance of Porsuk Dam Lake were found close
to cluster 2. According to clustering analysis
results, the station 9th is located in the lowest basin
of the Porsuk Stream and it is subjected to intense
pollution drainage, the found low similarity level
is an expected result.
5. CONCLUSIONS
Porsuk Stream provides drinking and utility water for two Turkish cities (Kutahya and Eskisehir) with a total population of one million. Carrying the pollution load of Eskişehir and Kütahya, the Porsuk Stream heavily affects the water quality of the Sakarya River, which one of the most important river of Turkey, and even the Black Sea. The rehabilitation of the Porsuk Stream’s pollution load and lowering its pollution rates to acceptable levels will play a useful role in the health of the Porsuk Stream’s Basin and the other related ecosystems.
Acknowledgement
This work was supported by TUBITAK
(Project No: 109Y394). All authors would like to
thank TUBITAK. This study was created from
Ph. D. Thesis of Esengül KÖSE.
6. REFERENCES
[1] Shrestha S, Kazama F. Assessment of surface
water quality using multivariate statistical
techniques: A case study of the Fuji river basin;
Japan. Environmental Modelling and Software
22:464–475, 2007. DOI:10.1016/j.envsoft.2006.02.
001
[2] Singh P K, Malik A, Sinha S. Water quality
assessment and apportionment of pollution
sources of Gomti river (India) using multivariate

E. Köse et al. / Anadolu Univ. J.of Sci. and Tech. – C – Life Sci. and Biyotech. 4 (2) – 2016
92
statistical techniques—a case study. Analytica
Chimica Acta. 538, 355–374, 2005. DOI:10.
1016/j.aca.2005.02.006
[3] Chen K, Jiao JJ, Huang J, Huang R. Multivariate
statistical evaluation of trace elements in
groundwater in a coastal area in Shenzhen, China.
Environmental Pollution 147: 771-780, 2007.
DOI:10.1016/j.envpol.2006.09. 002
[4] Kazi G, Arain K M, Jamali M K, Jalbani N,
Afridi I H., Sarfraz A R, Baig A J, Shah A Q.
Assessment of water quality of polluted lake using
multivariate statistical techniques: A case study.
Ecotoxicology and Environmental Safety 72: 301–
309, 2009. DOI:10.1016/j.ecoenv.2008.02.024
[5] Iscen F C, Altın A, Senoğlu B, Yavuz S H.
Evaluation of surface water quality characteristics
by using multivariate ststistical techniques: A
case study of the Euphrates river basin, Turkey.
Environ Monit Assess. 151: 259–264, 2009. DOI:
10.1007/s10661-008-0267-9
[6] Iscen F C, Emiroğlu Ö, Ilhan S, Arslan N,
Yılmaz V, Ahiska S. Application of multivariate
statistical techniques in the assessment of surface
water quality in Uluabat Lake, Turkey. Environ
Monit Assess, 144: 269–276, 2008. DOI:
10.1007/s10661-007-9989-3
[7] Ragno G, Luca De, M. and Ioele, G. An
application of cluster analysis and multivariate
classification methods to spring water monitoring
data. Microchemical Journal 87:119–127, 2007.
DOI:10.1016/j.microc.2007.06.003
[8] Altın A, Filiz Z, Iscen F C. Assesment of
seasonal variations of surface water quality
characteristics for Porsuk Stream. Environ Monit
Assess. 158:51–65, 2009. DOI:101007/s10661-
008-0564-3
[9] Jiang-Qi Q, Qing-Jing Z, Pan, L., Cheng-Xia,
J., Mu, Y. Assessment of water quality using
multivariate statistical methods: A case study of
an Urban Landscape Water, Beijing. International
Journal of Bioscience, Biochemistry and
Bioinformatics, 3(3):196-200, 2013. DOI:
10.7763/IJBBB.2013.V3.195
[10] EN ISO 10304: Water quality -- Determination
of dissolved anions by liquid chromatography of
ions -- Part 1: Determination of bromide, chloride,
fluoride, nitrate, nitrite, phosphate and sulfate.
[11] EN ISO 10304-2: Water Quality--
Determination of dissolved anions by liquid
chromotography of ions.-- Determination of sulfate.
[12] EN ISO 2677. Water Quality--
Determination of Dissolved anions by liquid
chromatography of ions-- Determination of
Nitrite.
[13] DIN 38409 H41-H44. German standard
methods for the examination of water, waste water
and sludge; anions (group H); determination of
chemical oxygen demand (H41-H44)
[14] U.S. EPA (2001) EPA method 200.7.
Determination of Metals and Trace Elements in
Water and Wastes by Inductively Coupled
Plasma-Atomic Emission Spectrometry.
[15] Simeonov V, Stratis J A, Samara C,
Zachariadis G, Voutsa D, Anthemidis, A., Sofoniou,
M. & Kouimtzis, Th. Assessment of the surface
water quality in Northern Greece. Water Research,
37:4119 – 4124, 2003. DOI:10.1016/S0043-
1354(03)00398-1
[16] Yang YH, Zhou F, Guo HC, Sheng H, Liu H,
Dao X., He CJ. Analysis of spatial and temporal
water pollution patterns in Lake Dianchi using
multivariate statistical methods. Environ Monit
Assess. 170 (1-4):407-16, 2010. DOI: 10.1007/
s10661-009-1242-9.
[17] Satheeshkumar P, Senthilkumar D.
Identification of Heavy Metals Contamination by
Multivariate Statistical Analysis Methods in
Pondicherry mangroves, India. Journal of
Environment and Earth Science. 1 (1):30-48, 2011.
ISSN 2224-3216 (Paper) ISSN 2225-0948 (Online)
[18] Tokatlı C, Çiçek A, Emiroğlu Ö, Arslan N,
Köse E, Dayıoğlu H., Statistical Approaches To
Evaluate The Aquatic Ecosystem Qualities of A
Significant Mining Area: Emet Stream Basin
E. Köse et al. / Anadolu Univ. J.of Sci. and Tech. – C – Life Sci. and Biyotech. 4 (2) – 2016
93
(Turkey). Environmental Earth Sciences, 71 (5):
2185-2197, 2014.
[19] EC Directive 2006. DIRECTIVE
2006/44/EC OF THE EUROPEAN
PARLIAMENT AND OF THE COUNCIL of 6
September 2006 on the quality of fresh waters
needing protection or improvement in order to
support fish life (codified version)
[20] Turkish Regulations, 2012. Sutface Wtare
Quality Management Regulation. The official
journal, No:28483, http://suyonetimiormansu.gov. tr.
[21] Özyurt S. M, Dayıoğlu H, Bingöl N, Yamık
A. Porsuk Baraj Havzası’nın Kütahya Kökenli
Kirlilik Problemi. Dumlupınar Üniversitesi Fen
Bilimleri Enstitüsü Dergisi. 6:43-52, 2004.
[22] Orak E. Porsuk Çayı’nın Su Kalitesinin
Bulanık Mantık Metodu İle Değerlendirilmesi.
T.C. Gebze İleri teknoloji Enstitüsü Mühendislik
ve Fen Bilimleri Enstitüsü, Çevre Mühendisliği
Yüksek Lisans Tezi 37, 2006.
[23] Eskişehir Valiliği İl Çevre ve Orman
Müdürlüğü, Eskişehir City Environment
Situation Report, 2008.
[24] Karpuzcu M. Çevre Kirlenmesi ve Kontrolü,
381, 2007.
[25] Kalyoncu H, Yorulmaz B, Barlas M,
Yıldırım M Z, Zeybek M. Aksu Çayı’nın Su
Kalitesi ve Fizikokimyasal Parametrelerinin
Makroomurgasız Çeşitliliği Üzerine etkisi. Fırat
Ünv. Fen ve Müh. Bil. Dergisi 20 (1):23-33, 2008.
[26] Uyanık S, Yılmaz G, Yesilnacar M I, Aslan
M, Demir Ö. Rapid Assesment of River Water
Quality in Turkey using Benthic
Macroinvertebrates, Fresenius Environmental
Bulletin 14 (4):268–272, 2005.
[27]Yılmaz F, Alaş A, Solak K. Lymnological
Features of Porsuk Dam Lake and its Effects on
Growth of Fish. Fish International Symposium on
Fisheries and Ecology Proceedings
(FISHECO’98), Trabzon, 1998.
[28] Burak S, Duranyıldız İ. ve Yetiş Ü. Su
Kaynakları Yönetimi, Devlet Su İşleri, Ulusal
Çevre Eylem Planı, 1997.
[29] Bakış R, Koyuncu H, Özkan A, Banar M,
Yılmaz, G., Yörükoğulları, E. Porsuk Havzası
Yüzeysel ve Yer altı Suyu Kirlilik Düzeyinin
Araştırılması. Anadolu Üniversitesi Bilim ve
Teknoloji Dergisi-A.Uygulamalalı Bilimler ve
Mühendislik , 12 (2):75-89, 2011.
[30] Egemen Ö, Sunlu U. Su Kalitesi, Ege
University Publishing, İzmir, 1996.
[31] Taş B. Derbent Baraj Gölü (Samsun) Su
Kalitesinin İncelenmesi. Ekoloji. 15:61: 6-15 2006.
[32] Tepe Y, Alparslan A, Mutlu E. and Töre Y.
Karagöl’ün (Erzin-Hatay) Bazı Fiziko-Kimyasal
Özellikleri. E.Ü. Su Ürünleri Dergisi 23:155-161,
2006.
[33] Kara C, Çömlekçioğlu U. Karaçay
(Kahramanmaraş)’ın Kirliliğinin Biyolojik ve
Fiziko-Kimyasal Parametrelerle İncelenmesi.
KSÜ Fen ve Mühendislik Dergisi 7 (1): 1-7, 2004.
[34] Cirik S. ve Cirik Ş. LİMNOLOJİ- Ege
University Publishing, İzmir, 2008.
[35] BEBKA Bursa, Eskişehir Bilecik
Development Ageny, TR 41 Bölgesi Çevre
Durum Raporu, 2011.
[36] Liu C W, Lin, K H, Kuo Y M. Application of
factor analysis in the assessment of groundwater
quality in a Blackfoot disease area in Taiwan.
Science of the Total Environment, 313, 77–89,
2003. DOİ:10.1016/S0048-9697(02)00683-6
[37] Yücel E, Doğan F, Öztürk M. Porsuk
Çayı’nda Ağır Metal Kirlilik Düzeyleri ve Halk
Sağlığı İlişkisi, Ekoloji Dergisi, 17:29-32, 1995.
[38] Canbek M, Demir T A, Uyanoğlu M,
Bayramoğlu G, Emiroğlu Ö, Arslan N, Koyuncu
O. Preliminary assessment of heavy metals in
water ve some Cyprinidae species from the
Porsuk River, Turkey. Journal of Applied
Biological Sciences, 1(3): 91-95, 2007.