1% aims improving construction productivity. november 30th 2015
TRANSCRIPT
1
1% AIMS: A system to improve construction productivity, introduce project controls and assist the keeping of contemporaneous records.
Kieran Butler CEng, MAI, MBA, MCIArb. Dr. Roger West (Trinity College Dublin)
Abstract From recent publications, it is apparent that, compared to industries such as automotive and electronics, productivity levels in the construction sector have remained static or have decreased in the years since 1964. Productivity improvements in construction projects would yield substantial savings in time and cost for all in the supply chain. This research considers good practice in construction project management and examines aspects of lean thinking to improve the process. It uses case data collected from recent projects, comparing them to those completed over the last seven years, to demonstrate the effectiveness of a process developed during the time period in which the research was carried out. The process, which has been called “The 1% AIMS Program”, utilises constraint analysis and short term planning at the task level, Earned Value Analysis at the project management level and a communication interface between the task level and the project level, which is where key data is shared amongst front line management and the senior management team. It is demonstrated that this lean construction process appears to improve construction labour productivity significantly. Keywords Labour productivity, Lean concepts, Lean construction, Earned Value Management,
Short term scheduling, Constraints analysis, Project controls, Contemporaneous records, Planning, Construction Project Management.
Introduction In the construction industry, part of the financial health of a company is affected by the productivity of the direct labour force it employs on projects. It is significant that many of what used to be the largest employers in the construction industry, that is, the large general contractors, no longer employ many people at craft level. The risk involved in having a direct, skilled work force is high, particularly for specialist contractors (such as mechanical and electrical contractors) yet they need to keep a core workforce to guarantee the quality of service they offer to customers. This would be considered a core competency for any company competing in this sector, the reason being that they need to ensure that they retain enough skilled workers in-house so that they maintain a capacity to respond to their clients’ needs. To understand the nature of construction, one must also consider who the eventual end user of the product will be. The building owner and the people on the design and construction teams are involved in decisions from concept to final commissioning of a building with all the intricate processes that are housed within the unique building envelope. This interaction increases the complexities of the process.

2
LePatner (2008) quoted a leading Israeli/Canadian architect, Moshe Safdie, on the fragmented nature of the processes within the construction industry: “Imagine an automobile assembly line where each step along the line is undertaken by a different company with its own financial interest and separate labour union. Present construction practice is impossible. The client asks an architect to design something specifically for him. In making drawings the architect will specify various components out of catalogues. He is nearly always restricted to elements that are already manufactured. Then the contractor, who usually, had nothing to do with the design process, examines the drawings and makes his bid. Industry supplies raw materials and components and has little contact with the contractor. The various building material manufacturers make their components totally independently of each other…It is an absurd industry.” Womack et al. (1991) noted that lean production is still highly dependent on gross output volumes. Winch (2003) agrees and outlined, that in lean manufacturing, initiated by Toyota set up times for individual components were reduced to minutes so that the same line could produce more than one product, and could respond rapidly to shifts in the market for particular products. Since these are the fundamental features of the lean production concept, construction needs to be reviewed in this light.
The adoption of lean thinking by the construction industry? Ballard and Howell (1994) suggested that improvements in performance in construction could mirror the improvements in the motor industry and promote improved productivity, shorter project duration because of accelerated activities, and an increased amount of work being completed in a given time because of improvements in the flow of the work through the system. It must be borne in mind that in order to get works flowing better in a construction project one has to make information, materials and access to the work flow much more freely and this has to be done through the improved planning of the activities. Lean thinking in the UK in relation to the construction industry changed significantly following publication of the Egan Report in 1998 (Egan 1998). Ten years after its publication, Sir John Egan, in a speech at a Commons reception stated, “I’m delighted that at least people are measuring performance, because when I got involved to start with, people weren’t even measuring it, so they didn’t even know if they were getting worse or they were getting better.................... Projects are taking something like 40% less time..................... Also the productivity year-on-year showed an almost 80 per cent improvement. ” (Egan 2008). Both Winch (2003) and Bertelsen and Koskela (2004) state that construction is undertaken through cooperation within an ad hoc temporary organisation which includes the client. Construction needs to be managed via the tool of project management in which a more collaborative method of management is required for managing construction projects however to make it more collaborative, requires a greater effort than is currently being employed across all sectors of the industry. Lichtig (2005) outlined how the Sutter Health Care group in California came up with a contract framework that would support the introduction of lean construction, collaboration and risk sharing with the goal of reducing overall risk in the project. Construction activities associated with this project were managed using a process called Integrated Project Delivery (IPD). IPD is a way to organise project teams to achieve lean construction by modifying

3
traditional building methods and optimise the entire project, not just each piece individually, through a highly collaborative relationship between the owner, architect and general contractor. The parties sign an integrated contract and are part of the risk pool that shares responsibility for cost containment, with built-in incentives to be shared by the IPD team members for completing work on schedule and under budget. Much of what has been written in the field of lean construction is about the Last Planner System (LPS)(Ballard and Howell 2003) and this is another example of improved collaborative behaviour. This is the single tool in the lean construction arena, which, once understood, can be used almost immediately on any project and will help achieve improvements in schedule. It is a lean construction technique that focuses primarily on workflow. The LPS is similar to the traditional form of Short Term Planning (STP) (HVCA 1977) that has always existed in the construction industry by means of the site foreman doing a short term schedule on the site. The foreman has always been the last planner as he is the person who has the most visibility of what is happening on the project in the short term. However, the LPS technique is more sophisticated and more scientific than what the foreman has traditionally undertaken. It attempts to achieve work flow control and production unit control. Work flow control is accomplished through the look-ahead process, while production unit control is accomplished primarily through weekly work planning. In order for the LPS to be successful, it must be applied in a collaborative environment and it must be accepted by all members of the project team. If the construction project team has not been formed into a collaborative group, then these lean tools cannot be used without modification for non-collaborative working.
Earned Value Analysis / Earned Value Management Whether a project is managed in a collaborative or non-collaborative environment, Earned Value (EV) is a key element of a methodology for monitoring the performance of projects (Project Management Institute 2005). In project management, value is earned as activities are completed and, consequently, EV is also a measure of progress, where there is a direct relationship between EV and the percentage of a project completed. De Marco and Narbaev (2013) state that EV practice has been largely experienced in defence, energy, and software development projects. The construction industry still lags behind other industries in implementing EV and has difficulties in adequately adapting the approach that can help project managers to undertake more objective actions and effective control. They should be using integrated information to predict future performance thereby minimising uncertainty. Fleming and Koppelman (2010) state that EV provides the project manager with a type of “early warning” that activates when faced with impending problems, allowing timely and necessary corrective actions to be taken. Such warning signals become available to management as early as 20 per cent into the project, allowing ample time to take corrective measures to prevent unfavourable outcomes. If a way is found to simplify the earned value concept then it could be adopted as a broad-based project management tool for universal application in all industries. Willems and Vanhoucke (2015) state that some of the impediments to using EV are data collection and performance measurement, in the execution phase of any project, relevant data
4
needs to be collected in order to assess current performance. When unexpected events occur during the execution stage of a project, recovering from the disruptions and delays do not go without effort and expectations on future performance can be unrealistic and arbitrary. EV assumes that past data on the current project is the most reliable information, but if there had been disruption then may not be the case and, an outside view, comprising of more subjective data, such as expert opinion, could be incorporated. This expert view could be employed within the organisation that is involved on the project, however, in this situation the outside perspective comes from the expert having much experience, but not having an active role within the project. To set up the EV system one needs to establish what is known as the Work Breakdown Structure (WBS), this is done by dividing the project into manageable portions, allocating the costs to each WBS and then allowing a schedule be put together which will represent the entire project. The WBS will be the roadmap for analysing the project’s progress and performance. To tie Earned Value Management (EVM) into the concept of lean construction, particularly in the area of workforce productivity, the WBS structure should refer to the direct labour that is budgeted and the time line for the duration of the project. For example, if one is monitoring the contract as a Mechanical Contractor, one might have one WBS to represent the activities of the direct labour force and another to represent the activities of the ductwork sub-contractor, etc. The relevant variances are cost variance (CV) and schedule variance (SV). Data collected for analysis can be divided into three categories: Actual Costs (AC), Earned Value (EV), and Planned Value (PV), usually in monetary terms or labour hours. Where variances give a precise monetary value of a project actual status, indices do not, but are used as indicators of actual performance (De Marco and Narbaev 2013). The indices that are useful are Cost Performance Index (CPI = EV/AC) indicating how efficiently a project team is using its resources, and the Schedule Performance Index (SPI = EV/PV) indicating how efficiently the team is using its time. For these indices, 1.00 indicates that performance is on target; more than 1.00 indicates improved performance, and less than 1.00 indicates inefficient performance. Overall, both the variances and indices are measures of past behaviour and, if no corrective actions are undertaken, are used to predict the project final cost and time. The CPI thus represents the project manager’s “early warning signal” and is perhaps the most compelling reason why any project should employ some form of earned value analysis. No other project management technique provides these metrics. In regard to SPI Fleming and Koppelman (2010) state that both the earned value SPI and Critical Path Method (CPM) indicators when used in concert will accurately assess the true schedule position of any project. Even though the SPI may have little (or no) relationship to the project’s critical path, falling behind in accomplishing the work scheduled is one of the first indicators of potential future problems. In practice, rather than using the CPI or the SPI, one can use the Spent to Earned (S/E) ratio for reporting at project and at site level. It can be determined in currency format or it can be determined by using hours. This metric is probably more readily understood at site level than either CPI or SPI. Therefore, intuitively, linking a good project control system to the benefits of the lean concept would be a good strategy for any construction company to adopt if they want to
5
achieve productivity gains. There are aspects of lean thinking and the continuous flow process that, if adapted to suit construction practices, could bring real benefits in terms of increased productivity as shall be demonstrated by this paper.
How non-collaborative construction works Usually a contractor’s / sub-contractor’s first point of contact on a project is by way of a tender process. In the preparation of the tender bid the contractor assumes that the people upstream (that is the design team) in the construction process have or will provide the contractor with all the necessary information (such as drawings and specifications) required to start the project and have a continuous uninterrupted flow during the life time of the project. This means that the contractor has assumed in the tender bid that the following conditions apply: There is timely complete information from the client’s designers. There will be no hold up to work as a result of late input of information There is no restriction of access to the work. There is no restriction to the flow of materials. In essence the contractor assumes that there will be no constraints when work packages commence; in fact it is assumed that progress will be 100% efficient and there will be no allowance for inefficiencies in the planning or execution. However, this is seldom, if ever, the situation as there will always be constraints and they will often be as a result of a process failure somewhere in the supply chain. Should this happen in a machine-paced-line-flow process in manufacturing, the process would be stopped. However, what happens in the construction process is the process is not stopped and inefficiencies result. Current practice within the building construction sector is that the process is driven by a General Contractor (GC) or in some cases a Project Manager (PM) appointed directly by the client. Many GCs do not employ craft labour on a direct basis; hence much of the labour is engaged by sub-contract or sub-sub-contract. On many construction projects, activities do not always go to plan for many reasons, such as information or materials not being available at the correct time. When this occurs, often the construction parties no longer act as a team and it quickly becomes a scenario in which each sub-contractor protects their own interest. Activities happen out of sequence, people become more confrontational, as a result of which the project may suffer. As a consequence, of out-of-sequence work, more waste arises in the system and time and money are lost. It is incumbent on a contractor who wants to use lean concepts to become more productive, to understand the lean concept philosophy and the use of the lean concept tools. The distinction between working collaboratively and working on an individual basis is demonstrated by the emphasis on who benefits from the savings from the improved productivity. In a collaborative environment, it is the team that benefits from the collaboration while on an individual basis it is the individual contractor / sub-contractor that gets the immediate benefit. If a contractor is operating on a non-collaborative basis then the contractor’s organisation is likely to be the only organisation benefiting from the lean concept employed on its activities. As the contractor becomes the main beneficiary of its lean production system, then this
6
benefit, realised through savings and increased productivity, has to be the greatest motivational factor for any contractor when implementing lean thinking.
The consequences of poor control and project planning The benefits of an effective STP regime can best be demonstrated by the use of a case study of an actual project. The case study chosen demonstrates what happened on a medium-sized mechanical process-piping project during the early part of 2014. The amount of work to be undertaken was in the order of 17,000 man hours and the project duration was to be 5 months. The project was priced from drawings and information provided by the client, but a lot of the detail for the project was to be determined from site. Figure 1 presents an Earned Value Analysis (EVA) diagram, as it evolved on this project during its time line. The Group Productivity Manager (GPM) (who provides the expert view and is not involved in the project) used EVA, at the end of February 2014, to demonstrate what the likely outcome of the project was going to be to the contract manager. The contract manager was not using any tool or technique which would predict the likely outcome of the project based on the course of action in which he was engaged in. By using the EVA technique the GPM was able to assess the potential financial risk. The analysis carried out is outlined in the following paragraphs. The light blue line in Figure 1, showing the planned value (PV), represents the base line of how much work (expressed in monetary value) would be earned by the contractor if he was on target at any time during the project. The pink line represents the actual amount of work completed or the earned value (EV) of the work done, while the yellow line is the actual cost (AC) of the contractor’s labour. The navy blue line is what the contractor will receive for doing the work at the end of the project. Analysing the diagram one can see that the contractor is behind schedule from an early stage, represented by the difference in value between the pink graph and the light blue graph. If the contractor was monitoring the cost of the project (yellow graph) and compared it to the amount that was earned (pink graph), it would have been observed that, during the early phase of the project, there was not too much difference between what was being earned and what was being spent. However, the contractor (for whatever reasons) had fallen behind in schedule terms, and yet he was still required to complete the work by the due date. This can be seen by the sharp rise in the slope and subsequent value of the yellow graph as time progressed. This meant that the contractor had to engage more manpower on the project and, as a result, over spent and lost money (as may be observed by the much higher value that the yellow graph has when compared to the navy blue graph at completion). The yellow graph indicates that the cost of the labour at the end of the project was approximately €850,000 whilst the contractor received in the order of €650,000 for the project. What is illustrated in Figure 1 is typical of what can happen in construction projects and is also not often foreseen because earned value analysis is not undertaken during construction. There may be many reasons for the contractor falling behind in the schedule and unless the contractor has a control system in place for capturing the contemporaneous performance, then the contractor is likely to be in a weak position to recover the extra money spent on the project from the Client, assuming the causes of the delays could not reasonably have been foreseen by the contractor.

7
Figure 1 EVA of a project under performing and losing money case no. 1 As part of the analysis, it is necessary to examine the Spent to Earned (S/E) ratio, which is the ratio of how much the contractor was spending on labour compared to the value that had been earned in the same period of time. If the value of the ratio is less than 1.0, then the activity is making money but if it is greater than 1.0 the activity is losing money. Had the contract manager been monitoring the spent to earned ratio of the labour force, it would have been observed that the project, from a financial point of view, was unlikely to recover all the money that was being spent on the labour force. The graphical representation of the cumulative S/E graph, shown in blue in Figure 2, indicates that from early on there were indications that the contractor would lose money. Had an investigation taken place early on in the time line, the reason for over-spend on labour may have been discovered and as a result a mechanism to recover some monies may have provided a better outcome for the contractor. The green graph in Figure 2 is the cumulative earned work which shows the actual progress of the project. The red graph indicates the production rate that was earned on a weekly basis and gives a good indication of when the project was at its peak in terms of labour on the job. The blue graph indicates that this particular project was not in control at any point during the life time of the project. For example, when the project was 10% complete, the S/E ratio was 1.5 indicating that the project was costing €1.5 for every €1 earned. Rather than doing something to reduce this S/E, it appears that the lack of productivity was maintained for a period of 4 weeks or in effect 20% to 25% of the overall time line of the project. There had to be an underlying problem for the S/E to be this high. No effort was made to determine the cause of the problem and resolve it because, in the absence of the EVA data, the contract manager was not aware of the problem. The average S/E on this project is 1.3, and if this inefficiency were repeated on other projects, the contractor would soon most likely be in serious financial trouble. Lean thinking combined with a good control system that captures the metrics which are communicated to the operatives, is an effective method for introducing and maintaining a lean working environment and hence bring gains in productivity should bring gains in
€0€100,000€200,000€300,000€400,000€500,000€600,000€700,000€800,000€900,000
Value
€
PeriodBudget at Completion (BAC)(Calculated) Earned Value (EV) (calculated)Actual Cost (AC) (Calculated) Planned Value (PV)

8
financial performance. This simple case study indicates what happens in reality when an inadequate control system is coupled with a non-lean production method.
Figure 2 Graphical analyses of S/E value and Production performance case no. 1
The 1% AIMS Programme A system has been developed to achieve better productivity performance by combining and implementing particular aspects of lean thinking with EVA. The components of this system are
(i) A constraints analysis at the task level coupled to (ii) Short Term Planning at the task level, with (iii) Earned Value Analysis at the project management level, and (iv) A communication interface between the task and the project levels, which is
where key data is shared. The combination of a good scheduling regime, a good contract control system and good communication with the front line management will be shown to deliver sustainable productivity gains. This communication and sharing of information can be achieved by weekly or fortnightly meetings between the project team and an appointed senior manager in the company whose prime responsibility is the improvement of productivity. This senior manager should not have line responsibility and should only report to the owners/board of the
1.11 1.11 1.11 1.191.09
1.51 1.49 1.471.59
1.431.32
1.23 1.171.27 1.33 1.37 1.38 1.37 1.381.32
2.0% 2.0% 2.0% 1.5% 2.5% 2.2% 1.9% 2.1% 2.3% 7.5% 8.0% 10.0% 10.0% 12.0% 12.0% 12.0%3.0% 3.0% 2.0%1.0%2.0% 4.0% 6.0% 7.5% 10.0% 12.2% 14.1% 16.2% 18.5%
26.0%34.0%
44.0%54.0%
66.0%78.0%
90.0% 93.0% 96.0% 98.0%99.0%
0.000.200.400.600.801.001.201.401.601.80
5-Jan-2014 5-Feb-2014 5-Mar-2014 5-Apr-2014 5-May-2014Cumulative S/E Ratio (calculated) % Comp this period (calculated) Cumulative % Earned
S/EValue&%Complete

9
company in order to guarantee objectivity and authority. This senior manager is known as the Group Productivity Manager (GPM), in the organisation in which the research was conducted. Consistency is important if one is attempting to change how people behave. The effect of having weekly meetings brings a consistency to the process that does not appear to exist when productivity management is left solely to the project team. On a construction project there are many distractions for a project team and the team will tend to be reactive. As there can be a tendency to postpone the weekly productivity meeting that is cancelled, if the meeting is with an authoritative figure from head office, it is given high priority and this consistency then, over the course of the project, assists in changing the behaviour of the team members. This is reinforced when success is evident, through measurement, as a result of using the system. Furthermore it is vital to communicate to the other members of the project team (the GC and or the PM) the possible project outcomes if changes in the performance of team members are not made; this is similar to an early warning system, which can help to reduce the level of conflict and confrontation that otherwise might arise if a sub-contractor falls behind in schedule terms. In all construction projects there is a hierarchy of schedules in the planning. The STP should be derived from a six week look-ahead schedule that is extracted from the main co-ordinated construction schedule, which is developed by the GC with input from all other sub-contractors involved on the project. These key dates in the schedule, shown as mile stones, should refer to when relevant information, such as when Issued for Construction (IFC) drawings, were issued. These IFC drawings will contain the necessary information for the contractor or sub-contractor to commence an element of the construction of the project. The main schedules will also contain the necessary dates when access will be available to commence certain aspects of the. Finally, with regard to the main schedule, all contractors and sub-contractors use this document for preparing their procurement schedule for the materials to be purchased for the project. Usually contractors and sub-contractors work backwards from these dates to determine the order date, which is particularly important for large items of plant or those with long lead-in times. This applies to both the six week look-ahead schedules and, subsequently the short term schedule. The STP is updated on a weekly basis by the supervisory team in conjunction with the project manager and the duration of the STP is two weeks. The activities on the six-week look-ahead schedule that are indicated to be started or completed during the STP undergo a constraints analysis by the relevant site/area supervisor. As the supervisors are only looking at a week or, at a maximum, two weeks ahead, the visibility of what might happen on the site in that short time frame should be very clear. Hence, if tasks are liable to be constrained by information requirements, access issues or material shortages, in the short term, they are held in a quarantine state until action is taken to free up the constraint that is preventing the task from being undertaken. Only work that appears to be constraint free should be used as an activity on the STP. The STP has three categories of work that are eligible for inclusion on the plan; Level (A): Work/tasks that must be done and/or are on the critical path list; Level (B): Work/tasks that are scheduled for the current week and the following week and are constraint free,
10
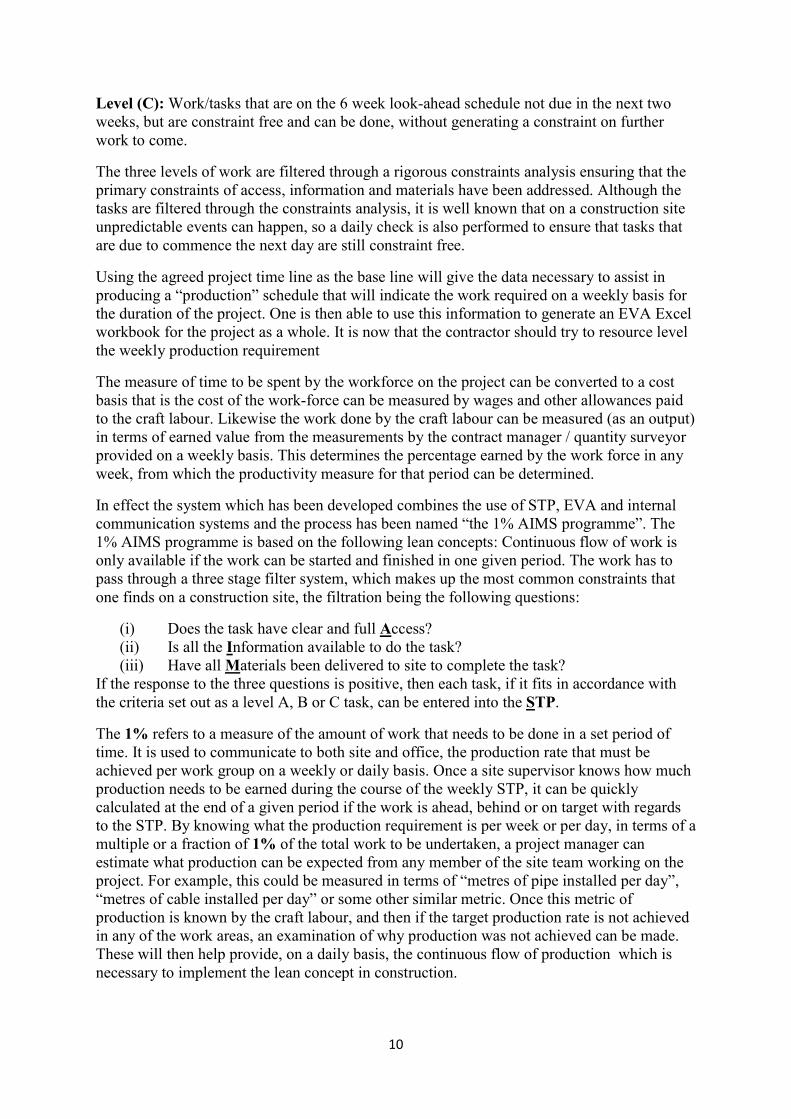
Level (C): Work/tasks that are on the 6 week look-ahead schedule not due in the next two weeks, but are constraint free and can be done, without generating a constraint on further work to come. The three levels of work are filtered through a rigorous constraints analysis ensuring that the primary constraints of access, information and materials have been addressed. Although the tasks are filtered through the constraints analysis, it is well known that on a construction site unpredictable events can happen, so a daily check is also performed to ensure that tasks that are due to commence the next day are still constraint free. Using the agreed project time line as the base line will give the data necessary to assist in producing a “production” schedule that will indicate the work required on a weekly basis for the duration of the project. One is then able to use this information to generate an EVA Excel workbook for the project as a whole. It is now that the contractor should try to resource level the weekly production requirement The measure of time to be spent by the workforce on the project can be converted to a cost basis that is the cost of the work-force can be measured by wages and other allowances paid to the craft labour. Likewise the work done by the craft labour can be measured (as an output) in terms of earned value from the measurements by the contract manager / quantity surveyor provided on a weekly basis. This determines the percentage earned by the work force in any week, from which the productivity measure for that period can be determined. In effect the system which has been developed combines the use of STP, EVA and internal communication systems and the process has been named “the 1% AIMS programme”. The 1% AIMS programme is based on the following lean concepts: Continuous flow of work is only available if the work can be started and finished in one given period. The work has to pass through a three stage filter system, which makes up the most common constraints that one finds on a construction site, the filtration being the following questions:
(i) Does the task have clear and full Access? (ii) Is all the Information available to do the task? (iii) Have all Materials been delivered to site to complete the task?
If the response to the three questions is positive, then each task, if it fits in accordance with the criteria set out as a level A, B or C task, can be entered into the STP. The 1% refers to a measure of the amount of work that needs to be done in a set period of time. It is used to communicate to both site and office, the production rate that must be achieved per work group on a weekly or daily basis. Once a site supervisor knows how much production needs to be earned during the course of the weekly STP, it can be quickly calculated at the end of a given period if the work is ahead, behind or on target with regards to the STP. By knowing what the production requirement is per week or per day, in terms of a multiple or a fraction of 1% of the total work to be undertaken, a project manager can estimate what production can be expected from any member of the site team working on the project. For example, this could be measured in terms of “metres of pipe installed per day”, “metres of cable installed per day” or some other similar metric. Once this metric of production is known by the craft labour, and then if the target production rate is not achieved in any of the work areas, an examination of why production was not achieved can be made. These will then help provide, on a daily basis, the continuous flow of production which is necessary to implement the lean concept in construction.

11
As well as communicating the production requirements to the supervisory level, the cost of completing 1% of the project is discussed, because this metric is used as part of a Statistical Process Control (SPC) system that is part of the 1% AIMS programme Three metrics are used when discussing the 1% cost; the actual cost of completing 1% (despite what the production might be during the week) on a weekly basis; the cumulative cost of completing 1% on a weekly basis; and, finally, what the cost of 1% would be on a weekly basis if one was working at 100% efficiency. The reason for doing this is similar to the reason for outlining the production rate in terms of 1%, that is, to reduce a large value labour project into a much smaller number that would have much more relevance, to a supervisor, in understanding what might be required on a weekly basis. For example, if the total labour value was €2 million and the project was of 20 weeks duration, then the average production required per week is 5% or 1% on a daily basis, that is, €20,000 worth of value needs to be generated by the work force on any average day. The 1% of the programme is also used in the EVA Excel workbook and is monitored graphically so that it is shared with the supervisory group on a weekly basis. Some of the graphs that are produced within the EVA workbook are prominently displayed for all members of the team to see. This display in turn, adds to the motivation and helps the crews in achieving the objective of the “1% AIMS Programme”, that is, to strive for the target of 100% labour productivity. Combined with the rigorous constraints analysis and the Levels A, B, and C of work assignment, “1% AIMS Programme” should ensure that the categories of waste and semi-productive work are minimised, hence productive work should be incurred by the crews on the site. As well as the above metrics, the crew is also informed of the Spent to Earned (S/E) ratio of the labour force.
The Benefits of 1% AIMS and EVA It was demonstrated previously that the consequences of poor control and poor project planning were that the project under examination lost money, as shown by Figures 1 and 2 with the S/E ratio greater than 1.0. A further real case study will demonstrate what happens on a project where there has been good control and proper project planning. In Figure 3 the EVA analysis of the installation of the mechanical services on a hospital project from the period 2009 to 2011 is illustrated. The man-hours spent on this project were in the order of 95,000. As can be seen in the graphs the contractor spent less than was earned (the yellow graph having a lower value than the pink graph at the end of the project), thereby making a margin on the project. It also shows that the contractor completed more work than the original value of the contract (the navy blue line indicates that extra value was added during the contract, which would have been extras and variations) and still completed the contract on the scheduled finish date. It should be remembered that value in this case is for the contractor and not for the client. It is worthwhile noting that the contractor was spending more than was being earned during the early part of the project. Figure 4 illustrates the reduction of the S/E over time on the same project and it also indicates the percentage earned on a two-weekly basis (in red) as well as the cumulative percentage complete (in green) of the project time line.

12
Figure 3 EVA of a performing project case no. 2
Figure 4 S/E performances over the duration of project for case no.2 This project was completed prior to the development of the “1% AIMS programme”, however, it was being reported on by the GPM and at this time the key metric was the S/E ratio. The S/E reporting is a good visual example of how well a project is performing and
€0€250,000€500,000€750,000
€1,000,000€1,250,000€1,500,000€1,750,000€2,000,000€2,250,000€2,500,000€2,750,000
€
Budget at Completion (BAC)(Calculated) Earned Value (EV) (calculated)
Actual Cost (AC) (Calculated) Planned Value (PV)
0.0%10.0%20.0%30.0%40.0%50.0%60.0%70.0%80.0%90.0%100.0%
0.00
0.50
1.00
1.50
2.00
2.50
3.00
3.50
Cumulative S/E Ratio (calculated) % Comp this period (calculated)Cumulative % Earned
S/E
%Complete
13
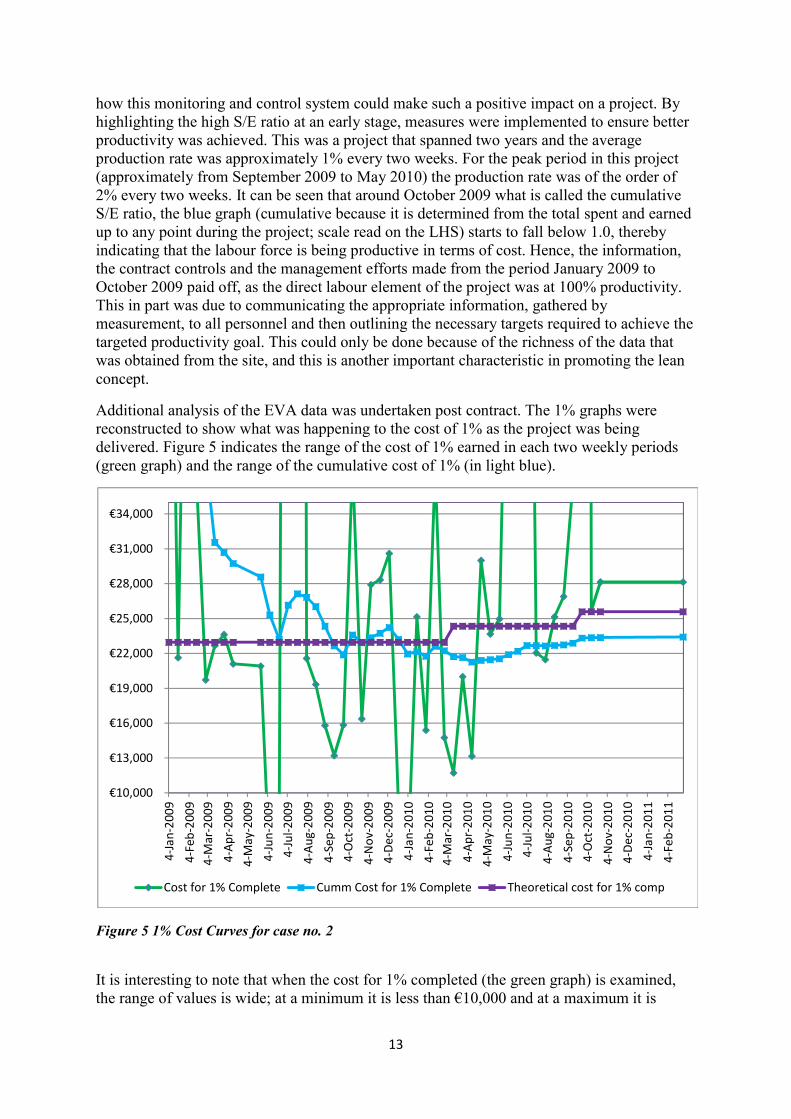
how this monitoring and control system could make such a positive impact on a project. By highlighting the high S/E ratio at an early stage, measures were implemented to ensure better productivity was achieved. This was a project that spanned two years and the average production rate was approximately 1% every two weeks. For the peak period in this project (approximately from September 2009 to May 2010) the production rate was of the order of 2% every two weeks. It can be seen that around October 2009 what is called the cumulative S/E ratio, the blue graph (cumulative because it is determined from the total spent and earned up to any point during the project; scale read on the LHS) starts to fall below 1.0, thereby indicating that the labour force is being productive in terms of cost. Hence, the information, the contract controls and the management efforts made from the period January 2009 to October 2009 paid off, as the direct labour element of the project was at 100% productivity. This in part was due to communicating the appropriate information, gathered by measurement, to all personnel and then outlining the necessary targets required to achieve the targeted productivity goal. This could only be done because of the richness of the data that was obtained from the site, and this is another important characteristic in promoting the lean concept. Additional analysis of the EVA data was undertaken post contract. The 1% graphs were reconstructed to show what was happening to the cost of 1% as the project was being delivered. Figure 5 indicates the range of the cost of 1% earned in each two weekly periods (green graph) and the range of the cumulative cost of 1% (in light blue).
Figure 5 1% Cost Curves for case no. 2 It is interesting to note that when the cost for 1% completed (the green graph) is examined, the range of values is wide; at a minimum it is less than €10,000 and at a maximum it is
€10,000 €13,000 €16,000 €19,000 €22,000 €25,000 €28,000 €31,000 €34,000
4-Jan-2
0094-F
eb-200
94-M
ar-2009
4-Apr-2
0094-M
ay-2009
4-Jun-2
0094-Ju
l-2009
4-Aug-
2009
4-Sep-
2009
4-Oct-2
0094-N
ov-200
94-D
ec-2009
4-Jan-2
0104-F
eb-201
04-M
ar-2010
4-Apr-2
0104-M
ay-2010
4-Jun-2
0104-Ju
l-2010
4-Aug-
2010
4-Sep-
2010
4-Oct-2
0104-N
ov-201
04-D
ec-2010
4-Jan-2
0114-F
eb-201
1
Cost for 1% Complete Cumm Cost for 1% Complete Theoretical cost for 1% comp

14
greater than €34,000. This indicates that the amount of production being declared complete every two weeks were not accurate. On this project there was no actual measure being performed every week, the amount being declared as completed was obtained from the construction manager and the contract manager, they decided on the percentage complete at any particular time. Over time, as can be seen from the cumulative cost for 1% (light blue,) the inaccuracy of the reporting did average out. However, had the cost of 1% been analysed at the time the project was live then, as part of the statistical project control that the 1% AIMS programme brings, the reasons for the wide range of values in the green graph would have been investigated and it is likely that the project may have reached 100% productivity sooner. To demonstrate the benefit of closer monitoring another project on which 1% AIMS was used in full will show the benefits of the system. A contemporaneous project was won by competitive tender in the early part of 2014; it was an industrial installation and was administered under a domestic sub-contract to a main building contractor. The principles of the 1% AIMS programme were applied to this project. The project was less complicated in nature than that of the previous project, thus site visits were made on a fortnightly basis only. The project supervisor on this project received training on the 1% AIMS Programme. When the supervisor was performing a constraints analysis prior to starting or planning any activity, it was known that there was no access constraint, as there had been full and clear access to the work. There was no constraint on the information as all the specifications were available. Also the instrumentation on the site was stored in the warehouse, and thus there should have been no constraint on the materials as they had been delivered. However, when the short term schedule was being prepared by the electrical supervisor, the instruments which were on site had not been fitted by the mechanical contractor. The contractor had planned to fit the instrumentation after the pipe work and ducts were installed. This priority was to ensure that the physically more onerous work was complete before fitting which, in this case, was considered to be delicate instrumentation. As can be seen in Figure 6 the slow process of installing the instruments needed by the electrical contractor caused this work to fall significantly behind the schedule. It may be noted from Figure 6 that the gap between the planned schedule for completing the installation (blue graph) and the earned work (pink graph) started to open up significantly during August and September. What is interesting, and it is illustrated in Figure 7, is that during these two months the S/E for the project fell, and the breakeven point (that is the point where the cumulative S/E ratio was equal to 1.0.) for the direct labour on the project was achieved at about 20% of the project having been earned and this was while the electrical contractor was falling behind schedule. When the instrumentation was eventually installed by the mechanical contractor, the electrical contractor had to recover the position under the original schedule by bringing to site more personnel to wire, test and commission the instruments. This can be observed in Figure 7 as being when the production output increased towards the end of September, as shown by the percentage complete graph in red.

15
Figure 6 EVA diagram at project completion case no. 3
Figure 7 Illustration of Cumulative S/E and weekly production rate case no. 3 As the GPM had been making fortnightly visits to this site, there were regular meetings with the project manager and the site supervisor as a result of which a system was put in place to
€0
€100,000
€200,000
€300,000
€400,000
€500,000
€600,000
€700,000
€800,000
Value
€
PeriodBudget at Completion (BAC)(Calculated) Earned Value (EV) (calculated)Actual Cost (AC) (Calculated) Planned Value (PV)(Enter)
6
4.17
2.44
1.811.55
1.37 1.25 1.16 1.11 1.09 0.99 0.99 1.00 1.00 1.03 1.01 1.00 0.97 0.95 0.96 0.94 0.92 0.92 0.93 0.93 0.93 0.90 0.90 0.90 0.90
2% 3% 5% 7% 9% 11% 13% 15% 16% 19% 22% 25% 27% 30%34%
38%43%
51%
61%
69%75%
81%87%
93% 95% 97% 98% 99% 100%
0.0%
10.0%
20.0%
30.0%
40.0%
50.0%
60.0%
70.0%
80.0%
90.0%
100.0%
0.00
0.50
1.00
1.50
2.00
2.50
3.00
3.50
4.00
4.50
8-Jun-2014 8-Jul-2014 8-Aug-2014 8-Sep-2014 8-Oct-2014 8-Nov-2014 8-Dec-2014Cumulative S/E Ratio (calculated) % Comp this period (calculated) Cummulative % Earned
16
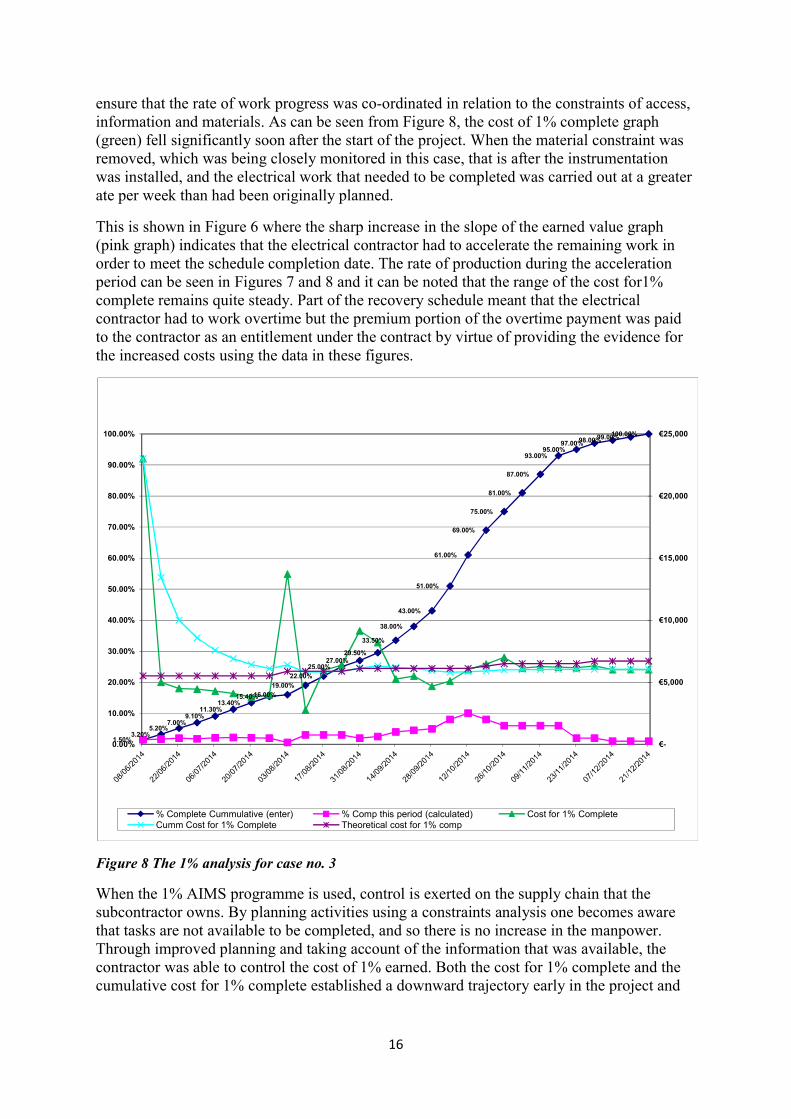
ensure that the rate of work progress was co-ordinated in relation to the constraints of access, information and materials. As can be seen from Figure 8, the cost of 1% complete graph (green) fell significantly soon after the start of the project. When the material constraint was removed, which was being closely monitored in this case, that is after the instrumentation was installed, and the electrical work that needed to be completed was carried out at a greater ate per week than had been originally planned. This is shown in Figure 6 where the sharp increase in the slope of the earned value graph (pink graph) indicates that the electrical contractor had to accelerate the remaining work in order to meet the schedule completion date. The rate of production during the acceleration period can be seen in Figures 7 and 8 and it can be noted that the range of the cost for1% complete remains quite steady. Part of the recovery schedule meant that the electrical contractor had to work overtime but the premium portion of the overtime payment was paid to the contractor as an entitlement under the contract by virtue of providing the evidence for the increased costs using the data in these figures.
Figure 8 The 1% analysis for case no. 3 When the 1% AIMS programme is used, control is exerted on the supply chain that the subcontractor owns. By planning activities using a constraints analysis one becomes aware that tasks are not available to be completed, and so there is no increase in the manpower. Through improved planning and taking account of the information that was available, the contractor was able to control the cost of 1% earned. Both the cost for 1% complete and the cumulative cost for 1% complete established a downward trajectory early in the project and
1.50%3.20%5.20%7.00%9.10%11.30%13.40%15.40%16.00%19.00%
22.00%25.00%27.00%29.50%
33.50%38.00%
43.00%
51.00%
61.00%
69.00%75.00%
81.00%87.00%
93.00%95.00%97.00%98.00%99.00%100.00%
€-
€5,000
€10,000
€15,000
€20,000
€25,000
0.00%
10.00%
20.00%
30.00%
40.00%
50.00%
60.00%
70.00%
80.00%
90.00%
100.00%
% Complete Cummulative (enter) % Comp this period (calculated) Cost for 1% CompleteCumm Cost for 1% Complete Theoretical cost for 1% comp

17
once these costs were under control there were no large swings in the range of the cost for 1% complete. Thus a measurable margin was earned, as can be observed in Figure 6.
Conclusions Much of the literature published on the lean concept as it applies to the construction industry refers to a collaborative approach within the industry. A collaborative approach can only be adopted if the overall owner of the process has determined that they want to approach a construction project in this manner. In an Irish context this would be the exception rather than the rule, where many projects are still procured in the traditional method, that is, there is a competitive tender and the winner will be the lowest or the most economically advantageous tender for the client. In this tendering process, the point can be made that the contractor has already initiated an element of lean behaviour, as the tender has been won with a price that is probably lower than the current market rate. In order to deliver the project at this tender price, that is the lowest cost, the contractor has to make the assumption that everything will be done when it should be and that 100% efficiency will be achieved. This form of procurement does not encourage the economic behaviour amongst the participants that one would find in a collaborative process, where the behaviour exhibited by the participants in the supply chain is one that will attempt to minimise the risk that they are all exposed to in the procurement process. The objective for each participant in the construction supply chain will be to recover all the money that is spent in delivering their part of the project and at the same time generate a profit on this work. As the building construction sector is one that requires a high level of skilled labour, then the risk is increased if this labour is delayed and prevented from being productive. The predominant constraints to work being done productively on a building construction site are due to constraints relating to access, information and materials. In order to minimise the risk, the successful contractor must be able to deliver a rate of production in accordance to the overall time line and simultaneously manage the constraints that will prevent him from being productive. The 1% AIMS programme developed during this research gives the contractor another tool for assistance in being successful in delivering the project on time and obtaining the commercial goals that were set when the project was won through the procurement process. Using the 1% target (or a portion / multiple of the 1%) the contractor is able to determine the average rate of production for any given time line. The monetary measure is monitored in the EVA workbook that is produced on a weekly basis, and the cost of delivering 1% production is monitored against the theoretical value of what 1% should cost if the work force is at 100% efficiency or rather what the budgetary figure is for 1% earned work. The average cost of 1% is also monitored on the EVA workbook and this value is one of the prime indicators of the productivity of the workforce.

18
This 1% figure is simple to understand and is the common link between reporting on the project at project level and reporting on the project at site level. As the concept is easy to understand, the supervisory team and the craft labour are able to quantify the productivity at site level on a day-by-day basis or on a week-by-week basis. Using the 1% concept helps the team determine the production rate and as a result the manpower required, whereupon they then manage the constraints of access, information and materials when they are loading and planning the short term schedule.
Bibliography Ballard and Howell (1994), 'Implementing lean construction: stabilizing work flow', Lean construction. --- (2003), 'An update on last planner1', Proc., 11th Annual Conf., International Group for Lean Construction, Blacksburg, VA. Bertelsen, Sven and Koskela, L. (2004), 'Construction beyond lean: a new understanding of construction management', Lean Construction Institute, 12th Annual Conference 1-12. De Marco, Alberto and Narbaev, Timur (2013), 'Earned value-based performance monitoring of facility construction projects', Journal of Facilities Management, 11 (1), 69-80. Egan, Sir John (1998), 'Rethinking construction', The Construction Industry Task Force. London: Department of the Environment. --- (2008), 'Egan: I’d give construction about four out of 10', (United Kingdom: The Construction Industry Task Force. London: Department of the Environment). Fleming, Quentin W. and Koppelman, Joel M. (2010), Earned Value Project Management (4th Edition) (Project Management Institute, Inc. (PMI)). HVCA (1977), Contract Control, ed. Heating & Ventilating Contractors' Association, 1 vols. (1; Gresham Press, Old Woking, Surrey: Heating & Ventilating Contractors' Association) 73. LePatner, Barry B (2008), Broken buildings, busted budgets: how to fix America's trillion-dollar construction industry (University of Chicago Press). Lichtig, W (2005), 'Sutter health: Developing a contracting model to support lean project delivery', Lean Construction Journal, 2 (1), 105-12. Project Management Institute, Inc. (2005) Practice Standard for Earned Value Management [online text], Project Management Institute, Willems and Vanhoucke (2015), 'Classification of articles and journals on project control and earned value management', International Journal of Project Management, 33 (7), 1610-34. Winch, G. M. (2003), 'Models of manufacturing and the construction process: the genesis of re-engineering construction', Building Research & Information, 31 (2), 107-18. Womack, Jones, and Roos (1991), The machine that changed the world : how Japan's secret weapon in the global auto wars will revolutionize western industry (HarperPerennial) viii, 323 p.