02 ppt 2018 year end community survey - san pablo, ca
TRANSCRIPT

Prepared Expressly for…
December 2018
Year-end…Annual Community Survey
Including Comparison of Opinion Leaders with the Mainstream
Strategy Research InstituteAn Institute for CONSENSUS BUILDING
WWW.SRI‐CONSULTING.ORG800.224-7608

Research Design
Sample size: N=303N=41 Opinion Leaders
Population surveyed: Local electorate
Sampling Error: ±4.5 to 5.8%
Data Collection: December 12-17, 2018
San Pablo 2018 Year-end SurveyDecember 2018

San Pablo is a great community…
I am happy to be a residentQuestion 1.1: San Pablo is a great community; I am happy to be a resident.
Figure 1San Pablo 2018 Year-end Survey
December 2018
0
10
20
30
40
50
60
70
80
90
100
4236
39 10
Per
cent
78%Agree
19%Disagree
Opinion Leaders
68%Agree
Strongly Somewhat Unsure/ Somewhat Strongly
Agree Ref Disagree

Question 2.0: Is there anything about the City of San Pablo that you would like changed?
Desired ChangesIn the City of San Pablo
Issues Would Like Changed(Top 6, Rank-ordered)
Garbage (collection, trash on streets, etc.) 16%Repair/maintenance streets & roads 13%Homelessness 11%Need hospital/better medical services 8%Crime 7%Police services (need more, need to be monitored) 7%
(Refer to Questionnaire for entire list)
Figure 2San Pablo 2018 Year-end Survey
December 2018
59%Yes
35%No
6%Unsure/Refused

Figure 3San Pablo 2018 Year-end Survey
December 2018
Question 3.0: Is there a Local Issue, or more than one issue, you are especially concerned about as a resident of San Pablo?
63%Yes
33%No
4%Unsure/Refused
Issues of concern(Top 5, Rank-ordered)
Crime 14%Homelessness 11%Garbage (collection, trash on streets, etc.) 9%Better education services 7%Repair/maintenance streets and roads 6%
(Refer to Questionnaire for entire list)
Local Issues of Concern(Front-end of Mind)

Figure 4San Pablo 2018 Year-end Survey
December 2018
Question 4.0: I will read a list of local concerns. Please tell me, in order of priority, which three of these local issues are of most concern to you today.
Q4.4 Improved street & road maintenance
Q4.7 Quality of education for local youth
Q4.1 Crime
Q4.3 Local economy & jobs
Q4.5 Local taxes & user fees
Q4.2 Emergency Medical Services
Q4.6 Fire protection services
Local Issues of Concern(Core Values)
22
36
42
46
37
51
52
36
32
30
32
43
29
31
0 20 40 60 80 100
Percent
High + Medium Priority
72
78
68
83
80
80
58

Satisfaction with…
City ServicesQuestion 7.0: As you know, the City provides many services to San Pablo residents, including City street and park maintenance, programs and services for local youth and seniors, public safety services (such as police services), and many more. On whole, how satisfied are you with the services presently being provided by and/or through the City?
Extremely Somewhat Unsure Somewhat Extremely
Satisfied Ref Dissatisfied
0
10
20
30
40
50
60
70
80
90
100
13
61
414
8
Per
cent
74%Satisfied
22%Dissatisfied
Opinion Leaders
73%Satisfied
Figure 5San Pablo 2018 Year-end Survey
December 2018

Figure 6San Pablo 2018 Year-end Survey
December 2018
33%Yes
Question 8.0: Are there any additional services that you wouldlike the City to consider providing to residents throughout the community?
Additional Services Constituents would Like Included in 2019 Work Plan
62%No
5%Unsure/Refused
Additional Services(Top 4, Rank-ordered)
Additional services for SENIORS 12%Programs for YOUTH (e.g., meals, 11%
after-school programs)Need hospital/better medical services 10%More parks & recreation activities 10%
(Refer to Questionnaire for entire list)

Has Crime in the CityIMPROVED (LESS CRIME),
GOTTEN WORSE, OR NO CHANGE?
44%Little
Change
32% Improved(less crime)
14% GottenWorse
10%Unsure/Refused
Question 9.0: Public safety is, without question, one of the top concerns among residents in any community, San Pablo is no exception. In your opinion, has CRIME in San Pablo…
Figure 7San Pablo 2018 Year-end Survey
December 2018
Opinion Leaders
41%Improved
10%Gotten worse
49%Little change

Figure 8San Pablo 2018 Year-end Survey
December 2018
Should the City… Invest in New Technologies
to Enhance Public Safety?
Question 10.0: San Pablo City Council has invested thousands of dollars into a new City-wide camera surveillance technology and body worn cameras for its Police Department. Should the City continue to invest in new technologies to enhance public safety?
65
173 5 10
0
10
20
30
40
50
60
70
80
90
100
Perc
ent
82%Agree
15%Disagree
Opinion Leaders
78%Agree
Strongly Somewhat Unsure/ Somewhat Strongly
Agree Ref Disagree

Figure 9San Pablo 2018 Year-end Survey
December 2018
Question 11.0: The San Pablo Police Department has a number of community policing programs to help combat crime, divert youth from at-risk behaviors, encourage police engagement, and improve crime reporting. Should these be kept or eliminated?
Community Policing Program Keep Eliminate
Q11.3 Youth At-Risk Programs 91% 5%
Q11.4 Neighborhood Watch Programs 88% 8%
Q11.1 School Resource Officers 83% 9%
Q11.5 Business Crime Prevention Program 82% 6%
Q11.7 Police Cadet Program 80% 11%
Q11.8 Police Explorers Program 71% 11%
Q11.2 San Pablo Police Citizen Academy 66% 12%
Q11.6 Loving Solutions (Parent Training) 63% 13%
Keep or Eliminate the FollowingCommunity Policing Programs
(Rank-ordered)

Question 12.1 Before this telephone interview, had you heard of fiber optics or Municipal Broadband?
1%Unsure/DK
/Ref
60%Yes
39%No
Have You Heard of…Fiber Optics or
Municipal Broadband?
Figure 10ASan Pablo 2018 Year-end Survey
December 2018

Figure 10BSan Pablo 2018 Year-end Survey
December 2018
Likely ‘Take Rate’
Likely Take Rate TodayMinimumTake Rate
LikelyTake Rate
PotentialTake Rate
37% 53% to 59% 69%
100% of Highly Likely
To Switch
100% of Highly LikelyPlus 50% to 70% of
Somewhat Likely to Switch
100% of Highly LikelyPlus 100% of Somewhat
Likely to Switch
Question 12.2 Based upon the description I just gave you for a City-owned, public Municipal Broadband fiber optics network AND a future City-wide 5G public wireless network, how likely is it that you will SWITCH from your present provider of Internet services (e.g., with Comcast Cable or AT&T), when it is made available to you through the City of San Pablo?
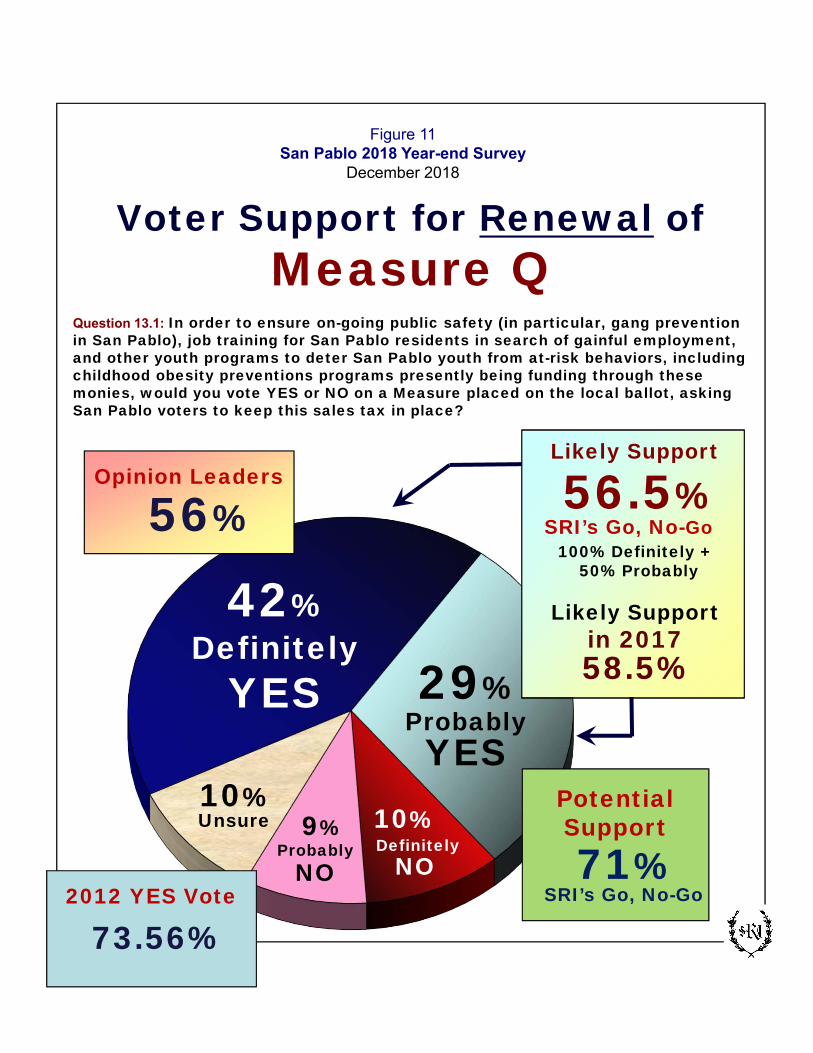
42% Definitely
YES 29% ProbablyYES
9%Probably
NO
10%Unsure
Likely Support
56.5%100% Definitely +
50% Probably
Likely Support in 201758.5%
Question 13.1: In order to ensure on-going public safety (in particular, gang prevention in San Pablo), job training for San Pablo residents in search of gainful employment, and other youth programs to deter San Pablo youth from at-risk behaviors, including childhood obesity preventions programs presently being funding through these monies, would you vote YES or NO on a Measure placed on the local ballot, asking San Pablo voters to keep this sales tax in place?
SRI’s Go, No-Go
10%Definitely
NO
Voter Support for Renewal ofMeasure Q
11%Opinion Leaders
56%
Potential Support
71%SRI’s Go, No-Go
Figure 11San Pablo 2018 Year-end Survey
December 2018
11%2012 YES Vote
73.56%

Figure 12ASan Pablo 2018 Year-end Survey
December 2018
Question 5.0: I will read a list of possible ENDEAVORS for the City’s2019 Work Plan. In your opinion, what priority should be placed on each item.
Q5.6 Enhance quality of education for local youth
Q5.1 Enhance Public Safety
Q5.4 Work force development/Job training for local residents
Q5.7 More affordable housing
Q5.9 Enhance services to Seniors
Q5.8 Street maintenance/rehabilitation projects
Q5.3 Economic development to Diversify local economy
Q5.10 New & improved City parks
Q5.2 Additional recreation facilities
Q5.5 Enhanced Telecom Services (e.g., Municipal Broadband)
Endeavors for 2019 Work Plan(Rank-ordered)
39
39
36
45
52
56
63
59
58
69
32
33
37
33
31
29
23
29
31
21
0 20 40 60 80 100
Percent
High + Medium Priority
85
86
83
90
88
89
78
73
72
71

Figure 12BSan Pablo 2018 Year-end Survey
December 2018
Question 6.0: Are there additional projects or endeavors that you think the new City Council should incorporate into its 2019 Work Plan?
Additional Projects/Endeavors Constituents would Like included in 2019 Work Plan
41%Yes
51%No
8%Unsure/Refused
Additional Projects(Top 5, Rank-ordered)
Additional Affordable housing 7%Disseminate City information to residents 6%Need hospital/better medical services 6%Economic development (jobs/livable wage) 6%Address Homelessness 6%
(Refer to Questionnaire for entire list)

How Valuable Are… Annual Community Surveys?Question 14.0: In order to secure input from the Community-at-large regarding policy-level decisions, San Pablo City officials reach out each year to constituents through a public opinion survey, such as the present one. The information secured through these scientific surveys is used to guide City officials in identifying issues of concern to local residents that need to be incorporated into the City Council’s annual Work Plan. How important is securing input each year from the community-at-large to be certain that the City’s Work Plan reflects the collective perceptions and desires of the community-at-large?
Figure 13San Pablo 2018 Year-end Survey
December 2018
61%ExtremelyImportant
32%SomewhatImportant
4%Unsure/Refused
3%Not at allImportant
Opinion Leaders
92%Extremely + Somewhat Important
93%IMPORTANT

Thank You
We’ll be pleased toTake Questions Now

Demographicsof Survey Respondents
Length of Residency0 to 5 years 21%6 to 10 17%11 to 25 29%Over 25 years 31%Refused 2%
Age18 to 30 19%31 to 40 12%41 to 50 11%51 to 65 23%Over 65 years 31%Refused 4%
Household IncomeUnder $25,000 18%$25,001 to $50,000 21%$50,001 to $75,000 18%$75,001 to $100,000 15%Over $100,000 14%Refused 14%
EducationLess than High School 5%High School/Trade School 19%Some College 31%College Graduate 31%Graduate/Prof. School 12%Refused 2%
EthnicityCaucasian 31%Hispanic/Latino 23%African American/Black 25%Native American/Alaskan 1%Native Hawaiian & other
Pacific Islander 0%Asian 7%Other 13%
GenderMale 44%Female 56%
IdeologyLiberal 24%Progressive 21%Moderate 22%Conservative 21%Refused 12%
Home OwnershipOwn 58%Rent 38%Refused 4%
Figure 14ASan Pablo 2018 Year-end Survey
December 2018
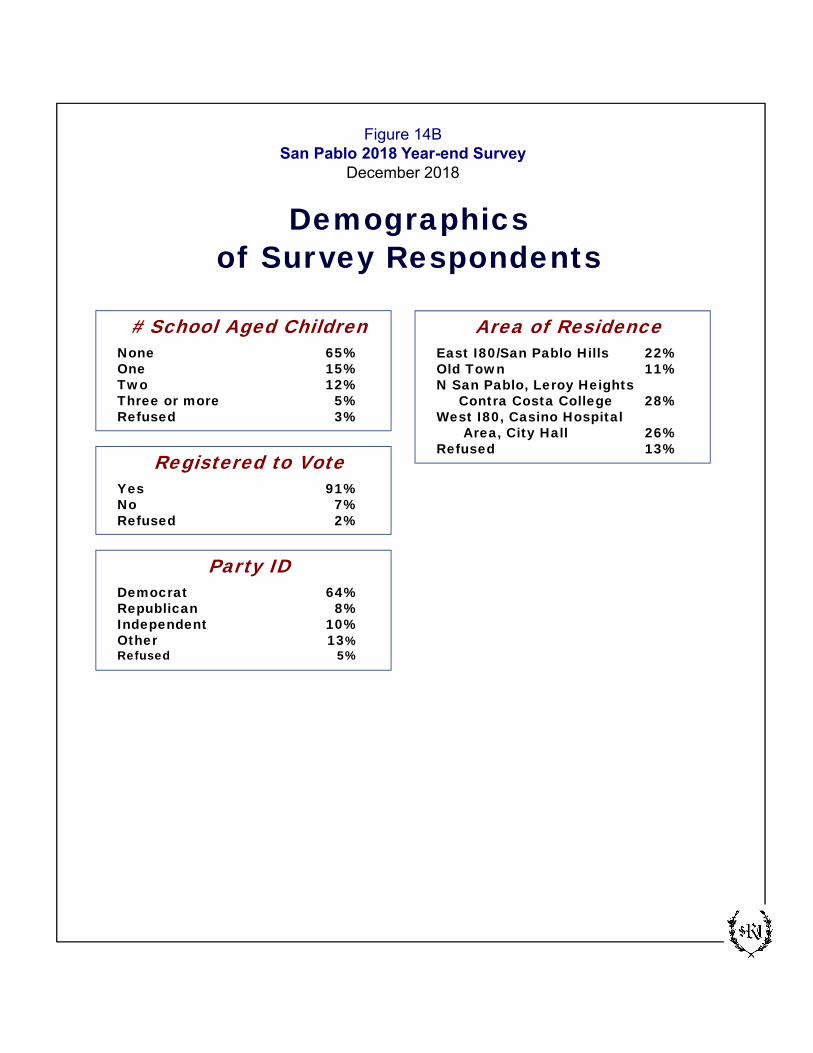
Demographicsof Survey Respondents
# School Aged ChildrenNone 65%One 15%Two 12%Three or more 5%Refused 3%
Registered to VoteYes 91%No 7%Refused 2%
Party IDDemocrat 64%Republican 8%Independent 10%Other 13%Refused 5%
Area of ResidenceEast I80/San Pablo Hills 22%Old Town 11%N San Pablo, Leroy Heights
Contra Costa College 28%West I80, Casino Hospital
Area, City Hall 26%Refused 13%
Figure 14BSan Pablo 2018 Year-end Survey
December 2018