0 copyright © 2008 deloitte development llc. all rights reserved. new paradigm for international...
TRANSCRIPT
1Copyright © 2008 Deloitte Development LLC. All rights reserved.
New Paradigm for International Insurance ComparisonWith an Application to Comparison of Seven Insurance Markets
Presented By: Stephen PackardDirector, Financial Services/Strategy and OperationsDeloitte Consulting, LLP
Presented By: Stephen PackardDirector, Financial Services/Strategy and OperationsDeloitte Consulting, LLP

2Copyright © 2008 Deloitte Development LLC. All rights reserved.
There are many factors contributing to the strategic importance of accurately assessing market growth potential. Those factors include:There are many factors contributing to the strategic importance of accurately assessing market growth potential. Those factors include:
• Making the right investment choices requires a comprehensive and
consistent framework to understand the current and future growth
opportunities in various geographic/geopolitical markets.
• Competitive environment and market conditions will increase the
damage caused by wrong bets
• Need to capitalize on international institutions involved in market
building
The strategic importance of assessing growth potential of insurance markets

3Copyright © 2008 Deloitte Development LLC. All rights reserved.
The Two Insurance Growth ModelsThe basis of the author’s thesis is a comparison between two “world insurance growth models”: The Ordinary Growth Model and the Adjusted Growth Model. Each has its own application and comparisons between them provide new insight.
The basis of the author’s thesis is a comparison between two “world insurance growth models”: The Ordinary Growth Model and the Adjusted Growth Model. Each has its own application and comparisons between them provide new insight.
Ordinary Growth ModelOrdinary Growth Model
Adjusted Growth ModelAdjusted Growth Model
Observations from the Ordinary Growth Model• Insurance penetration rises as GDP per capita rises, but different levels of GDP per capita
accompany different rates of increase for insurance penetration• Low GDP per capita correlates with a slow rate of increase for Insurance Penetration• Increasing GDP per capita leads to a high rate of increase for Insurance Penetration• However, at the highest levels of GDP per Capita the rate of Insurance Penetration slows and
levels off• Does not separate the economic factors and institutional factors influencing insurance growth
Observations from the Adjusted Growth Model• Separates country-specific institutional factors and economic factors influencing insurance growth• More suited to structural analysis of the insurance industry. For instance, to compare the growth
structure of each country’s insurance industry
Comparing the Ordinary Growth Model and Adjusted Growth Model allows the observer to separate the different impacts of economic factors and institutional factors on the development of the insurance industry for an individual country

4Copyright © 2008 Deloitte Development LLC. All rights reserved.
A New Method for MeasurementEach of the current methods for measurement of the insurance industry within a country are problematic in that they do not provide for the effects of the relative stage of economic growth. A new method of measurement is introduced to accommodate these differences
Each of the current methods for measurement of the insurance industry within a country are problematic in that they do not provide for the effects of the relative stage of economic growth. A new method of measurement is introduced to accommodate these differences
Method Definition Benefits Challenges
Premium Income Method
Measures the total premium income
Depicts the overall scale of the insurance market in each country
Fails to take the population factor into consideration
Insurance Density Method
The per capita premium (Premium divided by population)
Better reflects the true level of insurance growth compared to the premium income method
Only considers the development of the insurance industry in isolation. Does not take into account the relationship between the insurance industry and the economy
Insurance Penetration Method
Total premium divided by GDP. An alternate method is insurance density/GDP per capita
Characterizes the relationship between the insurance industry and the broader economy
Does not consider the different stages of economic development and thus does not account for different insurance penetration levels at each stage of development
New Method: BRIPBenchmark Ratio of Insurance Penetration
The relationship between the a country’s insurance penetration and the world’s average penetration (at an equivalent economic level)
A measure of the relative development of the country’s insurance industry to the stage of economic development
5Copyright © 2008 Deloitte Development LLC. All rights reserved.
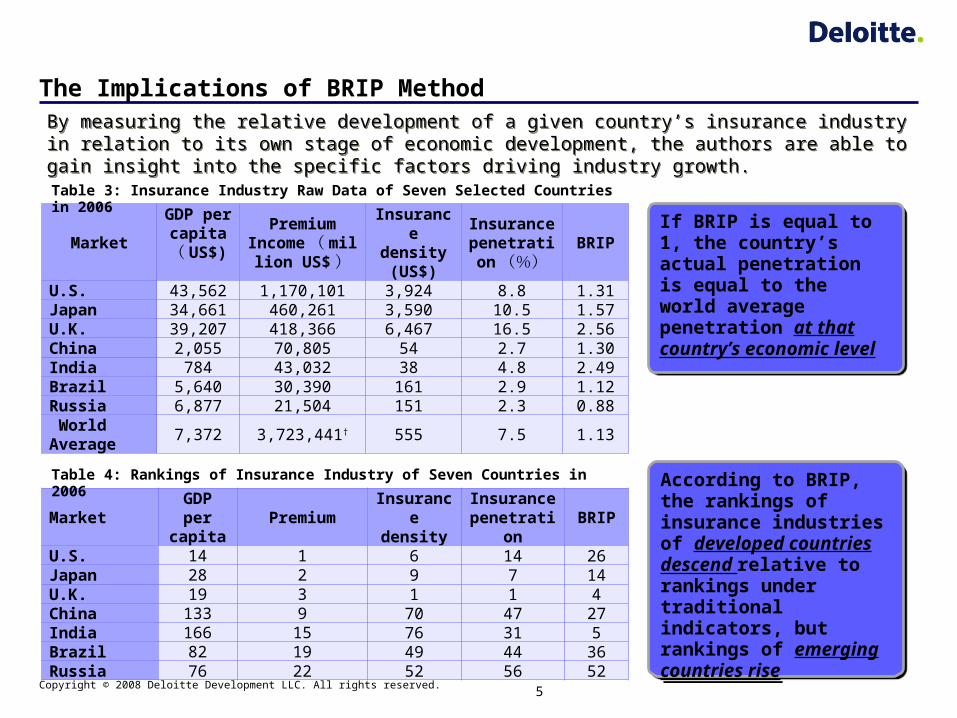
The Implications of BRIP MethodBy measuring the relative development of a given country’s insurance industry in relation to its own stage of economic development, the authors are able to gain insight into the specific factors driving industry growth.
By measuring the relative development of a given country’s insurance industry in relation to its own stage of economic development, the authors are able to gain insight into the specific factors driving industry growth.
MarketGDP per
capita( US$)
PremiumIncome ( milli
on US$)
Insurance density (US$)
Insurance penetration(%)
BRIP
U.S. 43,562 1,170,101 3,924 8.8 1.31Japan 34,661 460,261 3,590 10.5 1.57U.K. 39,207 418,366 6,467 16.5 2.56China 2,055 70,805 54 2.7 1.30India 784 43,032 38 4.8 2.49Brazil 5,640 30,390 161 2.9 1.12Russia 6,877 21,504 151 2.3 0.88 World Average
7,372 3,723,441† 555 7.5 1.13
Table 3: Insurance Industry Raw Data of Seven Selected Countries in 2006
If BRIP is equal to 1, the country’s actual penetration is equal to the world average penetration at that country’s economic level
If BRIP is equal to 1, the country’s actual penetration is equal to the world average penetration at that country’s economic level
MarketGDP per capita
PremiumInsurance
densityInsurance
penetrationBRIP
U.S. 14 1 6 14 26Japan 28 2 9 7 14U.K. 19 3 1 1 4China 133 9 70 47 27India 166 15 76 31 5Brazil 82 19 49 44 36Russia 76 22 52 56 52
Table 4: Rankings of Insurance Industry of Seven Countries in 2006 According to BRIP, the rankings of insurance industries of developed countries descend relative to rankings under traditional indicators, but rankings of emerging countries rise
According to BRIP, the rankings of insurance industries of developed countries descend relative to rankings under traditional indicators, but rankings of emerging countries rise
6Copyright © 2008 Deloitte Development LLC. All rights reserved.
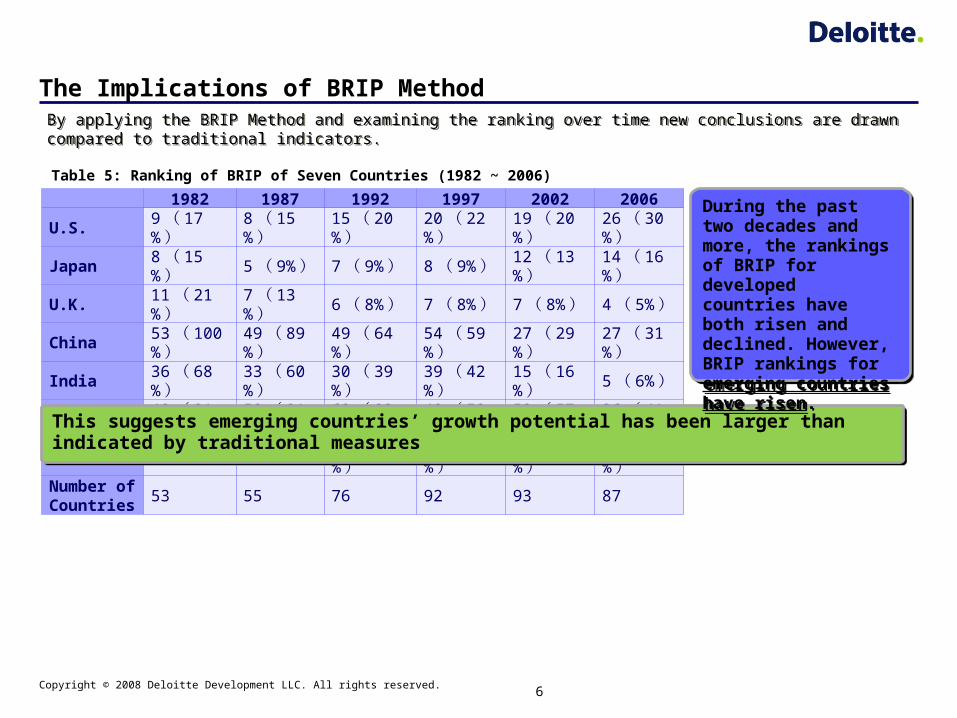
The Implications of BRIP MethodBy applying the BRIP Method and examining the ranking over time new conclusions are drawn compared to traditional indicators.By applying the BRIP Method and examining the ranking over time new conclusions are drawn compared to traditional indicators.
1982 1987 1992 1997 2002 2006
U.S.9 ( 17%)
8 ( 15%)
15 ( 20%)
20 ( 22%)
19 ( 20%)
26 ( 30%)
Japan8 ( 15%)
5 ( 9%) 7 ( 9%) 8 ( 9
%)12 ( 13%)
14 ( 16%)
U.K.11 ( 21%)
7 ( 13%) 6 ( 8%) 7 ( 8
%)7 ( 8%)
4 ( 5%)
China53 ( 100%)
49 ( 89%)
49 ( 64%)
54 ( 59%)
27 ( 29%)
27 ( 31%)
India36 ( 68%)
33 ( 60%)
30 ( 39%)
39 ( 42%)
15 ( 16%)
5 ( 6%)
Brazil48 ( 91%)
50 ( 91%)
62 ( 82%)
48 ( 52%)
53 ( 57%)
36 ( 41%)
Russia - -70 ( 92%)
59 ( 64%)
35 ( 38%)
52 ( 60%)
Number of Countries
53 55 76 92 93 87
Table 5: Ranking of BRIP of Seven Countries (1982 ~ 2006)
This suggests emerging countries’ growth potential has been larger than indicated by traditional measures This suggests emerging countries’ growth potential has been larger than indicated by traditional measures
During the past two decades and more, the rankings of BRIP for developed countries have both risen and declined. However, BRIP rankings for emerging countries have risen.
During the past two decades and more, the rankings of BRIP for developed countries have both risen and declined. However, BRIP rankings for emerging countries have risen.
7Copyright © 2008 Deloitte Development LLC. All rights reserved.
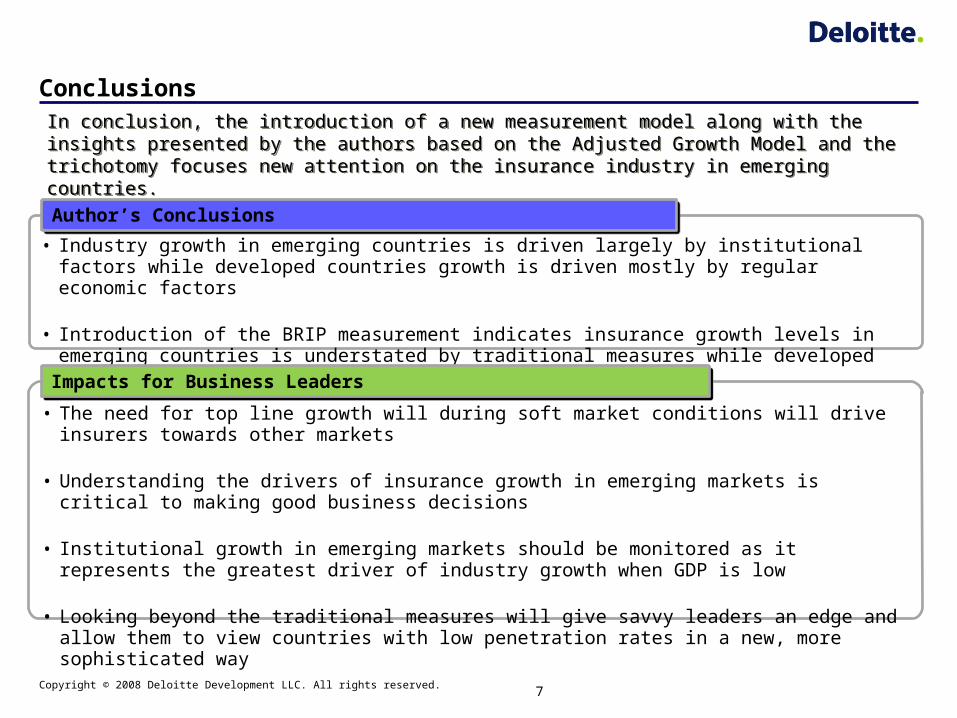
ConclusionsIn conclusion, the introduction of a new measurement model along with the insights presented by the authors based on the Adjusted Growth Model and the trichotomy focuses new attention on the insurance industry in emerging countries.
In conclusion, the introduction of a new measurement model along with the insights presented by the authors based on the Adjusted Growth Model and the trichotomy focuses new attention on the insurance industry in emerging countries.
• Industry growth in emerging countries is driven largely by institutional factors while developed countries growth is driven mostly by regular economic factors
• Introduction of the BRIP measurement indicates insurance growth levels in emerging countries is understated by traditional measures while developed countries growth is overstated
Author’s ConclusionsAuthor’s Conclusions
• The need for top line growth will during soft market conditions will drive insurers towards other markets
• Understanding the drivers of insurance growth in emerging markets is critical to making good business decisions
• Institutional growth in emerging markets should be monitored as it represents the greatest driver of industry growth when GDP is low
• Looking beyond the traditional measures will give savvy leaders an edge and allow them to view countries with low penetration rates in a new, more sophisticated way
Impacts for Business LeadersImpacts for Business Leaders