aatosmihalis.files.wordpress.com · web viewvital gluten powder was prepared by extracting gluten...
TRANSCRIPT

Effects of Vital Gluten Enrichment on Qualities of Value Added Products Mekuria B and Emire SA* https://www.omicsonline.org/open-access/effects-of-vital-gluten-enrichment-on-qualities-of-value-added-products-2157-7110-1000508.php?aid=62440
Food, Beverage and Pharmaceutical Industry Development Institute, Ministry of Industry, Private mailbag 33381, Addis Ababa, Ethiopia
*Corresponding Author:Emire SA Food, Beverage and Pharmaceutical Industry Development InstituteMinistry of Industry, Addis, Ababa, EthiopiaTel: +251-9336263E-mail: [email protected]
Received date: September 15, 2015; Accepted date: September 30, 2015; Published date: October 06, 2015
Citation: Mekuria B, Emire SA (2015) Effects of Vital Gluten Enrichment on Qualities of Value Added Products. J Food Process Technol 6:508. doi:10.4172/2157- 7110.1000508
Copyright: © 2015 Emire SA, et al. This is an open-access article distributed under the terms of the Creative Commons Attribution License, which permits unrestricted use, distribution, and reproduction in any medium, provided the original author and source are credited.
Visit for more related articles at Journal of Food Processing & Technology
Abstract
The aim of this research was to study the effects of vital gluten enrichment on qualities of pasta flour, bread and biscuit products. The proportions of vital gluten powder added to wheat flour and the blend of wheat flour and corn flour were 3% and 6%. The Farinograph values, wet gluten, protein, ash, color grade and falling number of wheat flour, corn flour, the composite flours of wheat and corn as well as vital gluten blended flours were determined and compared with the normal flours used for pasta, bread and biscuit production. The effects of vital gluten enhancement on product qualities were assessed by formulating pasta flour, bread and biscuit products; respectively. Consequently, the highest wet gluten content of flours for 3% and 6% vital gluten supplemented flours were 41.8% and 46.67%; respectively. Vital gluten supplemented flours for bread production exhibited better wet gluten content. The protein content was higher (13.10%) than the normal bread (10.53%). Enhanced protein and crispiness of biscuit was obtained by blending soft wheat and corn flours and enriching them with vital gluten. The sensory qualities of both bread and biscuit products were acceptable by panelists. It was also possible to obtain suitable and

quality pasta wheat flour by enriching the locally available hard wheat varieties with vital gluten. It is consequently critical to enhance the local wheat varieties with vital gluten to enlarge their protein qualities which can be used for protein enriched value added products manufacturing industries.
Keywords
Enrichment; Sensory quality; Value added products; Vital gluten; Wheat varieties
Introduction
Wheat is inimitable among all the cereal grains grown in many parts of the World as a stable food, and forms the basis for numerous food products. Several thousand varieties of wheat are known where the three main types include Triticum durum (durum wheat) largely used for pasta production, Triticum vulgare or aestivum mainly used for bread production and Triticum compactum (soft wheat) used for biscuit, pastry and cakes production.
The inimitable properties of wheat gluten are given an intense attention by the food industries. Interest has extended to the commercial separation of gluten from the starch and soluble proteins of flour for food production applications. In actual fact, it is the cohesive properties of gluten that makes its commercial preparation a relatively simple process. Vital wheat gluten is now a significant ingredient in the food industry and an important item of world trade [1]. Food industries are using vital wheat gluten as an ingredient especially in those countries which produces wheat with low protein content.
The wheat quality is intricate and is complicated to articulate in terms of a single property. It may be defined in terms of its suitability for a particular purpose or use [2]. Variety is an imperative factor that manipulates grain quality. Generally, wheat is marketed according to the class and each class consists of a group of varieties with similar characteristics apt for similar purposes and end-use [3]. In Ethiopia hard and soft wheat varieties are widely cultivated in the highlands of South East, Central and North West parts. The Ethiopian Agricultural Research Institute, Kulumsa Agricultural Research Center is currently performing research activities on various wheat cultivars to boost up the small scale farms income and thereby support the milling industries [4].
The incorporation of vital gluten in a bread recipe increases the protein value of the final loaf. It will also enhance the loaf volume and crumb structure better than the one without gluten supplementation [5]. It also increases the yield of final product by increasing the water absorption of dough and also the finished products will have a longer shelf life due to the finer grain and softer texture. Toufeili showed that loaf volume increases when low protein flours are fortified with vital gluten [6]. On the other hand, Spychaj and Gil reported that supplementation of common wheat flour used for pasta production with vital gluten will reduce the cooking loss yielding good cooking quality [7]. Losses that occur due to cracks and broken pasta can be minimal if the pasta flour contains adequate amount of protein. The rheological characteristics of all flours and the blends were measured and analyzed by farinograph. The farinograph measures (as torque) and records the resistance to mixing of dough as it is
formed from flour and water [8]. The peculiar visco-elastic properties of wheat dough are the result of the presence of a three dimensional network of gluten proteins.
The visco-elastic properties enable dough to retain gas which is essential for production of baked products with a light texture. Rheological properties such as elasticity, viscosity and extensibility are important in the prediction of the processing parameters of dough and quality of end product.
The farinograph curve (Figure 1) provides useful information for bakers striving to produce consistent products with flour of variable quality. It is used to determine flour strength and to predict processing characteristics like water absorption (%), development time (min), stability (min), degree of softening (FU), and farinograph quality number [9].
Figure 1: Schematic presentation of Farinograph parameters (Brabender Measurement & Control Systems, 2006).
The farinograph values in general provide a means to select quality flour for bakers. The farinogram below as taken from Brabender measurement and control system shows the farinograph parameters (Figure 1).
The quality of wheat flour and flour products solely depends on the amount and quality of gluten contained by the flour used as an ingredient in producing such products. According to the wheat quality analysis report of Kaliti Food Share Company the protein content of the first grade hard wheat varieties that are used for pasta and bread making purposes are low [10]. As a result of this, most bread loaves made out of the local varieties have low water absorption, less volume, coarse grain and less soft crumb texture. The pasta products have high cooking loss, sticks after cooking (to each other or to the teeth or to the gum), are less tolerant to moderate over cooking, less firm and springy as well as have less smooth surface. Due to these

quality attributes customers usually do not prefer pasta made out of local wheat. In order to satisfy the needs of their customers most of the pasta producers import high protein hard wheat. Import of wheat typically has high price, requires long purchasing processes and foreign currency. To alleviate these problems the production of vital gluten and supplementation of flours obtained from local hard wheat varieties is essential.
The inefficiency of utilizing other relatively cheaper cereal grains such as corn, sorghum, barely and rice for bread, pasta, biscuits and pastry production depends on the absence of gluten in these grains. The incorporation of these grains can be made possible through the supplementation of vital gluten to them. Gluten will provide them the necessary elasticity, gas retention capacity during fermentation process as well as increase their water absorption potential. These cereal grains are widely cultivated in our country and are readily available in the market but are less used for food. It is therefore, important to supplement flours of these cereals and utilize them for pasta, bread, biscuit, pastry and noodle production.
The other challenge that consumers face in their daily menu is that shortage of protein. Most of our foods are carbohydrate rich but less in protein. According to the wheat quality analysis report by Ethiopian Health and Nutrition Research Institute indicated that the protein contents of pasta and biscuit product samples collected from Kaliti Food Share Company, KFSC are 12% and 8%; respectively [10]. In order to produce protein affluent products, it is essential to supplement the flours of these products with vital gluten. This is because the prices of protein isolates such as soy protein isolate, whey protein, and caseinate are relatively high [1]. It is therefore essential to produce vital gluten from local wheat varieties and enrich the existing flour and flour products in order to obtain a good supply of protein.
The average protein content of locally released varieties is about 10% while the imported Russian milling wheat has a protein content of 14.5% [10]. Protein content and flour strength are the primary factors influencing pasta and bread quality. Wheat varieties with high protein content and strength usually yield bread loaves with good quality and pasta with firm and best cooking quality. It is therefore important to reconstitute local wheat flour with vital gluten. The need for the enrichment of the local hard wheat flours with vital gluten is a compulsory activity for bread and pasta producers in order to attain the best quality product in the Ethiopian context [11].
Taking into account the aforementioned facts, the production of vital gluten from hard wheat varieties that can be utilized in the enrichment of cereal based food products. In view of the importance of gluten production and the unparallel contribution of improved varieties; the present research was pursued with the rationale to evaluate the effects of vital gluten enrichment on quality of some value added food products.
Materials and Methods
Source of materials and sample preparation
Hard wheat varieties specifically Pavon 76, HAR 2501 (Hawi) and HAR 2536 (Simba) were released in 1982 and 2000 by the Ethiopian Agricultural Research Institute, Kulumsa Agricultural Research Center. All samples were collected from

Arsi and Bale Agricultural Development Enterprises. All the wheat samples were collected from the two locations merely because the two areas are most known in high quality wheat production, and the released wheat varieties are available from small and private-owned large scale farmers. Moreover, wheat milling industries prefer the wheat varieties grown in these areas. Thus, the samples from the two locations represent the varieties. The samples were collected using random sampling system. They were then packed in polypropylene bags and brought to the laboratory. The bags were well tightened to avoid contamination and spillage. Each wheat variety was then thoroughly cleaned using 2 mm opening width laboratory sieve. Coarse impurities were handpicked. They were then packed in polypropylene bags again and stored at room temperature for analyses. Furthermore, graded wheat flour was collected from Kaliti Food Share Company (KFSC) while corn flour was purchased from the local market. All analyses were conducted by using analytical grade chemicals and reagents.
Blend formulation
Vital gluten powder was prepared by extracting gluten from wheat flour of the local variety HAR 2501 according to the method described by Kovacs [12]. The main process steps in gluten isolation include mixing, washing, pressing, drying, cooling, milling and packaging. Subsequently, a blend of wheat flour and vital gluten powder, corn flour and vital gluten powder and wheat flour, corn flour and vital gluten powder were formulated for subsequent applications in the preparation of pasta flour, bread and biscuit.
In the preparation of blended flour for pasta production, blends of local hard wheat flour with better gluten content and vital gluten powder, corn flour and vital gluten powder and hard wheat flour, corn flour and vital gluten powder were blended using mixer (Model: R100C, CAT). The 3% and 6% of vital gluten powder was added to both wheat and corn flours [7]. In addition to this, 13% of vital gluten powder was added to corn flour in order to see the potential of corn for pasta production. Wheat flour and corn flour were blended in 75 and 25% as well as 50 and 50% ratios; respectively.
In the preparation of blended flour for bread production similar ratio of vital gluten powder was used as that of blended flour for pasta production as indicated in Table 1. However, the wheat flour used for this purpose was low in gluten content than that used for pasta. 12% of vital gluten was added to corn flour this time to see how it will affect the characteristics of the flour to be used for bread production.
Blended flours
Parameters
Moisture(%)
Color grade
Wet gluten (%)
Ash(%)
Protein( %)
FN(sec.)
Particle size (< 180 µ)
SWF 14.0 ± 0.15a
-0.13 ± 0.07a
27.67 ± 0.51d
0.59 ± 0.01a
10.53 ± 0.16c 344 ± 7a 100 ± 0.00a
CF 10.57 ± 0.00d
8.69 ± 0.14g ND 1.23 ±
0.05f7.43 ± 0.39e
278 ± 17b
99.27 ± 0.49a
SWF + 3VGP 12.97 ± 0.75 ± 30.53 ± 0.64 ± 12.29 ± 335 ± 8a 77.97 ±

0.06b 0.36b 0.61c 0.03b 0.32b 12.1d
CF + 3VGP 11.13 ± 0.15c
9.01 ± 0.16h ND 1.25 ±
0.05f8.81 ± 0.51d
273 ± 8b
99.20 ± 0.10a
BFB1 +3VGP 11.7 ± 0.30c
2.52 ± 0.29d
29.8 ± 0.26c
0.83 ± 0.03c
13.10 ± 0.40a
277 ± 15b
97.63 ± 1.88b
SWF + 6VGP 12.77 ± 0.06b
1.50 ± 0.48c
32.50 ± 0.20 a
0.72 ± 0.02c
13.22 ± 0.21a
318 ± 10c
99.67 ± 0.49a
CF + 6VGP 10.23 ± 0.06d
7.09 ± 0.06f ND 1.13 ±
0.01e12.44 ± 0.28b
239 ± 15e
64.63 ± 6.43e
BFB1 + 6VGP 11.70 ± 0.00c
3.17 ± 0.42d
31.23 ± 0.38b
0.80 ± 0.01c
13.46 ± 0.25a 270 ± 4c 98.5 ± 1.57b
BFB2 + 6VGP 10.73 ± 0.15d
4.69 ± 0.24e
22.20 ± 0.53e
0.91 ± 0.01d
12.43 ± 0.38b 255+6d 98.17 ±
0.59b
CF+ 12 VGP 9.00 ± 0.15e
7.82 ± 0.43f
3.23 ± 0.59f
1.11 ± 0.02e
12.54 ± 0.36b
255 ± 16d 90.2 ± 2.75c
All a-h values are means of triplicate ± SD on dry matter basis means followed by different superscript within the same raw differ significantly (P ≤ 0.05)Where: - ND- Not detected; SWF: Soft Wheat Flour; CF: Corn Flour; VGP: Vital Gluten Powder; BFB1 = 75% SWF + 25% CF; BFB 2= 50% SWF + 50% CF
Table 1: Effects of vital gluten enhancement on physico-chemical quality characteristics of blended flours for bread production (All values are in dry matter basis)
In the case of biscuit flour preparation wheat flour, corn flour and vital gluten powder were used in various ratios. Wheat flour and corn flour were mixed in 75:25, 50:50 and 25:75 ratios; respectively. All blended flours formulated for pasta, bread and biscuit products were characterized for moisture, protein, wet gluten, falling number, ash, color grade and particle size distribution. Based on the quality analyses results such as wet gluten, protein, falling number and farinograph values suitable blended flours were then selected for each product to be developed.
Preparation of pasta
Since there is no pilot pasta making machine in the country, the production of pasta with the vital gluten fortified flour was a limitation. However, the flour blends were characterized and compared with the normal pasta wheat flour. Nine blended flours were formulated and the quality characteristics of blended flours as well as pasta flour currently used by KFSC were analyzed. The quality characteristic of pasta flour was analyzed for comparison with the blended flours.
Bread processing
Bread was prepared by straight dough method bread production process (mixing and kneading, bulk fermentation, molding, rounding, intermediate proofing, molding, final proofing, baking, cooling and packaging). The normal flour, blended flours at ratios of 3% VGP + SWF, 3% VGP + (75% + 25 CF), 6% VGP + (75% SWF + 25 CF), 6% VGP + (50% SWF+ 50% CF) and 12% VGP + CF were employed in the production of bread.

The five blend formulations and the control flour were baked using the straight dough method [13]. The baking formula was 62% wheat flour or the blend, 0.3% yeast, 0.3% bread improver, 0.6% salt and 37.0% water. All ingredients were mixed in a dough mixer (Model: B15 mixer, England,1998) for 15 minutes. The dough was fermented in a bowl covered with polyethylene plastic for 30 minutes at room temperature. It was then knocked back and molded. The dough pieces were then allowed to ferment for 60 minutes in a proofing room of temperature 35ºC and relative humidity of 80%. The fermented dough was baked at 250ºC for 20 minutes [6,13-15].
Biscuit processing
Baking tests were carried out at the laboratory scale using the corn and vital gluten blend as well as wheat flour, corn flour and vital gluten blends. The biscuit processing method was performed according to Kaliti Food Share Company. The proportion of ingredients employed in the baking recipe were wheat flour or blends 77.82%, sugar 13.62%, salt 0.58%, shortening 3.89%, skimmed milk powder 0.19%, NH4HCO3 1.17%, NaHCO3 0.23%, KHC4H4O6 0.08%, Na2S2O5 0.01% and vanilla flavor 0.08%.
The production process in biscuit were creaming, mixing, dough relaxation, dumping and cutting, conveying, laminating (sheeting), shaping and cutting, baking, cooling and packaging. All ingredients other than wheat flour or blended flour were first creamed in laboratory mixer (model B15, China) for 5 minutes at high speed (294 rpm) and then mixed with flour and kneaded. The mixing time was at low speed (91 rpm) for 5 minutes and high speed for 10 minutes. The dough was allowed to relax, covered with polyethylene sheet for 30 minutes at room temperature (22ºC). It was then laminated, stamped and cut in to pieces. The dough pieces were transferred to baking pans and baked at a temperature of 250ºC for 20 minutes. The product was then cooled at ambient temperature and packed in polypropylene films.
Analysis methods
Proximate analysis: Proximate chemical composition analysis of the blended flours for pasta, biscuit and bread processing and their products including moisture, total ash, crude protein and crude fat were analyzed according to AOAC official methods 925.09, 923.03, 979.09 respectively of the official methods of analysis of AOAC (2005) International. Total carbohydrates including crude fiber were calculated by difference. Crude protein and crude fat were analyzed using Kjeldahl block digestion and system distillation (2200 Kjeltec Autodistillation, Foss Tecator, Sweden) and Sox Tec Service Unit 1046 ( Foss Tecator, Sweden); respectively. The bread and biscuit products were analyzed for moisture, crude protein, crude fat, ash and total carbohydrate and water activity.
Moisture content: The moisture content of the wheat samples was determined by rapid moisture tester according to the method described by ICC No. 110/1. The samples were well mixed to attain uniformity and ground using laboratory grinder (Bühler). About 10 gram of the sample was placed in the moisture testing plate made of stainless steel. It was then placed in the oven for 10 minutes at a temperature of 130ºC.

The moisture content of flour samples, vital gluten, bread and biscuit products as well as non gluten flour were determined using infrared moisture analyzer (MBA 310, England) where 10 gm of each sample was spread on clean aluminum foil plate and placed in the moisture analyzer. The temperature of the tester was adjusted at a temperature of 130ºC and drying was carried out for 10 minutes.
Protein: The protein content of wheat samples was measured by grain analyzer (Minifra-2000T) where clean wheat samples were placed in a sample cell (cuvette) and protein content of the samples were read and recorded from the instrument. Protein content of the wheat flour, vital gluten powder and blended flours, bread and biscuit products were measured using kjeldahl apparatus according to the method described by ICC No105/2.
Fat: The fat content of vital gluten, bread and biscuit samples were determined using the soxhlet extraction method using petroleum ether as a solvent.
Ash: The ash content of wheat, flour and gluten samples were analyzed by burning the samples in a muffle furnace (Mr 170 E, Germany, 2004) at a temperature of 600ºC according to the ICC standard method ICC No 104/1.
Total carbohydrates: The total carbohydrate content of both the bread and biscuit products was determined by difference.
Granularity (particle size): The granularity of both wheat flour and gluten powder and the blends were determined by sieving 50 g of the samples using 180 mesh size sieves (ES 1052:2005). The percentage through (granulation) of each sample was then calculated using equation 1:
Where: Wth = weight of flour through the sieve, Wf = initial weight of flour
Color grade: The color grade value of the flour samples was measured to make sure the brightness of the flours. About 30 g of flour sample was placed in a beaker containing 50 ml distilled water and made in to a paste by continuously stirring it with a glass rod for 45 seconds. The paste was then poured in to the sample cell and the sample cell containing the paste was inserted into the instrument and then the result was displayed within 90 seconds.
Falling number: Both the wheat and flour samples were evaluated for falling number using the Hagberg falling number apparatus (model 1500, Sweden, Perten Instruments, 2005) according to the ICC standard No 107/1 for the determination of the amylase activity of cereal and flour.
Farinograph measurement: The farinograph values such as water absorption, stability, dough development, degree of softening and farinograph quality number of the flours of the three varieties and blended flours were measured using the Brabender Farinograph according to the standard method of ICC No 115/1 for the determination of the farinograph values of wheat flour. The instrument automatically determines the

amount of flour to be poured into the mixer of the farinograph based on the moisture content of the flour. The farinograph is equipped with a 300 g capacity mixer. Mixing was carried out for 20 minutes. The speed of the torque was adjusted to be 63 min-1.
Water activity analysis: The water activity of vital gluten powder, bread and biscuit samples were determined using Aqua Lab Lite water activity measuring unit manufactured by Decagon aw meter (Aqua Lab Lite, 2004). Each sample of the gluten powder, bread and biscuit samples were half filled in a small plastic cup supplied with the instrument and inserted in to the instrument. At last, the water activity of each sample was displayed automatically.
Sensory quality attributes of bread and biscuit products: The sensory attributes used to determine the sensory qualities of bread and biscuit samples include appearance, texture, flavor (taste + odor), color, crispiness and overall acceptability. The samples were evaluated by 25 trained consumer panelists to assess acceptability of the bread and biscuit samples using (a five-point hedonic scale) with 5 representing the highest score (excellent) and 1 the lowest score (poor) for every quality parameter. All samples for sensory evaluation were conducted at room temperature.
Experimental design: Data were analyzed using analysis of variance (ANOVA) followed by Least Significance Difference (LSD) at 5% level of significance. Statistical analysis was performed using SPSS/15 software for windows.
Results and Discussion
Effects of vital gluten enhancement on physico-chemical quality characteristics of blended flours for pasta production
The normal pasta flour prepared from foreign hard wheat currently used for pasta production by KFSC has a wet gluten content of 41.33% and a crude protein content of 13.30%. Local hard wheat flour blended with 3% VGP (3% VGP + HWF/ Hard Wheat Flour/) has a wet gluten content of 41.80% and a protein content of 14.20% (Table 2). The protein content of blended flours (3% VGP + HWF) had a higher protein than the normal pasta flour (14.20>13.3). The blend of wheat flour, corn flour and vital gluten powder (BFP1 + 6% VGP) can also be utilized for pasta production because this blended ratio of flour has produced 43.9% wet gluten and 15.85% protein. The results revealed that by blending (75% HWF + 25% CF) + 6% VGP it was possible to get higher wet gluten and protein than the normal pasta flour. The blend of 13% VGP and corn flour has given better protein content 19.07% flour than the normal flour but produced low wet gluten content. This may be due to the hindrance of corn husk particles present in corn flour caused by improper milling during the development of dough. The blend of 6% VGP and HWF has the highest wet gluten and protein contents which are 46, 67% and 16.12%; respectively. This blend of flour can produce the best pasta. Thus, from the blend ratios it can be deduced that the production of cooked pasta aldente quality to meet customer expectations and criteria for instance bright color, clean and smooth surface, firmness, springiness, lack of stickiness and cooking loss, tolerance to moderate overcooking and to have a high protein pasta is possible by incorporation of vital gluten powder in local hard wheat varieties.

Blended flours
Parameters
Moisture(% w/w)
Color grade
Wet gluten (% w/w)
Ash (%
w/w)
Protein ( % w/w)
FN (sec)
Particle size (< 180 µm)
PF 14.43 ± 0.42f
-.77 ± 0.57a
41.33 ± 0.45c
0.61 ± 0.01b
13.30 ± 0.51d
400 ± 0.00 98.6 ± 0.37
HWF 14.03 ± 0.06f
-2.33 ± 0.14a
35.03 ± 0.91e
0.55 ± 0.03a
11.27 ± 0.51e
387 ± 16 99.27 ± 0.35
CF 10.57 ± 0.38c
8.69 ± 0.14f ND 1.23 ±
0.05d7.43 ± 0.39f
272 ± 8 99.27 ± 0.49
HWF +3VGP 13.63 ± 0.06e
-0.56 ± 0.04a
41.8 ± 0.10c
0.64 ± 0.00b
14.20 ± 0.23c
359 ± 6 78.22 ± 0.11
CF +VGP 11.13 ± 0.15d
9.01 ± 0.16f ND 1.25 ±
0.06d8.81 ± 0.51f
273 ± 8 99.20 ± 0.07
BFP1 +3VGP 10.37 ± 0.15c
1.81 ± 0.08c
37.17 ± 0.35d
0.82 ± 0.03b
11.79 ± 0.25e
296 ± 15 99.55 ± 0.40
BFP2 +3VGP 9.10 ± 0.10b
4.27 ± 0.04d
27.90 ± 0.56f
1.10 ± 0.02c
11.10 ± 0.09e
261 ± 17 77.49 ± 0.94
HWF +6VGP 13.23 ± 0.12e
0.23 ± 0.09b
46.67 ± 0.87a
0.75 ± 0.01b
16.12 ± 0.16b
331 ± 2 97.90 ± 1.45
CF +6VGP 10.23 ± 0.06c
7.09 ± 0.06e
3.43 ± 0.70h
1.13 ± 0.01c
12.44 ± 0.28d
239 ± 15 64.63 ± 6.42
BFP1 +6VGP 10.50 ± 0.36c
1.95 ± 0.17c
44.03 ± 0.60b
0.90 ± 0.02c
15.85 ± 0.33b
291 ± 5 96.22 ± 5.12
BFP2 +6VGP 9.40 ± 0.10b
4.01 ± 0.04d
34.77 ± 2.08e
1.09 ± 0.04c
14.04 ± 0.17c
277 ± 5 99.53 ± 0.25
CF + 13VGP 8.26 ± 0.38a
9.11 ± 0.04f
16.60 ± 1.32g
1.30 ± 0.06d
19.07 ± 0.10a
232 ± 4 83.68 ± 13
All a-h values are means of triplicate ± SD on dry matter basis means followed by different superscript within the same raw differ significantly (P ≤ 0.05)Where: ND- not detected; PF: Pasta Flour; HWF: Hard Wheat Flour; CF: Corn Flour; VGP: Vital Gluten Powder; BFP1 = 75% HWF + 25% CF; BFP2 = 50% HWF + 50% CF
Table 2: Effects of vital gluten enhancement on physico-chemical quality characteristics of blended flours for pasta production (All values are in dry matter basis).
The color grade value and ash content of blended flours from wheat flour, corn flour and vital gluten powder is slightly higher than the normal flour. This is due to the fact that corn flour whose outer cover (husk) was not completely removed in this experiment. The color of corn flour can be adjusted by using proper corn milling process.
Farinograph values of blended flours for pasta production
The rheological properties of flour dough were measured by farinograph instrument and the results of farinograph values of blended flours for pasta production are
presented in Figures 2a-2e. The water absorption of the normal flours and those of the blended ones corrected to 14% moisture basis ranged between 58.5 and 65.0. The highest water absorption was recorded for BFP1 + 6VGP. The farinograph quality number ranged between 61 and 122 in that the highest value was recorded for PF. The highest values of stability and dough development were obtained for PF. The HWF + 3VGP and HWF+ 6VGP have exhibited the characteristics of strong flour with respect to farinograph quality number, stability and dough development time. Hence they are suitable for pasta production.
Figure 2a: Farinogram of normal pasta flour (PF).
Figure 2b: Farinogram of local hard wheat Flour.
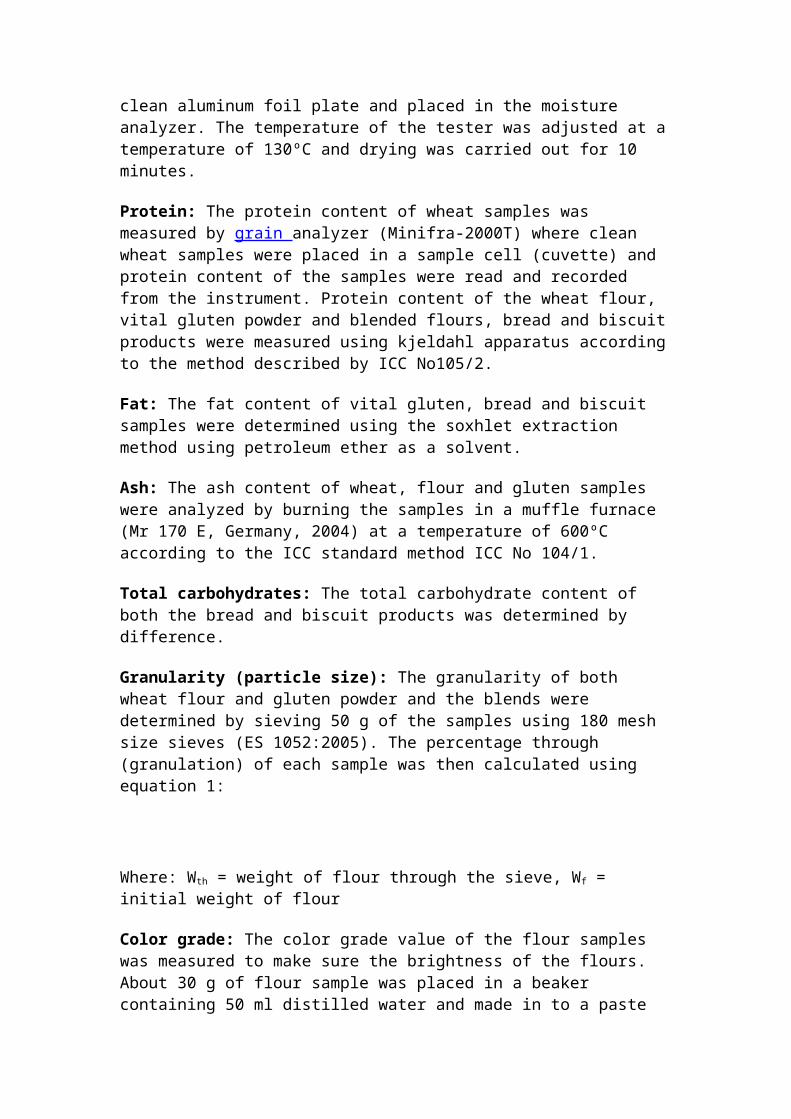
Figure 2c: Farinogram of HWF +3VGP.
Figure 2d: Farinogram of BFP1+6VGP.

Figure 2e: Farinogram of HWF +6VGP.
Effects of vital gluten enhancement on quality characteristics of blended flours for bread production
The moisture content of all blended flours ranged between 9.00 and 14.00 which are within the standard requirement as stated by Ethiopian standard (ES, 2005). The blend of CF + 12% VGP has the lowest moisture content while the normal soft wheat flour has showed the highest value. The blended flour of CF + 3% VGP has the highest color value 9.01 while the normal soft wheat flour has the lowest color grade value. Low values of color grade are the preferred value in producing white bread. Proper milling of corn must be carried out using corn mill to maintain the color value of flour.
The highest wet gluten value was obtained for the flour blend SWF + 6VGP which is presented in Table 2. The highest values can be preferred by bread bakers for they absorb much water, increase the protein content of bread, impart better gas retention and increase the volume of loaf [1,5]. The highest protein content of blended flours was recorded for BFB1 + 6% VGP (75% SWF + 25% CF + 6% VGP) while the lowest value was recorded for that of corn flour.
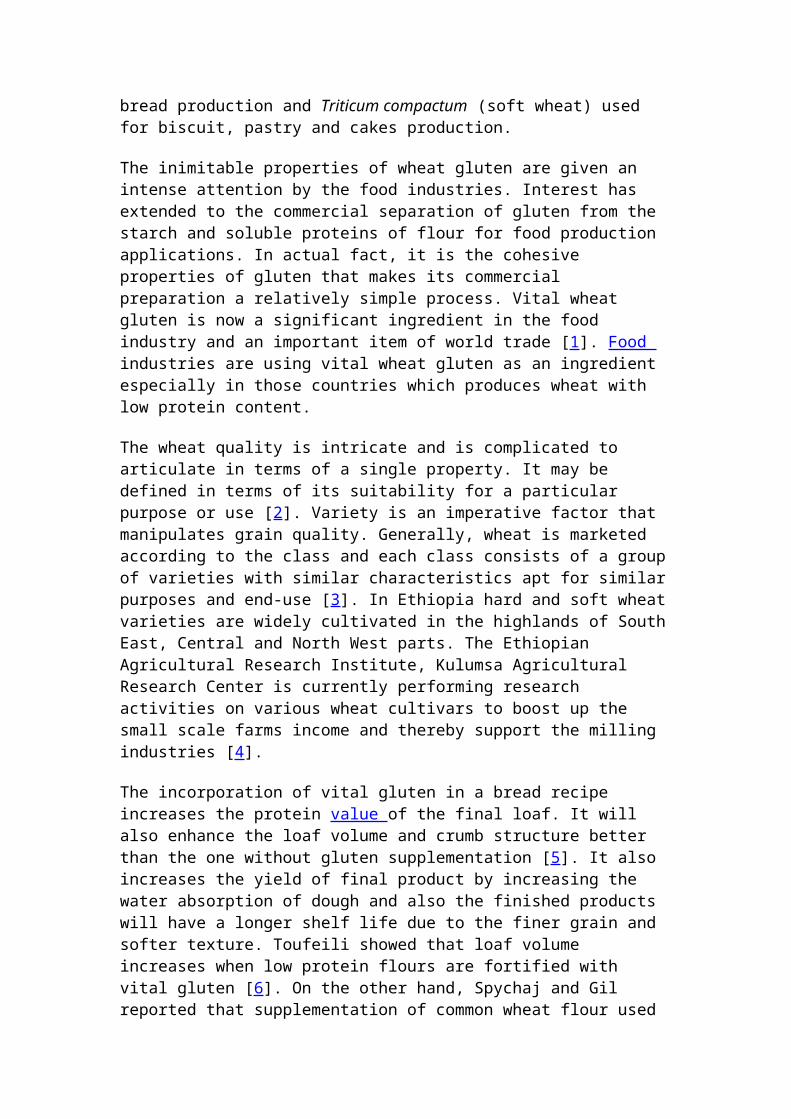
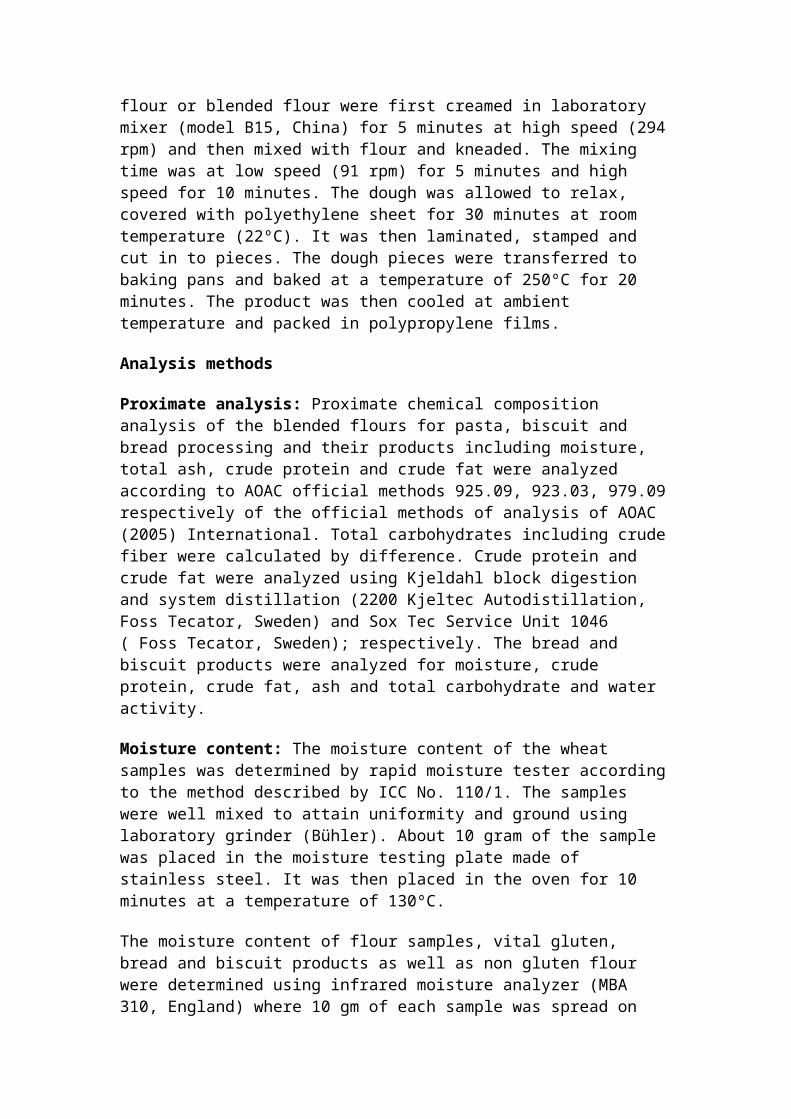
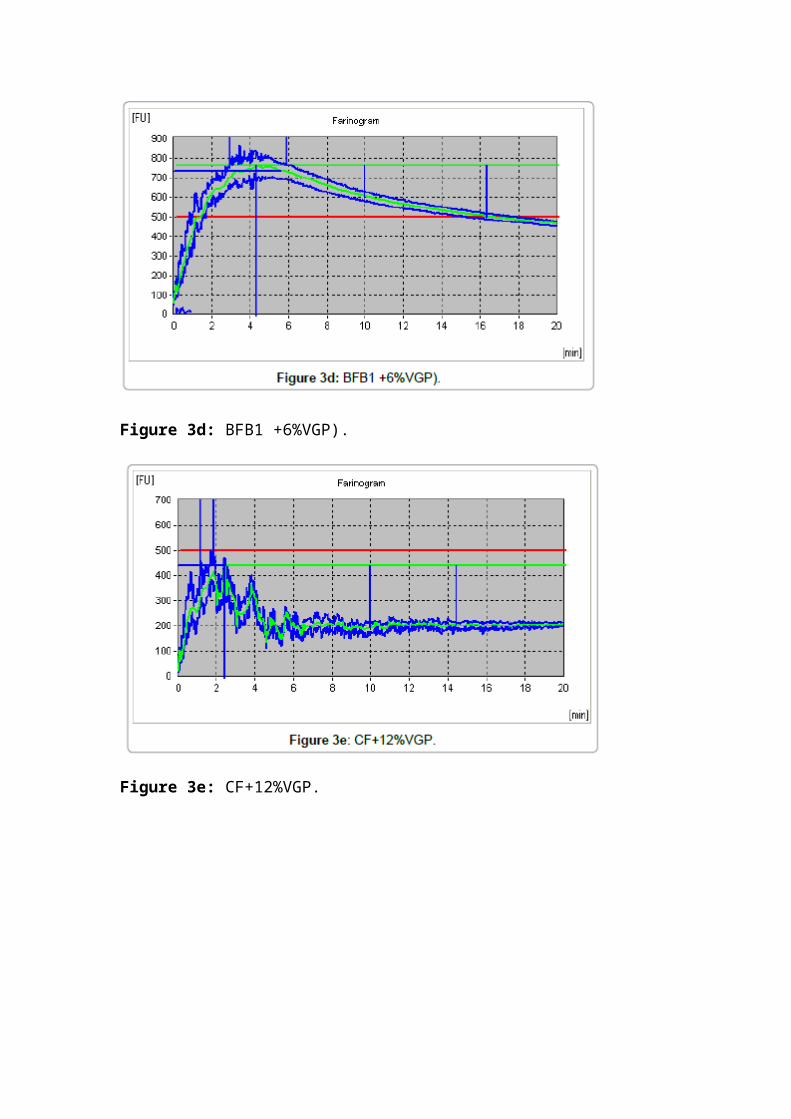
Farinograph values of blended flours for bread production
The Farinograph values of blended flours for bread production are presented in Figures 3a-3f. The flour blends SWF + 3% VGP has the highest stability (mixing tolerance) while the flour blend CF + 12% VGP has the lowest value. With regard to dough development, the highest value was recorded for BFB2 + 6% VGP. The flour blend SWF + 3% VGP has also the highest farinograph value indicating that the flour is strong flour. The highest values of stability, dough development and farinograph values of the flour indicate that this flour blend is strong flour and suitable for bread production [6]. The highest water absorption was recorded for the flour blend BFB2 + 6% VGP. This may be due to inclusion of corn flour in the blend. The lowest value

was achieved for the flour blend SWF + 3% VGP. Thus the flour blends SWF + 3% VGP, BFB1+ 3% VGP, SWF + 6% VGP and BFB1 + 6% VGP were suitable for bread production. It was also possible to incorporate 25% of corn flour in the bread production recipe.
Figure 3a: Soft wheat flour (SWF).
Figure 3b: Soft wheat flour + 3 % vital gluten powder.

Figure 3c: BFB1 +3%VGP
Figure 3d: BFB1 +6%VGP).

Figure 3e: CF+12%VGP.
Figure 3f: BFB2 +6%VGP.
The farinograms for CF + 12 VGP and BFB2 + 6% VGP blended flours indicates that they are abnormal curves as depicted in Figures 3e and 3f. This may be due to the fact that the inclusion of corn husk in the corn flour hindered the development of gluten.
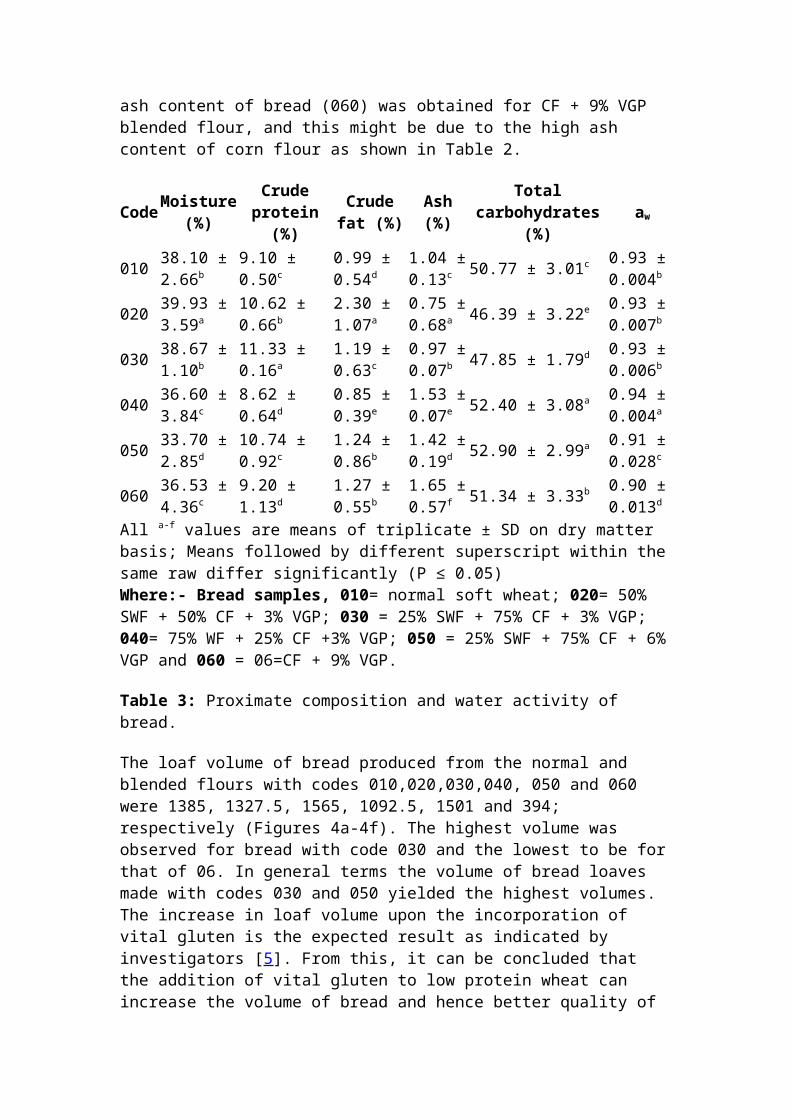
Proximate composition and water activity of bread products
The proximate composition and water activity of the normal and vital gluten supplemented flours were used in the production of bread. The proximate composition and aw of bread loaves are summarized in Table 3. The highest crude protein 11.33 was recorded for soft wheat flour supplemented with 3% VGP while the lowest was

for 50% SWF+ 50% CF + 6 VGP. Accordingly, the protein content of bread increased as a result of the addition of vital gluten. The crude fat content of all samples ranged between 0.99 and 2.30 where the highest fat content was recorded for BFB1 + 3% VGP. This may be due to the high oil content of corn flour which was prepared without de-germination of corn. The moisture content of bread ranged between 33.70 and 39.93 with the bread made with BFB1 + 3% VGP having the highest value. The values for all samples are optimal and may not have adverse effect on the quality attributes of bread (ES, 2005). The highest ash content of bread (060) was obtained for CF + 9% VGP blended flour, and this might be due to the high ash content of corn flour as shown in Table 2.
Code Moisture(%)
Crude protein (%)
Crude fat (%)
Ash(%)
Total carbohydrates (%) aw
010 38.10 ± 2.66b 9.10 ± 0.50c 0.99 ±
0.54d1.04 ± 0.13c 50.77 ± 3.01c 0.93 ±
0.004b
020 39.93 ± 3.59a 10.62 ± 0.66b 2.30 ±
1.07a0.75 ± 0.68a 46.39 ± 3.22e 0.93 ±
0.007b
030 38.67 ± 1.10b 11.33 ± 0.16a 1.19 ±
0.63c0.97 ± 0.07b 47.85 ± 1.79d 0.93 ±
0.006b
040 36.60 ± 3.84c 8.62 ± 0.64d 0.85 ±
0.39e1.53 ± 0.07e 52.40 ± 3.08a 0.94 ±
0.004a
050 33.70 ± 2.85d 10.74 ± 0.92c 1.24 ±
0.86b1.42 ± 0.19d 52.90 ± 2.99a 0.91 ±
0.028c
060 36.53 ± 4.36c 9.20 ± 1.13d 1.27 ±
0.55b1.65 ± 0.57f 51.34 ± 3.33b 0.90 ±
0.013d
All a-f values are means of triplicate ± SD on dry matter basis; Means followed by different superscript within the same raw differ significantly (P ≤ 0.05)Where:- Bread samples, 010= normal soft wheat; 020= 50% SWF + 50% CF + 3% VGP; 030 = 25% SWF + 75% CF + 3% VGP; 040= 75% WF + 25% CF +3% VGP; 050 = 25% SWF + 75% CF + 6% VGP and 060 = 06=CF + 9% VGP.
Table 3: Proximate composition and water activity of bread.
The loaf volume of bread produced from the normal and blended flours with codes 010,020,030,040, 050 and 060 were 1385, 1327.5, 1565, 1092.5, 1501 and 394; respectively (Figures 4a-4f). The highest volume was observed for bread with code 030 and the lowest to be for that of 06. In general terms the volume of bread loaves made with codes 030 and 050 yielded the highest volumes. The increase in loaf volume upon the incorporation of vital gluten is the expected result as indicated by investigators [5]. From this, it can be concluded that the addition of vital gluten to low protein wheat can increase the volume of bread and hence better quality of bread can be produced. The loaves of bread obtained from the normal and blended flours are shown in Figures 4a-4f.

Figure 4a: Bread from normal wheat.
Figure 4b: Bread from 75%SWF + 25 % CF + 3 % VGP

Figure 4c: Bread from SWF + 3 % VGP.
Figure 4d: Bread from (50%WF + 50 % CF) + 6 % VGP
Figure 4e: Bread from 75%WF + 25 % CF + 6% VGP.
Figure 4f: Bread from CF + 12 % VGP.

Effects of vital gluten enhancement on quality characteristics of blended flours for biscuit production
The moisture content of all flour samples ranged from 8.60% to 14.0% while the protein content ranged from 7.43 to 13.46%. Blended flours BFB1 + 3VGP, BFB2 + 3VGP< BFB3 + 3 VGP, BFB1 + 6 VGP, BFB2 + 6 VGP, BFB3 + 6VGP had high protein values (Table 4) which in turn were implicated in the final biscuit product. The color grade values were obtained to be between -0.13 to 9.01. Negative color grade values are quality indicator of brightness of flour [16].
Blended flours
Parameters
Moisture(%)
Color grade
Wet gluten (%)
Ash(%)
Protein( %)
FN(sec.)
Particle size (< 180 µ)
SWF 14.0 ± 0.15a
-0.13 ± 0.07a
27.67 ± 0.51c
0.59 ± 0.01a
10.53 ± 0.16d
344 ± 7a 100 ± 0.00a
CF 10.57 ± 0.00c
8.69 ± 0.14g ND 1.23 ±
0.05f7.43 ± 0.39f
278 ± 17b 99.27 ± 0.49a
CF + 3VGP 11.13 ± 0.15b
9.01 ± 0.16h ND 1.25 ±
0.05f8.81 ± 0.51e
273 ± 8b 99.20 ± 0.10a
BFB1 +3VGP 11.70 ± 0.30b
2.52 ± 0.29b
29.8 ± 0.26b
0.83 ± 0.03b
13.10 ± 0.40a
277 ± 15b 97.63 ± 1.88c
BFB2+3VGP 10.80 ± .20c
2.52 ± 0.29b
21.1 ± 0.10e
0.94 ± 0.02c
13.20 ± 0.09a
258 ± 5c 77.9 ± 0.90e
BFB3+3VGP 10.13 ± 0.12c
5.46 ± 0.34e
8.43 ± 2.54f
1.06 ± 0.05d
11.75 ± 0.20c
252 ± 1c 69.43 ± 7.47f
CF + 6VGP 10.23 ± 0.06c
7.09 ± 0.06f ND 1.13 ±
0.01e12.44 ± 0.28b
239 ± 15e 64.63 ± 6.43f
BFB1 + 6VGP 11.70 ± 0.00b
3.17 ± 0.42c
31.23 ± 0.38a
0.80 ± 0.01b
13.46 ± 0.25a
270 ± 4b 98.5 ± 1.57b
BFB2 + 6VGP 10.73 ± 0.15c
4.69 ± 0.24d
22.20 ± 0.53d
0.91 ± 0.01c
12.43 ± 0.38b
255 ± 6c 98.17 ± 0.59b
BFB3+6VGP 9.63 ± 0.25d
6.23 ± 0.46f
6.60 ± 2.10g
1.03 ± 0.03d
12.23 ± 0.64b
247 ± 7d 87.13 ± 6.03d
CF + 9VGP 8.60 ± 0.20e
7.67 ± 0.09f ND 1.19 ±
0.06e11.44 ± 0.36c
242 ± 1d 88.46 ± 5.75d
All a-g values are means of triplicates ± SD; Means followed by different superscript within the same raw differ significantly (P ≤ 0.05).
Table 4: Effects of vital gluten enhancement on quality characteristics of blended flours for biscuit production (All values are in dry matter basis).
The more negative color grade value, the brighter is the flour (Color Grader Series 4 PCGA ,1997). The visco-elasticity of flour is less demanded by biscuit producers as a result of which the farinograph values of blended flours for biscuit were not determined.
Proximate composition and water activity of biscuit products

The protein content of biscuit products ranged from 8.83 to 11.76% (Table 5) and this result has similarity with the findings obtained by Olaoye [17]. The highest value was recorded for the product with code 060 (CF+ 9% VGP) while the lowest value was for 010(normal soft wheat flour). Thus, incorporation of vital gluten in to soft wheat flour or corn flour and the blend of both would improve the nutritional value of biscuit. The highest fat content of biscuit was obtained for product with code 060 and the same was true for the ash content. The highest total carbohydrate value was obtained for the biscuit with code 050(25% SWF + 75% CF + 6%VGP). From the proximate composition analysis it was observed that biscuit product with better protein was obtained by enhancing soft wheat and corn flours with vital gluten. It was also possible to incorporate corn flour up to 75% in the biscuit production recipe.
Code Moisture (%)
Crude protein (%)
Crude fat (%) Ash (%) Total
carbohydrates (%) aw
010 9.35 ± 0.21a 8.83 ± 0.51d 4.28 ± 0.32d
1.20 ± 0.18d 76.34 ± 0.89b 0.55 ±
0.02d
020 5.87 ± 0.57d 9.45 ± 0.12c 4.27 ± 0.30d
1.33 ± 0.34e 79.09 ± 0.27a 0.45 ±
0.01b
030 7.68 ± 0.59c 9.31 ± 0.40c 5.85 ± 0.28b
1.21 ± 0.19d 75.96 ± 0.60c 0.52 ±
0.01c
040 8.57 ± 0.59b 10.74 ± 0.33b 4.57 ± 0.48c
0.88 ± 0.18a 75.23 ± 0.95c 0.54 ±
0.01d
050 4.47 ± 0.12e 10.27 ± 0.33b 4.46 ± 0.23c
1.00 ± 0.33b 79.80 ± 0.69a 0.37 ±
0.03a
060 5.89 ± 0.62d 11.76 ± 0.24a 6.46 ± 0.89a
2.11 ± 0.51c 73.78 ± 0.96d 0.44 ±
0.01b
All a-e values are means+SD of triplicates;-Means followed by different superscript within the same raw differ significantly (P ≤ 0.05)Where:- Biscuit samples, 010= normal soft wheat; 020= 50%SWF + 50 % CF + 3 % VGP; 030 = 25% SWF + 75% CF + 3% VGP; 040= 75%WF + 25 % CF + 3% VGP; 050 = 25% SWF + 75% CF + 6 % VGP and 060 = 06= CF + 9% VGP
Table 5: Proximate composition and water activity of biscuit (All values are in dry matter basis).
Sensory quality evaluation of bread and biscuit
The sensory hedonic mean scores of the bread and biscuit samples are presented in Tables 6 and 7. The mean scores for sensory attributes decreased in increasing the proportion of corn flour in the blend. The highest value was recorded for bread made with 3%VGP and SWF while the lowest value was for 12% VGP and CF. Based on the sensory quality evaluation, bread made with 3% VGP and soft wheat flour is the best quality bread which fulfilled most of the quality attributes. The samples with code 010, 020, 030 and 050 are generally acceptable by consumers while the samples with code 040 and 060 were less acceptable by the panelists due to their appearance, texture and flavor or overall acceptability.
Types of bread Sensory attributesAppearance Texture Flavor Overall acceptability
010 4.07 ± 0.76a 4.27 ± 0.76a 4.07 ± 0.76b 3.93 ± 0.81b
020 4.13 ± 0.46a 3.97 ± 0.40b 4.00 ± 0.35b 4.10 ± 0.52a
030 4.20 ± 0.20a 4.20 ± 0.20a 4.40 ± 0.53a 4.13 ± 0.12a
040 1.87 ± 0.12c 1.47 ± 0.12d 2.53 ± 0.23d 1.47 ± 0.12d
050 3.07 ± 0.12b 3.33 ± 0.12c 3.67 ± 0.23c 3.67 ± 0.12c
060 1.33 ± 0.12d 1.27 ± 0.12e 1.80 ± 0.20e 1.20 ± 0.00e
All a-e values are means of triplicates+SD; Means followed by different superscript within the same raw differ significantly (P ≤ 0.05)
Table 6: Sensory quality evaluation of bread.
Types of biscuit
Sensory attributes
Color Appearance Texture Flavor Taste Overall acceptability
010 3.80 ± 0.20a 4.33 ± 0.23a 4.27 ±
0.12a4.00 ± 0.20a
4.33 ± 0.31a 4.27 ± 0.12a
020 3.13 ± 0.70c 3.00 ± 0.20b 3.07 ±
0.31c3.13 ± 0.12c
3.27 ± 0.31c 3.00 ± 0.53c
030 3.27 ± 0.42b 2.87 ± 0.31c 2.87 ±
0.31d3.00 ± 0.35d
2.87 ± 0.12e 2.87 ± 0.50d
040 2.80 ± 0.53d 2.87 ± 0.12c 3.00 ±
0.20c3.20 ± 0.20b
3.13 ± 0.31d 3.07 ± 0.31c
050 3.73 ± 0.12 3.33 ± 0.12 3.33 ±
0.42b3.13 ± 0.23c
3.67 ± 0.70b 3.40 ± 0.40b
060 2.87 ± 0.31 2.33 ± 0.64 2.67 ±
0.64d2.47 ± 0.81d
2.80 ± 0.40e 2.33 ± 0.23e
All a-e values are means of triplicates+SD; Means followed by different superscript within the same raw differ significantly (P ≤ 0.05)Where:- Biscuit samples: 010= normal soft wheat; 020= 50% SWF + 50% CF + 3% VGP; 030 = 25% SWF + 75% CF + 3 % VGP; 040= 75%WF + 25% CF +3% VGP; 050 = 25% SWF + 75% CF + 6% VGP and 060 = 06= CF + 9% VGP
Table 7: Sensory quality attributes of biscuit.
The sensory hedonic mean scores of the biscuit samples are shown in Table 7. The mean scores decreased in increasing the proportion of corn flour in the blend. The highest value 4.33 was recorded for biscuit made with the normal soft wheat flour while the lowest value 2.33 was for 9% VGP and CF mixed flour.
From the results obtained it is possible to produce biscuits with good overall acceptability by most blending ratios except for the blend CF+ 9%VGP. The blend CF + 9% VGP have low overall acceptability.
Conclusion
The enrichment of vital gluten powder to local wheat varieties flours which have low protein (10.53%) or the blends of wheat flour and corn flour were satisfactory in producing better protein flours (14.20%) for pasta and bread manufacturing. The

enrichment of vital gluten with corn flour produced acceptable protein blended flour. However, it is hardly possible to get a good yield of wet gluten from the blend of corn flour and vital gluten due to the oily nature and husk inclusion in the corn flour. This problem can perhaps be avoided using typical corn milling machines.
In the formulation of value added food products (pasta, bread and biscuit) the enhancement of vital gluten revealed appreciable results. An equivalent flour quality as compared with the imported pasta wheat flour was obtained from the blends. It is therefore possible to incorporate vital gluten to local hard wheat varieties for the production of pasta without importing foreign wheat for pasta production. The utilization of corn in the production of pasta was acceptable up to a percentage of 25% together with wheat flour and vital gluten powder.
Increased volume (1565 cm3) and nutritional quality bread products were obtained from the blends of vital gluten and soft wheat flour, and corn flour without alteration of the normal bread production process. The research work has indicated that the utilization of locally available wheat varieties via enhancement with vital gluten powder for the production of value added products. The sensory evaluation of bread and biscuit samples showed acceptable results by panelists.
Furthermore, the present research encourages food technologists, breeders and agronomists in various Agricultural Research Centers and Higher Learning Institutes, who are currently striving hard to release high quality wheat varieties which in turn boost up wheat growers to produce large quantities of wheat from potential areas and win over import substitution.
References
1. Day L, Augustine MA, Batey IL, Wrigley CW (2006) Wheat gluten uses and Industry needs. Trends in Food Science and Technology 17: 82-90.
2. PashaI, Anjum FM, Morris CF (2010) Grain hardness: A major determinant of wheatquality. Food Science and Technology International 16: 511-522.
3. Halverson J, Zeleny L (1988) Criteria of wheat quality. In: Pomeranz Y (ed). Wheat Chemistry and Technology. St Paul. MN.
4. Crop Development Department (2005) Crop Variety Register, Addis Ababa, Ethiopia.
5. Czuchajowska Z, Paszczynska B (1996) Is wet gluten good for baking? Journal Cereal Chemistry 73: 483-489.
6. Toufeili I, Ismail B, Shadarevian S, Baalbaki R, Khatkar Bet al.(1999) The role of gluten proteins in the baking of Arabic Bead. Journal of Cereal Science 30: 255-265.
7. Spychaj R, Gil Z (2005) Effects of adding dry gluten powder to common wheat flour on the quality of pasta. Electronic Journal of Polish Agricultural Universities 8.
8. ICC (2000) Association of International Cereal science and Technology. Vienna, Austria.
9. Nordson BKG GmbH(2006) Instruction manual of farinograph-E with USB port. Duisburg, Germany.
10. KFSC (2006) Kaliti food share company (KFSC) quality analysis report of wheat collected from Arsi and Bale Agricultural Development Enterprises.Addis Ababa, Ethiopia.
11. Mekuria B, Admassu S (2012) Grain quality evaluation and characterization of vital gluten powder from bread wheat varieties grown in Arsi and Bale, Ethiopia. East African Journal of Sciences 5: 35-41.
12. Kovacs MIP, Fu BX, Woods SM, Khan K (2004) Thermal stability of wheat gluten protein: its effect on dough properties and noodle texture. Journal of Cereal Science 39: 9-19.
13. Federation of bakers (2002) The Federation of Bakers of the UK's largest baking companies manufacture sliced and wrapped bread, bakery snacks and other products.
14. Edema MO, Sanni LO, Abiodun I (2005) Evaluation of Maize-soybean flour blends for sour maize bread production in Nigeria. African Journal of biotechnology 4: 911-918.
15. Olaoye OA, Onilude AA, Idowu OA (2006) Quality characteristics of bread produced from composite flours of wheat, plantain and soy beans. African Journal of Biotechnology 5: 1102-1106.
16. Technical manual of Color Grader (Series 4) PCGA (1997). Satake Corporation UK Division, England.
17. Olaoye OA, Onilude AA, Oladoye CO (2008) Breadfruit flour in biscuit making: effects on product quality. African Journal of Food Science1 : 20-23.