€¦ · web viewglobal terrorism database (gtd) unodc world drug report. global report on...
TRANSCRIPT
GROUP OF INDICATORS
PRESENCE OF: INDICATOR PRODUCED BY:
MEASURES: RÉSULTATS POUR LE BURUNDI
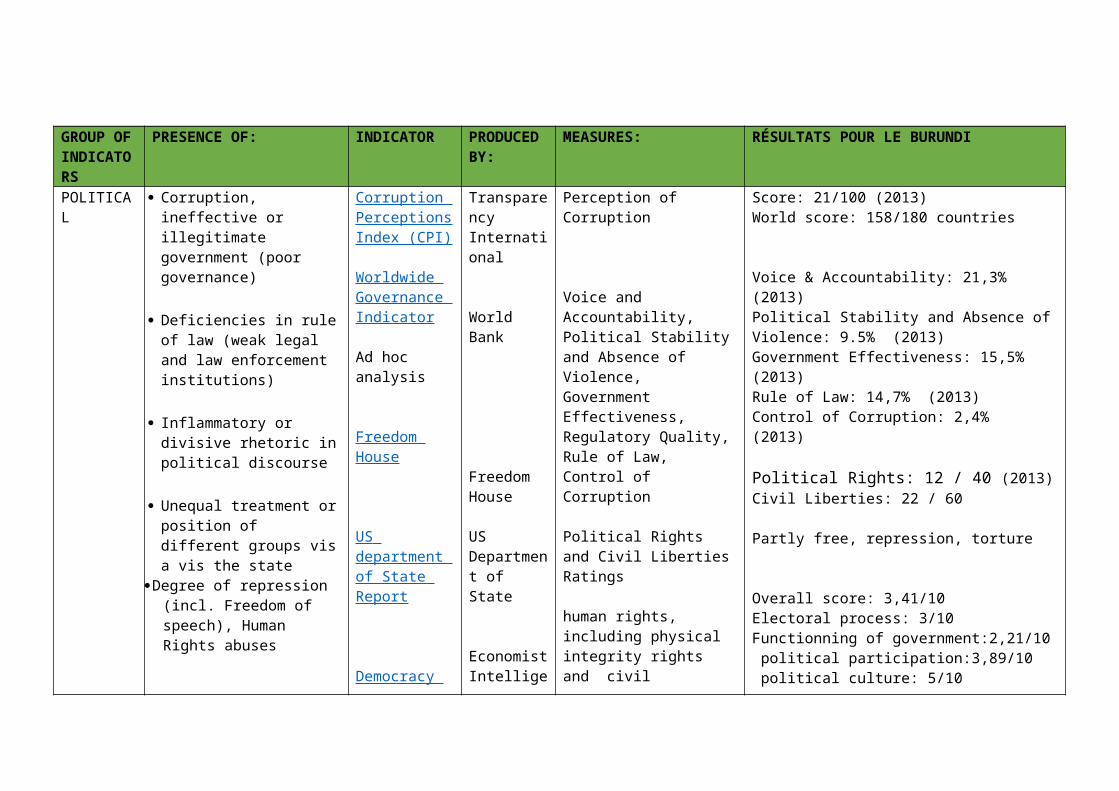
POLITICAL Corruption, ineffective or illegitimate government (poor governance)
Deficiencies in rule of law (weak legal and law enforcement institutions)
Inflammatory or divisive rhetoric in political discourse
Unequal treatment or position of different groups vis a vis the state
Degree of repression (incl. Freedom of speech), Human Rights abuses
Level of democracy
Liberté de la presse
Corruption Perceptions Index (CPI)
Worldwide Governance Indicator
Ad hoc analysis
Freedom House
US department of State Report
Democracy Index
Indice de liberté de la presse
Transparency International
World Bank
Freedom House
US Department of State
Economist Intelligence Unit
Reporters sans frontières
Perception of Corruption
Voice and Accountability, Political Stability and Absence of Violence, Government Effectiveness, Regulatory Quality, Rule of Law, Control of Corruption
Political Rights and Civil Liberties Ratings
human rights, including physical integrity rights and civil liberties
Electoral process, Functionning of government, political participation, political culture, civil liberties
Degré de liberté des groupes de presse et efforts du gouvernement pour la faire respecter
Score: 21/100 (2013)World score: 158/180 countries
Voice & Accountability: 21,3% (2013)Political Stability and Absence of Violence: 9.5% (2013)Government Effectiveness: 15,5% (2013)Rule of Law: 14,7% (2013)Control of Corruption: 2,4% (2013)
Political Rights: 12 / 40 (2013)Civil Liberties: 22 / 60
Partly free, repression, torture
Overall score: 3,41/10Electoral process: 3/10Functionning of government:2,21/10 political participation:3,89/10 political culture: 5/10civil liberties: 2,94/10
Liberté de la presse: 57,8%

SOCIAL Fragmentation along religious or ethnic lines
Unequal income distribution/socio/economic gaps
Health, Education and Living Standards
GrowUp
GINI index
Human Development Index
Swiss Federal Institute of Technology
UNDP
Distribution of ethnic groups by country
Degré auquel la Répartition des revenus entre les individus ou les ménages d’un pays s’écarte
Life expectancy, Schooling, Gross National Income
Since 2009, situation is green with Hutu as Senior Partner and Tutsi as Junior partner (2011)
Gini Coefficient : O, 42/1
Human Development Index: 0,355 (2012)
ECONOMIC Negative or slow GDP growth
Low income/poverty
High Unemployment Rate
High Inflation rate
GDP Growth
Multidimensional Poverty Index
Unemployment Rate
Inflation , GDP Deflator
World Bank
UNDP
World Bank
World Bank
GDP
Life expectancy, Schooling, Gross National Income
Share of the labor force that is without work
Inflation rate
GDP per capita: 280 USD (2013)GDP Growth: 4,5% (2013)
Life expectancy: 54 (2012)Population in severe poverty: 61,9% (2013)Taux brut de scolarisation: 64,0% (2010)
7,7% (2010-2014)
13.5% (2010-2014)
DISASTER/CATASTROPHY/HUMANITAR
Epidemics, pandemics Global Health Observatory Data
World Health Organization
50 datasets on priority health topics
Malaria: 2151076 cases (2012), 2263 death (2012)
IAN Exposure to natural disasters,
Weak crisis response infrastructure
both environmental public health and ecosystem vitality
Food or water scarcity
Large Numbers of Refugees, IDps
UN World Risk Index
Environmental Performance Index
Food Price Index
UNHCR Database
The United Nations University (UNU)
Yale University
Food and Agriculture Organization
UNHCR
Exposure, susceptibility, coping capacities and adaptive capacities.
Environmental Health, Water, Air Pollution, Biodiversity and Habitat, Forests, Fisheries, Agriculture, Climate Change
Average of 5 commodity group price indices (meat, dairy, cereals,oil and fat, sugar)
Number of IDP, Refugees
World Risk Index: 11,56%, Exposure: 16, 09%Lack of coping capacities: Burundi 90.68%Vulnerability: Burundi 71.82% (rank: 9: 172)Susceptibility: 63,88%
Overall Score: 25,7/100 (rank: 167/172)Health Impacts : 18,1%, Air Quality : 59,95%Water and Sanitation : 16,63%Agriculture: 88%Forest: 22,83%Bio diversity and Habitat: 30,29%
Confer to the doc below17/10/2014: Tanzanie naturalise 162 000 anciens réfugiés Burundais
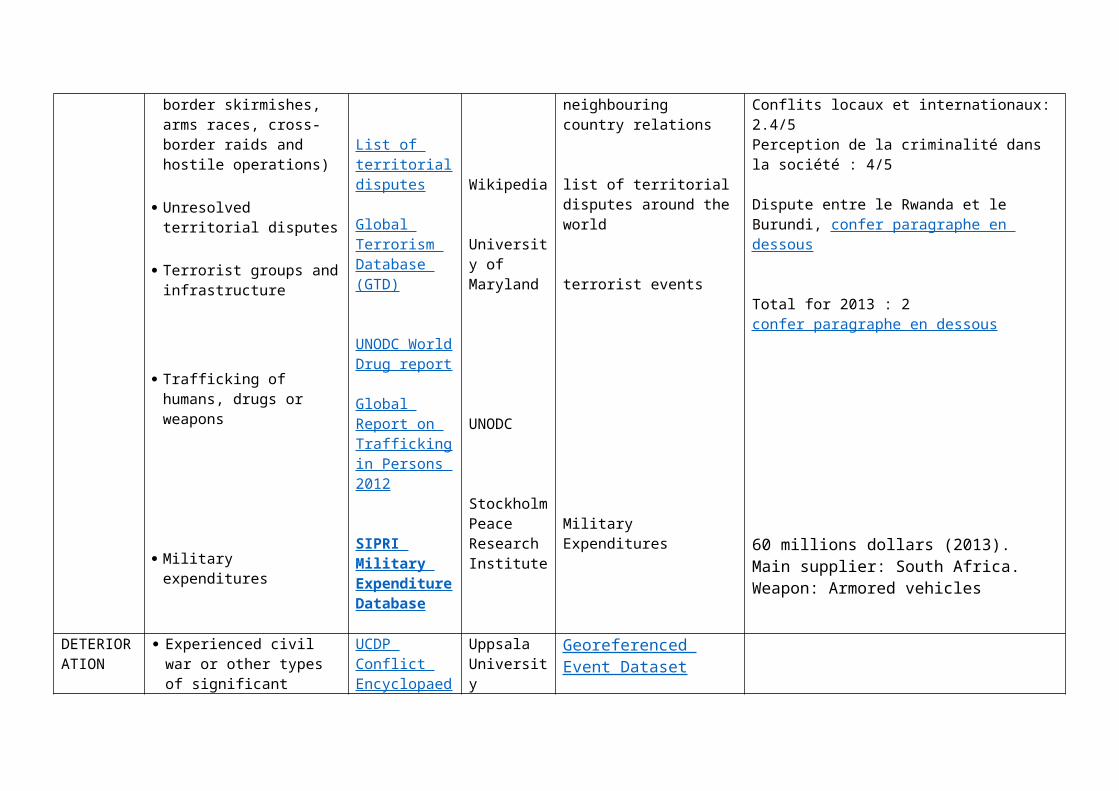
SECURITY Regional instability or overt conflict
Inter-state tensions or conflict (incl. Aggressive rhetoric, border skirmishes, arms races, cross-border raids and hostile operations)
Unresolved territorial disputes
Terrorist groups and infrastructure
UNHCR data
Global Peace Index
List of territorial disputes
Global Terrorism Database (GTD)
UNHCR
Institute for Economics and Peace
Wikipedia
University of Maryland
Presence de conflits limitrophes
Military expenditures, weapons imports, neighbouring country relations
list of territorial disputes around the world
terrorist events
Conflit au Sud KivuConfer to the doc below
Global Peace Index: 2.4/5 (Classement : 130/162)Militarisation: 2/5Société et sécurité: 2.5/5Conflits locaux et internationaux: 2.4/5Perception de la criminalité dans la société : 4/5
Dispute entre le Rwanda et le Burundi, confer paragraphe en dessous
Total for 2013 : 2confer paragraphe en dessous

Trafficking of humans, drugs or weapons
Military expenditures
UNODC World Drug report
Global Report on Trafficking in Persons 2012
SIPRI Military Expenditure Database
UNODC
Stockholm Peace Research Institute
Military Expenditures60 millions dollars (2013). Main supplier: South Africa. Weapon: Armored vehicles
DETERIORATION
Experienced civil war or other types of significant violence in the last 15 years
UCDP Conflict Encyclopaedia
Uppsala University
Georeferenced Event DatasetArmed Conflict DatasetUCDP Non State Conflict...
2004-2008: Palipehutu-FNL
Commerce Business environment Doing Business database
World Bank Facilité de faire des affaires ( création d’entreprise, Octroi Permis de construire, raccordement à l’éléctricité, transfert de propriété, obtention de prêt, protection des investisseurs, paiementes des taxes et impots, commerce transfrontalier, execution des contrats, reglement de l’insolvabilité
Doing Business Index: 51,07% (rank: 152/182)Creation d’entreprise: 94,25% (rank: 18/182)Octroi Permis de construire : 64,16% (rank : 146) raccordement à l’éléctricité : 35% (rank : 178 transfert de propriété : 77,8% (rank : 52)obtention de prêt : 10% (rank : 169/182) protection des investisseurs : 51,67% (rank : 91) paiementes des taxes et impots : 64,4% (rank : 126) commerce transfrontalier : 33,52% (rank : 171) execution des contrats : 42,15% (rank : 158) reglement de l’insolvabilité : 30,7% (rank :
Business environment Bertelsmann Stiftung’s Transformation Index
Bertelsmann Stiftung
Management and business
142)
Management : 4,14/ 10 (rank : 91)( ressource efficiency : 3,3/10Consensus building : 4/10International Cooperation : 5,7/10Market Economy : 4,11/10
Compléments
Population
Population : 9,850 millions (2012)
Superficie (en Km carrés) : 27,834 km2
Langues : Kirundi, Français
Accroissement annuel de la population : 2,4 % (2012)
Espérance de vie à la naissance : 50,9 ans (2012)
Population urbaine : 11,2%
Taux de pauvreté national : 66,9% (2006). Projection 45% en 2015
PIB par habitant : 250,97 USD (2012)

Indicateur de développement humain (IDH)1 : 0,355 (2012)
Economie
Le Burundi fait partie des économies les moins développées, classé 185ème sur 187 en 2011 pour
l’IDH. Les épisodes de guerre civile entre1993 et 2005 ont provoqué une longue période de stagnation
économique, qui a entraîné une paupérisation de la société burundaise.
L’agriculture occupe 90 % de la population active du Burundi. Deux cultures de rente concentrent la
majorité des exportations du pays : le café (72% des exportations) et le thé (16%).
La production de thé, en progression constante depuis 5 ans, est prévue à 9000 tonnes pour 2011. Le
thé burundais est un thé d’altitude potentiellement de très bonne qualité. La filière, dominée par
l’Office du Thé du Burundi (OTB, entreprise publique), fait l’objet d’un processus de libéralisation et
de privatisation
1 L'IDH est un indice composite, sans dimension, compris entre 0 (exécrable) et 1 (excellent). Il est calculé par la moyenne de trois indices quantifiant respectivement3 : la santé / longévité (mesurées par l'espérance de vie à la naissance), qui permet de mesurer indirectement la satisfaction des besoins matériels essentiels tels que
l'accès à une alimentation saine, à l'eau potable, à un logement décent, à une bonne hygiène et aux soins médicaux. En 2002, la Division de la population des Nations Unies a pris en compte dans son estimation les impacts démographiques de l'épidémie du sida pour 53 pays, contre 45 en 2000 ;
le savoir ou niveau d'éducation. Il est mesuré par la durée moyenne de scolarisation pour les adultes de plus de 25 ans et la durée attendue de scolarisation pour les enfants d'âge scolaire. Il traduit la satisfaction des besoins immatériels tels que la capacité à participer aux prises de décision sur le lieu de travail ou dans la société ;
le niveau de vie (logarithme du revenu brut par habitant en parité de pouvoir d'achat), afin d'englober les éléments de la qualité de vie qui ne sont pas décrits par les deux premiers indices tels que la mobilité ou l'accès à la culture.

Budget 2014 : Dons budgétaires
Contributeur Montant (FBU)1 Banque Mondiale (BM) 40 775 000 0002 Union Européenne (UE) 30 534 000 0003 Banque Africaine de Développement (BAD) 22 899 240 0004 France 6 543 000 000Source : Budget Général de la République du Burundi, exercice 2014
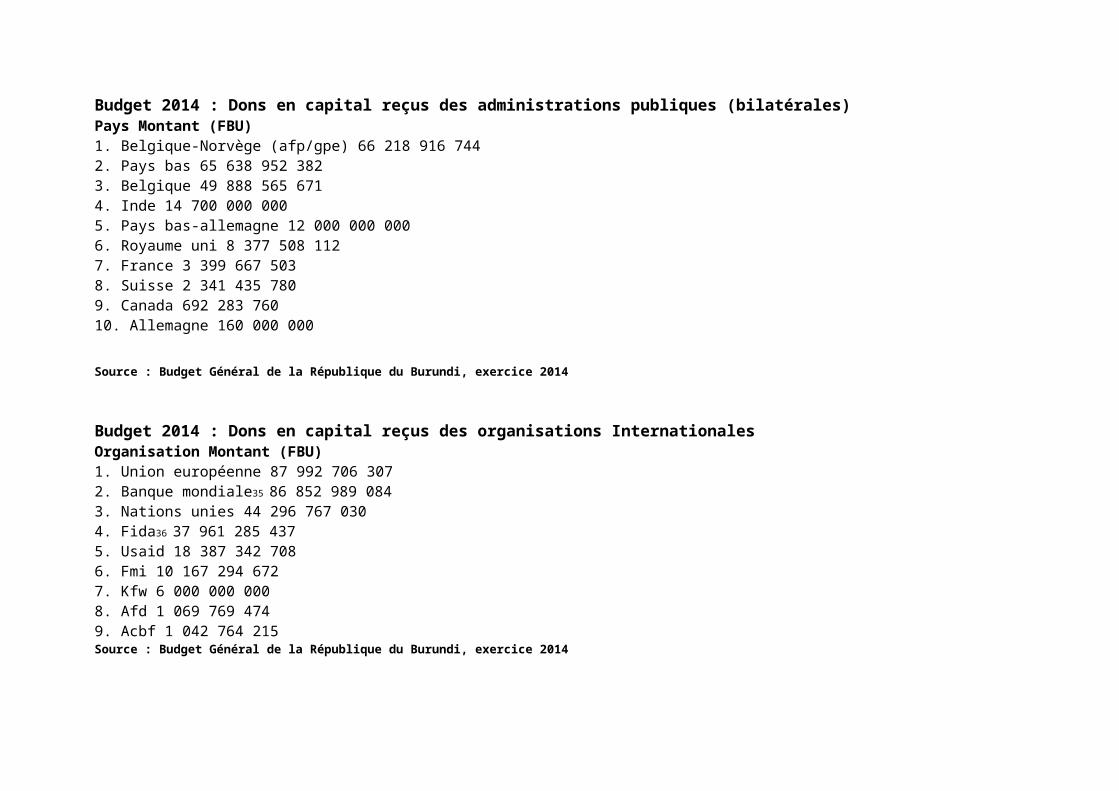
Budget 2014 : Dons en capital reçus des administrations publiques (bilatérales)Pays Montant (FBU)1. Belgique-Norvège (afp/gpe) 66 218 916 7442. Pays bas 65 638 952 3823. Belgique 49 888 565 6714. Inde 14 700 000 0005. Pays bas-allemagne 12 000 000 0006. Royaume uni 8 377 508 1127. France 3 399 667 5038. Suisse 2 341 435 7809. Canada 692 283 76010. Allemagne 160 000 000
Source : Budget Général de la République du Burundi, exercice 2014
Budget 2014 : Dons en capital reçus des organisations InternationalesOrganisation Montant (FBU)1. Union européenne 87 992 706 3072. Banque mondiale35 86 852 989 0843. Nations unies 44 296 767 0304. Fida36 37 961 285 4375. Usaid 18 387 342 7086. Fmi 10 167 294 6727. Kfw 6 000 000 0008. Afd 1 069 769 4749. Acbf 1 042 764 215Source : Budget Général de la République du Burundi, exercice 2014


IDEEn termes d'investissements internationaux, l’investissement direct étranger (IDE) au Burundi est passé d'une moyenne de 0,5 million de $EU en 1999 à 10 millions de $EU en 2009 (CNUCED, 2010), une augmentation de vingt fois en 10 ans. Cela est dû en grande partie à la stabilisation de la situation politique et aux mesures prises par le gouvernement ces dernières années pour attirer les IDE
Electricity
Electricity production
country comparison to the world: 188
Electricity - consumption:
country comparison to the world: 184
Electricity - imports:
80 million kWh (2010 est.)
Commerce
Imports - partners:
Saudi Arabia 11.3%, Belgium 10.1%, China 9.1%, India 7.9%, Tanzania 6.5%, Kenya 6%, Uganda 5.7%, Zambia 4.6%, US 4.1% (2012)
Imports: $867.2 million (2013 est.)
country comparison to the world: 181
$886.2 million (2012 est.)
Imports - commodities: capital goods, petroleum products, foodstuffs
152 million kWh (2010 est.)
221.4 million kWh (2010 est.)

Exports:
$122.8 million (2013 est.)
$134.7 million (2012 est.)
Export partners
Switzerland 23.9%, UK 12.9%, Belgium 7.4%, Pakistan 7.4%, Democratic Republic of the Congo 7.4%, Uganda 5.6%, Germany 5.2%, China 4.9%, Egypt 4.7% (2012)
Exports - commodities: coffee, tea, sugar, cotton, hides


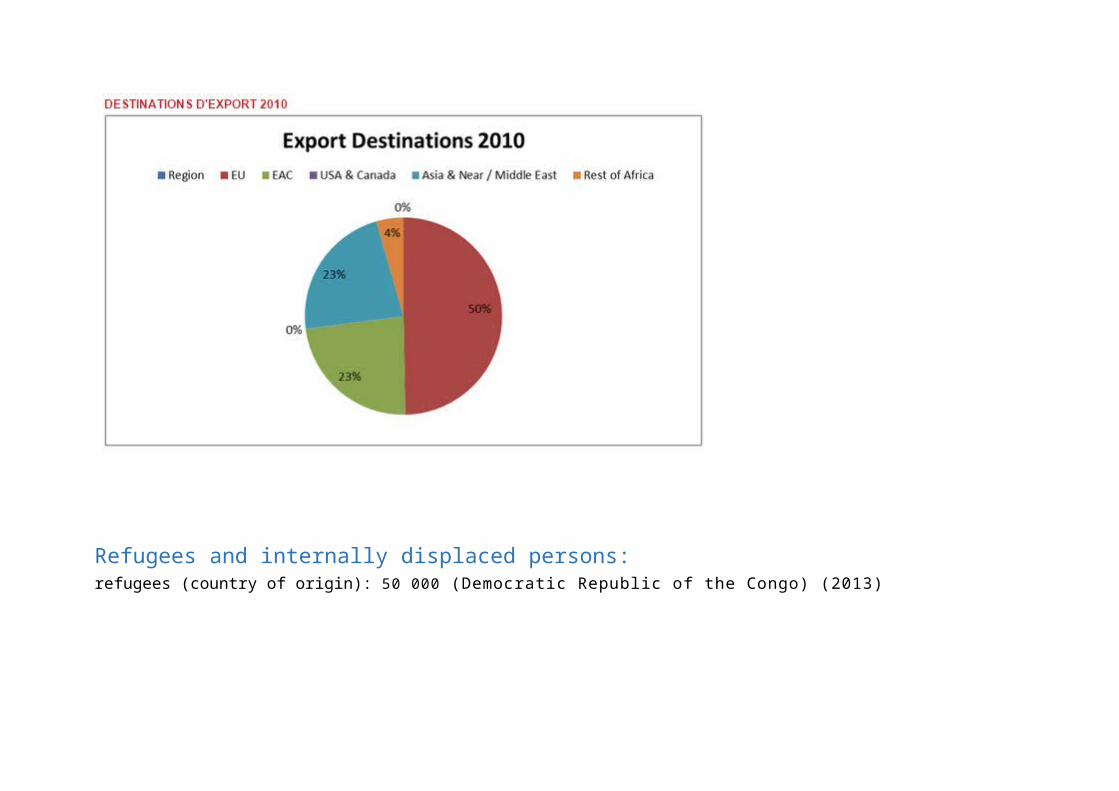
Refugees and internally displaced persons:refugees (country of origin): 50 000 (Democratic Republic of the Congo) (2013)

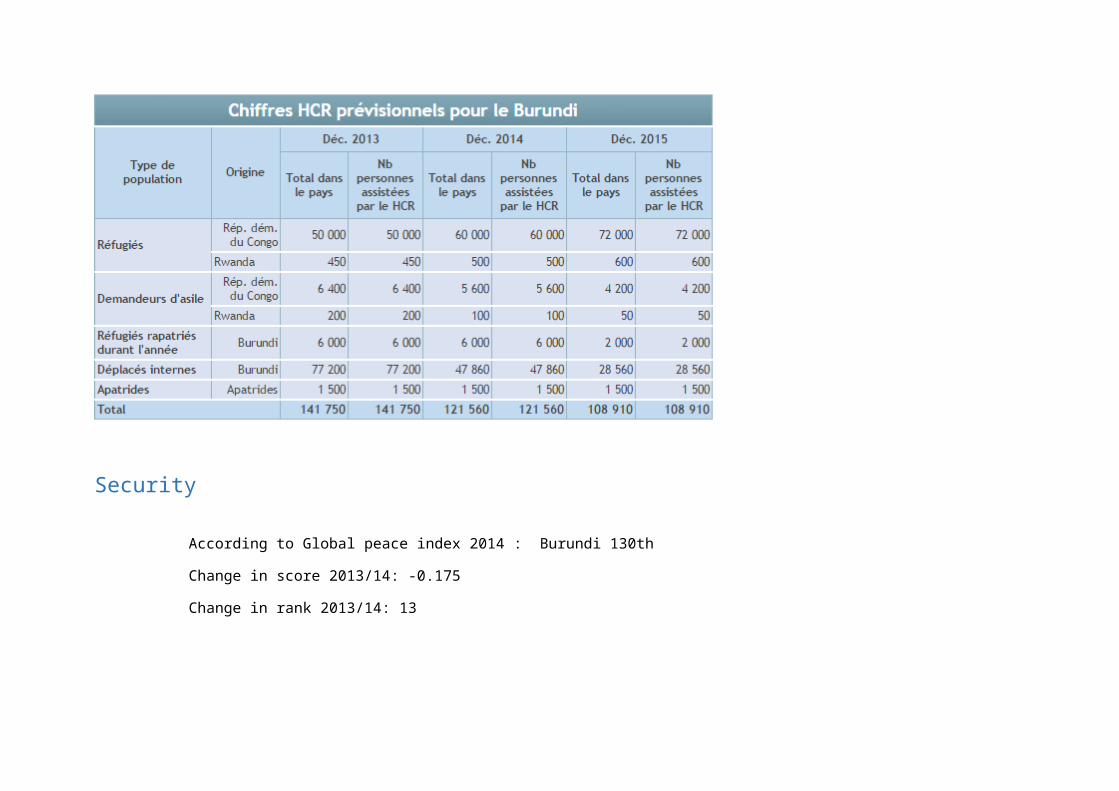
Security
According to Global peace index 2014 : Burundi 130th
Change in score 2013/14: -0.175
Change in rank 2013/14: 13
After Cote d’Ivoire, Burundi is the sub-Saharan country that saw the highest rise in the 2014 GPI, of which the gains were
entirely due to more benign domestic conditions. In this regard, the country benefited from a drop in the reported

homicide rate, which was the largest contributor to the score change, but also by the reduced number of registered
deaths from internal organised conflict and lower terrorist activity and overall political instability. Burundi also saw an
improvement in its score as a result of a lower number of refugees and displaced persons, a category that now has
the lowest (best) possible score. However, it saw a rise in the number of external and internal conflicts fought due to
its involvement in fighting Al-Shabaab in Somalia. Going forward, although the country’s improvements in the GPI are
laudable, its rather fragile political environment and sharp ethnic divisions between Hutus and Tutsis leave it vulnerable
to potential unrest, particularly since tensions among the country’s numerous political groups have not eased since
the turbulent 2010 elections
Yet, the ten countries most likely to deteriorate in peace in the next two years are Zambia, Haiti, Argentina, Chad,
Bosnia and Herzegovina, Nepal, Burundi, Georgia, Liberia and Qatar.
Terrorisme au Burundi
Disputes - international
Burundi and Rwanda dispute two sq km (0.8 sq mi) of Sabanerwa, a farmed area in the Rukurazi Valley where the Akanyaru/Kanyaru River shifted its course southward after heavy rains in 1965; cross-border conflicts persist among Tutsi, Hutu, other ethnic groups, associated political rebels, armed gangs, and various government forces in the Great Lakes region
Indicateurs de l'IPM
Perception de la criminalité dans la société : 4.0 /5

Agents de sécurité et police : 2.0 /5
Homicides : 3.0 /5
Population carcérale : 1.0 /5
Accès à des armes légères et de petit calibre : 4.0 /5
Conflit organisé (interne) : 4.0 /5
Manifestations violentes : 3.0 /5
Crimes violents : 3.0 /5
Instabilité politique : 3.3 /5
Terreur Politique : 3.5 /5
Importations d'armes conventionnelles : 1.0 /5
Activité terroriste : 2.5 /5
Décès du à conflit organisé (interne) : 1.0 /5
Dépenses militaires : 1.8 /5
Personnel des forces armées : 1.0 /5
Financement des missions de maintien de la paix de l'ONU : 3.8 /5
Armes nucléaires et lourdes : 1 /5
Exportations d'armes conventionnelles : 1.0 /5
Personnes déplacées : 1.0 /5
Relations avec les pays voisins : 3.0 /5
Conflits combattus : 3.0 /5

Décès par conflits (externes) : 1.0 /5
Les femmes au Parlement : 30.5 %
Indice de démocratie politique : 4 /10
Inégalité entre les sexes : 0.7 %
Liberté de la presse : 57.8 /100
Exportations + importations : 44.5 %
Investissement étranger direct : 0.0 %
Nombre de visiteurs : 2.5 %
Migration nette : 4.4 %
Croissance du nombre de jeunes : 30.8 %
Intégration régionale : 2.0 /5
Dépenses d'éducation : 9.2 %
Inscription dans l'enseignement primaire : 98.9 %
Education secondaire : 16.2 %
Enseignement supérieur (% brut) : 3.2 %
Nombre moyen d'années de scolarité : 11.3 années
Alphabétisation des adultes : 66.6 %
Hostilité envers les étrangers : 1.0 /4
Volonté de combattre : 3.0 /5

PIB nominal (PPP US $ millions) : 3.6 $USD
PIB nominal (millions de US $) : 1.6 $USD
PIB par tête : 419 par tête
Coefficient de Gini : 33.3 %
Chômage : 7.0 %
Espérance de vie : 49.4 années
Mortalité infantile : 87.8 / 1000 naissances
Histoire
In the 19th century the territory that was to become the states of Rwanda and Burundi fell under the colonial control of first Germany and then Belgium. The people that populated these areas were linguistically and culturally homogenous, but were still separated into three groups; the Hutu, the Tutsi and the Twa. The Hutu and the Tutsi were to some extent different in physical appearance, but the prevalent societal order was more one of social class than race, allowing Hutus to become Tutsis through social advancement. The German and -primarily- the Belgian colonialists capitalised on these existing societal divides, in essence exacerbating them through supporting centralised Tutsi rule as the means of colonial administration. Just as in Rwanda the Hutu group in Burundi constituted the majority of the population (approximately 85-90%), whilst the Tutsi were in a minority (approximately 10-14%). However, whilst the Hutu seized power in Rwanda at independence, power in Burundi became dominated by the Tutsi minority.
Burundi reached independence in 1962 and became a monarchy under the Tutsi king Mwami Mwambutsa IV. Power in the state was linked to Uprona (Union pour le Progrés National, Union for National Progress), a party connected to the Tutsi monarchy. Tutsi predominance within the state apparatus was violently challenged in an intrastate conflict in 1965 by a Hutu military rebellion which was quashed by the regime. Harsh retaliation from the army against the Hutu population and a cleansing of the army followed. In 1966 the monarchy was abolished by a coup and a military regime was imposed by the Tutsi-dominated army. Military regimes subsequently held power from 1966 to 1993 with dictators violently suppressing dissent, most notably in large-scale massacres of Hutus throughout the 1970s and 1980s. The military regimes attempted to maintain the structure of power and privilege in Burundi and all through their reign almost all positions of importance were held by the Tutsi minority. Also, in order to suppress ethnically based dissent the Tutsi regimes denied the existence of separate ethnic groups in Burundi, making the entire subject taboo.
In 1990 Burundi embarked on a process of democratisation. As political liberalisation began an intrastate conflict erupted, with the Palipehutu (Parti pour la libération du peuple Hutu, Party for the Liberation of the Hutu People) challenging the government in 1991 and 1992. The democratisation process culminated in elections in 1993, and Melchior Ndadaye -a Hutu- of the Frodebu (Front democratique de Burundi, Burundian Democratic Front) became president. Only months after his victory he was killed by members of the Tutsi-dominated army and violence quickly engulfed the country. Thousands of

Tutsi were killed by Frodebu activists, whilst the army retaliated with equal force against Hutus. An Uprona and Frodebu power-sharing government failed to settle the crisis and in 1994 the conflict reignited, pitting the Tutsi-dominated government against a number of Hutu-based opposition groups, most notably the CNDD (Conseil national pour la défense de la démocratie, National Council for the Defence of Democracy) and the Palipehutu-FNL (Parti pour la liberation du peuple Hutu-Forces nationals de libération, Party for the Liberation of the Hutu People-Forces for National Liberation). In the context of this armed conflict several groups, including the government, made use of one-sided violence. Some rebel groups at times also battled each other.
The conflict raged between 1994 and 2008, when the last remaining rebel faction (of any notable size) agreed to enter the peace process. Most rebel groups had by the early 2000s entered into negotiations with the government and signed on to the Arusha process, which stipulated wide-ranging reforms of the army and society and a return to democracy through elections. Elections in 2005 ushered in the CNDD-FDD's Nkúrunziza as president of a government based on ethnic power sharing, and efforts to reign in the last remnant Hutu rebels continued.
Since 1946 Burundi has experienced the intrastate, non-state and one-sided categories of UCDP organised violence.
Geographie
Land boundaries:
total: 1,140 km
border countries: Democratic Republic of the Congo 236 km, Rwanda 315 km, Tanzania 589 km
Coastline: 0 km, landlocked
Natural resources:
nickel, uranium, rare earth oxides, peat, cobalt, copper, platinum, vanadium, arable land, hydropower, niobium, tantalum, gold, tin, tungsten, kaolin, limestone
Elevation extremes:
lowest point: Lake Tanganyika 772 m
highest point: Heha 2,670 m

Land use:
arable land: 33.06%
permanent crops: 14.37%
other: 52.57% (2011)