© simeon keates 2008 dr. simeon keates usability with project lecture 5 – 24/9/08
TRANSCRIPT
© Simeon Keates 2008
Dr. Simeon Keates
Usability with ProjectLecture 5 – 24/9/08
© Simeon Keates 2008
Heuristic inspection of car rental sites
Group 5’s presentation
Page 2
© Simeon Keates 2008
Friday’s Exercise – part 1
Work as a group
Write a script (task analysis) for how you envisage each of your personas would use your site
Try to follow that script using your site
Log any problems you encounter
Then try another group’s site (more if you have time)
Make any changes to your site based on your evaluations
Page 3
© Simeon Keates 2008Page 4
Heuristics as a design approach
© Simeon Keates 2008
Setting the scene
“Rehabilitation Robotics in Europe” c.1997 EU funded many projects under TIDE initiative LOTS of money!!!
Projects generally major disasters Let’s see why…
Page 5
© Simeon Keates 2008
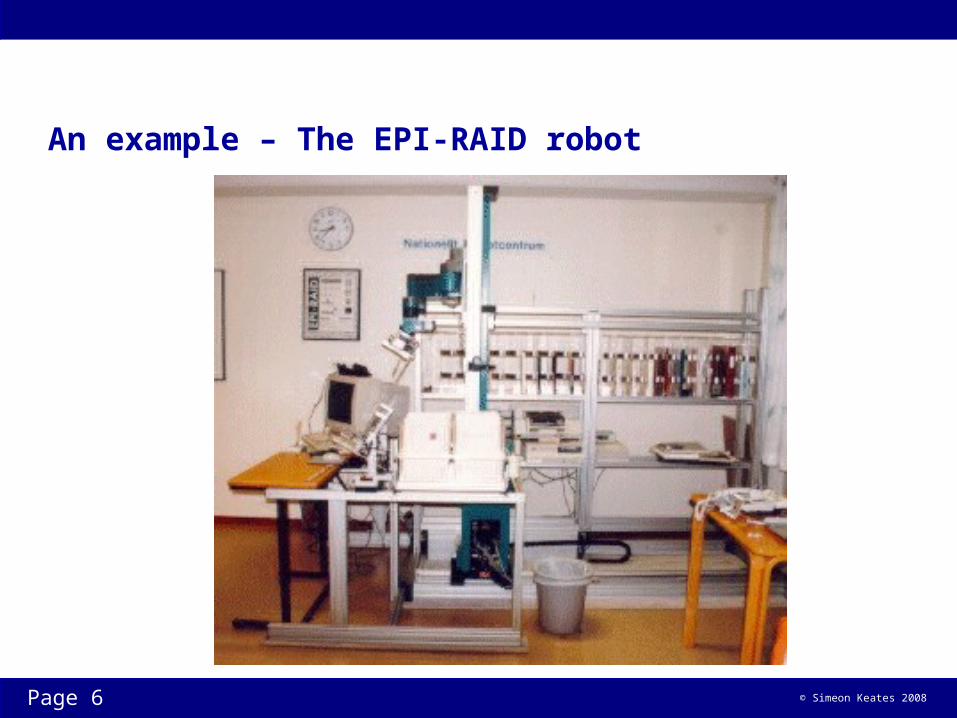
An example – The EPI-RAID robot
Page 6
© Simeon Keates 2008
EPI-RAID failed because…
No in-built market to sell to• Had to sell on its own merits
Too expensive • (~5000000DKK)
Overtaken by new technology• Internet
Not enough consideration of what it was to be used for• Too much focus on the technology
Page 7
Needed a user-centred design approach!
© Simeon Keates 2008
Question
Can we use Nielsen’s heuristic in the design process?
i.e. not just for post-hoc testing
Page 8
© Simeon Keates 2008Page 9
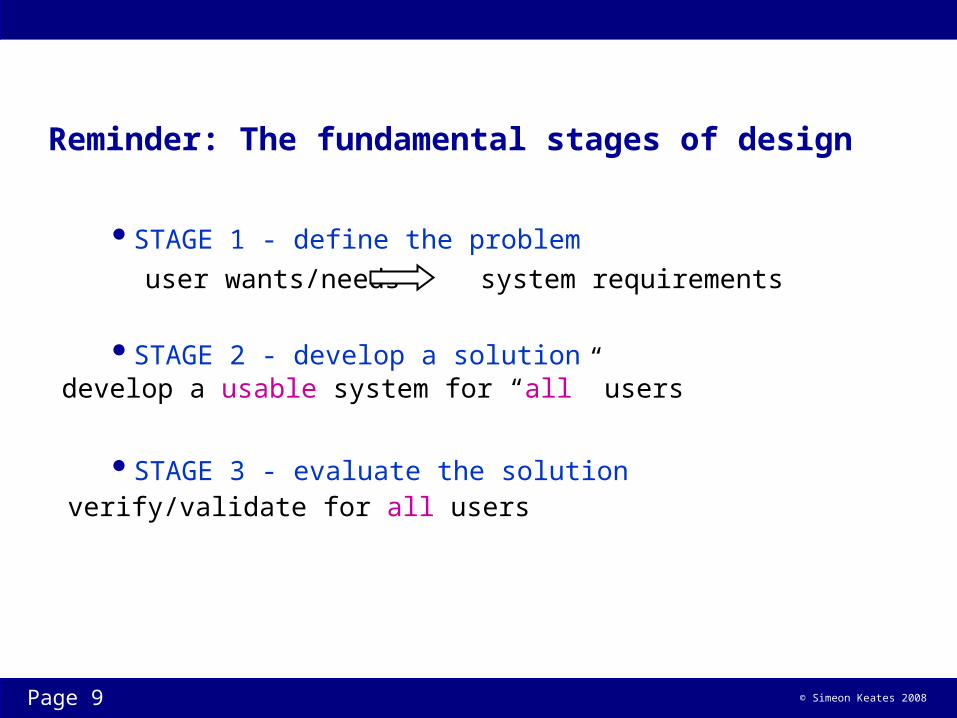
Reminder: The fundamental stages of design
user wants/needs system requirements
STAGE 1 - define the problem
STAGE 2 - develop a solution
STAGE 3 - evaluate the solution
develop a usable system for “all” users
verify/validate for all users
© Simeon Keates 2008
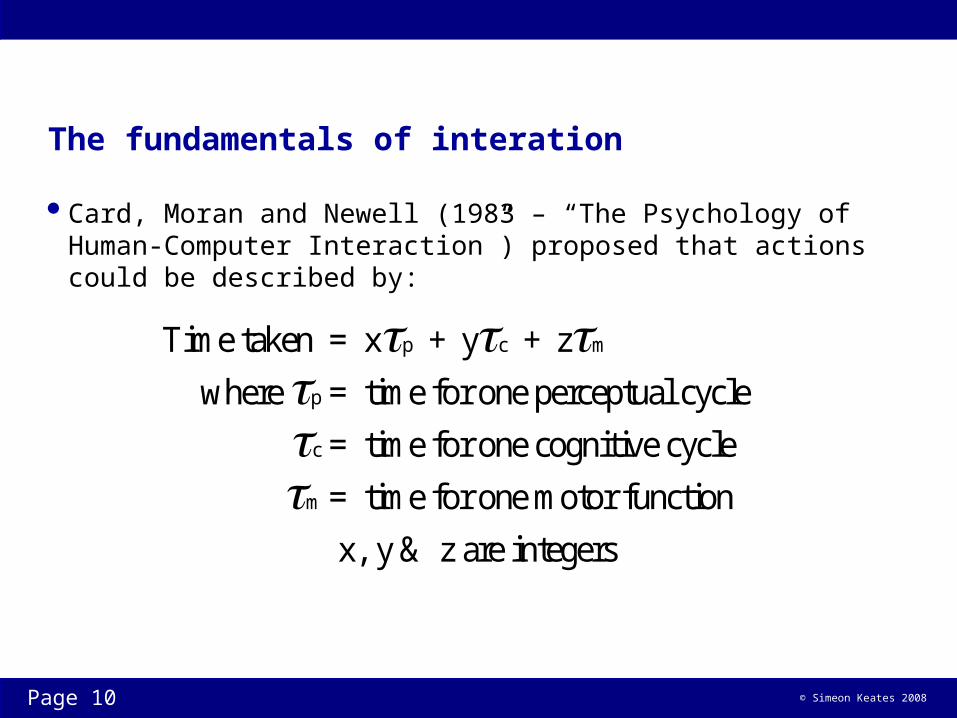
The fundamentals of interation
Card, Moran and Newell (1983 – “The Psychology of Human-Computer Interaction”) proposed that actions could be described by:
Page 10
Time taken = x + y + z
where = time for one perceptual cycle
= time for one cognitive cycle
= time for one motor function
x, y & z are integers
p c m
p
c
m

© Simeon Keates 2008
Putting heuristics into the design process
STAGE 1 - Problem specification
STAGE 2a - Visibility of system status• PERCEPTION
STAGE 2b - Match between system and real world• COGNITION
STAGE 2c - User freedom and control• MOTOR FUNCTION
STAGE 3 - Evaluation/verification
Page 11
1
2
3
Also known as the 5-level model
See Keates and Clarkson “Countering design exclusion”
LEVEL 1
LEVEL 2
LEVEL 3
LEVEL 4
LEVEL 5
© Simeon Keates 2008
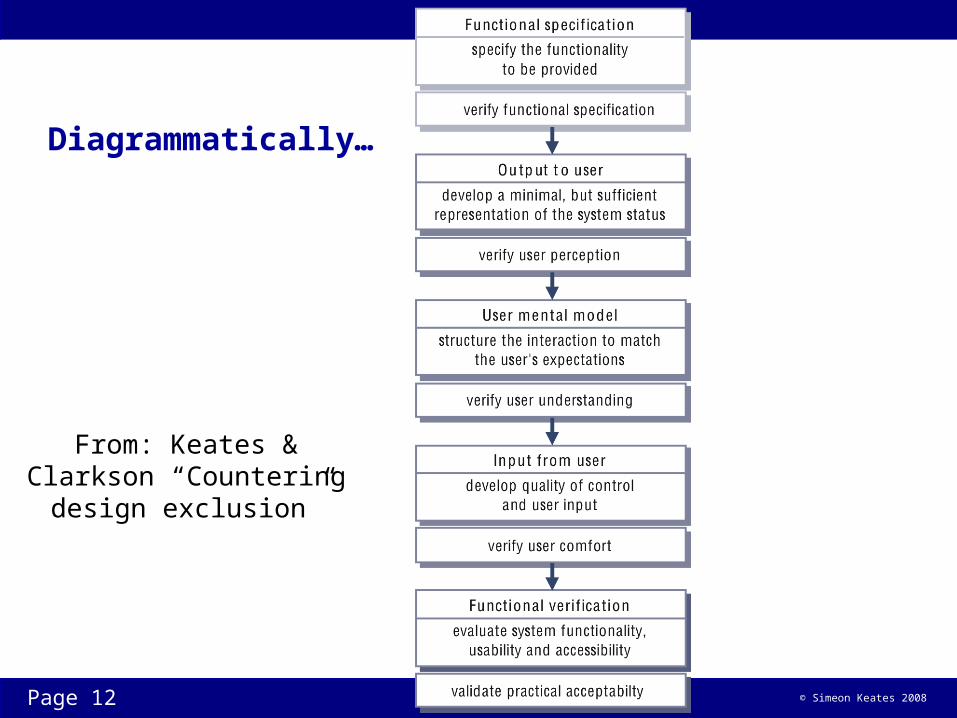
Diagrammatically…
Page 12
From: Keates & Clarkson “Countering design exclusion”
© Simeon Keates 2008
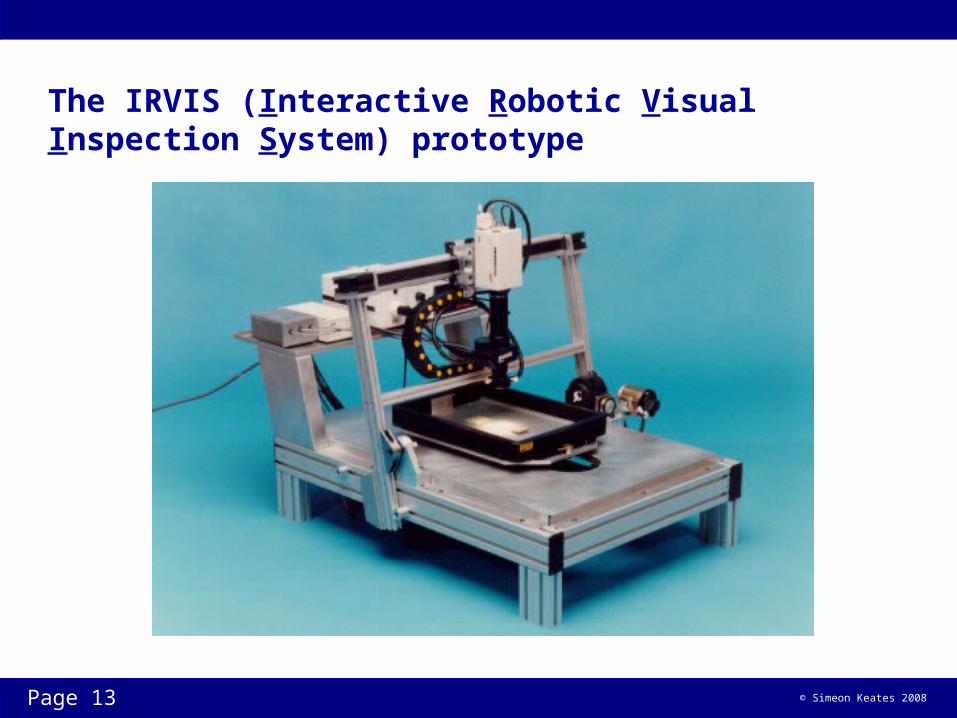
The IRVIS (Interactive Robotic Visual Inspection System) prototype
Page 13
© Simeon Keates 2008
Questions of interest
Question 1: Is the robot under-specified or fundamentally “wrong”? Question 2: Can we make it usable? Question 3: Can we make it accessible?
Page 14
© Simeon Keates 2008
Level 1 - Problem requirements
AIM 1: What are the system requirements? AIM 2: Why did the original interface fail?
ASSESSMENT: Verify problem definition
Page 15
© Simeon Keates 2008
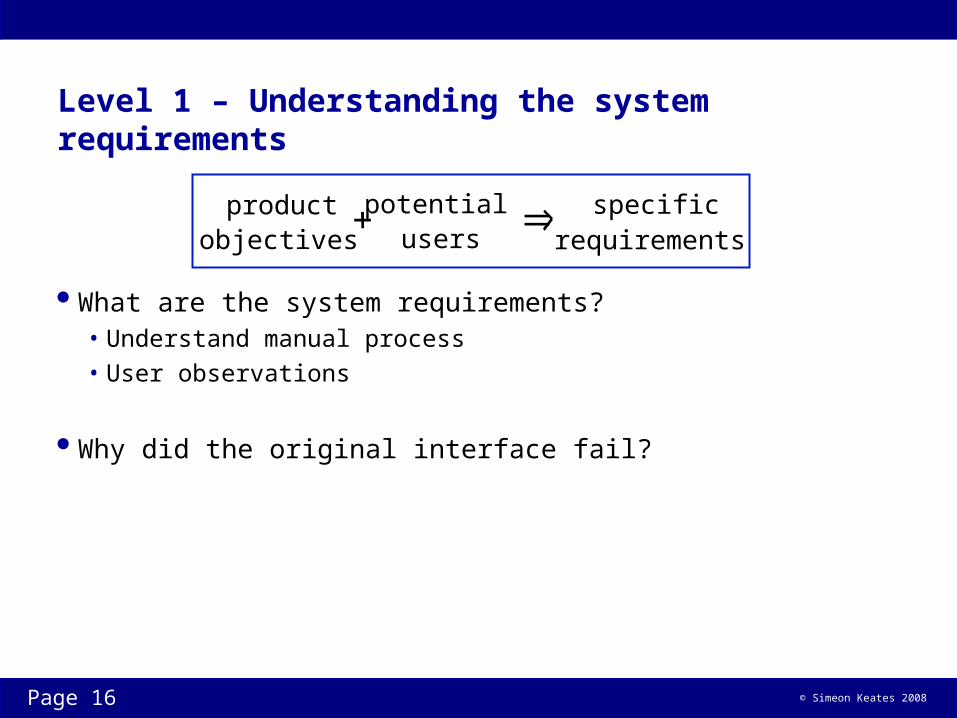
Level 1 – Understanding the system requirements
What are the system requirements?• Understand manual process• User observations
Why did the original interface fail?
productobjectives
specificrequirements
potentialusers
Page 16
© Simeon Keates 2008
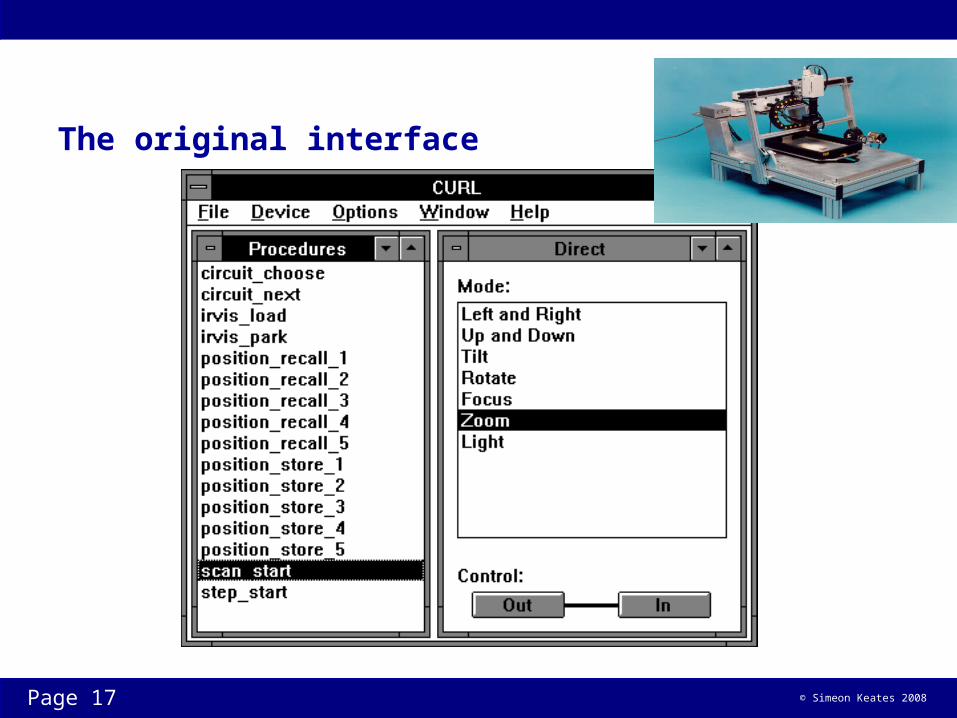
The original interface
Page 17
© Simeon Keates 2008
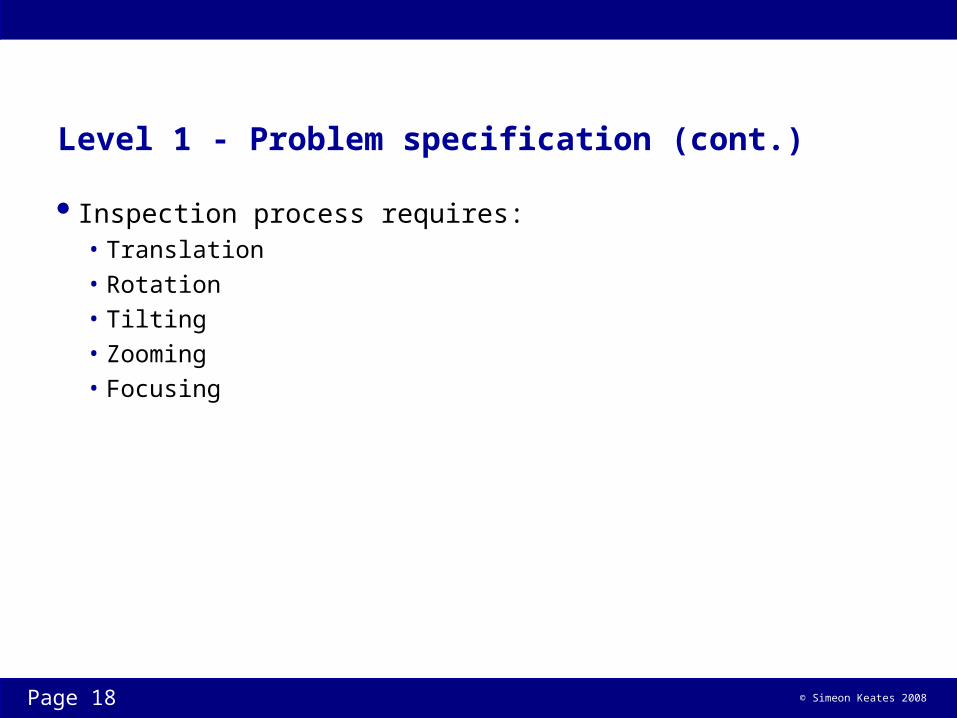
Level 1 - Problem specification (cont.)
Inspection process requires:• Translation• Rotation• Tilting• Zooming• Focusing
Page 18
© Simeon Keates 2008
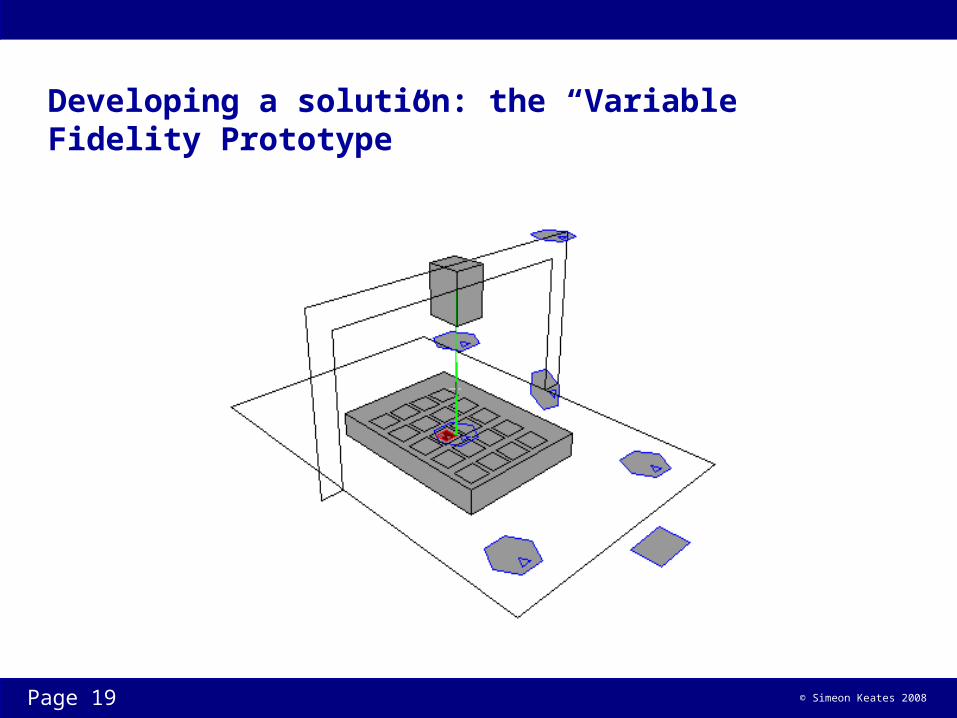
Developing a solution: the “Variable Fidelity Prototype”
Page 19

© Simeon Keates 2008
Level 2 - Output to user – “Visibility of system status”
Page 20
© Simeon Keates 2008
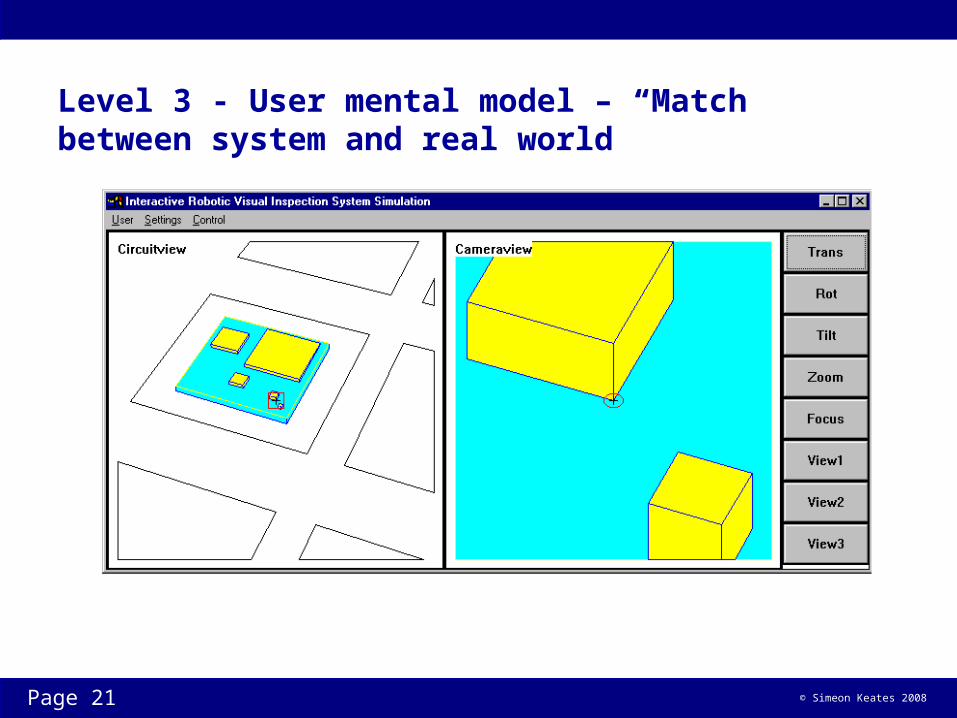
Level 3 - User mental model – “Match between system and real world”
Page 21
© Simeon Keates 2008
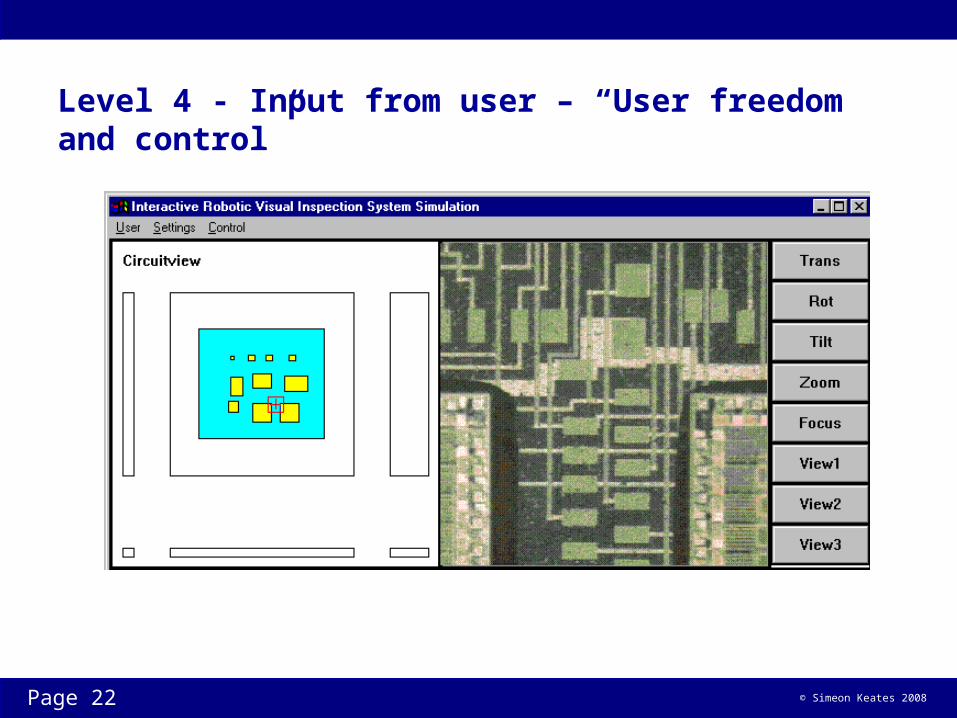
Level 4 - Input from user – “User freedom and control”
Page 22
© Simeon Keates 2008
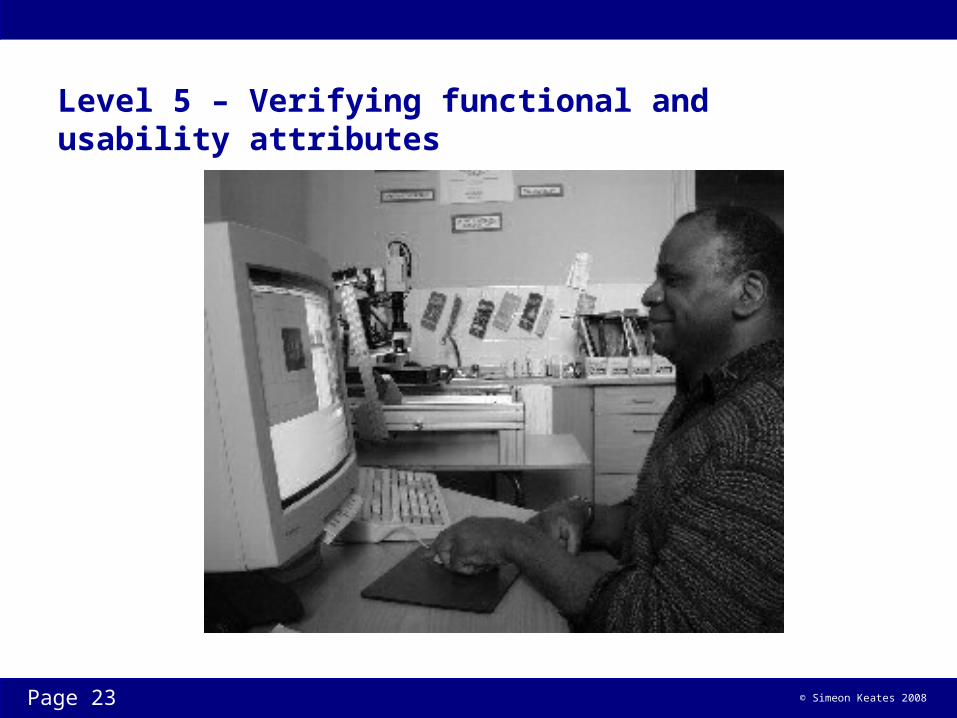
Level 5 – Verifying functional and usability attributes
Page 23
© Simeon Keates 2008
Level 5 - Social attributes
The design of a new interface has shown significantly increased usability
Qualitative user feedback extremely favourable The final interface also showed improved usability for able-
bodied users Costly robot re-build avoided
Page 24
© Simeon Keates 2008
Features of the 5-level model
Iterative approach, with user trials and evaluation at each level Addresses each stage of the interaction process explicitly Guidelines can be incorporated where applicable Clear focus on usability
Page 25
© Simeon Keates 2008
Improving the 5-level model…
Will be seen a little later…
Page 26

© Simeon Keates 2008
Summary
Usability and design are closely intertwined
Usability needs to consider design perspectives
Usability methods used need to complement design process and stage of development lifecycle
Page 27
© Simeon Keates 2008
Introducing “inclusive design”
Page 28
© Simeon Keates 2008
What is a good/inclusive interface?
Acceptable by the intended user group
Need to define: What is the intended user group? What is acceptable?
Page 29
© Simeon Keates 2008
Who are the intended users?
Typical user stereotypes The “disabled” The “elderly” The “person in the street” The “customer”
Page 30
© Simeon Keates 2008
Designing inclusively = design for the disabled (?)
Need to adopt inclusive design arises because user capabilities ≠ product demands
Thus users with limited or impaired capabilities need a more accessible version to be designed
User group most commonly (stereotypically) associated with limited or impaired capabilities is people with disabilities
Ergo – designing inclusively is really designing for the disabled
Page 31
© Simeon Keates 2008
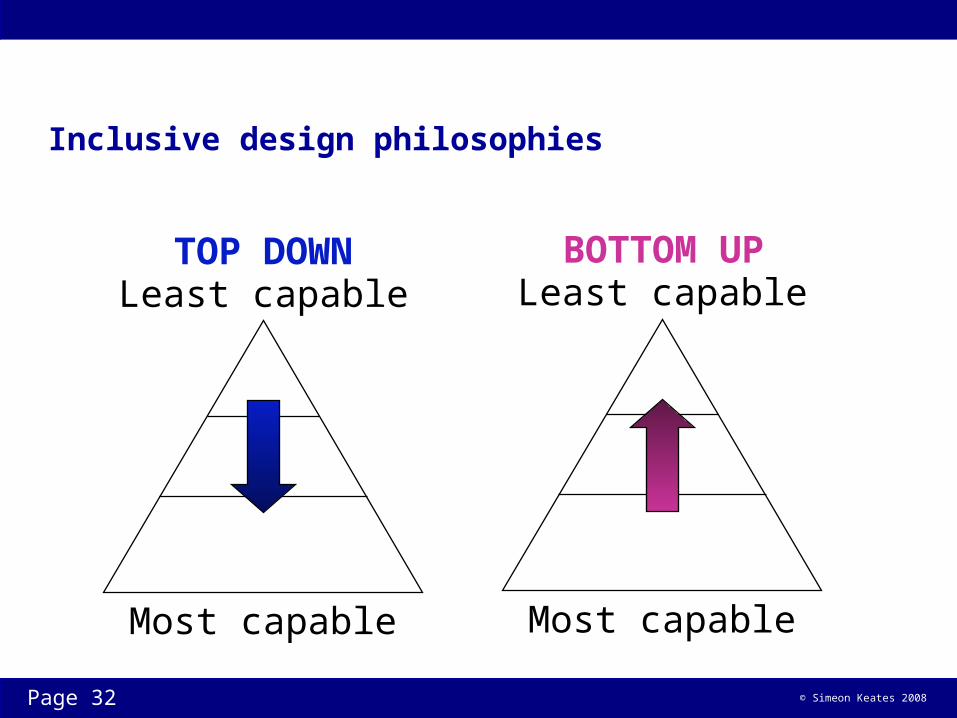
Inclusive design philosophies
Most capable
Least capableTOP DOWN
Most capable
Least capableBOTTOM UP
Page 32
© Simeon Keates 2008
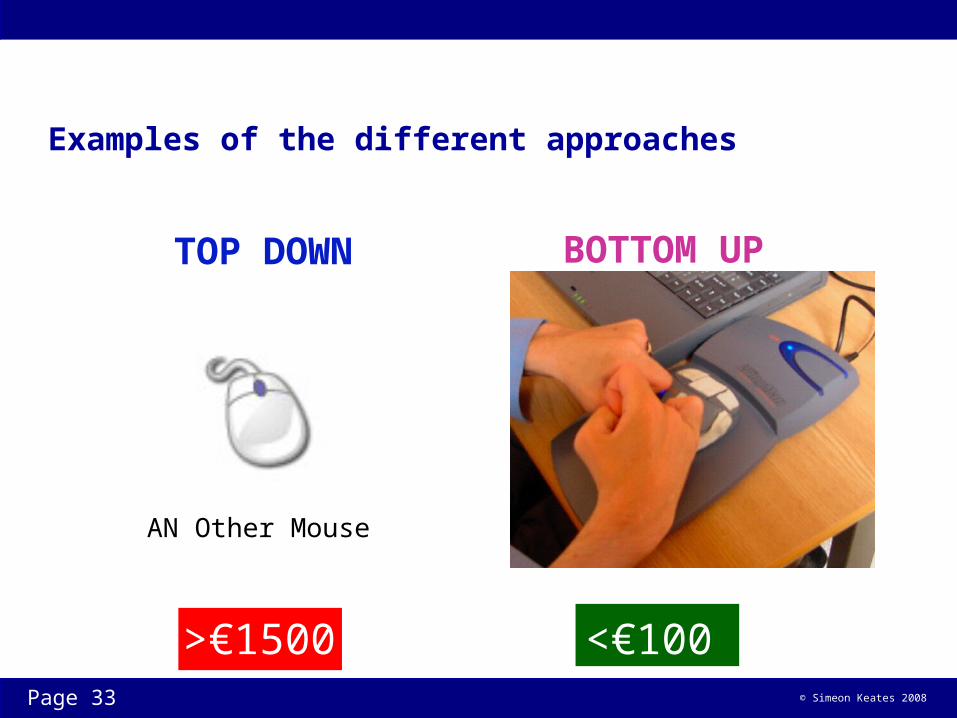
Examples of the different approaches
AN Other Mouse
TOP DOWN BOTTOM UP
<€100>€1500Page 33

© Simeon Keates 2008
Approaches to “designing for the widest possible range of users”
Universal Design Design for All Universal Access Inclusive Design Countering Design Exclusion Design for disability
Page 34
© Simeon Keates 2008
Universal Design
For a long time the most famous “inclusive design” approach Very popular in Japan and USA Strong association with architectural design
• Buildings access
Not big in Europe• “Guiding principles” seen as too rigid and too deeply associated with its US
heritage
Page 35
© Simeon Keates 2008
The 7 guiding principles of Universal Design
1 - Equitable use• The design must be useful and marketable to people with diverse abilities
2 - Flexibility in use• The design accommodates a wide range of individual preferences and abilities
3 - Simple and intuitive• Use of the design is easy to understand, regardless of the user’s experience,
knowledge, language skills or current concentration level
4 - Perceptible information• The design communicates necessary information effectively to the user,
regardless of the ambient conditions or the user’s sensory abilities
Page 36

© Simeon Keates 2008
The 7 guiding principles of Universal Design
5 – Tolerance for error• The design minimises hazards and the adverse consequences of accidental
or unintended actions
6 – Low physical effort• The design can be used efficiently and comfortably and with a minimum of
fatigue
7 – Size and space and approach for use• Appropriate size and space is provided for approach, reach, manipulation
and use regardless of user’s body size, posture or mobility
Page 37
© Simeon Keates 2008
Other approaches to designing for the most possible users
Design for All• An older approach, very popular at one time
Inclusive design• Popular in Europe• More flexible approach than Universal Design
Universal Access• “Inclusive design for HCI”
Countering design exclusion• Developed by Keates and Clarkson (see book of same name)
Page 38
© Simeon Keates 2008
Design for All(?)
Synonymous with “one product for all” (note – incorrectly)• Not really a feasible goal (see first lecture)
EU eEurope initiative defines DfA as:• “…designing mainstream products and services to be accessible by as
broad a range of users as possible.”
Page 39
© Simeon Keates 2008
Defining “inclusive design” (source: Keates “Designing for accessibility”)
UK Department of Trade and Industry:• Inclusive design is a process whereby “…designers ensure that their
products and services address the needs of the widest possible audience.”
RSA (Royal Society for the Encouragement of Arts, Manufacture and Commerce):• Inclusive design is “… about ensuring that environments, products, services
and interfaces work for people of all ages and abilities.”
UK Design Council:• “Inclusive design is not a new genre of design, nor a separate specialism,
but an approach to design in general and an element of business strategy that seeks to ensure that mainstream products, services and environments are accessible to the largest number of people.”
Page 40
© Simeon Keates 2008
Countering design exclusion (CDE)
Defined in BS7000 Part 6:• Design exclusion is the “…inability to use a product, service or facility, most
commonly because the needs of people who experience motor, sensory and cognitive impairments have not been taken into account during the design process.”
Page 41
© Simeon Keates 2008
CDE philosophy
If you can identify who cannot use the product and why, then you know what to focus on fixing
More practical approach than “design for a wide variety of users (but we’re not going to tell you who and how many) in a wide variety of circumstances (ditto)”
Page 42
© Simeon Keates 2008
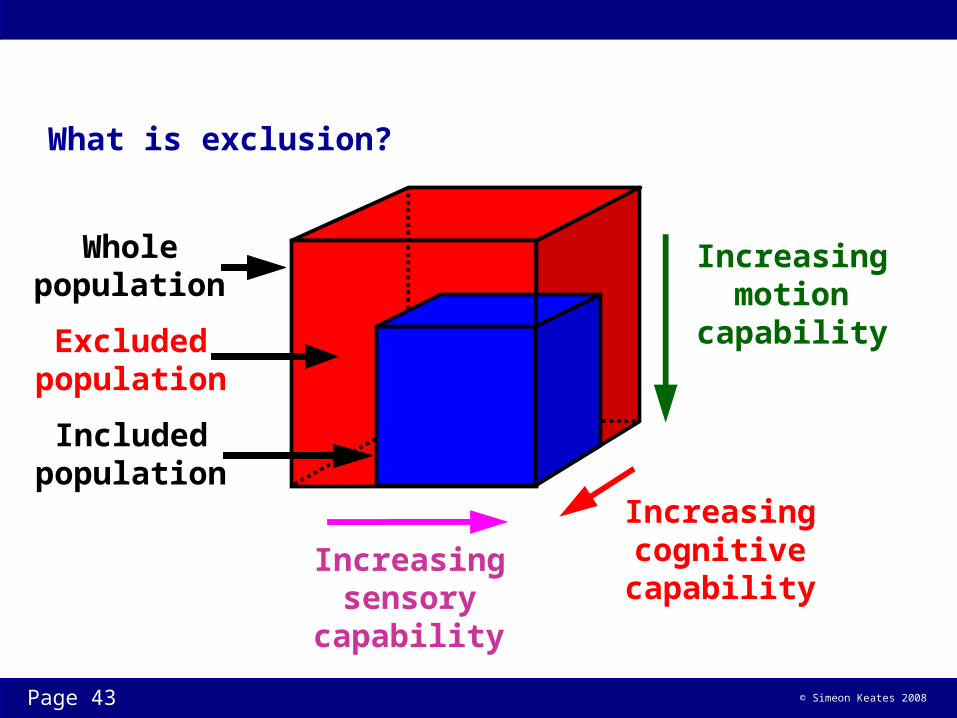
What is exclusion?
Wholepopulation
Includedpopulation
Increasingsensory
capability
Increasingmotion
capability
Increasingcognitivecapability
Excludedpopulation
Page 43
© Simeon Keates 2008
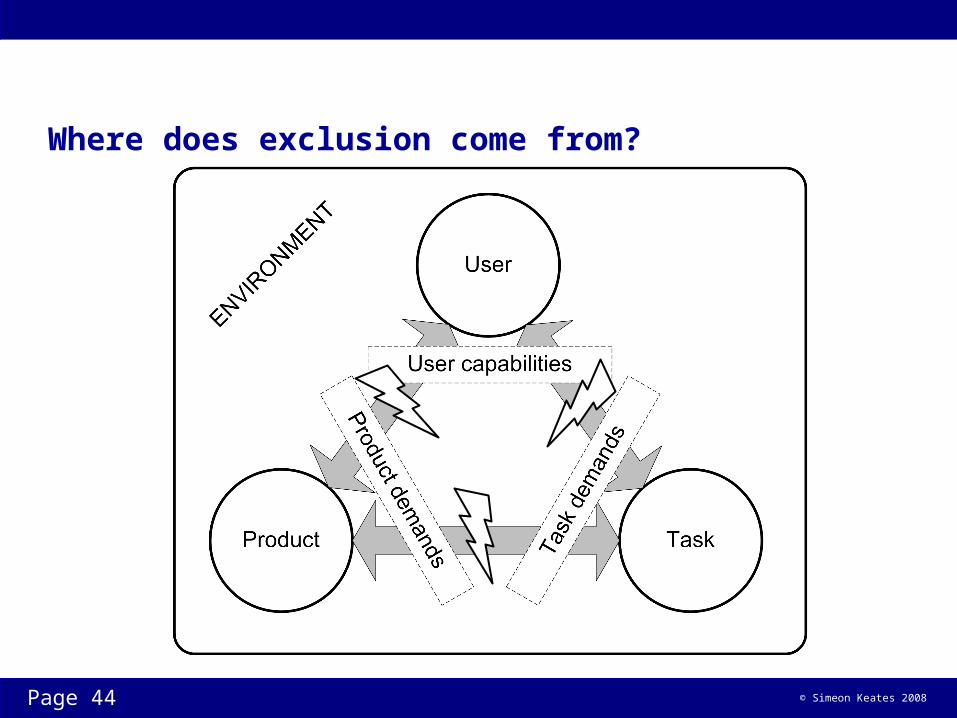
Where does exclusion come from?
Page 44
© Simeon Keates 2008
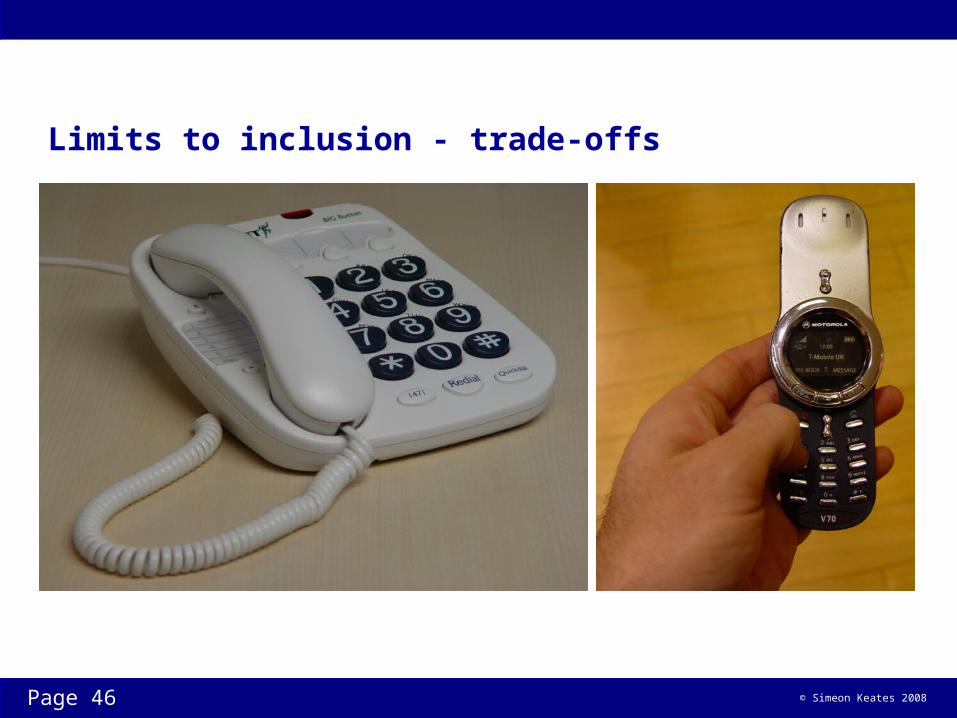
Where does design exclusion come from?
“Designers design for themselves”
Examples to follow…
Design trade-offs…
Page 45
© Simeon Keates 2008
Limits to inclusion - trade-offs
Page 46
© Simeon Keates 2008
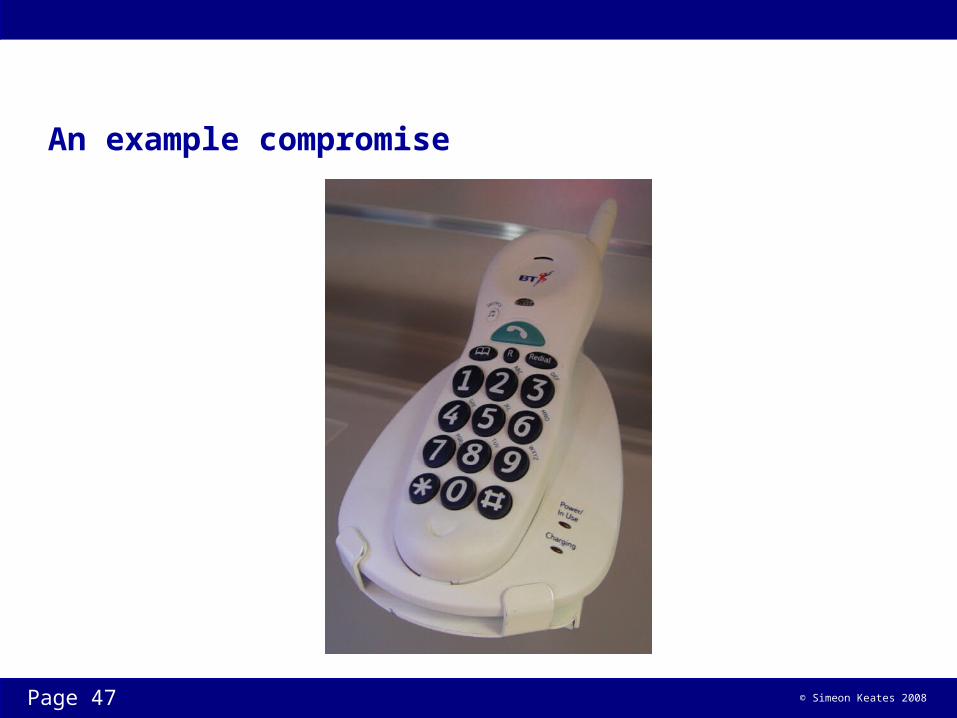
An example compromise
Page 47
© Simeon Keates 2008
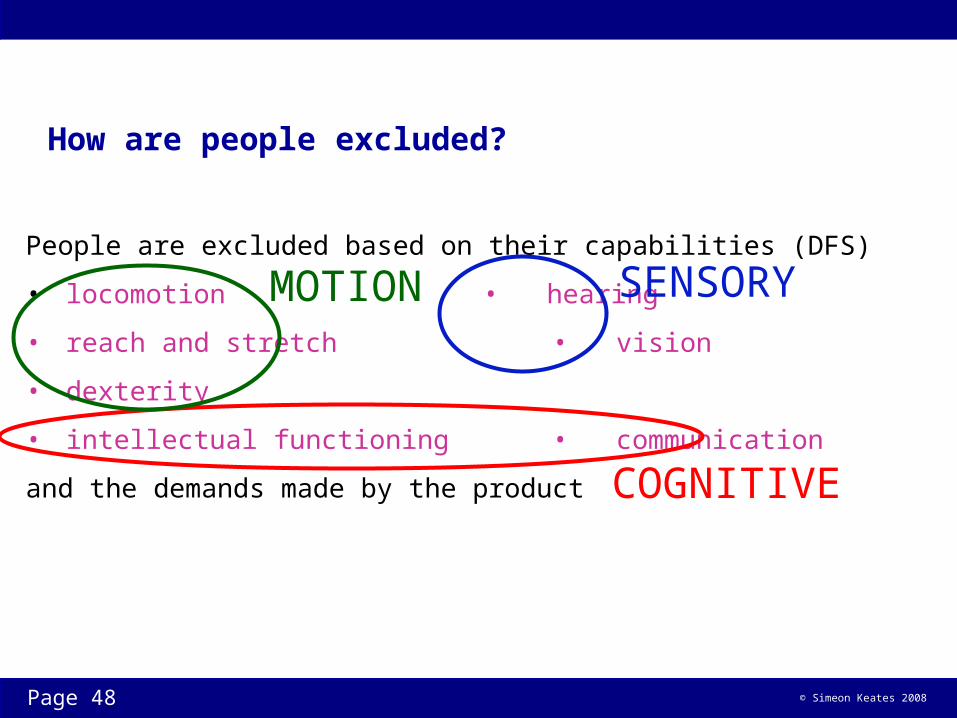
People are excluded based on their capabilities (DFS)
• locomotion • hearing
• reach and stretch • vision
• dexterity
• intellectual functioning • communication
and the demands made by the product
How are people excluded?
SENSORY
COGNITIVE
MOTION
Page 48

© Simeon Keates 2008
Quantifying exclusion
We will look at how to measure and report exclusion in later lectures
You will see examples in the reading material for this week
Page 49
© Simeon Keates 2008Page 50
Prevalence…
© Simeon Keates 2008
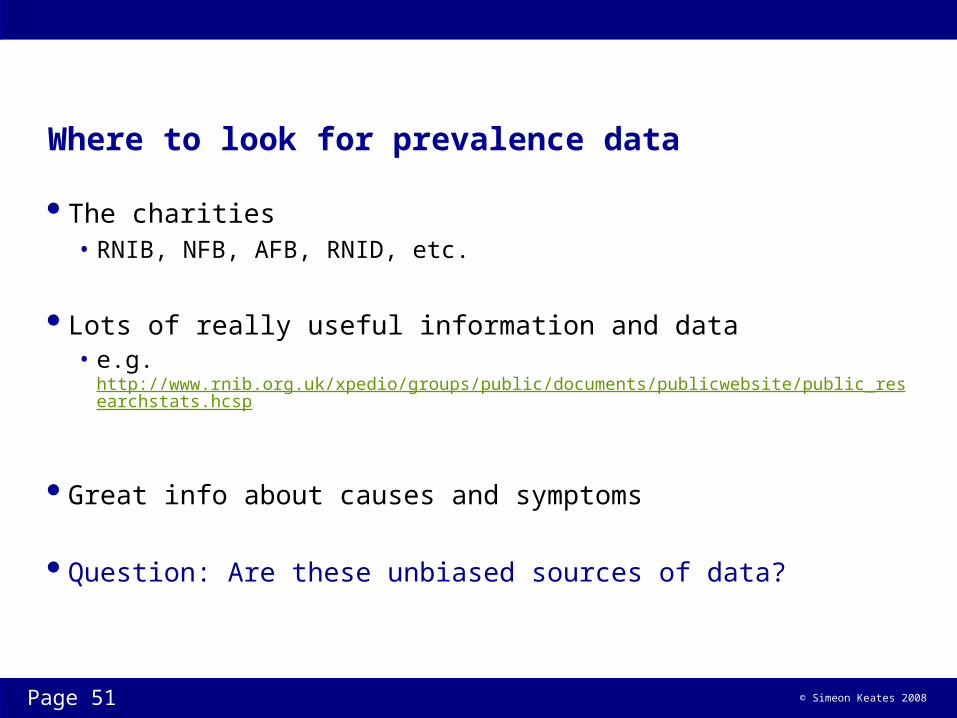
Where to look for prevalence data
The charities• RNIB, NFB, AFB, RNID, etc.
Lots of really useful information and data• e.g. http://www.rnib.org.uk/xpedio/groups/public/documents/publicwebsite/public_researchstats.hcsp
Great info about causes and symptoms
Question: Are these unbiased sources of data?
Page 51

© Simeon Keates 2008
Charities and prevalence data
Difficult to tell how unbiased data is
Best sites cite independent studies
Others mention figures with no (or dubious) attributions
Need to treat such data cautiously
Better to rely on “official” sources, e.g. government bodies
Page 52
© Simeon Keates 2008
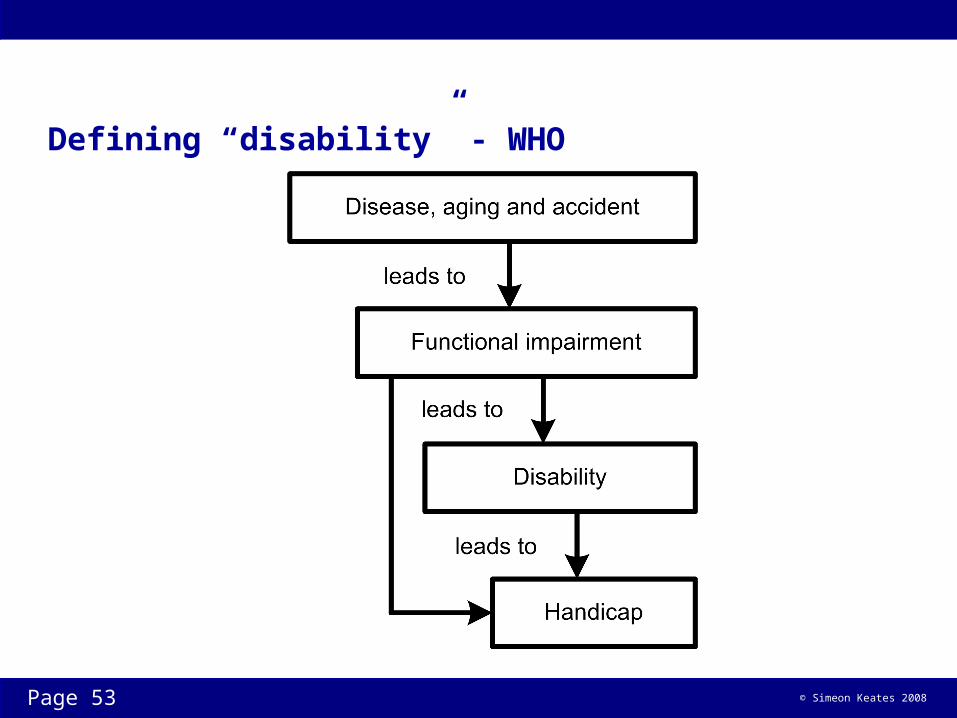
Defining “disability” - WHO
Page 53
© Simeon Keates 2008
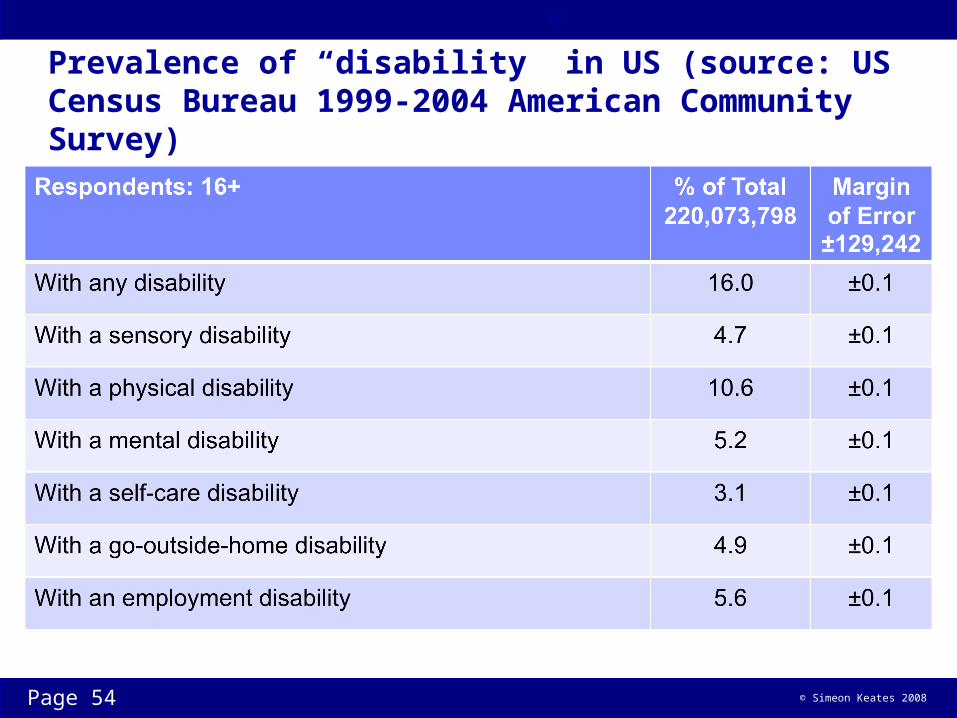
Prevalence of “disability” in US (source: US Census Bureau 1999-2004 American Community Survey)
Page 54
© Simeon Keates 2008
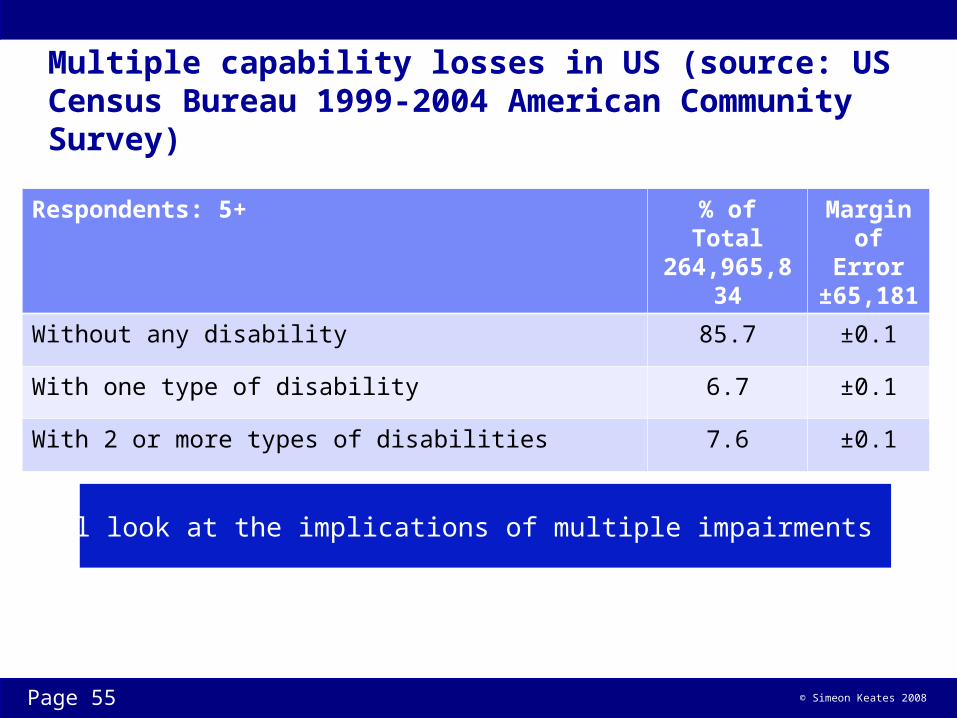
Multiple capability losses in US (source: US Census Bureau 1999-2004 American Community Survey)
Page 55
Respondents: 5+ % of Total 264,965,834
Margin of Error ±65,181
Without any disability 85.7 ±0.1
With one type of disability 6.7 ±0.1
With 2 or more types of disabilities 7.6 ±0.1
We will look at the implications of multiple impairments later…
© Simeon Keates 2008
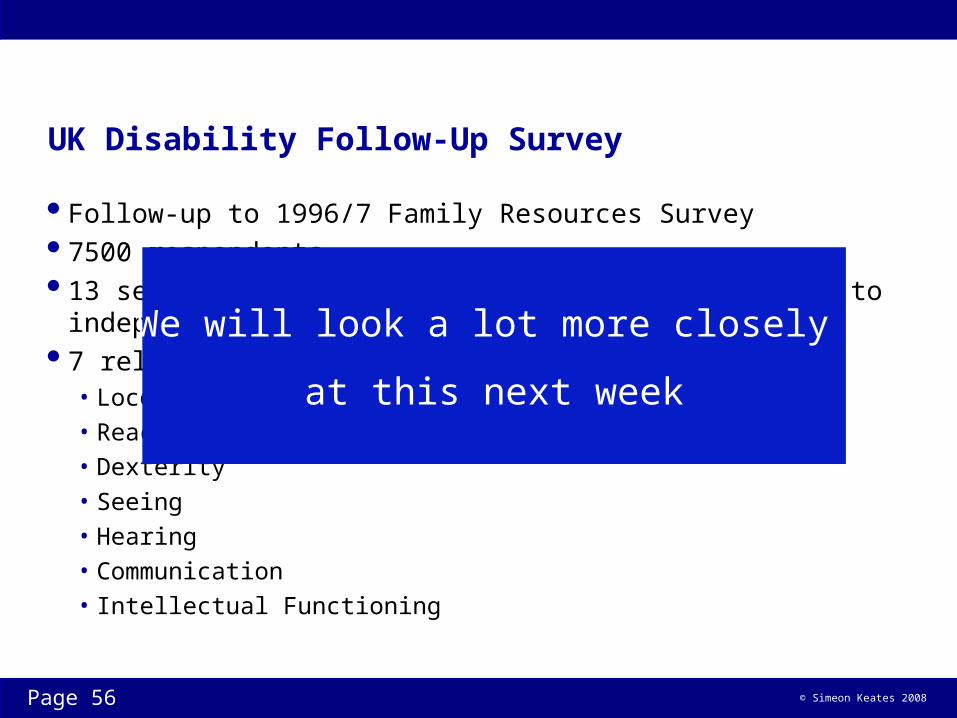
UK Disability Follow-Up Survey
Follow-up to 1996/7 Family Resources Survey 7500 respondents 13 separate capabilities identified as important to independent living 7 relevant for product design:
• Locomotion• Reach and stretch• Dexterity• Seeing• Hearing• Communication• Intellectual Functioning
Page 56
We will look a lot more closely
at this next week
© Simeon Keates 2008
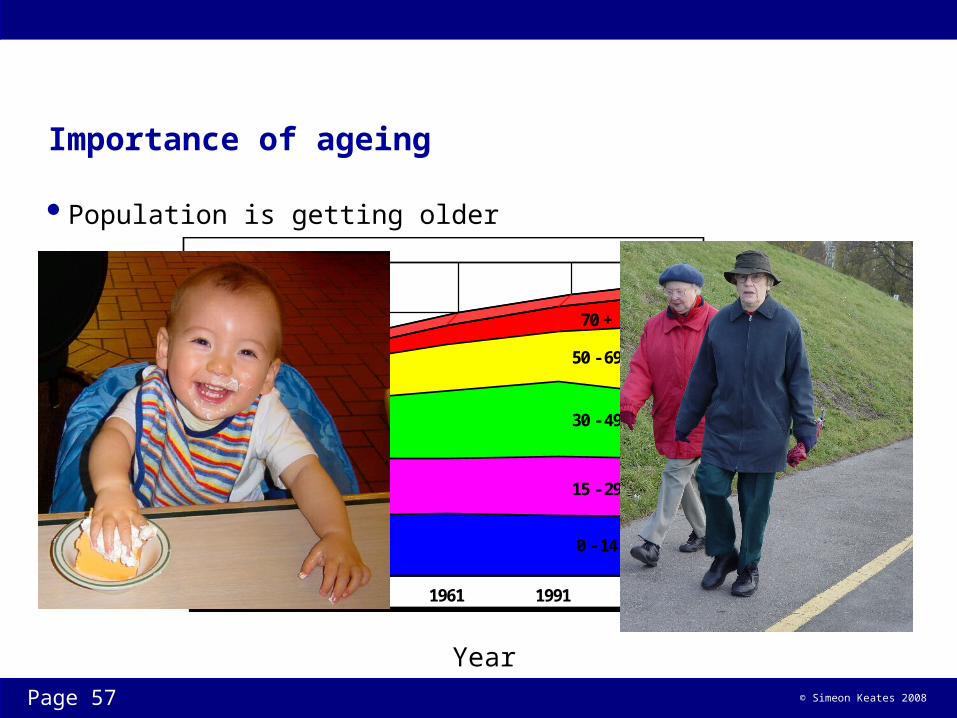
Importance of ageing
Population is getting older
50
40
30
20
10
01901 1931 1961 1991 2021
60
0 - 14
15 - 29
30 - 49
50 - 69
70 +
Year
UK
p
opu
latio
n
(mill
ions
)
Page 57
© Simeon Keates 2008
Mapping to interaction models
Motor = locomotion, reach & stretch, dexterity
Sensory = seeing, hearing
Cognitive = communication, intellectual functioning
Page 58
© Simeon Keates 2008
Disability Follow-up summary
8,582,200 adults in GB have a disability• 17% of the total population (1 in 6)
Of these: 34% had mild impairments 45% had moderate impairments 21% percent had severe impairments
49% had more than one impairment type
48% of disabled population is over 65 29% of disabled population is over 75
Page 59
© Simeon Keates 2008
It’s not just blindness
Traditionally most “accessibility” approaches for HCI have focused on blindness
Reasons: Very “visible” difficulty Very easy to simulate
• Switch off the monitor
Very effective lobbying group
Page 60
© Simeon Keates 2008
WCAG 1.0 and 2.0
Look through the WCAG guidelines:
How many address vision issues (specifically blindness)?
How many address motor issues?
How many address cognitive issues?
How many address hearing issues?
Page 61
Answer: Most
Answer: Some
Answer: Few
Answer: Few
© Simeon Keates 2008
Problem with focus on blindness
From DFS: 1.93 million people have vision impairment Only 20% of those are “blind”
• Need screen readers, etc.
80% are “low vision”• Need screen magnification
c.f. 2.9 million people with hearing impairments …and 6.7 million with motor impairments
Page 62
© Simeon Keates 2008
Sensory impairments – Classes of impairment
Vision• Blindness – cannot see “at all”• Low vision – cannot see well• Colour blindness – cannot see all of the colour spectrum
Hearing/auditory• Deafness – cannot hear “at all”• Low hearing – cannot hear well
Page 63
© Simeon Keates 2008
Cognitive impairments – Classes of impairment
Poor long-term memory Poor short-term memory Dementia – e.g. Alzheimer’s Language “deficits” – e.g. below chronological reading age Reading difficulties – e.g. dyslexia Behavioural/attentional difficulties – e.g. ADD, ADHD
Page 64
© Simeon Keates 2008
Motor impairments – Classes of impairment
Restricted range of motion Tremor Spasm Poor co-ordination Limited strength Poor fine movement Poor ballistic movement
Page 65
© Simeon Keates 2008
Next few lectures…
We will look at: Business and Universal Access Methods of providing assistance to users with impairments …and more types of impairments Methods of quantifying exclusion …and reporting it Case studies …and more case studies Standards Legislation
Page 66
© Simeon Keates 2008
Exercise
Page 67
© Simeon Keates 2008
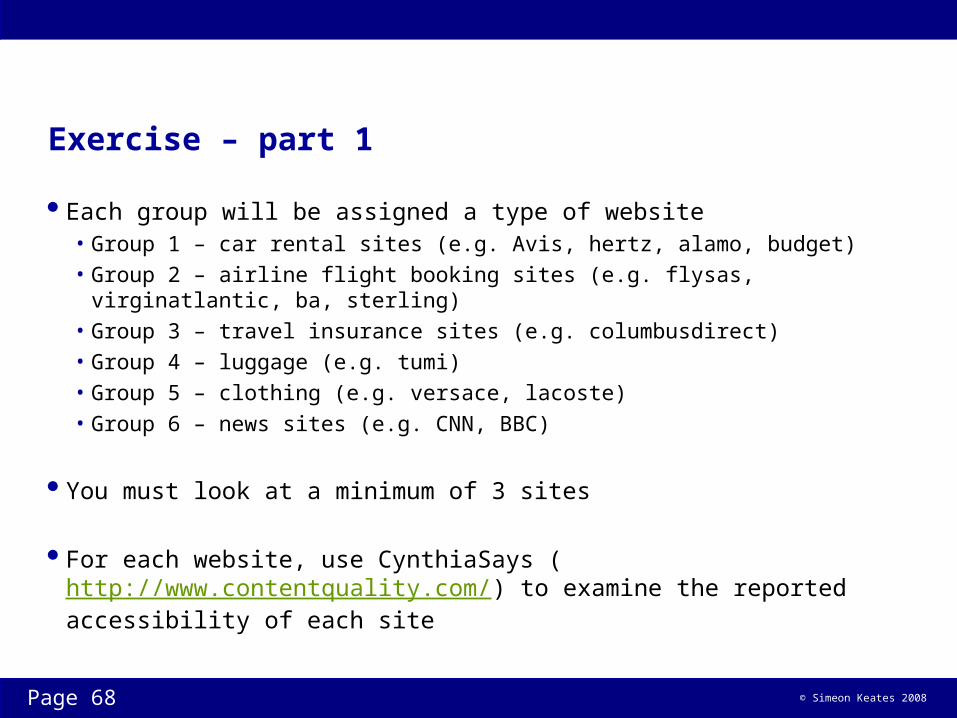
Exercise – part 1
Each group will be assigned a type of website• Group 1 – car rental sites (e.g. Avis, hertz, alamo, budget)• Group 2 – airline flight booking sites (e.g. flysas, virginatlantic, ba, sterling)• Group 3 – travel insurance sites (e.g. columbusdirect)• Group 4 – luggage (e.g. tumi)• Group 5 – clothing (e.g. versace, lacoste)• Group 6 – news sites (e.g. CNN, BBC)
You must look at a minimum of 3 sites
For each website, use CynthiaSays (http://www.contentquality.com/) to examine the reported accessibility of each site
Page 68
© Simeon Keates 2008
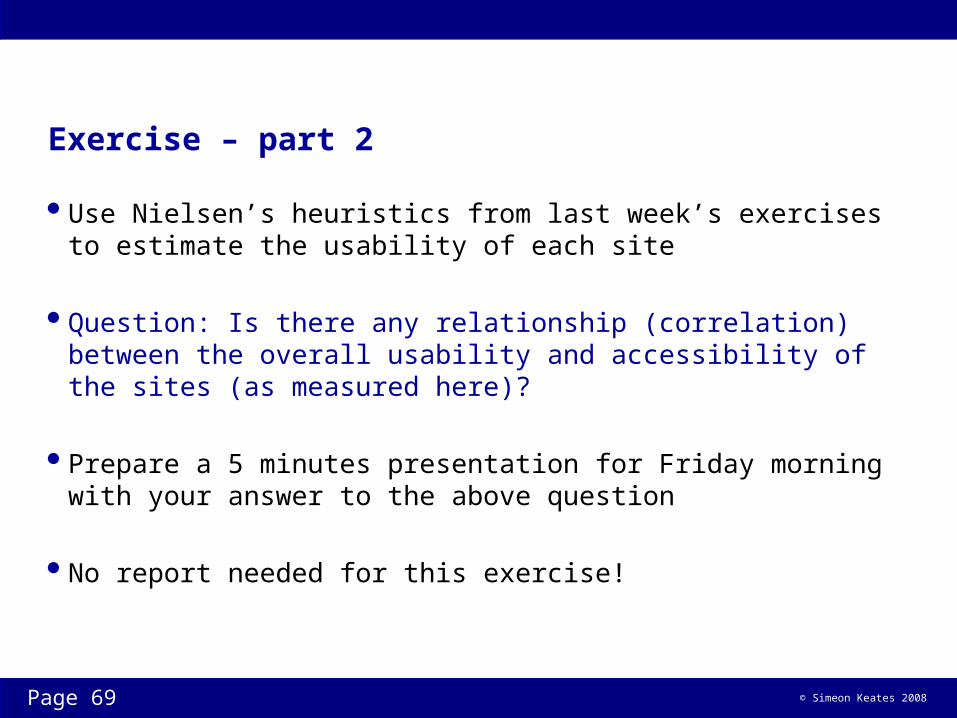
Exercise – part 2
Use Nielsen’s heuristics from last week’s exercises to estimate the usability of each site
Question: Is there any relationship (correlation) between the overall usability and accessibility of the sites (as measured here)?
Prepare a 5 minutes presentation for Friday morning with your answer to the above question
No report needed for this exercise!
Page 69