© 2011 brooks/cole, cengage learning6 | 1. © 2011 brooks/cole, cengage learning6 | 2
TRANSCRIPT

© 2011 Brooks/Cole, Cengage Learning 6 | 1
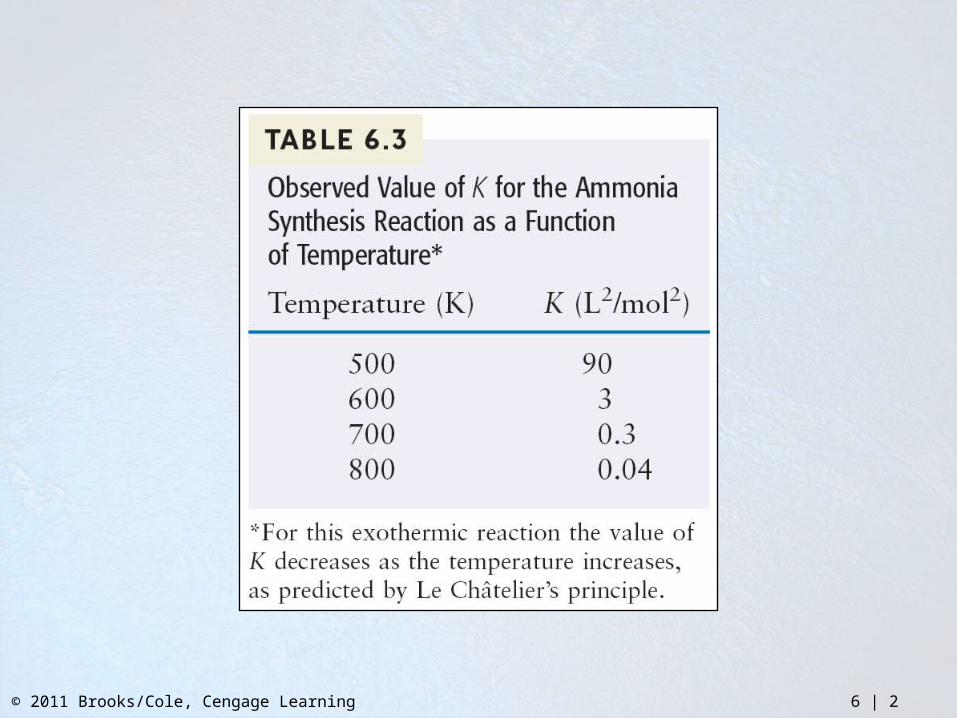
© 2011 Brooks/Cole, Cengage Learning 6 | 2
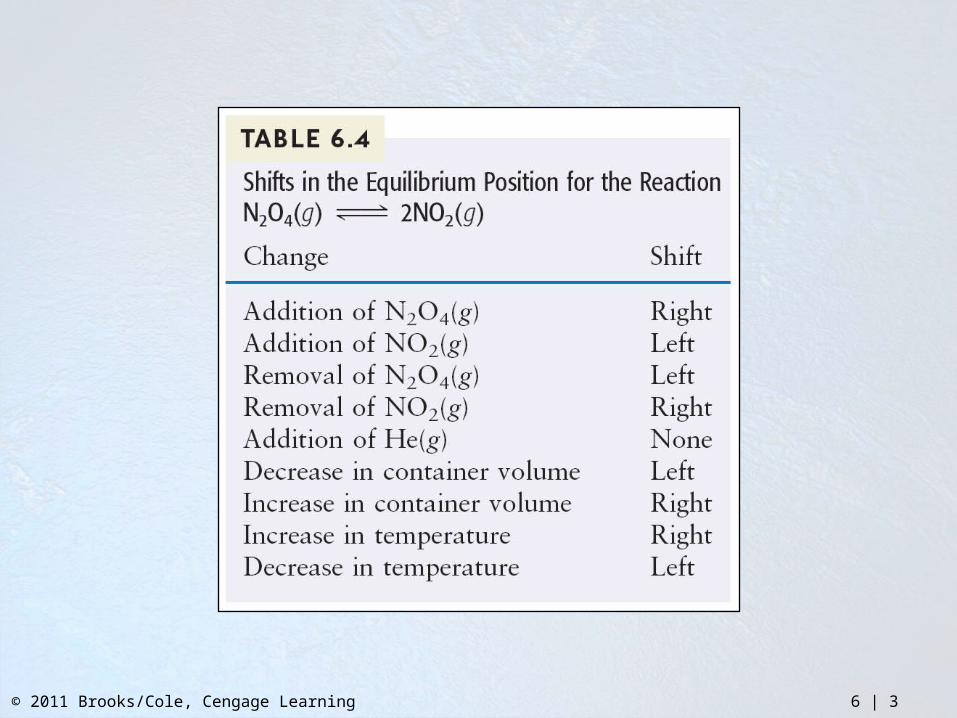
© 2011 Brooks/Cole, Cengage Learning 6 | 3
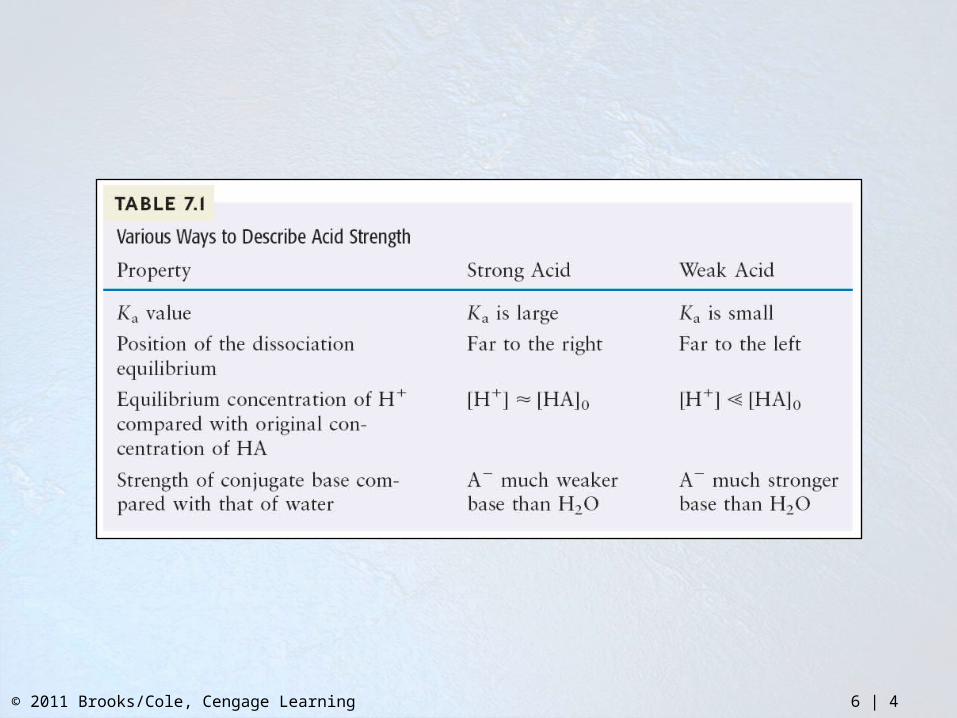
© 2011 Brooks/Cole, Cengage Learning 6 | 4

© 2011 Brooks/Cole, Cengage Learning 6 | 5
© 2011 Brooks/Cole, Cengage Learning 6 | 6
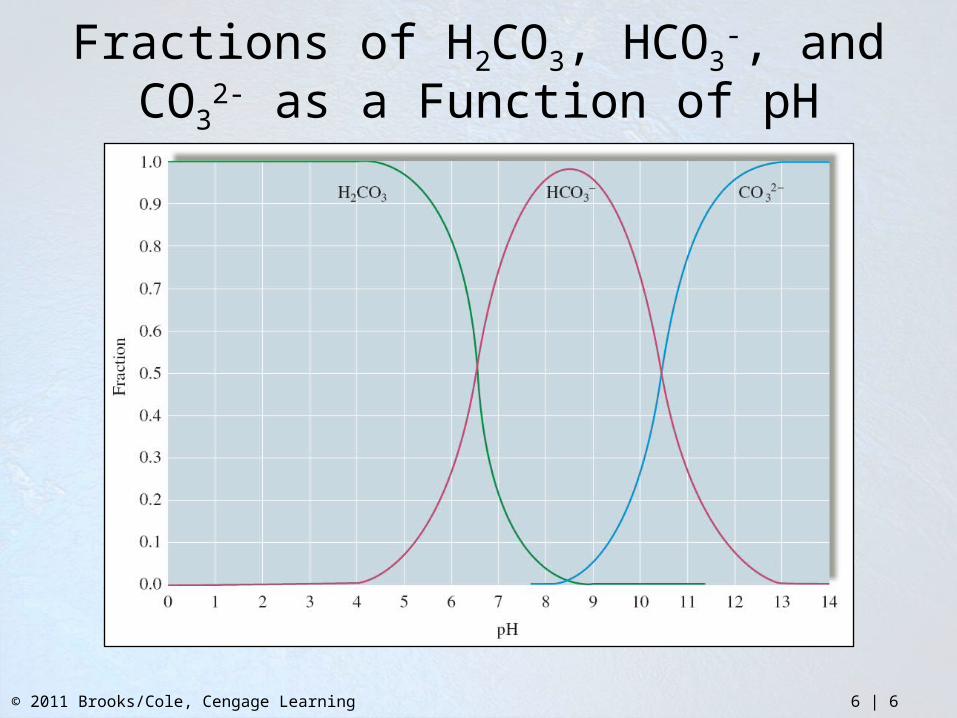
Fractions of H2CO3, HCO3-, and CO3
2- as a Function of pH
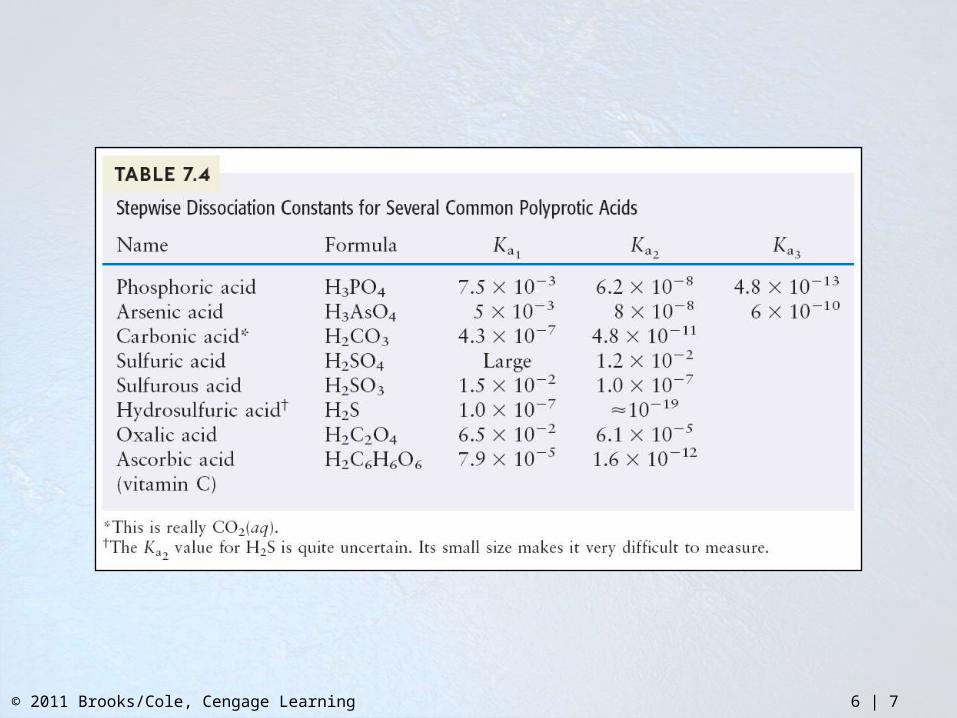
© 2011 Brooks/Cole, Cengage Learning 6 | 7
© 2011 Brooks/Cole, Cengage Learning 6 | 8
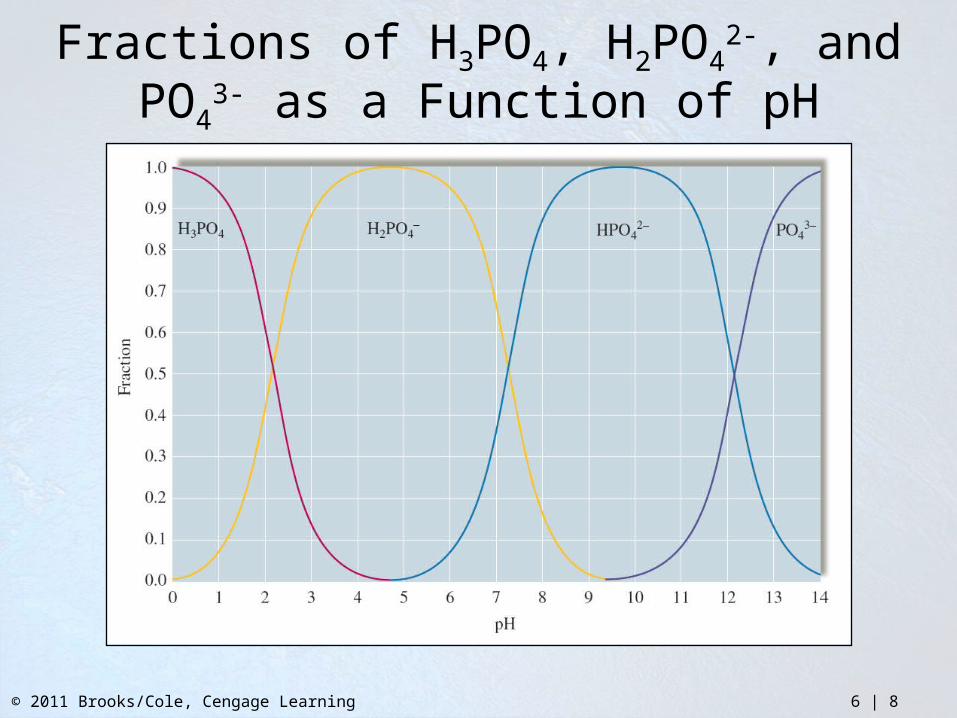
Fractions of H3PO4, H2PO42-, and PO4
3- as a Function of pH
© 2011 Brooks/Cole, Cengage Learning 6 | 9
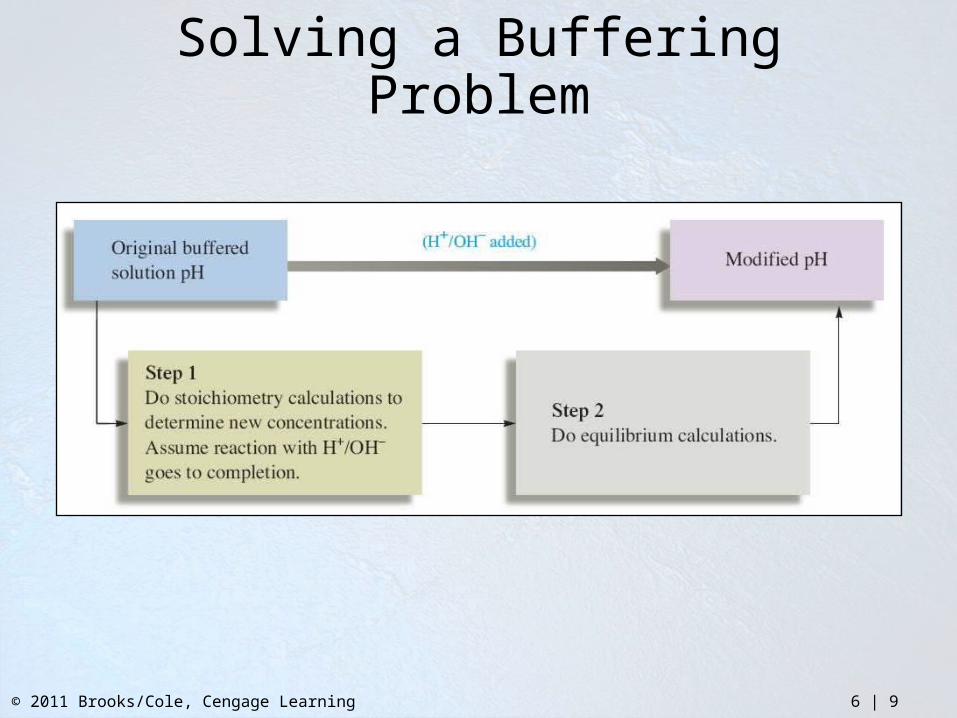
Solving a Buffering Problem
© 2011 Brooks/Cole, Cengage Learning 6 | 10
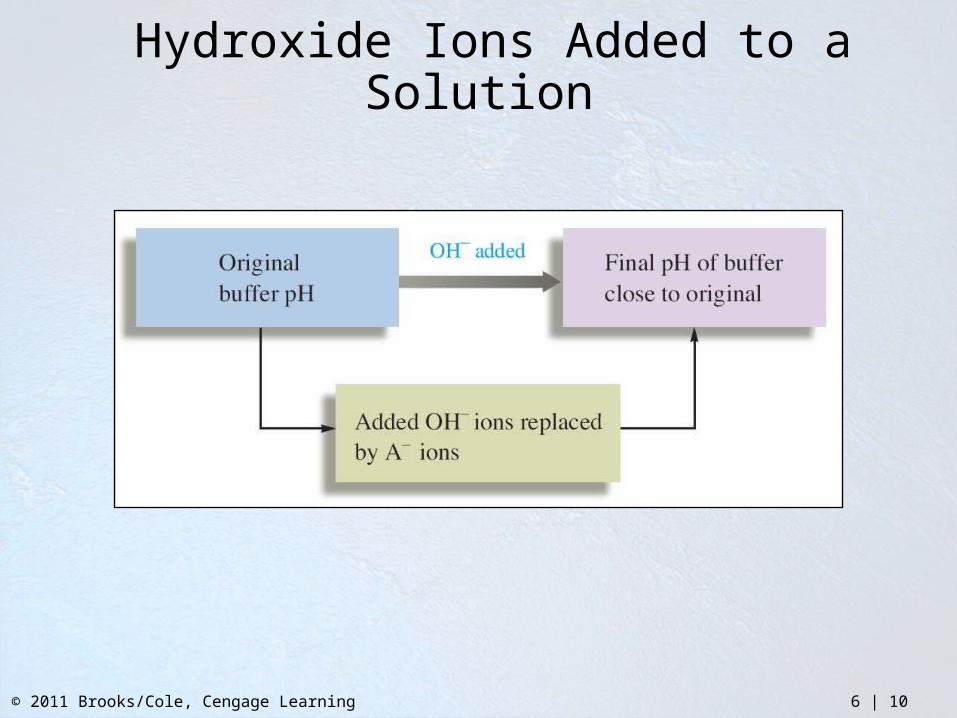
Hydroxide Ions Added to a Solution
© 2011 Brooks/Cole, Cengage Learning 6 | 11
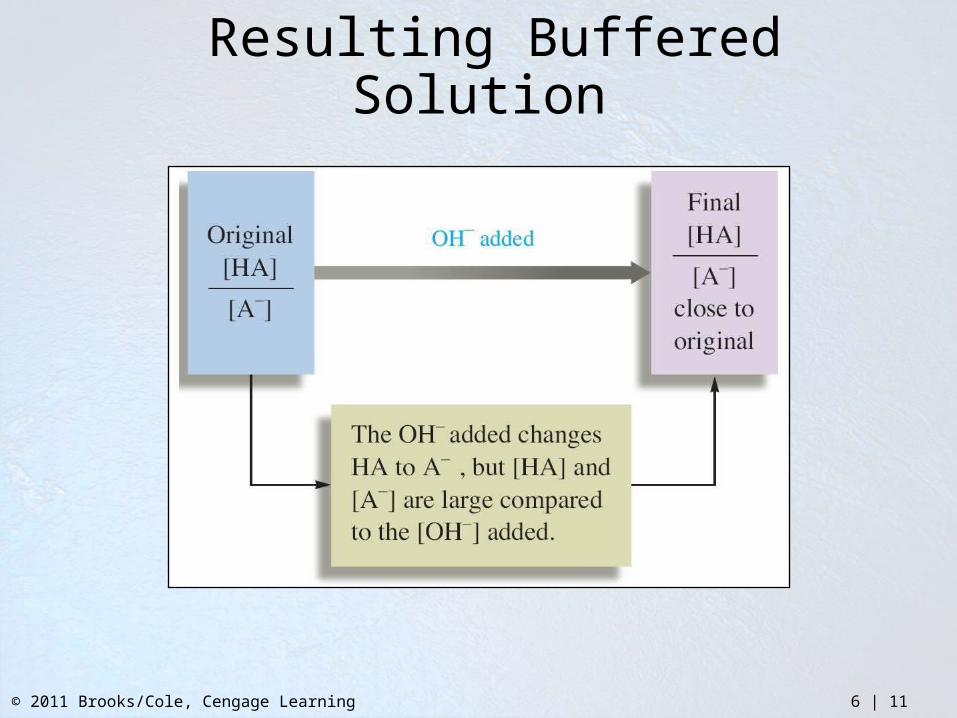
Resulting Buffered Solution
© 2011 Brooks/Cole, Cengage Learning 6 | 12
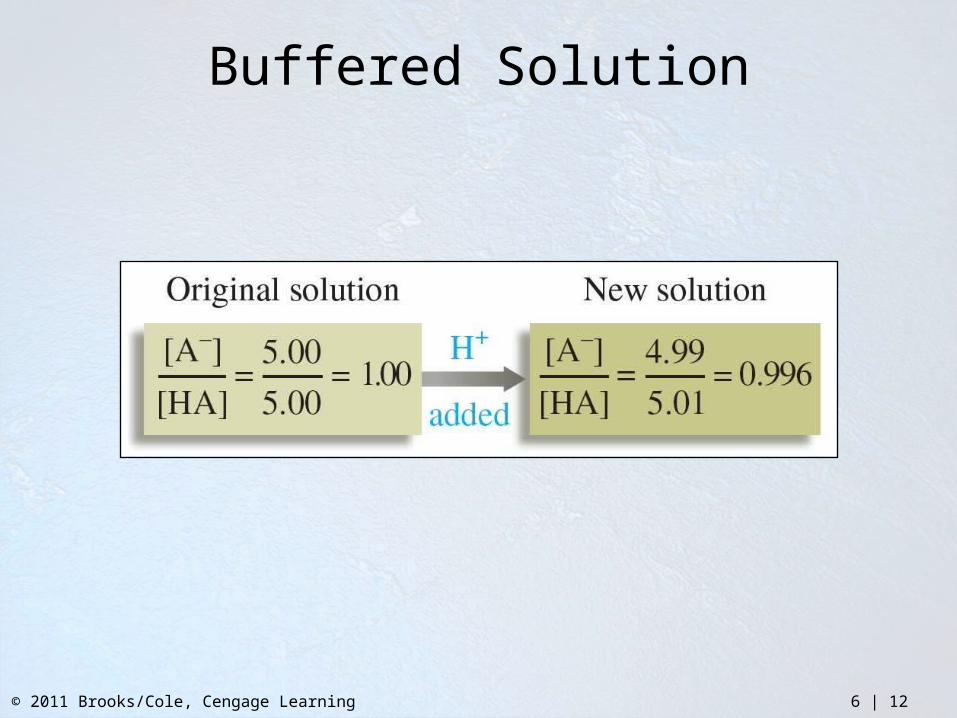
Buffered Solution
© 2011 Brooks/Cole, Cengage Learning 6 | 13
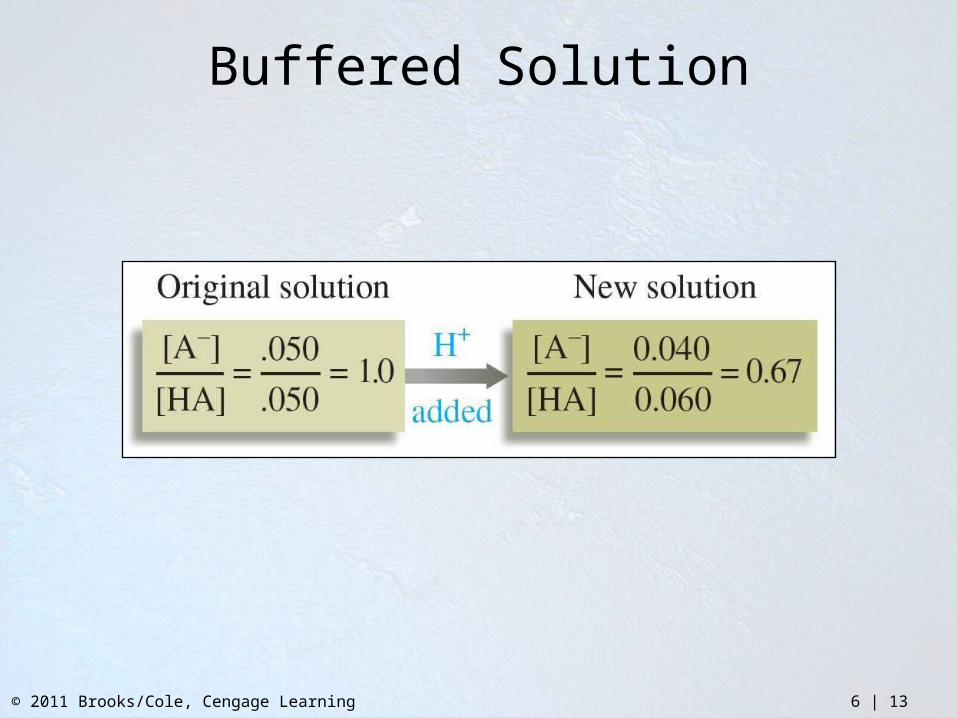
Buffered Solution
© 2011 Brooks/Cole, Cengage Learning 6 | 14
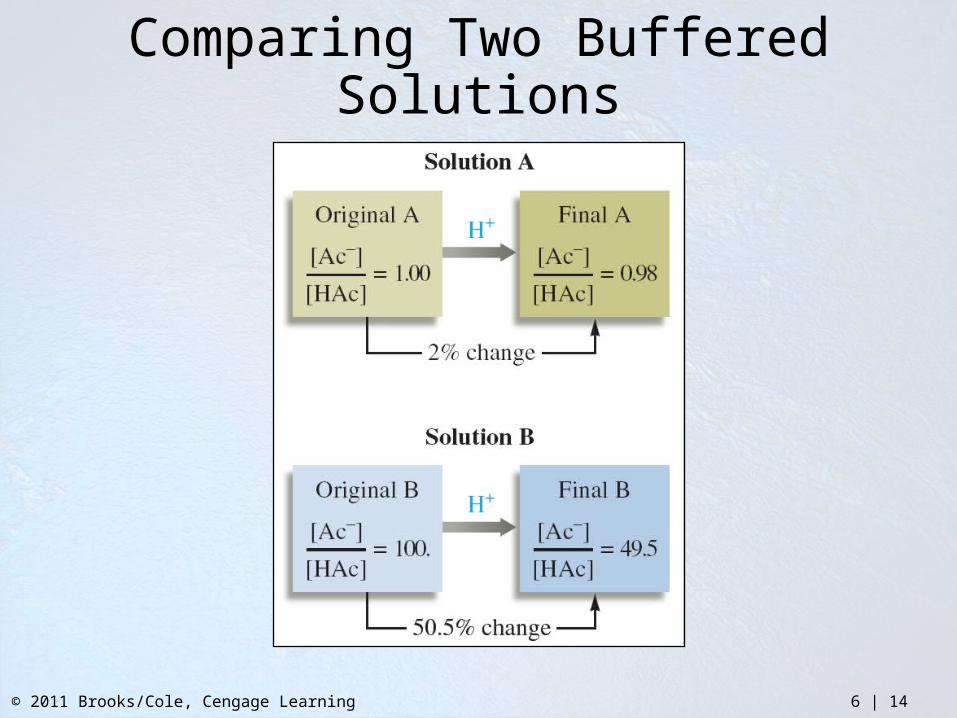
Comparing Two Buffered Solutions
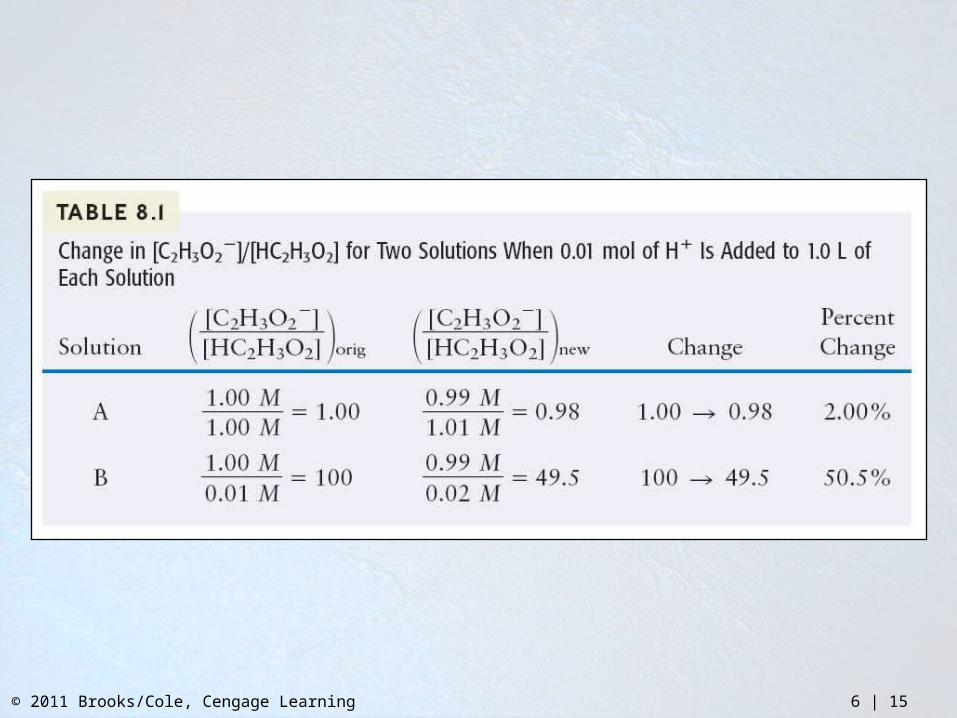
© 2011 Brooks/Cole, Cengage Learning 6 | 15
© 2011 Brooks/Cole, Cengage Learning 6 | 16
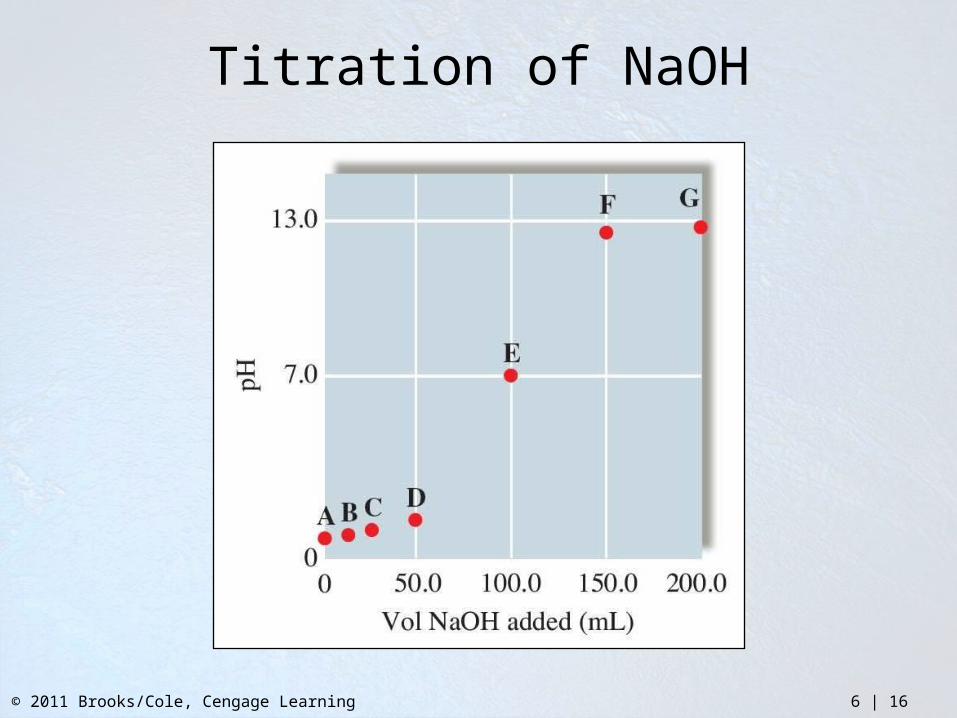
Titration of NaOH
© 2011 Brooks/Cole, Cengage Learning 6 | 17
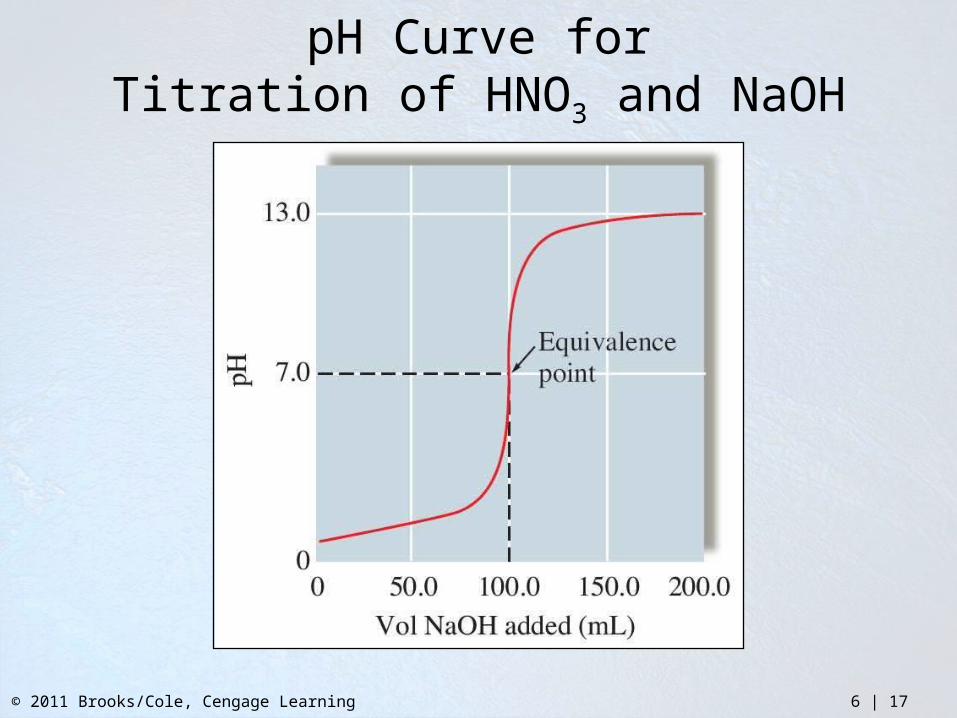
pH Curve forTitration of HNO3 and NaOH

© 2011 Brooks/Cole, Cengage Learning 6 | 18
pH Curve forTitration of NaOH and HCl
© 2011 Brooks/Cole, Cengage Learning 6 | 19
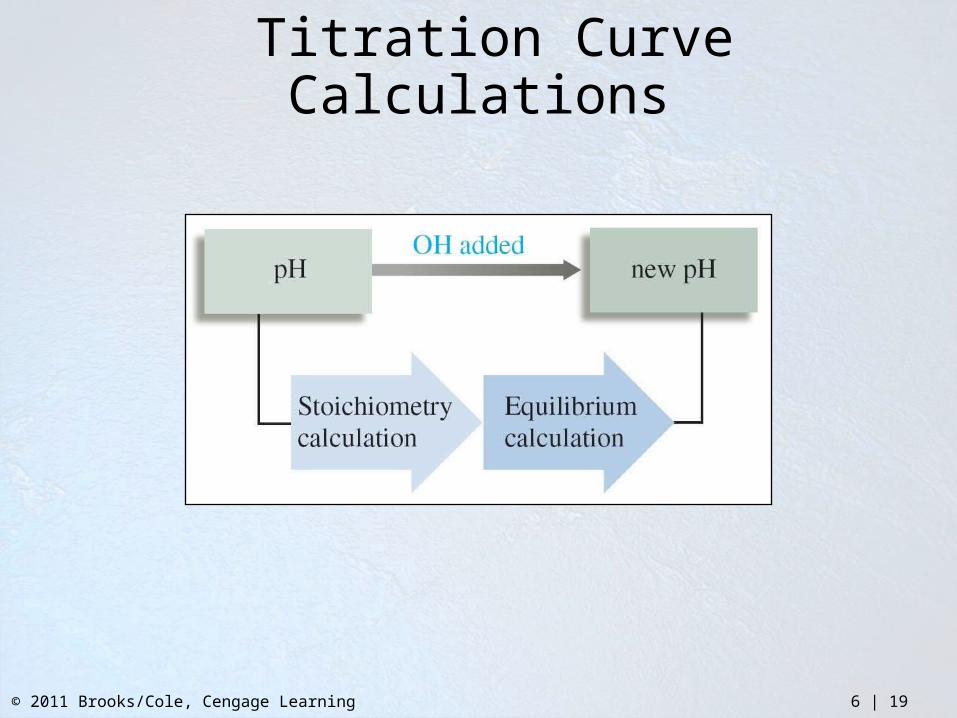
Titration Curve Calculations
© 2011 Brooks/Cole, Cengage Learning 6 | 20
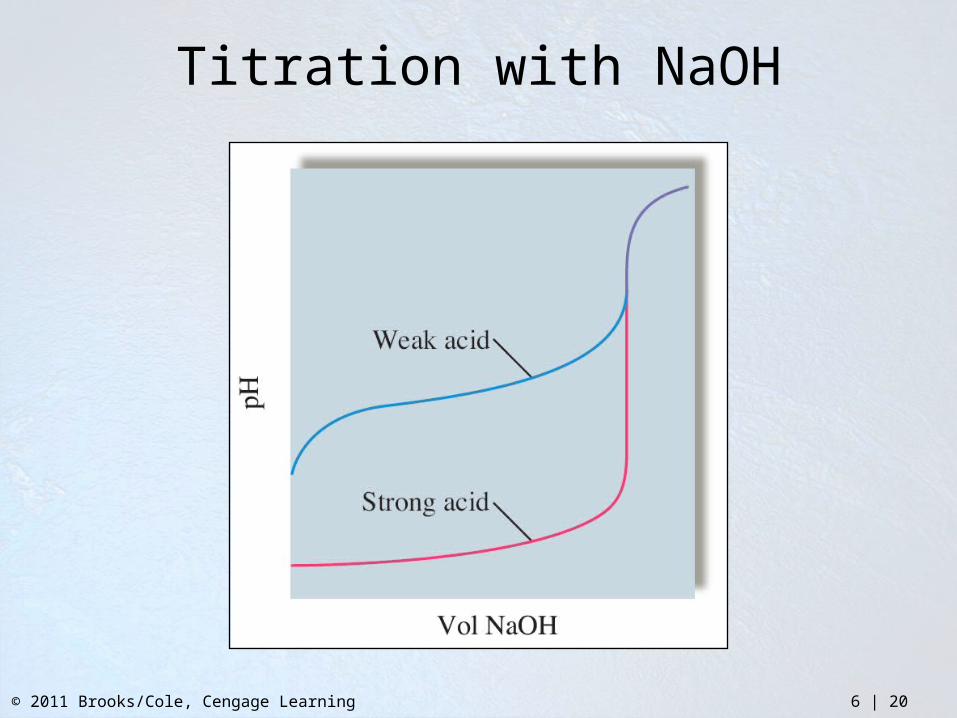
Titration with NaOH
© 2011 Brooks/Cole, Cengage Learning 6 | 21
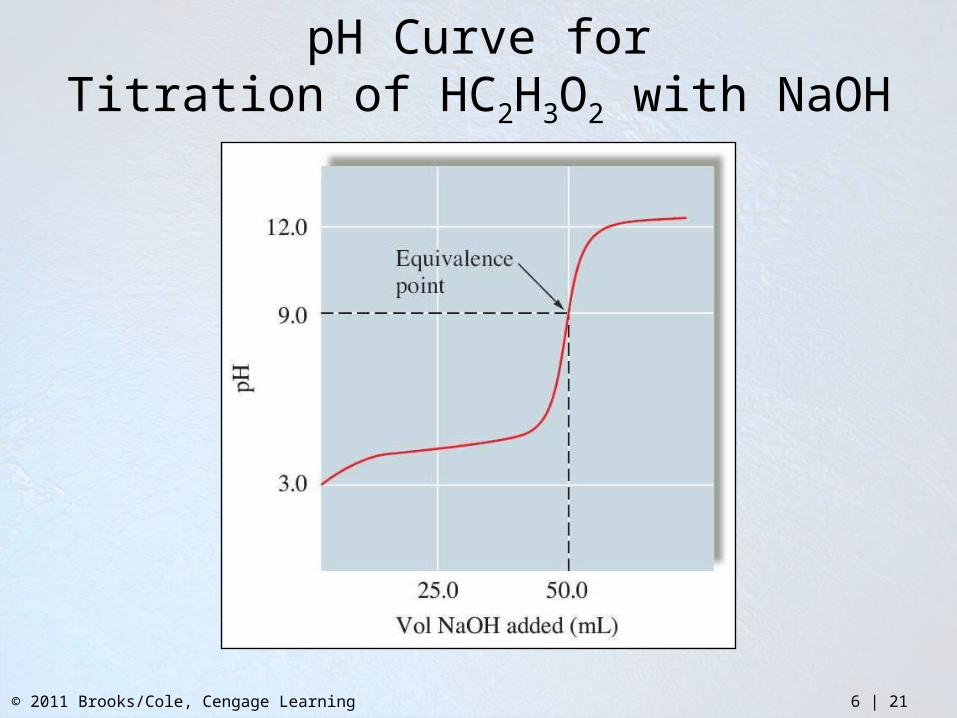
pH Curve forTitration of HC2H3O2 with NaOH
© 2011 Brooks/Cole, Cengage Learning 6 | 22
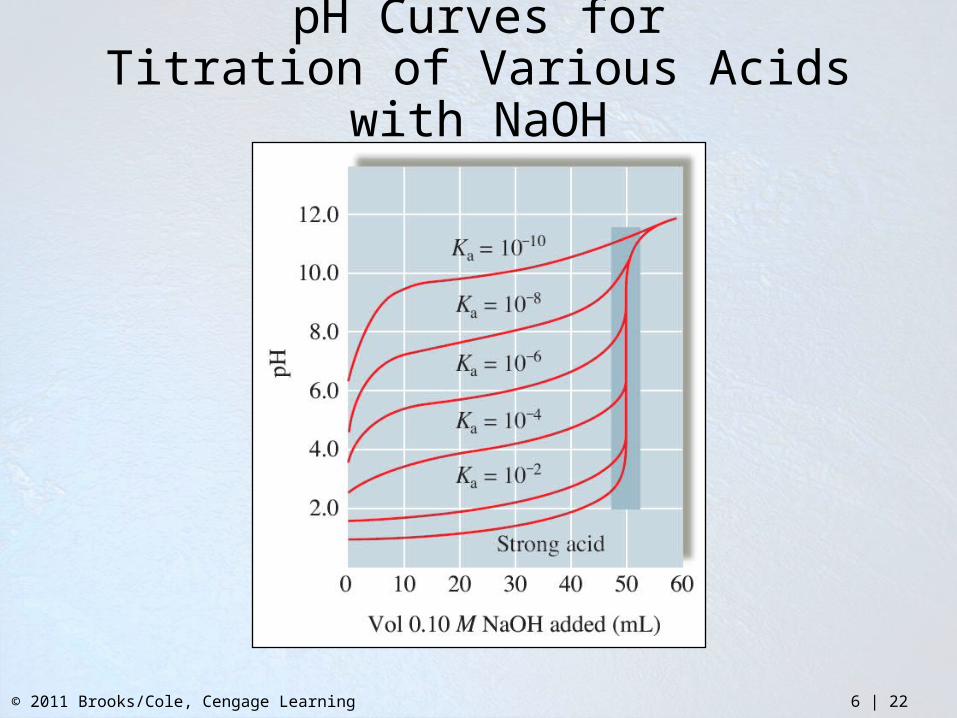
pH Curves forTitration of Various Acids with NaOH
© 2011 Brooks/Cole, Cengage Learning 6 | 23
© 2011 Brooks/Cole, Cengage Learning 6 | 24
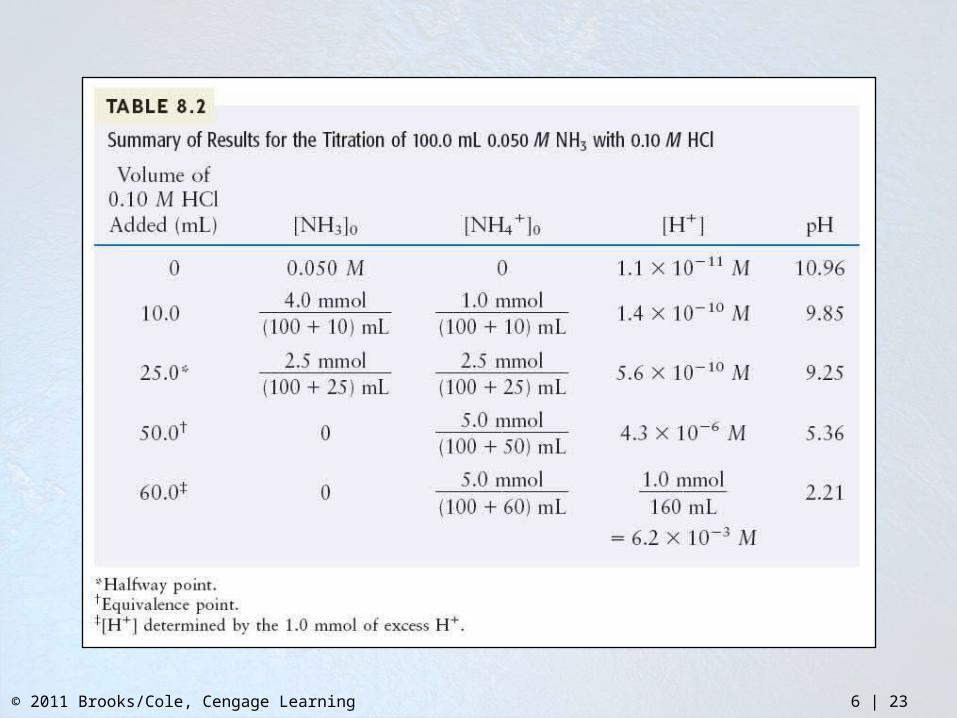
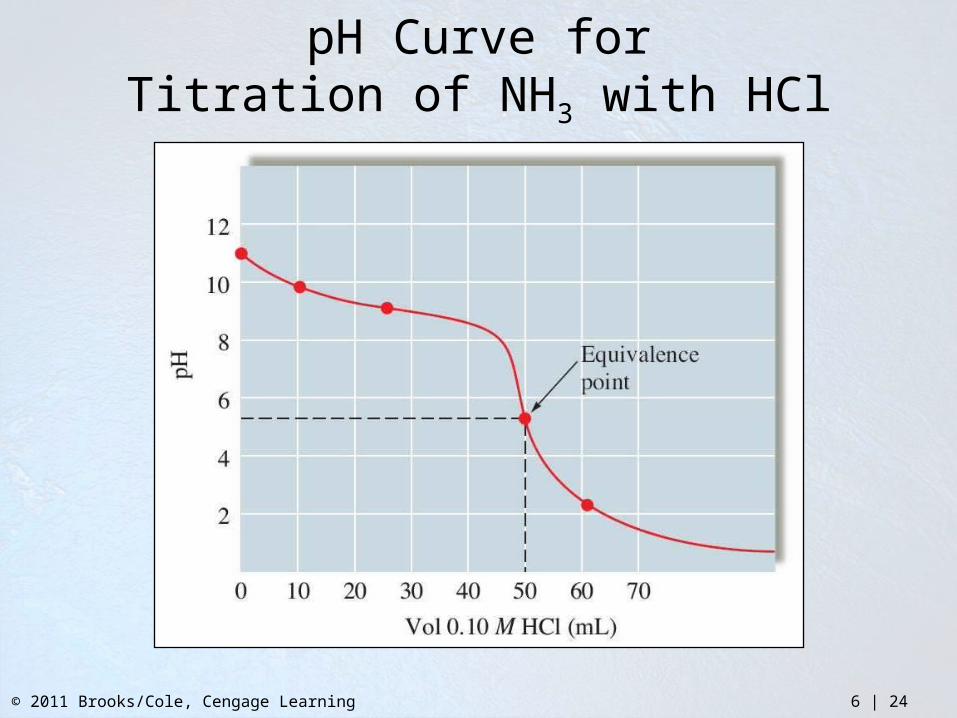
pH Curve forTitration of NH3 with HCl

© 2011 Brooks/Cole, Cengage Learning 6 | 25
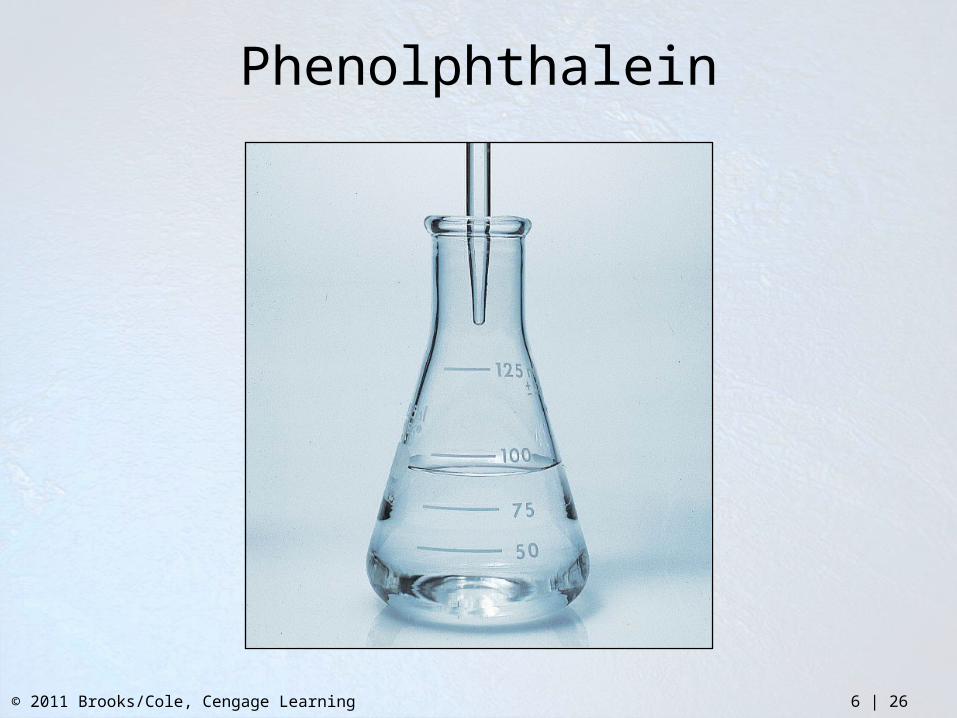
Phenolphthalein
© 2011 Brooks/Cole, Cengage Learning 6 | 26
Phenolphthalein
© 2011 Brooks/Cole, Cengage Learning 6 | 27
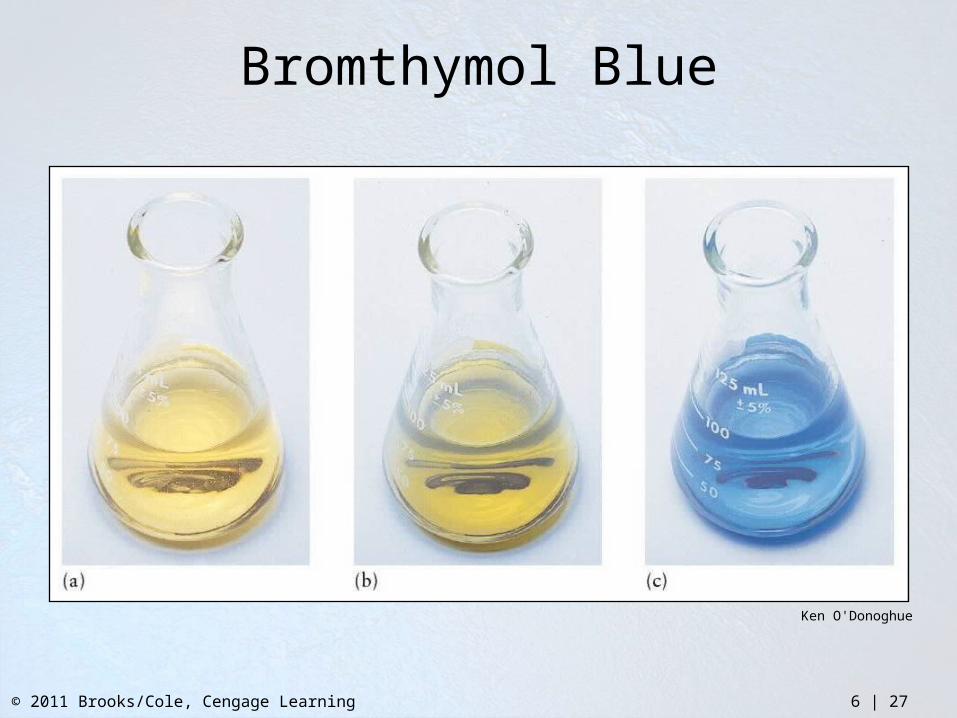
Bromthymol Blue
Ken O'Donoghue
© 2011 Brooks/Cole, Cengage Learning 6 | 28
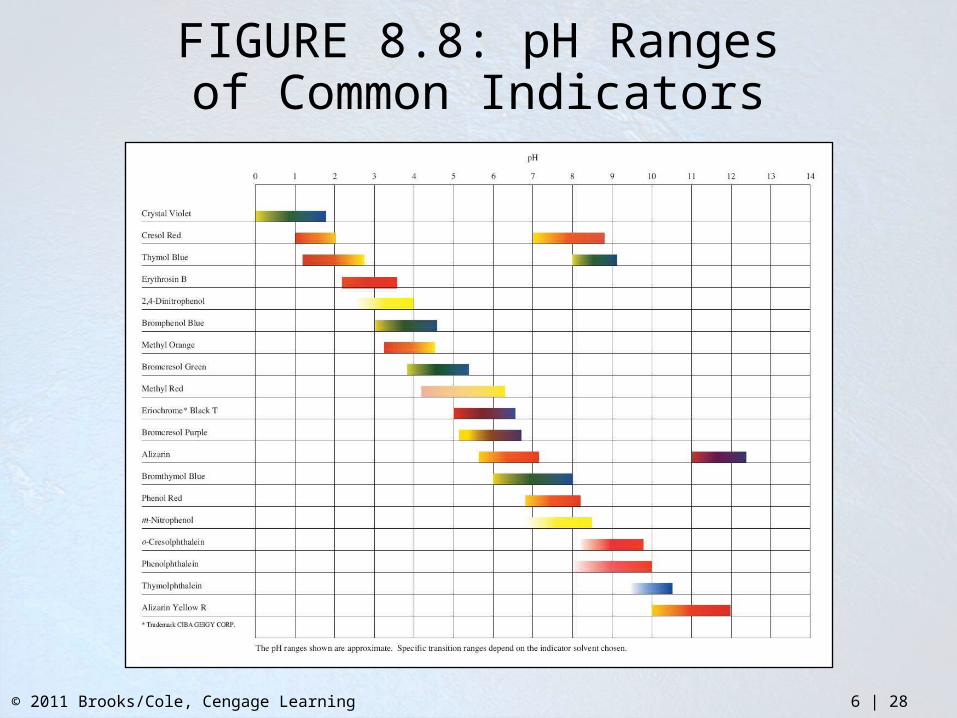
FIGURE 8.8: pH Rangesof Common Indicators
© 2011 Brooks/Cole, Cengage Learning 6 | 29
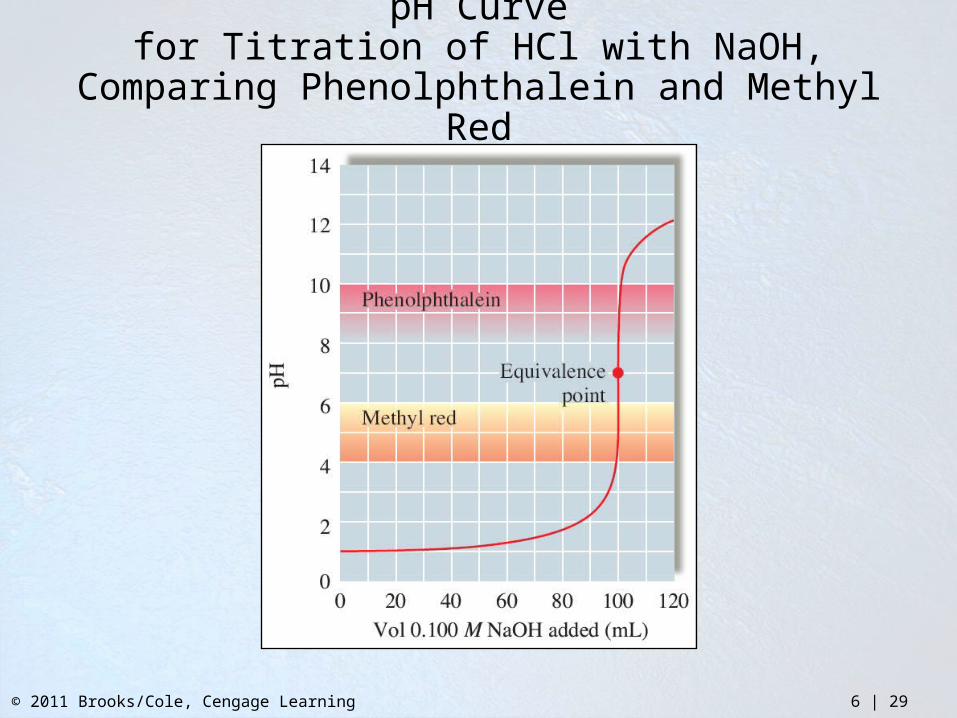
pH Curvefor Titration of HCl with NaOH,
Comparing Phenolphthalein and Methyl Red
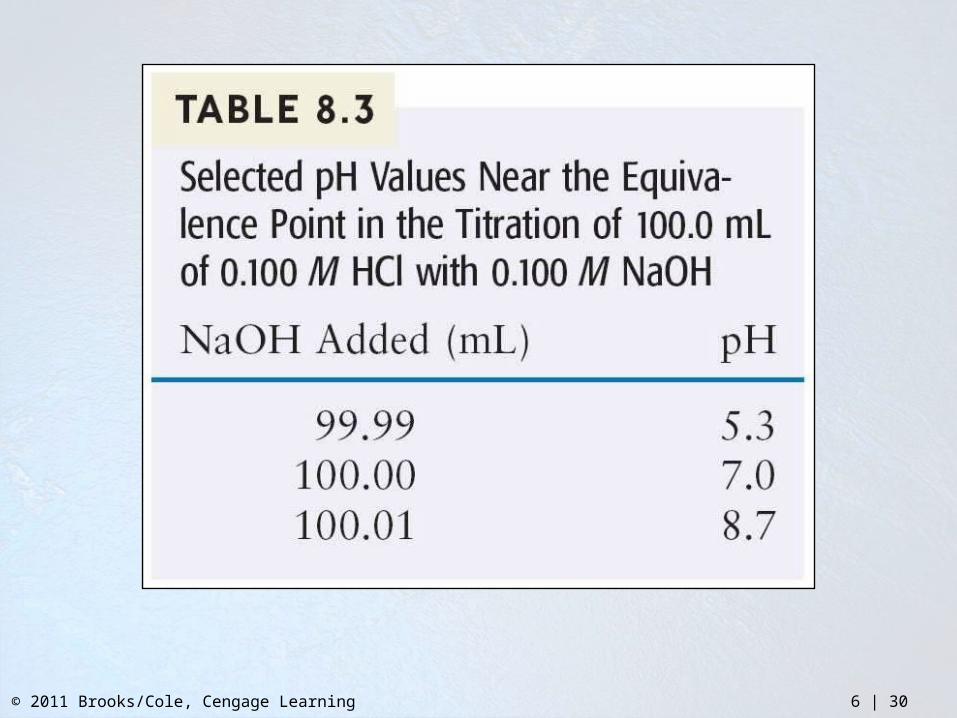
© 2011 Brooks/Cole, Cengage Learning 6 | 30
© 2011 Brooks/Cole, Cengage Learning 6 | 31
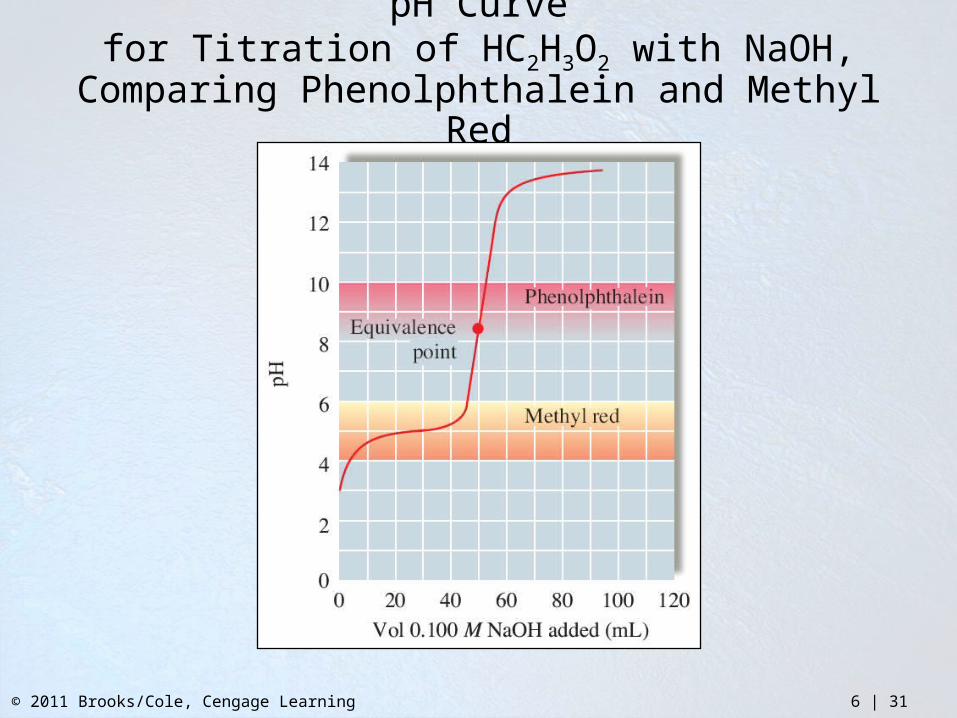
pH Curvefor Titration of HC2H3O2 with NaOH,
Comparing Phenolphthalein and Methyl Red
© 2011 Brooks/Cole, Cengage Learning 6 | 32
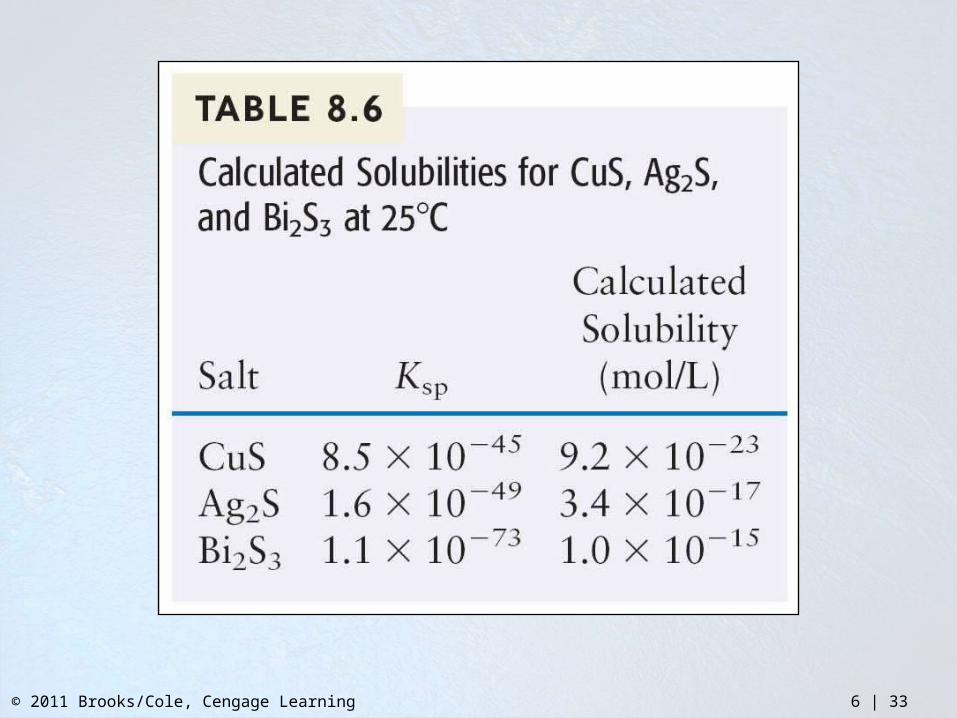
© 2011 Brooks/Cole, Cengage Learning 6 | 33
© 2011 Brooks/Cole, Cengage Learning 6 | 34
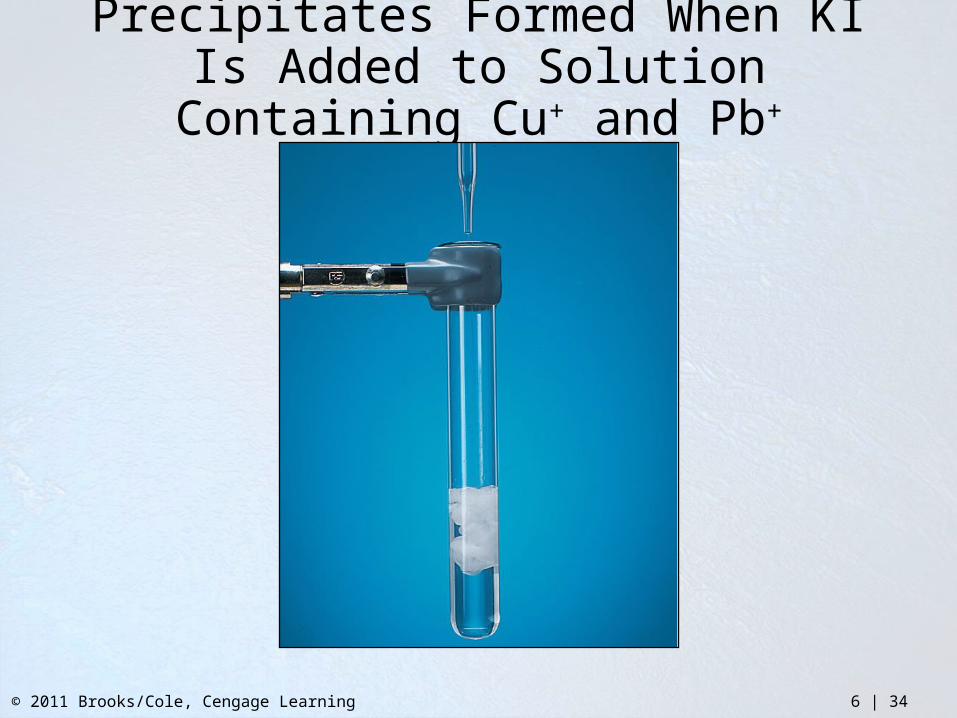
Precipitates Formed When KI Is Added to Solution Containing Cu+ and Pb+
© 2011 Brooks/Cole, Cengage Learning 6 | 35
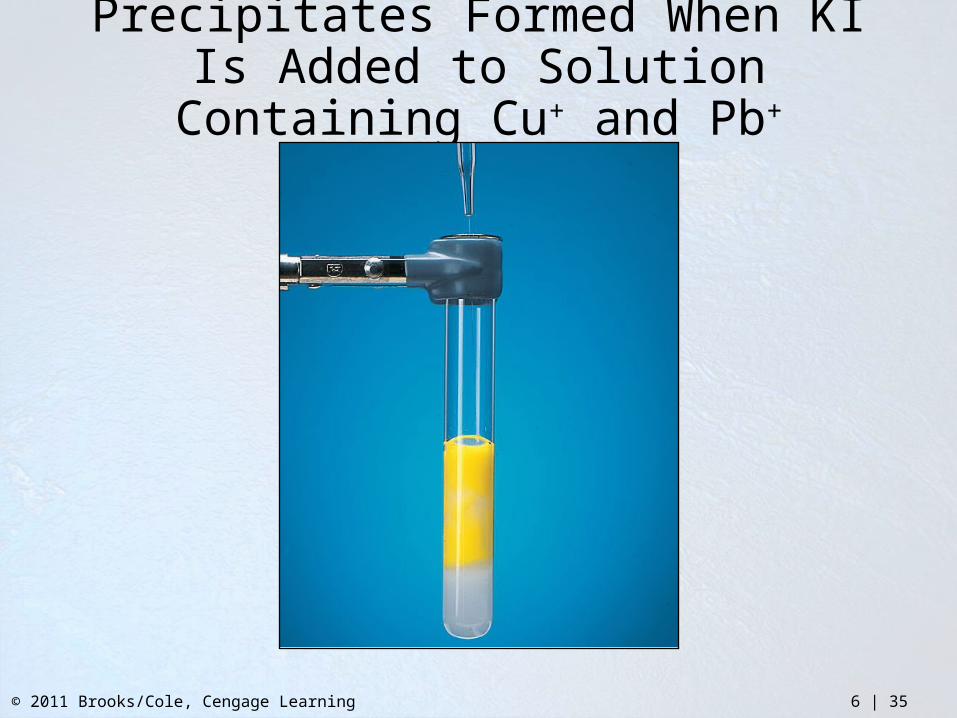
Precipitates Formed When KI Is Added to Solution Containing Cu+ and Pb+
© 2011 Brooks/Cole, Cengage Learning 6 | 36
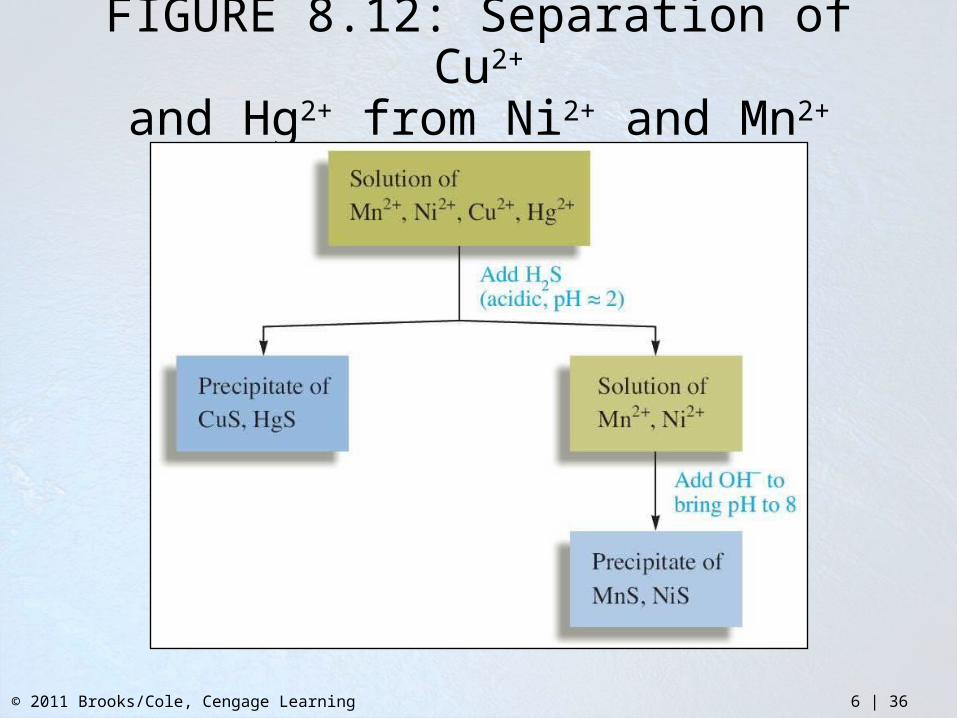
FIGURE 8.12: Separation of Cu2+
and Hg2+ from Ni2+ and Mn2+
© 2011 Brooks/Cole, Cengage Learning 6 | 37
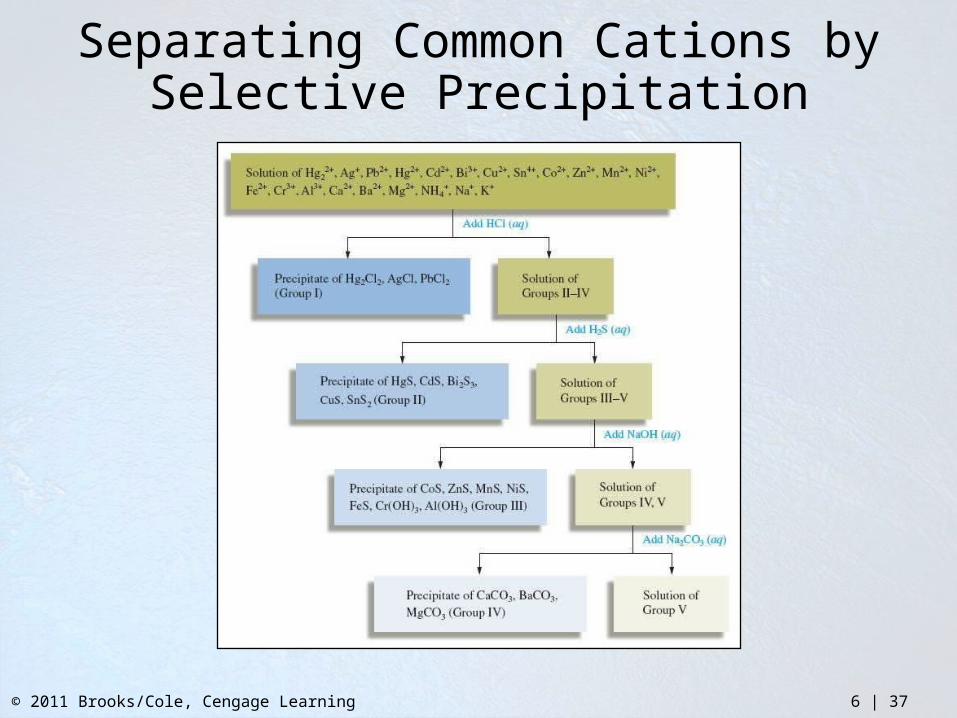
Separating Common Cations by Selective Precipitation
© 2011 Brooks/Cole, Cengage Learning 6 | 38
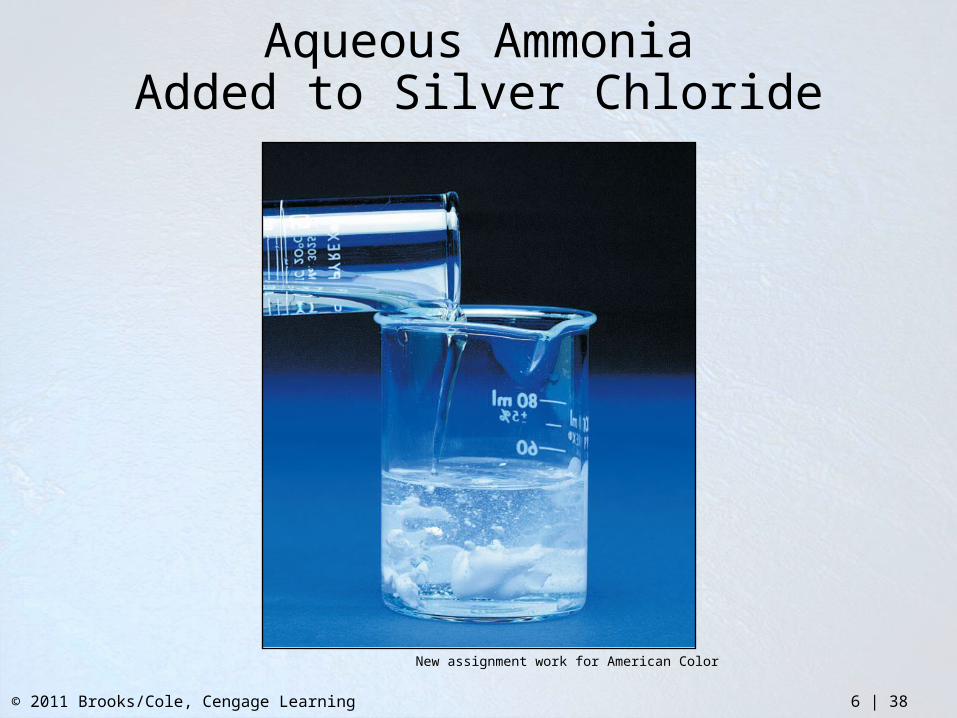
Aqueous AmmoniaAdded to Silver Chloride
New assignment work for American Color
© 2011 Brooks/Cole, Cengage Learning 6 | 39
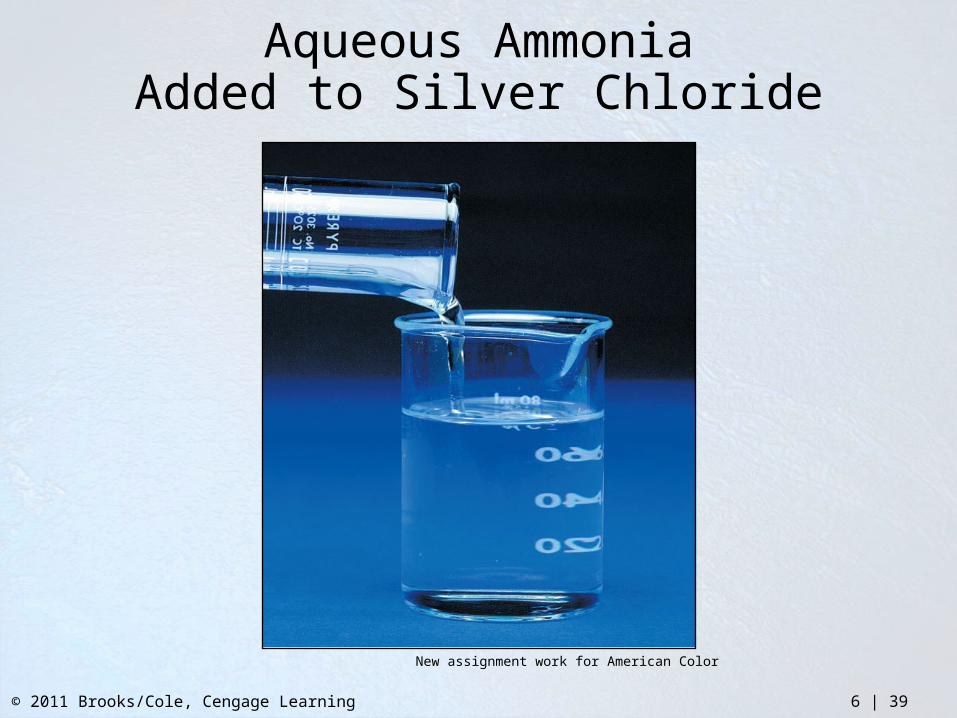
Aqueous AmmoniaAdded to Silver Chloride
New assignment work for American Color
© 2011 Brooks/Cole, Cengage Learning 6 | 40
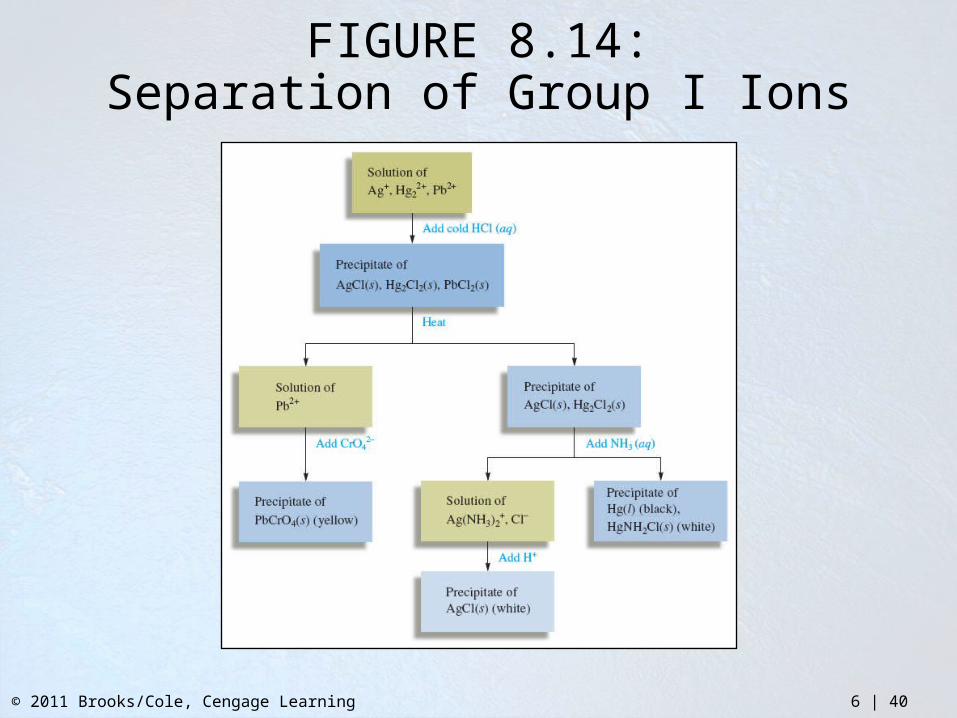
FIGURE 8.14:Separation of Group I Ions
© 2011 Brooks/Cole, Cengage Learning 6 | 41
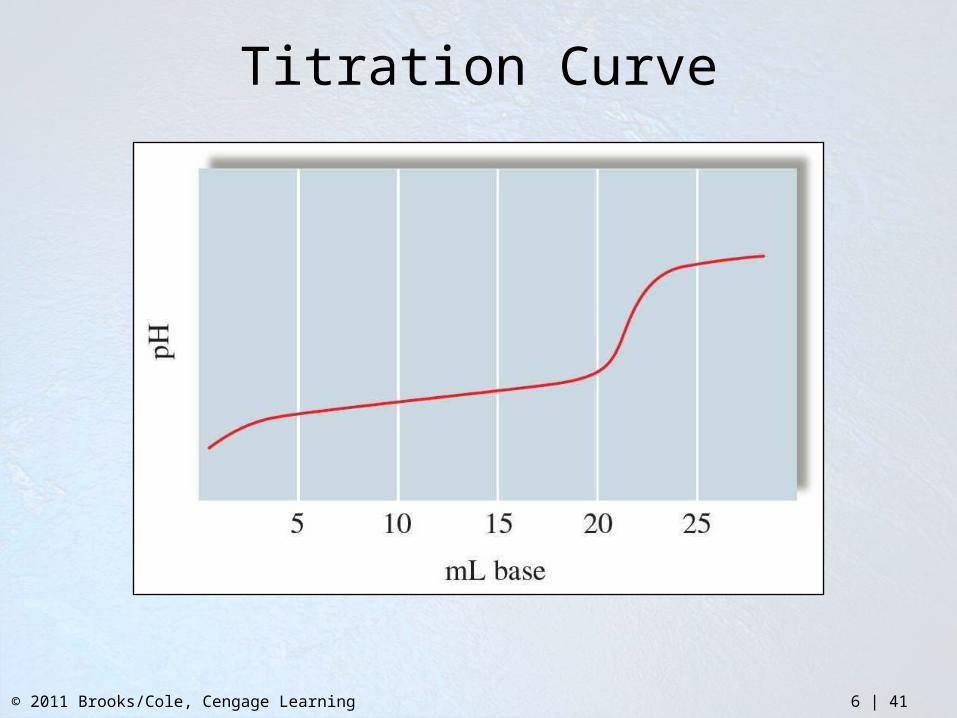
Titration Curve
© 2011 Brooks/Cole, Cengage Learning 6 | 42
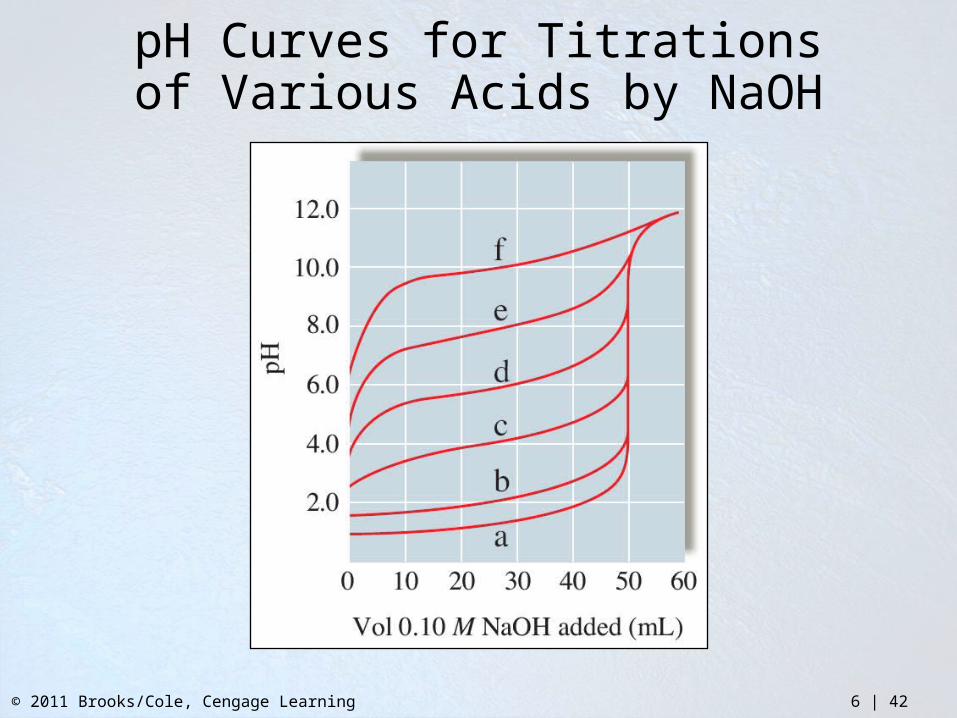
pH Curves for Titrationsof Various Acids by NaOH
© 2011 Brooks/Cole, Cengage Learning 6 | 43
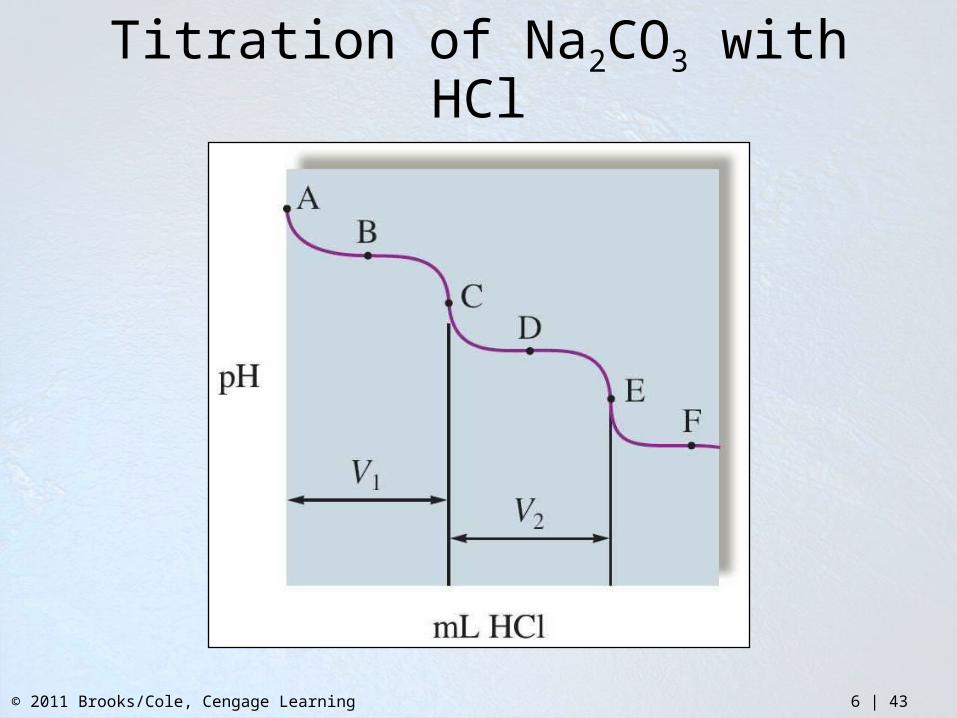
Titration of Na2CO3 with HCl