§ 2 some essential macroeconomic aggregates€¦ · § 2 some essential macroeconomic aggregates...
TRANSCRIPT

§ 2 Some Essential Macroeconomic Aggregates
2.1 Defining Gross Domestic Product (GDP)
2.2 Deriving GDP in Volume
2.3 Defining Demand: the Role of Investment and Consumption
2.4 Reconciling Global Output and Demand2.4 Reconciling Global Output and Demand
2.5 Reconciling Global Output and Income
2.6 Summary: Three Ways to Measure GDP
2.7 Some Additional Macroeconomic Indicators
Bibliography: Lequiller, F. / Blades, D. (2014): Understanding National Accounts. 2nd
ed. Paris, Chapter 1. http://www.oecd.org/std/UNA-2014.pdf
Prof. Dr. Franke-Viebach 1

2010 2011 2012 2013
Private final consumption 0,8 1,7 0,6 1,0Gross capital formation 9,8 7,6 -4,9 -0,5Gross domestic product 4,0 3,1 0,9 0,4
Table 2.1: Main Macroeconomic Aggregates for Germanya)
1993 SNA, 2005 euros,annual percentage change
Prof. Dr. Franke-Viebach2
Gross domestic product 4,0 3,1 0,9 0,4Imports 10,9 7,5 2,2 1,9Exports 13,4 7,9 4,3 0,9Household net saving ratio 10,9 10,4 10,3 10,3GDP Deflator 0,9 0,8 1,3 1,2Government net lending, as a percentage of GDP -4,2 -0,8 0,2 -0,2OECD (2013): Economic Projections (database): OECD Economic Outlook No.93, June 2013
a) The „OECD Economic Outlook“ used for this table dates from May 2013. At that time, the data for 2013 and 2014 were forecasts by the OECD economists..
→ Exercise 1 of § 2
2.1 Defining Gross Domestic Product (GDP)
(1) Definition: GDP
= measure of total output (with no double counting) carried out by all units in a given country
during a given period
(2) Avoiding double counting
(a) Idea
− indicator measuring an economic unit‘s contribution to GDP should only reflect that unit‘s own effort („value added“)
− consequence: GDP independent from organisation of production in the economy
Prof. Dr. Franke-Viebach3

b) Example: Pasta Industry
Year 1 Firm A
Output $ 100,000 [$/year]
= 100 [ton/year] x 1,000 [$/ton]
Prof. Dr. Franke-Viebach 4
Year 2 Firm A1 Firm A2
Output $ 30,000 $ 100,000
− problem: simply adding the two outputs → overstating macroeconomicproduction
− solution: summing up values added → indicator of macro productionindependent from organisation of production
− illustration: divison of labour continued (see next accounts)

Year 1 Farmer Firm A Macroeconomy
Input Labour, Machinery Labour , Machinery, Wheat
Output Wheat: $ 10,000 Pasta: $ 100,000 $ 110,000
Intermediate
Consumption
0 Wheat: $ 10,000 $ 10,000
Prof. Dr. Franke-Viebach 5
Value Added $ 10,000 $ 90,0000 $ 100,000
Year 2 Farmer Firm A1 Firm A2 Macroeconomy
Input Labour, Machinery Labour, Machinery,
Wheat
Labour, Machinery,
Flour
Output Wheat: $ 10,000 Flour: $ 30,000 Pasta: $ 100,000 $ 140,000
Intermediate
Consumption
0 Wheat: $ 10,000 Flour: $ 30,000 $ 40,000
Value Added $ 10,000 $ 20,000 $ 70,000 $ 100,000

(3) Conclusion: using value added
(a) GDP = sum of values addedmore precisely (see below): sum of gross values added plus taxes on
products minussubsidies on products
(b) Benefit of using value added: respect of three essential rules when moving from micro to macro
Prof. Dr. Franke-Viebach 6
moving from micro to macrolevel
− avoid double counting− devise aggregates whose value is independent of non-economic
factors− create indicators that are measurable in practice

(4) GDP versus GNP/GNI
(a) “Domestic” is in opposition to “National”
(b) GNI income of all economic agents residing within the domestic economic territory
Prof. Dr. Franke-Viebach 7

- Conversion of GDP into GNI:
GNI = GDP + income received by resident units from abroad - Income created by production in the domestic
country but paid to units residing abroad
- Examples:- Labor income
Prof. Dr. Franke-Viebach 8
- Labor income
- Capital income

- Empirical Results
Prof. Dr. Franke-Viebach 9

(5) „NET“ aggregates
(a) GDP versus NDP
• Production: Conversion of input into outputs• outputs: goods and services• inputs: goods and services (intermediate consumption), labor, capital (i.e.
real capital)
• Aim: measurement of the new wealth created during the period
Prof. Dr. Franke-Viebach 10
• Aim: measurement of the new wealth created during the period
• Action: deduction for the cost of using up capital (consumption of fixed capital)
• Result: NDP = GDP - consumption of fixed capital
= sum of net values added

(b) GNI versus NNI
NNI = GNI – consumption of fixed capital
(c) In practice: preference for gross aggregates
Prof. Dr. Franke-Viebach 11
• Methods for calculating consumption of fixed capital differ between countries
• When ranking countries or when analyzing growth, differences between gross and net values are small

2.2 Deriving GDP in value
• Aim: distinguishing elements of change of aggregates
• [1 + the growth rate (divided by 100) of GDP at current prices]
= [1 + the growth rate (divided by 100) of GDP in volume]
x [1 + the growth rate (divided by 100) of the GDP deflator] x [1 + the growth rate (divided by 100) of the GDP deflator]
• In absolute levels: GDP at current prices = GDP in volume x deflator, where deflator = price index/100
Prof. Dr. Franke-Viebach12

- Empirical example
- Exercise 3 of §2
Prof. Dr. Franke-Viebach13

2.3 Defining demand: the role of investment and consumption
(1) gross capital formation (GCF)
Prof. Dr. Franke-Viebach14

(2) Private final consumption
• Concept:• All purchases made by consumers
• That are consumed (“used up”) during the period
• “final”• Households and non-profit institutions serving households
• Relevance: Most important component of GDP• Relevance: Most important component of GDP
Prof. Dr. Franke-Viebach15

2.4 Reconciling Global Output and Demand
(1) Fundamental equality• GDP = Final consumption + gross capital formation (Ig) + net exports of goods and
services (TB)
Prof. Dr. Franke-Viebach16
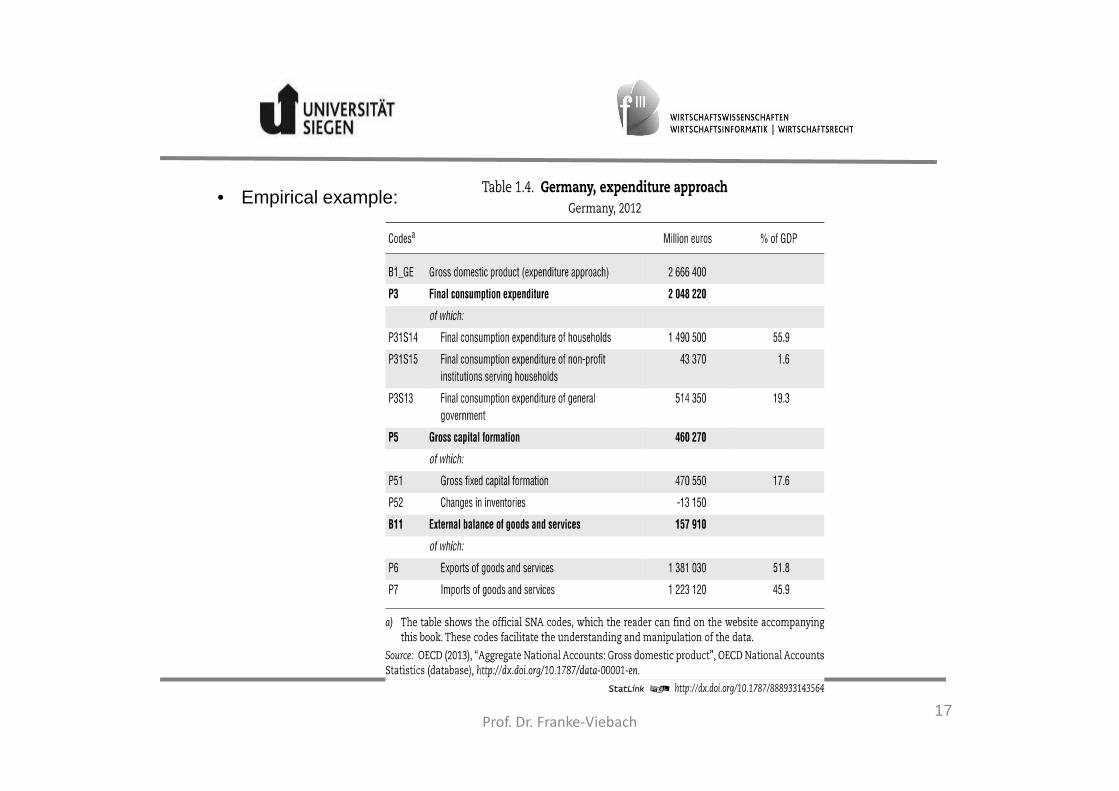
• Empirical example:
Prof. Dr. Franke-Viebach17

• This “expenditure approach” illustrates the Keynesian idea
• Exercise 2• Exercise 7
Prof. Dr. Franke-Viebach18

(2) Macroeconomic supply and demand
GDP + Imports = Household consumption + GCF + Exports
ysg yd
g
(3) Contribution to growth(3) Contribution to growth
GDPt = Ct+ It+ EXt
Prof. Dr. Franke-Viebach19

weight Growth rate
Prof. Dr. Franke-Viebach20
weight Growth rate
Growth contribution of consumption
• Exercise 4• Exercise 8

2.5 Reconciling global output and income
(1) Production
Inputs Outputs
Intermediate consumptionIntermediate consumption
(of goods and services)
Use of capital
Labor services
Prof. Dr. Franke-Viebach21
Value added (net
output)
Gross output

(2) Generation of income
• Capital income and labor income
• Equals value added
• Revenues (“profits”)
• Costs
Prof. Dr. Franke-Viebach22

(3) Income approach to GDP
GDP = compensation of employees+ gross operating surplus and gross mixed income+ taxes less subsidies on production and imports
Prof. Dr. Franke-Viebach23

Note:
• Compensation of employees
• “mixed income”• “mixed income”
• “gross” operating surplus
Prof. Dr. Franke-Viebach24

2.6 Summary: three ways to measure GDP
• Output approach
• Final demand approach
• Income approach
Prof. Dr. Franke-Viebach25

Prof. Dr. Franke-Viebach26

2.7 Some Additional Macroeconomic Indicators
(1) Household saving ratio
= saving by households / disposable income of households
Prof. Dr. Franke-Viebach27

Relevance:
Prof. Dr. Franke-Viebach28

(2) General government financial balance
• General government: central government, local authorities, social security and the various organizations depending on them
• Official name is “net lending/net borrowing of general government”
• Calculated as sum of general government revenueminussum of general gov. expenditures
Exercise 5
Prof. Dr. Franke-Viebach29