zhob district profile - rspn.org · domestic poultry 288,848 (gob, 2014-15) ... set up of local...
TRANSCRIPT

Zhob District Profile

Written by
Asmat Kakar, Monitoring and Evaluation Officer BRDCEP, RSPN
©2017 Rural Support Programmes Network (RSPN), Balochistan Rural Support
Programme (BRSP), and National Rural Support Programme (NRSP). All rights Reserved.
www.rspn.org; www.brsp.org.pk; www.nrsp.org.pk
“This publication has been produced with the assistance of the European
Union. The contents of this publication are the sole responsibility of Rural
Support Programmes Network (RSPN), Balochistan Rural Support
Programme (BRSP), and National Rural Support Programme (NRSP) and can in no way
be taken to reflect the views of the European Union.”
More information about the European Union is available on:
Web: http://eeas.europa.eu/delegations/pakistan/
Facebook: European-Union-in-Pakistan/269745043207452

CONTENTS
Acronyms and Abbreviations .............................................................. 1
1. District Profile Brief ................................................................. 2
2. Demography and Population ........................................................ 4
3. District Administration .............................................................. 5
4. Agriculture and Horticulture........................................................ 8
5. Gender and Women Empowerment ................................................. 9
6. Health and WASH ................................................................. 10
7. Education ........................................................................... 12
Bibliography .............................................................................. 17
List of Figures and Tables
Figure 1: District Map ............................................... Error! Bookmark not defined.
Figure 2: Local Government Administration Organogram (Administrative Setup) ..................... 6
Figure 3: Number of Tube-wells 2014-15 ..................................................................... 9
Figure 4: Stage wise Enrolment 2015-16 ...................................................................... 9
Figure 5: Person Collecting Water in Zhob (%) ........................................................... 10
Figure 6: Rural Children Immunized aged 12-23 months (%) ........................................... 10
Figure 7: Health Facilities 2014-15 ........................................................................... 11
Figure 8: Drinking Water Sources in District .............................................................. 12
Figure 9: Number of Schools 2016-17 ....................................................................... 13
Figure 10: Total School by Level 2016-17 ................................................................... 13
Figure 11: Functional and Non Functional Schools 2016-17 .............................................. 14
Figure 12: Sanctioned and Appointed Staff in Schools 2016-17 .......................................... 14
Figure 13: Student Teacher Ratio 2016-17 .................................................................. 14
Figure 14: Available Facilities in Schools 2016-17 ......................................................... 15
Figure 15: Rural Gross Enrolment Ratio at Primary Level (age 5-9) ................................... 15
Table 1: Demography and Population Pattern of Zhob ..................................................... 4
Table 2: Poverty Status in Zhob ................................................................................ 5
Table 3: Tehsils and Union Councils........................................................................... 6
Table 4: Federal and Provincial Government Departments in Zhob ...................................... 7
Table 5: NGOs working in Zhob ............................................................................... 7
Table 6: Land utilization statistics of Zhob 2014-15 (hectares) ............................................. 8
Table 7: Area Irrigated by different Sources of Irrigation 2014-15 ........................................ 8
Table 8: Member of Household Own Land in Rural Areas ................................................. 8
Table 9: Number of Government & Private Tube-wells 2013-14 ........................................... 9

Table 10: Health Facilities 2014-15 .......................................................................... 10
Table 11: Number of Health Practitioners 2014-15 ........................................................ 11
Table 12: Water and Sanitation Indicators (%) ............................................................ 11
Table 13: Distribution of Rural Household by Source of Drinking Water (%)......................... 12
Table 14: Distribution of Rural Households by Type of Toilet (%) ...................................... 12
Table 15: Rural Education Indicators (%) .................................................................. 15

1
ACRONYMS AND ABBREVIATIONS
AIDS Acquired Immune Deficiency Syndrome
ANC Antenatal Care
ARI Acute Respiratory Infection
BHU Basic Health Unit
BLGO Balochistan Local Government Ordinance
BRDCEP Balochistan Rural Development and Community Empowerment
Programme
BRSP Balochistan Rural Support Programme
DC Deputy Commissioner
DEWS Disease Early Warning System
DHIS District Health Information Software
EPI Expanded Programme on Immunization
EU European Union
GoB Government of Balochistan
HH Household
HMIS Health Management Information Systems
Km Kilometre
LG Local Government
LSO Local Support Organisation
MICS Multiple Indicators Cluster Survey
MNCH Maternal, New born and Child Health
NADRA National Database and Registration Authority
NGO Non-Governmental Organisation
PBS Pakistan Bureau of Statistics
PDMA Provincial Disaster Management Authority
P&D Planning and Development
PSDP Public Sector Development Programme
PSLM Pakistan Social and Living Standards Measurement
RHC Rural Health Clinics
RMC Regional Metrological Centre
RSP Rural Support Programme
RSPN Rural Support Programmes Network
SBA Skilled Birth Attendant
TB Tuberculosis
TBA Traditional Birth Attendance
LHV Lady Health Visitor
LHW Lady Health Worker
LHW-MIS Lady Health Worker - Management Information Systems

2
1. DISTRICT PROFILE BRIEF
Major Factors
District Status: February 1890
Geographical Area: 12,400 Square km
Administrative Units: 2 Tehsils and 24 Union Councils (LG Balochistan)
Major Ethnic Groups: Pashtun
Languages: Pashto,
Climate: Semi-arid
Demography
District Population: 310,544 (2017)
Rural Population: 264,296
Population Growth Rate: 2.52 (average annual 1998-2017)
Household Size: 6.76 persons
Law & Order:
1 Police Station, 4 Levies Thanas (GoB, 2014-15)
Productive Sector
Agriculture Ecological Zone: Cold
Agriculture Land Area (hectares): Cultivated area Net sown: 15,767
Area not available for cultivation: 87,612
Cultivable waste: 73,991 (GoB, 2014-15)
Major Crops: Rabi Crops: Wheat, Rapeseed /Mustard, Barley,
Vegetables, Fodder
Kharif Crops: Sorghum, Maize, Mung & Mash bean,
Melons, Chilies, Fodder
Major Fruits: Apples, Almond, Apricots, Grapes
Livestock Population:
Livestock 2841,636
Domestic poultry 288,848 (GoB, 2014-15)
Veterinary Institutions: 6 Veterinary Hospitals, 52 Veterinary Dispensaries
Telecommunications: 1 Telephone exchanges, 1312 Landlines
Post offices: 8 Post Offices (GoB, 2014-15)
Social Sector
Drinking Water Sources: 70% Improved, 30% Un-improved (MICS, 2010)
Sanitation Facilities: 62 % Improved, 38% Un-improved (MICS, 2010)

3
Health Facilities: 1 Hospital (Public Sector)
4 Rural Health Centre RHC
16 Dispensaries (GoB, 2014-15)
Pre-Natal consultation: 50% (% of cases) (PSLM, 2014-15)
Major Diseases: ARI, Pneumonia, Diarrhea, Viral Hepatitis, Typhoid,
Dental Caries
Special Health Programmes: Expanded Program on Immunization, TB Control Program,
Hepatitis Prevention and Control Program, Malaria Control
Program, AIDS Control Program, MNCH Program,
National Program for Family Planning & Primary Health
Care
Reporting and Surveillance Systems: HMIS and DHIS, Disease Early Warning System,
LHW-MIS
Number of Schools: Girls 19%, Boys 78%, Co-education 3%
Primary level Rural Gross Enrolment Ratio (age 5-9): Female 18, Male 63
GEOGRAPHIC MAP
Zhob district is located, 1408 meter above sea level, in the northwest of Balochistan
province. During British Raj its name was Fort Sandeman. It is bordered with Afghanistan
to the northwest, Killa Saifullah and Loralai districts to the south, Sherani district and
Federally Administered Tribal Area (FATA) to the northeast and Musakhail district to the
east.

4
HISTORY, TRIBES AND LANGUAGES
Zhob is a historical town located in northwest Balochistan. Before British invasion, its
name was Appozai, British named it Fort Sandeman after Sir Robert Sandeman, British
colonial administrator. It was given district status in 1890. Kakar, Mandokhail, Sherani and
Harifal are the main tribes living in the district. Mostly inhabitants speak Pashto.
2. DEMOGRAPHY AND POPULATION
According to 2017 census, total population of district Zhob is 310,544, with 54.21% male
and 45.79% is female, as compared to 193,458 in 1998. Male-female sex ratio is 118.41
and population growth rate is 2.52% per year. Urban population of the district is 46,248
(14.89%) and rural population is 264,296 (85.11%). Overall household (HH) size in the
dsitrict is 6.76, Urban (6.73) and Rural (6.76).
Table 1: Demography and Population Pattern of Zhob
Indicator Number
Total Population 310,544
-Male 168,358 (54.21%)
-Female 142,186 (45.79%)
-Urban 46,248 (14.89%)
-Rural 264,296 (85.11%)
Transgender 0
-Urban 0
-Rural 0
Sex Ratio 118.41
-Urban 123.19
-Rural 117.59
Households 45,962
-Urban 6,868
-Rural 39,094
Household size 6.76
-Urban 6.73
-Rural 6.76 Source: Census PBS, 2017

5
District Zhob’s Poverty Status
Zhob is the third poorest district among eight BRDCE Programme districts in
multidimensional poverty (MP) index ranking (9th in Balochistan province), MPI is based
on 15 indicators of PSLM survey on education, health and standard of living (Planning
Commission, UNDP and OPHI, 2016). According to PPAF and SDPI (2016) Zhob is
ranked fourth poorest district in BRDCEP area, based on 27 indicators of PSLM survey
pertaining to education, health, living conditions, and assets ownership.
Table 2: Poverty Status in Zhob
Planning
Commission,
UNDP, OPHI,
2016
Multidimensional
Poverty (MP)
Index
Incidence of
Poverty (%)
Intensity of
Poverty (%)
Category of
Incidence of
Poverty
2014-15 0.514 82.8 62.1 70% and above
PPAF & SDPI,
2016
MP Population Share MP Headcount Ratio
2012-2013 0.12 72.6
3. DISTRICT ADMINISTRATION
Balochistan Local Government Ordinance (BLGO, 1980) was replaced by BLGO, 2001
with a concept of district’s Government. The district Zhob was administrated by the single
line of administration covering rural and urban parts. The earlier system worked for two
tenures, hence changed into BLGA 2010. Current Local Government Act 2010 is similar
to BLGO (1980) and works in rural urban settings separately. Local Government
Institutions of the district include Municipal Committees which is headed by the Chairman
and relevant ward members, this depends on the number of population living in the area.
District Council Chief Officer Assists Chairman and members in Government set up; in
the district Government, women, workers, and minorities are represented. Administrative
set up of Local Government Administration is further explained in organogram given
below:

6
Figure 1: Local Government Administration Organogram (Administrative Setup)
Union Council
Source: P&D, GoB, 2011
TEHSILS AND UNION COUNCILS
There are two Tehsils and 24 Union Councils (UCs) in Zhob district. Below given table and map
show tehsil wise listing and geographical location of UCs.
Tehsil Union Council
Kakar Khurasan Shaghalu, Qamar Din, Ashewat, Appozai, Babar, Babu Muhallah,
Badanzai, Barak Wala, Gunj
Zhob Muhallah, Hassanzai, Islamyar Zhob, Laka Band, Meena Bazar, Mir Ali
Khel, Murgha Kibzai, Narezai, Nasirabad, Omza Viala, Sambazah,
Shahbzai, Sheikhan, Sherani Bazar, Tang Sar, Wala Akram
Chairman
Local Government
Asst: Director Local Govt.
Assistant Engineer
Sub Engineer
Superintendent
Assistant
Junoir Clerk
Senior Clerk
District Council Chief Officer
Assistant
Junior Clerk
Senior Clerk
Chairman
Secretary
Allied Staff

7
Source: UNOCHA, 2017
Table 3: Federal and Provincial Government Departments in Zhob District
Table 4: NGOs working in Zhob
Education Department Irrigation Department
Health Department Population Welfare Department
Public Health Engineering Department Local Government and Rural Development
Department
Social Welfare Department National Database Registration Authority
Livestock Department Building and Reconstruction Department
Agriculture Department Election Commission of Pakistan
Balochistan Rural Support Programme
UNICEF
INCH
World Health Organisation
PPHI
National Commission of Human Development
HDP

8
4. AGRICULTURE AND HORTICULTURE
District Zhob falls in cold zone, with total 58,355 hectares cultivated area, the potential
major crops are wheat, rapeseed /mustard, barley, vegetables, fodder, sorghum, maize,
mung & mash bean, melons, and chilies. The potential fruits in the districts are apples,
grapes almond and apricots.
Details of agriculture land, land ownership, and irrigation given in tables below:
Table-5 shows land utilization statistics. Table-6 shows area irrigated by different sources of
irrigation. Table-8 shows number of household own land in rural areas. Table-9 shows number of
government & private tube-wells in the district.
Table 7: Land utilization statistics of Zhob 2014-15 (hectares)
Reported
area
Cultivated area Cropped area Un-cultivated area
Total Current
fallow
Net
sown
Total Area sown
more than
once
Total Cultivable
waste
Forest
area
Area not
available for
cultivation
227,341 58,355 42,588 15,767 15,778 11 168,986 73,991 7,383 87,612
Source: GoB, 2014-15
Table 8: Area Irrigated by different Sources of Irrigation 2014-15
Irrigated area Canal Tube-well Well Karezes,
springs &
others Govt. Private
18164 4000 13000 900 144 120
Source: GoB, 2014-15
Table 9: Member of Household Own Land in Rural Areas
Ownership Percentage
Owner 49
Landless 51
Total 100 Source: MICS, 2010

9
Figure 2: Number of Tube-wells 2014-15
Source: GoB, 2014-15
Table 10: Number of Government & Private Tube-wells 2013-14
Government Private Total
Electric Diesel Solar Total Electric Diesel Solar Total Electric Diesel Solar Total
0 0 0 0 410 40 0 450 410 40 0 450
Source: GoB, 2014-15
5. GENDER AND WOMEN EMPOWERMENT
Figure-4 shows stage wise enrolment in district Zhob. Figure-5 shows gender wise persons
collecting water.
Figure 3: Stage wise Enrolment 2015-16
Source: EMIS, GoB, 2017
410
40
0
Electric Diesel Solar
8.05
1.460.83
12.47
2.411.27
0
2
4
6
8
10
12
14
Primary Middle High
Tho
usa
nds
Boy Girl

10
Figure 4: Person Collecting Water in Zhob (%)
Source: MICS, 2010
6. HEALTH AND WASH
Figure-6 shows the percentage of children immunized aged 12-23 months in rural areas of Zhob
district. Table-10 shows status of health facilities. Figure-7 shows the number of BHUs, MCHs and
TB clinics. Table-11 shows the number of health practitioners. Table-12 shows water and sanitation
indicators. Figure-8 shows drinking water sources. Table-13 shows distribution of rural household
by source of drinking water. Table-14 shows distribution of rural households by type of toilet.
Figure 5: Rural Children Immunized aged 12-23 months (%)
Source: PSLM, Pakistan Bureau of Statistics, 2014-15
Table 11: Health Facilities 2014-15
Public Private
Hospital 1 1
Dispensaries 16 0
RHC 4 0
Adult
woman37%
Adult man
40%
Female
child15%
Male child
8%
63
49
23
Male Total Female

11
Source: GoB, 2014-15
Figure 6: Health Facilities 2014-15
Source: GoB, 2014-15
Table 12: Number of Health Practitioners 2014-15
Practitioners Number
Doctors (total) 49
-Male 42
-Female 7
Nurses (total) 11
-Male 2
-Female 9
Pharmacist 14
Drug Inspector 2
Health Education Officer 1
LHV 36
Dias/Mid Wives 55
Malaria cases (2013-14) 8329 Source: GoB, 2014-15
Table 13: Water and Sanitation Indicators (%)
Indicator 2004 2010
Use of improved water sources 40 70
Access to safe means of excreta disposal 13 62
Source: MICS, 2004 & 2010
23
2 1
BHU MCH TB Clinic

12
Figure 7: Drinking Water Sources in District
Source: MICS, 2010
Table 14: Distribution of Rural Household by Source of Drinking Water (%)
Tap Water 8 Hand Pump 0 Motor Pump 4 Dug Well 20 Others 67 Total 100
Source: PSLM, Pakistan Bureau of Statistics, 2014-15
Table 15: Distribution of Rural Households by Type of Toilet (%)
Flush 35
Non flush 29
No Toilet 36 Source: PSLM, Pakistan Bureau of Statistics, 2014-15
7. EDUCATION
According to recent data from GoB and EMIS sources below given figure-9 shows gender wise
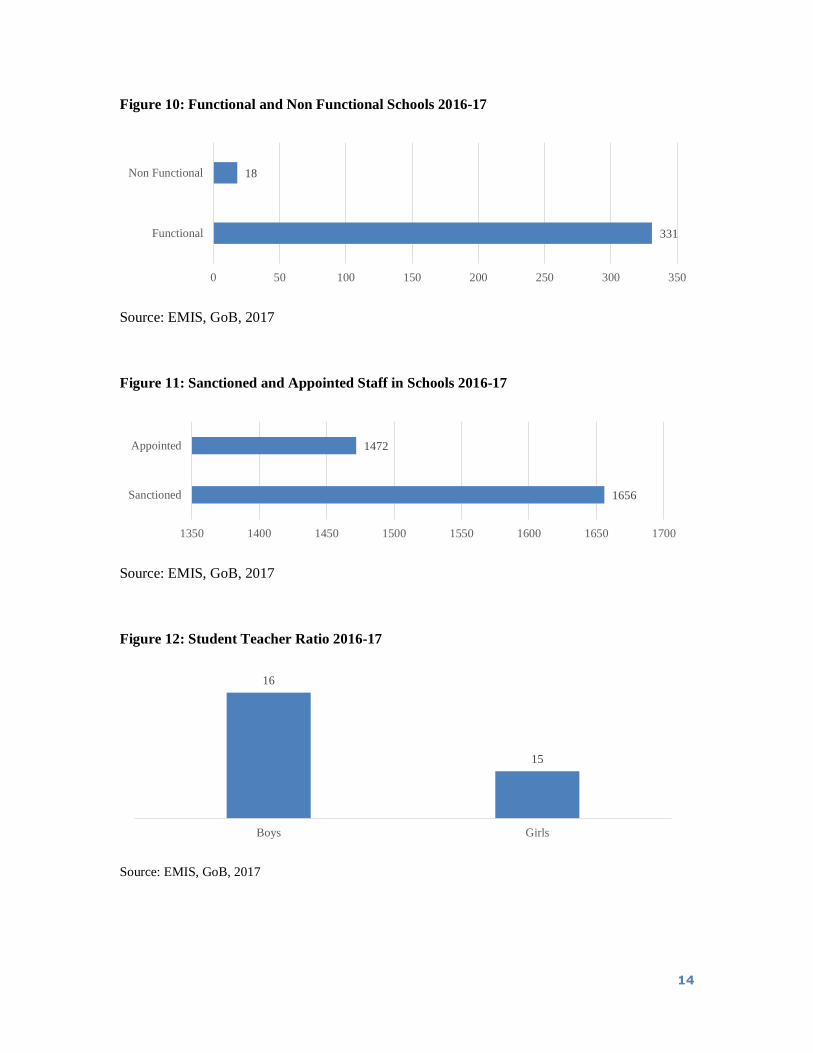
number of schools in district Zhob. Figure-10 shows the total number of schools by level. Figure-
11 shows the number of functional and nonfunctional schools. Figure-12 shows the number of
sanctioned and appointed staff in Schools. Figure-13 shows student teacher ratio. Figure-14 shows
Piped water
22%
Tube well, Borehole
9%
Protected well
32%
Unprotected spring
15%
Others
4%
Unprotected well
5%
Protectd spring
4%
Surface water
6%
Public tap/standpipe
3%

13
available facilities in schools. Figure-15 shows rural gross enrolment ratio at primary level (age 5-
9). Figure-16 shows rural education indicators.
Figure 8: Number of Schools 2016-17
Source: EMIS, GoB, 2017
Figure 9: Total School by Level 2016-17
Source: EMIS, GoB, 2011
Boys
78%
Girls
19%
Co-education
3%
291
3323
2
Primary Middle High HS
14
Figure 10: Functional and Non Functional Schools 2016-17
Source: EMIS, GoB, 2017
Figure 11: Sanctioned and Appointed Staff in Schools 2016-17
Source: EMIS, GoB, 2017
Figure 12: Student Teacher Ratio 2016-17
Source: EMIS, GoB, 2017
331
18
0 50 100 150 200 250 300 350
Functional
Non Functional
1656
1472
1350 1400 1450 1500 1550 1600 1650 1700
Sanctioned
Appointed
16
15
Boys Girls

15
Figure 13: Available Facilities in Schools 2016-17
Source: EMIS, GoB, 2017
Figure 14: Rural Gross Enrolment Ratio at Primary Level (age 5-9)
Source: PSLM, Pakistan Bureau of Statistics, 2014-15
Table 16: Rural Education Indicators (%)
Indicators Male Female Total
Gross Enrolment Ratio at Primary level
(age 5-9)
63 18 41
Gross Enrolment Ratio at Primary level
(age 4-9)
61 20 41
Net Enrolment Rate at Primary level (age
6-10)
57 21 40
Net Enrolment rate at Primary level (age
5-9)
39 15 28
Net Enrolment Rate at Primary level (age
4-9)
37 14 26
Primary level Enrolment in Government
Schools a percentage of total Enrolment
96 87 94
Primary level Enrolment in Government
Schools a percentage of total Primary
Enrolment
96 87 94
304
144 14297 87 86
63 510
Building PTSMC Boundry wall
Seprate teacher for kachi Electricity Seprate room for kachi
Water tank Water facility in toilet Natural gas
63
41
18
Male Total Female

16
Gross Enrolment Ratio at Middle level
(age 11-13)
36 12 26
Gross Enrolment Ratio at Middle level
(age 10-12)
33 11 23
Net Enrolment rate at Middle level (age
11-13)
17 11 15
Net Enrolment rate at Middle level (age
10-12)
6 5 6
Gross Enrolment Ratio at Matric level (age
14-15)
50 - 30
Gross Enrolment Ratio at Matric level (age
13-14)
46 - 28
Net Enrolment rate at Matric level (age 14-
15 )
18 0 11
Literacy-Population 10 years and older 54 7 32
Adult Literacy-population 15 years and
older
42 3 23
Source: PSLM, Pakistan Bureau of Statistics, 2014-15
8. COMMUNITY INSTITUTIONS of BRSP
Under BRDCEP, around 35,092 rural households in Zhob district will be mobilised and capacitated
through three-tiered federated community organisations. Community members in the 24 rural union
councils of the entire district Zhob, particularly women and marginalized, will be capacitated and
assisted so that they can mobilise and form active operational and mature organisations, from COs
to VOs, then LSOs and LSOs’ networks. Following given figure shows number of COs, VOs and
LSOs formed in the district till Jun 2017.

17
BIBLIOGRAPHY
1. EMIS. (2017). Education Management Information System, Education Department,
Government of Balochistan.
2. MICS. (2010). Multiple Indicator Cluster Survey (MICS). Planning and Development
Department, Government of Balochistan.
3. PBS. (2017). Census - 2017, Pakistan Bureau of Statistics, Government of Pakistan,
Islamabad.
4. PSLM. (2014-15). Pakistan Social and Living Standards Measurement Survey
(PSLM) 2014-15. Statistics Division, Government of Pakistan, Statistics Division,
Pakistan Bureau of Statistics, Islamabad.
5. P&D. (2011). District Development Profile, Planning and Development Department
(P&D), Government of Balochistan and United Nations Children’s Fund (UNICEF).
6. P&D. (2014-15). Development Statistics of Balochistan, Bureau of Statistics,
Planning and Development Department (P&D), Government of Balochistan, Quetta.
7. UNOCHA. (2017). MapAction, United Nations Office for the Coordination of
Humanitarian Affairs (UNOCHA), MapAction Version 2, downloaded from QGIS.