zeitschrift kunststofftechnik journal of plastics technology
TRANSCRIPT
4Autor Titel (gegebenenfalls gekürzt)
© Carl Hanser Verlag Zeitschrift Kunststofftechnik / Journal of Plastics Technology 12 (2016) 6
.
12 (2016) 6
eingereicht/handed in: 30.06.2016 angenommen/accepted: 27.09.2016
Dr.-Ing. Gregor Karrenberg; Antje Birkholz, M.Sc.; Prof. Dr.-Ing. Johannes Wortberg Institute of Product Engineering (IPE), University of Duisburg-Essen
Modeling of consistent rheological and thermodynamic material data for process simulations
Any process simulation in polymer engineering is based on conservation equations, which refer to comprehensive knowledge about material properties. These empirically examined properties, such as viscosity, specific enthalpy (specific heat capacity), density, and thermal conductivity are represented in the simulation via mathematical material models. However, the way of gathering rheological and thermodynamic material data influences the accuracy of the material model and thus the simulation output. Hence, the importance of an accurate material model is obvious. With respect to this the influence of measuring methods on the material model and a procedure to model consistent material data at process-relevant heating/cooling rates is described.
Modellierung konsistenter rheologischer und thermodynamischer Materialdaten für die Prozesssimulation
Jeder Prozesssimulation im Polymer Engineering liegen die Erhaltungsgleichungen, welche sich auf umfassendes Wissen über die Materialeigenschaften beziehen, zu Grunde. Diese empirisch ermittelten Eigenschaften wie Viskosität, spezifische Enthalpie (spezifische Wärmekapazität), Dichte und Wärmeleitfähigkeit werden in den Simulationen mit mathematischen Materialmodellen wieder-gegeben. Dabei beeinflusst die Art und Weise der Messung rheologischer und thermodynamischer Materialdaten die Genauigkeit des Materialmodells und folglich auch das Simulationsergebnis. Die Bedeutsamkeit eines genauen Materialmodells ist somit offensichtlich. Vor diesem Hintergrund werden Einflussgrößen der Messmethoden auf das Materialmodell und ein Vorgehen zur Modellierung konsistenter Materialdaten bei prozessrelevanten Heiz-/Kühlraten vorgestellt.
archivierte, peer-rezensierte Internetzeitschrift archival, peer-reviewed online Journal of the Scientific Alliance of Plastics Technology
Zeitschrift Kunststofftechnik
Journal of Plastics Technology
www.kunststofftech.com · www.plasticseng.com
© 2
016
Car
l Han
ser
Ver
lag,
Mün
chen
w
ww
.kun
stst
offte
ch.c
om
Nic
ht z
ur V
erw
endu
ng in
Intr
anet
- un
d In
tern
et-A
ngeb
oten
sow
ie e
lekt
roni
sche
n V
erte
ilern
.
Karrenberg, Birkholz, Wortberg Modeling of material data
Journal of Plastics Technology 12 (2016) 6 517
Modeling of consistent rheological and thermodynamic material data for process simulations
G. Karrenberg, A. Birkholz, J. Wortberg
1 INTRODUCTION
Computer simulations are already state-of-the-art for analyzing and optimizing flow processes. Computational fluid dynamics (CFD) allows for detailed insight into fluid machinery and flow channels, even if they can no longer be described by analytical methods or real experiments. Thereby, comprehensive knowledge about the running process is delivered and enables to recognize and rectify problems. Additionally, improvements and adaptations can be made before any part is produced. Hence, CFD significantly contributes to fast and cost-effective planning and the design of tools and machines.
Furthermore, CFD-simulations are widely used in polymer processing. Especially the process of injection molding is an important representative of this field. Even the melting of polymeric materials in an extruder is increasingly focused on by researchers, but not yet state-of-the-art.
For the simulation of all these processes, the flows are usually described by coupled, nonlinear, partial differential equations, the so called equations of
balance. Below, the five conservation equations of mass (1), momentum (in x-,
y - and z -direction) (2) and energy (3) are depicted. They are given in conservation form, i. e. for stationary control volumes in Cartesian coordinates.
∂
∂t(ρ)+∇⋅(ρv)=0 (1)
∂
∂t(ρv)+∇⋅(ρv⨂v)=-∇p+∇⋅(τ)+ρf (2)
∂
∂t[ρ(h-
p
ρ+
v2
2+zg)]+∇⋅ [ρ(h+
v2
2+zg) v]=ρq
S+∇⋅(λ∇T)+∇⋅(τ⋅v)+ρf⋅v (3)
The simulation of polymer melt flows under creeping flow conditions (Re≪1) bases on the reduced equations of balance.
© 2
016
Car
l Han
ser
Ver
lag,
Mün
chen
w
ww
.kun
stst
offte
ch.c
om
Nic
ht z
ur V
erw
endu
ng in
Intr
anet
- un
d In
tern
et-A
ngeb
oten
sow
ie e
lekt
roni
sche
n V
erte
ilern
.
Karrenberg, Birkholz, Wortberg Modeling of material data
Journal of Plastics Technology 12 (2016) 6 518
Since the conservation equations can so far be solved analytically only for some exceptional cases, they must normally be calculated numerically [1]. Therefore, the fluid volume to be analyzed is divided into a discrete number of finite control volumes (discretization) and the conservation equations are formulated for each of these elements. The differential equations are approximated by a system of algebraic equations, which is solved iteratively by the CFD-Solver [2]. The numerical calculation delivers an approximate solution at discrete points in room and time for the searched five quantities, which describe a fluid flow. This includes the fluids velocities in the three room directions, which are summarized
in the velocity vector v=[u v w]T , the pressure p and the temperature T . Additional quantities can be derived from these.
With the full equations of balance the movement of any viscous, isotropic fluid can be described (at least theoretically). In this context, full means that the flow can be represented time-dependent and that it considers any detail such as the formation of vortexes and turbulences. In practice, the calculations normally do not refer to the full equations of balance, since the high degree of complexity requires an extremely high level of computing power and leads to inacceptable long computing times. Furthermore, the full equations of balance are not required for many technical applications. Thus, depending on the particular application and in regard to the fluid, simplified assumptions, idealizations and boundary conditions are made. Thereby, the conservation equations can be shortened and simplified, which in consequence decreases the accuracy of the obtainable results [1–4].
The characteristics of any flowing medium like viscous polymer melts are integrated into the equations of balance solely by the coupling with material-describing equations [3, 4]. Obviously, the material model itself and its quality are particularly important since any simulation result is influenced by these material data. Normally, these data are detected by current measuring methods under customary standard conditions and are usually valid for narrow temperature ranges only. However, a decisive adjustment of the measurement conditions to the process to be simulated is imperative because depending on the considered process, plastics show significant differences in their processing behavior. Therefore, we propose a procedure to gain consistent material data in regard to the polymer process. For this purpose, the measuring methods and their influences on the generated rheological and thermodynamic material data are described in general. Accordingly, the developed and implemented approach for gaining a consistent material model for semi-crystalline thermoplastic melts is shown. It is conceivable that the discussed aspects apply analogously for amorphous thermoplastics; but this type of thermoplastics are not focused in this paper. Further considerations and suggestions to improve the presented approach are also given.
© 2
016
Car
l Han
ser
Ver
lag,
Mün
chen
w
ww
.kun
stst
offte
ch.c
om
Nic
ht z
ur V
erw
endu
ng in
Intr
anet
- un
d In
tern
et-A
ngeb
oten
sow
ie e
lekt
roni
sche
n V
erte
ilern
.
Karrenberg, Birkholz, Wortberg Modeling of material data
Journal of Plastics Technology 12 (2016) 6 519
2 DETERMINATION OF PROCESS-ORIENTED MATERIAL DATA
The conservation equations are the basis of each numerical flow calculation. They allow to calculate the desired velocity, pressure and temperature fields and to derive further information. Certain material properties which describe the rheological and thermodynamic material behavior must be specified so that the system of equations to be solved is well defined [1]. The material properties
required are the viscosity η (needed for the calculation of the stress tensors τ), the density ρ, the thermal conductivity λ, as well as the specific enthalpy h, which is actually not a material property but a state variable. However, since it is
directly linked to the specific heat capacity cP, it can be treated as a material property.
The material properties are usually not constant and depend on the target
variables pressure p, temperature T as well as the flow velocities v respectively the calculable shear rate γ deriving therefrom. These dependencies must be empirically determined and described by mathematical models [3]. For pure fluid flows, a specification of constant material parameters or the description of the material behavior for high temperature ranges often are sufficient. For representation of melting processes, for instance in an extruder, or for the solidification of melt inside an injection mold, this is not satisfactory. Models which represent much larger temperature intervals are required. Normally, for this purpose, measured material data are stored in tabular form and material properties are determined by interpolation. Another method is the formulation of mathematical functions describing the material´s behavior.
Various measuring methods, typically running at very slow heating and cooling rates, as well as mathematical models for the characterization and description of a materials behavior exist. Some popular models, like the Carreau-WLF model for the viscosity formulation, have been established in science and are already implemented in nearly every standard CFD software, so that the user in principle has all necessary tools to work with. However, it can be observed that these models have hardly been expanded for a long time and thus only include the most obvious dependencies and influences, which are temperature and shear rate for viscosity and sometimes temperature and/or pressure for thermodynamic properties. Thus, for further improvements in simulation tech-niques, more dependencies need to be considered. However, the most important aspect is the consideration of process-oriented cooling and heating rates. These rates need to be focused to get realistic material data, which are essential for reliable simulation results. Special attention is given to this topic in this paper.
© 2
016
Car
l Han
ser
Ver
lag,
Mün
chen
w
ww
.kun
stst
offte
ch.c
om
Nic
ht z
ur V
erw
endu
ng in
Intr
anet
- un
d In
tern
et-A
ngeb
oten
sow
ie e
lekt
roni
sche
n V
erte
ilern
.
Karrenberg, Birkholz, Wortberg Modeling of material data
Journal of Plastics Technology 12 (2016) 6 520
2.1 Effects of Cooling and Heating Rates
The physical properties of plastics mainly depend on the binding forces acting between the molecules. These correlate with the distance of the polymer chains to each other, which is based on the so-called Brownian molecular motion because not only atoms and low molecular weight molecules oscillate more and more with increasing energy, but also macromolecules. Therefore, the temperature is merely a measurement of the molecular motion, but not for the distance between them. At low temperatures, the molecular motion is inhibited and the position of the macromolecules to each other is frozen. With an increase in temperature, however, the molecules increasingly start to oscillate and it comes to a disentanglement of the molecular chains. With sufficient mobility, the molecules can also move apart from each other to leave the effective range of the secondary valence forces of their neighboring molecules. The material passes into the molten state [5, 6].
A phase change is a process that is dependent on the movement of mass and thus time-dependent. Therefore, the distinction between solid and melt cannot be exclusively based on the prevailing material temperature. The direction (cooling or heating) and the dynamic processes influence the phase change significantly.
For this reason, the crystallinity of a polymeric solid body can be influenced by use of the cooling rate at which the melt is cooled down in the dimensionally stable state. By rapid cooling, the period within which the Brownian motion of molecules is sufficiently pronounced to form crystalline structures, is shortened. The molecular motion is suppressed, even before the crystal structures have completely formed. This forms a lower number of less stable crystals. Here, the molecular motion does not follow the rapid cooling and the material solidifies in thermodynamic disequilibrium at a reduced solidification temperature. The result is a metastable structure [7, 8, 9].
This situation is addressed in connection with the cooling of a melt in almost any basic literature. The influence of high heating rates on the melting process has remained completely unnoticed for a long time, although melting as a reversal of solidification also is a dynamic, time-dependent process and various analogies to cooling exist. Thus, Rahal describes in [10] that at high heating rates, a time-delayed melting of plastics takes place. The temperature range in which the plasticizing expires, is larger and shifts to higher temperatures. Comparable to the fast cooling, the exchange processes of the molecules are not fast enough to follow the rapid temperature changes. Although the material has reached its melting temperature, it has not yet completely melted. The effects of high heating rates also inevitably lead to completely new properties of the plastics to be processed and ultimately to entirely different dynamic, time-dependent heating and melting processes.
It is easy to understand that a consideration of process oriented cooling and heating rates is imperative to use for the material description in CFD simulations. Although the effects described above are well known, they are
© 2
016
Car
l Han
ser
Ver
lag,
Mün
chen
w
ww
.kun
stst
offte
ch.c
om
Nic
ht z
ur V
erw
endu
ng in
Intr
anet
- un
d In
tern
et-A
ngeb
oten
sow
ie e
lekt
roni
sche
n V
erte
ilern
.
Karrenberg, Birkholz, Wortberg Modeling of material data
Journal of Plastics Technology 12 (2016) 6 521
usually neglected when determining the material properties or they can just not be considered with today´s measuring techniques. This applies in particular for the thermodynamic properties. Hereby, glaring errors already caused prior to the actual simulation calculations occur. Subsequently, an approach is presented, which enables to determine all material properties with the usual, well-established methods of measurement and to convert the results to process-oriented heating/cooling rates.
2.2 Characterization of Phase Change Processes
The thermodynamic material data play an important role in simulating any polymer process. Thereby, phase change processes can be described. Especially, the specific enthalpy h has to be focused on. The specific enthalpy describes the heat content at a defined temperature. This property cannot be measured absolutely, but has to be referred to a reference which is normally set to room temperature [6]. The measurement of the specific enthalpy can be done via differential scanning calorimetry (DSC). Depending on the heating as well as on the cooling rate, it can be differentiated between standard and ultra-fast scanning DSC-instruments (F-DSC). Both operate with a specific amount of the material in a crucible or at a measuring area at a chip (complete, miniaturized DSC [9]) and a reference (an empty crucible or chip). For each measurement, the crucibles are exposed to a controlled temperature program. Because of the heat capacity of the material sample, a continuous temperature difference between the crucibles respectively chips can be detected with area thermocouples. The heat flow results as a device specific answer. The temperature difference is transferred into the change in enthalpy by integration of the heat flow as a function of time (displayed in dependence of temperature) respectively balanced with an additional heater. The heating power is set equally to the change in enthalpy [11]. If the rise or decrease in temperature causes a phase transformation or structural change, typical deflection of the measurement is visible. Melting processes call for latent heat supply (i. e. heat supply without detecting a rise in temperature = endothermic peak Tpm [12])
whereas crystallization processes require a dissipation of heat (fall in temperature without heat supply = exothermic peak Tpc [12]). After finishing the
phase change process, the temperature will increase again for melting processes and the measured temperature decrease once more correlates with the set temperature program for crystallization processes respectively. For a correct calculation of any polymer process where melting or crystallization processes take place, the knowledge of the progression of the enthalpy from room to the maximal arising melt temperature is essential. Since it is known that the specific enthalpy is dependent on the measurement rate [11], process-oriented heating and respectively cooling rates should be used. The combination of DSC and F-DSC enables this or, to be more precise, the extrapolation to the relevant rates. As a result, the measurements permit the knowledge about dynamic melting or cooling processes.
© 2
016
Car
l Han
ser
Ver
lag,
Mün
chen
w
ww
.kun
stst
offte
ch.c
om
Nic
ht z
ur V
erw
endu
ng in
Intr
anet
- un
d In
tern
et-A
ngeb
oten
sow
ie e
lekt
roni
sche
n V
erte
ilern
.
Karrenberg, Birkholz, Wortberg Modeling of material data
Journal of Plastics Technology 12 (2016) 6 522
During a DSC measurement, the heating, respectively cooling rates are
normally set to 10 K min⁄ [12]. The measurement sample is heated/cooled so slowly that it is always in a thermodynamic equilibrium. In the F-DSC this rates
can be increased up to 40,000 K s⁄ [9, 13] and represent realistic temperature change rates as well as the dynamic behavior of the material. To realize measurements at these relevant rates, the material sample has to be minimized from a few miligram to nanogram.
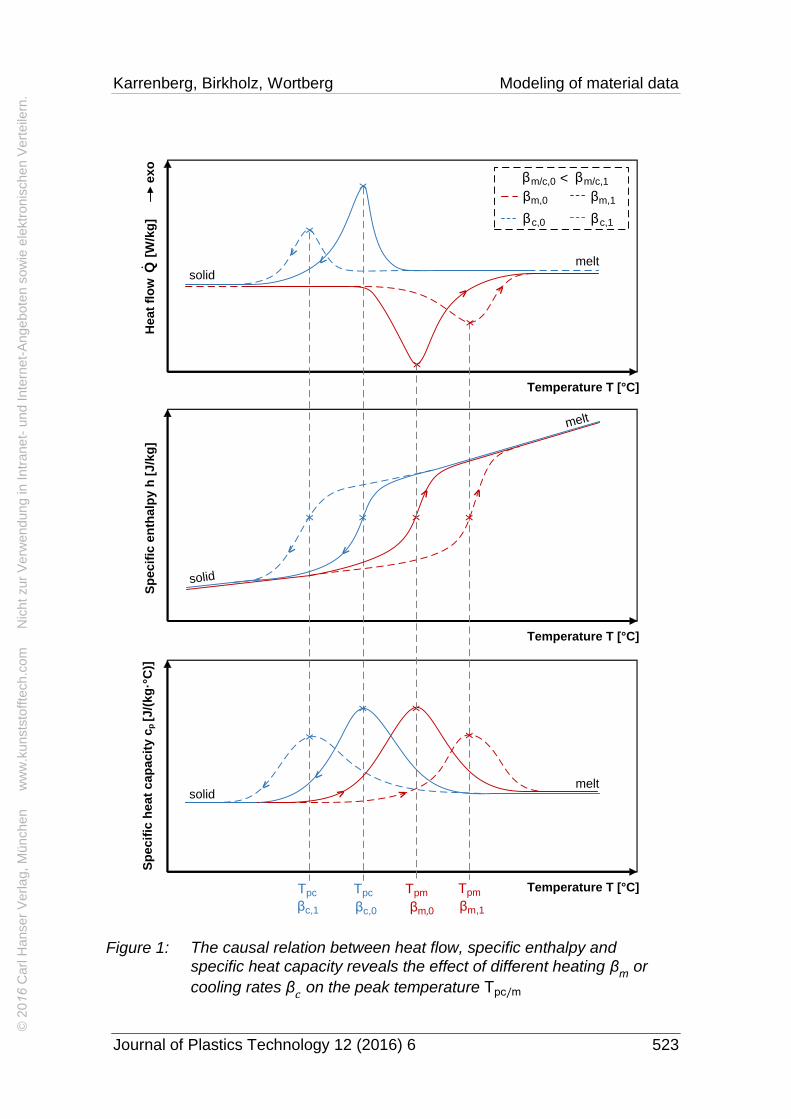
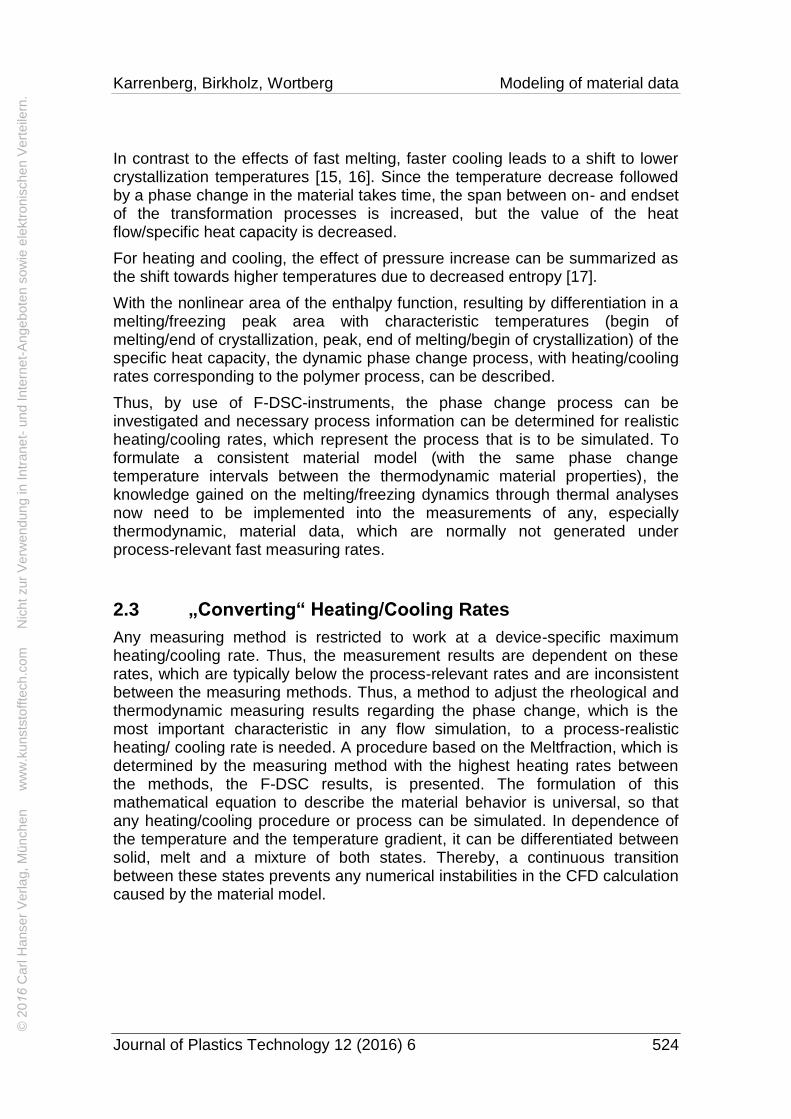
The schematic drawing in Figure 1, representing measurement results above the glass transition temperature, indicates the typical characteristics of an enthalpy measurement result displayed over time for semi-crystalline thermoplastics. It reveals a linear positive slope for pure solid (from solid to the beginning of the phase change and additionally for pure melt (from the end of the phase change to the end of the considered temperature range). Only in the temperature interval of the phase change process itself, where the semi-crystalline structure is dissolved/formed, a nonlinear connection can be detected. Since, in simulation programs, the specific heat capacity is used instead of the specific enthalpy, this material property is also included in the drawing. It can be stated that the specific heat capacity can be gained easily by the differentiation of the specific enthalpy as a function of temperature. The arising peak represents the temperature where most of the semi-crystallines are formed/dissolved. To illustrate the influence of heating/cooling rates on the temperature interval of the phase change process, as well as on the rate of the melting and crystallization processes, the resultant peaks implicate two different heating respectively cooling rates. The influence of the rates is obvious, since a phase change is a process which is dependent on the movement of matter and therefore needs time. The increase/decrease of energy caused by the heating/cooling process influences the movement of molecules and the physical attraction forces. These forces define whether an ordered, semi-crystalline structure is dissolved or formed. Hence, a shift of the measured melting peak can be detected. This is caused by the thermal history, which causes a frozen metastable (potential of crystallization is mostly not fully developed because of the fast cooling), morphological structure. Reorientation and/or cold- respectively post-crystallization before melting [8, 9, 14] can be detected. The more this takes place (small heating rates), the more energy is needed to melt the crystals, thus shifting the peak temperature to higher temperatures. With increasing the heating rates, these effects are suppressed. As a result, there are less crystalline structures to dissolve and the peak temperature may decrease. As the heating rates are increased further, the reorientation is suppressed and the dissolution of the crystalline structures cannot follow the temperature increase. Since this is not a thermodynamic stable equilibrium, the material melting is delayed and the melting starts at higher temperatures.
© 2
016
Car
l Han
ser
Ver
lag,
Mün
chen
w
ww
.kun
stst
offte
ch.c
om
Nic
ht z
ur V
erw
endu
ng in
Intr
anet
- un
d In
tern
et-A
ngeb
oten
sow
ie e
lekt
roni
sche
n V
erte
ilern
.
Karrenberg, Birkholz, Wortberg Modeling of material data
Journal of Plastics Technology 12 (2016) 6 523
βc,1 βc,0 βm,1 βm,0
Temperature T [°C]
Temperature T [°C]
Temperature T [°C]
x
x
x
x
x
x x
x
Tpc Tpc Tpm Tpm
<
> >
<
<
<
> >
Q
exo
x x x x
> >
< <
Sp
ecif
ic e
nth
alp
y h
[J/k
g]
Sp
ecif
ic h
eat
cap
ac
ity c
p [J/(
kg
·°C
)]H
ea
t fl
ow
[W
/kg
]
solid
solid
solid
melt
melt
melt
βc,1
<βm/c,0 βm/c,1
βm,0 βm,1
βc,0
Figure 1: The causal relation between heat flow, specific enthalpy and
specific heat capacity reveals the effect of different heating βm
or
cooling rates β𝑐 on the peak temperature Tpc/m
© 2
016
Car
l Han
ser
Ver
lag,
Mün
chen
w
ww
.kun
stst
offte
ch.c
om
Nic
ht z
ur V
erw
endu
ng in
Intr
anet
- un
d In
tern
et-A
ngeb
oten
sow
ie e
lekt
roni
sche
n V
erte
ilern
.
Karrenberg, Birkholz, Wortberg Modeling of material data
Journal of Plastics Technology 12 (2016) 6 524
In contrast to the effects of fast melting, faster cooling leads to a shift to lower crystallization temperatures [15, 16]. Since the temperature decrease followed by a phase change in the material takes time, the span between on- and endset of the transformation processes is increased, but the value of the heat flow/specific heat capacity is decreased.
For heating and cooling, the effect of pressure increase can be summarized as the shift towards higher temperatures due to decreased entropy [17].
With the nonlinear area of the enthalpy function, resulting by differentiation in a melting/freezing peak area with characteristic temperatures (begin of melting/end of crystallization, peak, end of melting/begin of crystallization) of the specific heat capacity, the dynamic phase change process, with heating/cooling rates corresponding to the polymer process, can be described.
Thus, by use of F-DSC-instruments, the phase change process can be investigated and necessary process information can be determined for realistic heating/cooling rates, which represent the process that is to be simulated. To formulate a consistent material model (with the same phase change temperature intervals between the thermodynamic material properties), the knowledge gained on the melting/freezing dynamics through thermal analyses now need to be implemented into the measurements of any, especially thermodynamic, material data, which are normally not generated under process-relevant fast measuring rates.
2.3 „Converting“ Heating/Cooling Rates
Any measuring method is restricted to work at a device-specific maximum heating/cooling rate. Thus, the measurement results are dependent on these rates, which are typically below the process-relevant rates and are inconsistent between the measuring methods. Thus, a method to adjust the rheological and thermodynamic measuring results regarding the phase change, which is the most important characteristic in any flow simulation, to a process-realistic heating/ cooling rate is needed. A procedure based on the Meltfraction, which is determined by the measuring method with the highest heating rates between the methods, the F-DSC results, is presented. The formulation of this mathematical equation to describe the material behavior is universal, so that any heating/cooling procedure or process can be simulated. In dependence of the temperature and the temperature gradient, it can be differentiated between solid, melt and a mixture of both states. Thereby, a continuous transition between these states prevents any numerical instabilities in the CFD calculation caused by the material model.
© 2
016
Car
l Han
ser
Ver
lag,
Mün
chen
w
ww
.kun
stst
offte
ch.c
om
Nic
ht z
ur V
erw
endu
ng in
Intr
anet
- un
d In
tern
et-A
ngeb
oten
sow
ie e
lekt
roni
sche
n V
erte
ilern
.
Karrenberg, Birkholz, Wortberg Modeling of material data
Journal of Plastics Technology 12 (2016) 6 525
2.3.1 Meltfraction
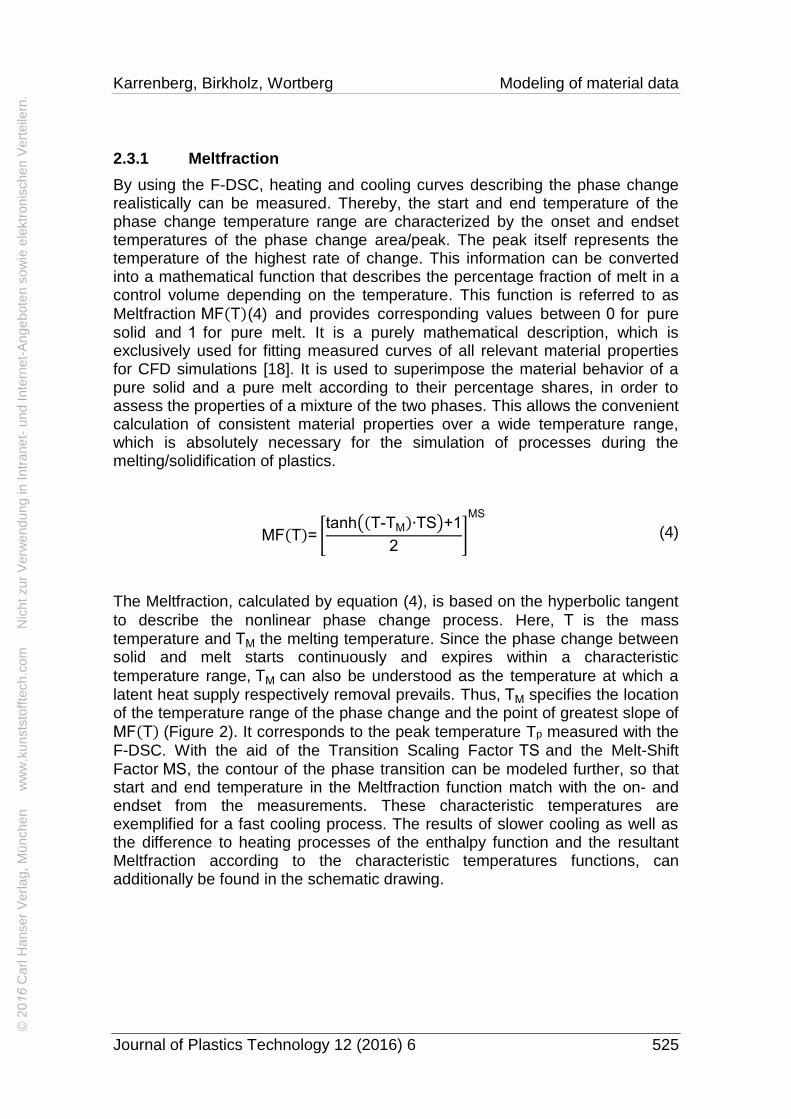
By using the F-DSC, heating and cooling curves describing the phase change realistically can be measured. Thereby, the start and end temperature of the phase change temperature range are characterized by the onset and endset temperatures of the phase change area/peak. The peak itself represents the temperature of the highest rate of change. This information can be converted into a mathematical function that describes the percentage fraction of melt in a control volume depending on the temperature. This function is referred to as
Meltfraction MF(T)(4) and provides corresponding values between 0 for pure solid and 1 for pure melt. It is a purely mathematical description, which is exclusively used for fitting measured curves of all relevant material properties for CFD simulations [18]. It is used to superimpose the material behavior of a pure solid and a pure melt according to their percentage shares, in order to assess the properties of a mixture of the two phases. This allows the convenient calculation of consistent material properties over a wide temperature range, which is absolutely necessary for the simulation of processes during the melting/solidification of plastics.
The Meltfraction, calculated by equation (4), is based on the hyperbolic tangent
to describe the nonlinear phase change process. Here, T is the mass temperature and TM the melting temperature. Since the phase change between solid and melt starts continuously and expires within a characteristic
temperature range, TM can also be understood as the temperature at which a latent heat supply respectively removal prevails. Thus, TM specifies the location of the temperature range of the phase change and the point of greatest slope of
MF(T) (Figure 2). It corresponds to the peak temperature Tp measured with the F-DSC. With the aid of the Transition Scaling Factor TS and the Melt-Shift Factor MS, the contour of the phase transition can be modeled further, so that start and end temperature in the Meltfraction function match with the on- and endset from the measurements. These characteristic temperatures are exemplified for a fast cooling process. The results of slower cooling as well as the difference to heating processes of the enthalpy function and the resultant Meltfraction according to the characteristic temperatures functions, can additionally be found in the schematic drawing.
MF(T)= [tanh((T-TM)∙TS)+1
2]
MS
(4)
© 2
016
Car
l Han
ser
Ver
lag,
Mün
chen
w
ww
.kun
stst
offte
ch.c
om
Nic
ht z
ur V
erw
endu
ng in
Intr
anet
- un
d In
tern
et-A
ngeb
oten
sow
ie e
lekt
roni
sche
n V
erte
ilern
.
Karrenberg, Birkholz, Wortberg Modeling of material data
Journal of Plastics Technology 12 (2016) 6 526
0.0
0.2
0.4
0.6
0.8
1.0
0 25 50 75 100 125 150 175 200 225 250
Melt
fracti
on
MF
[-]
Temperature T [ C]
Temperature T [°C]
x
> >
< <
Sp
ecif
ic e
nth
alp
y h
[J/k
g]
solid
melt
>
>
<
<
Melt
frac
tio
n M
F [
-]
Temperature T [°C]
Tpc Tfc Tic
βc,1 βc,1 βc,1
βc,1
<βm/c,0 βm/c,1
βm,0 βm,1
βc,0
2.3.2 Consistent Material Model
Since the material behavior of all thermodynamic properties of a pure solid or a pure melt can usually be described by simple mathematical functions, such as linear equations, these properties can be determined by the use of the established measurement methods for conventional heating/cooling rates. As already described in the preceding section, the characteristic temperatures of the phase change process can be determined by the DSC and F-DSC, in dependence of the measuring rate. This results in the formulation of the described Meltfraction function, which is dependent on the temperature and heating/cooling rate. The transition area is then modeled by superposition of solid and melt with the Meltfraction as a weighting function. Since the
Figure 2: Transferring specific enthalpy measurements into Meltfraction functions for varied heating and cooling rates
© 2
016
Car
l Han
ser
Ver
lag,
Mün
chen
w
ww
.kun
stst
offte
ch.c
om
Nic
ht z
ur V
erw
endu
ng in
Intr
anet
- un
d In
tern
et-A
ngeb
oten
sow
ie e
lekt
roni
sche
n V
erte
ilern
.
Karrenberg, Birkholz, Wortberg Modeling of material data
Journal of Plastics Technology 12 (2016) 6 527
Meltfraction function represents a characteristic heating/cooling rate, this information is transmitted to the curve runs of the respective material properties. Thereby, the material behavior is adjusted to the appropriate heating/cooling rate, although the measured values have been determined under standard conditions.
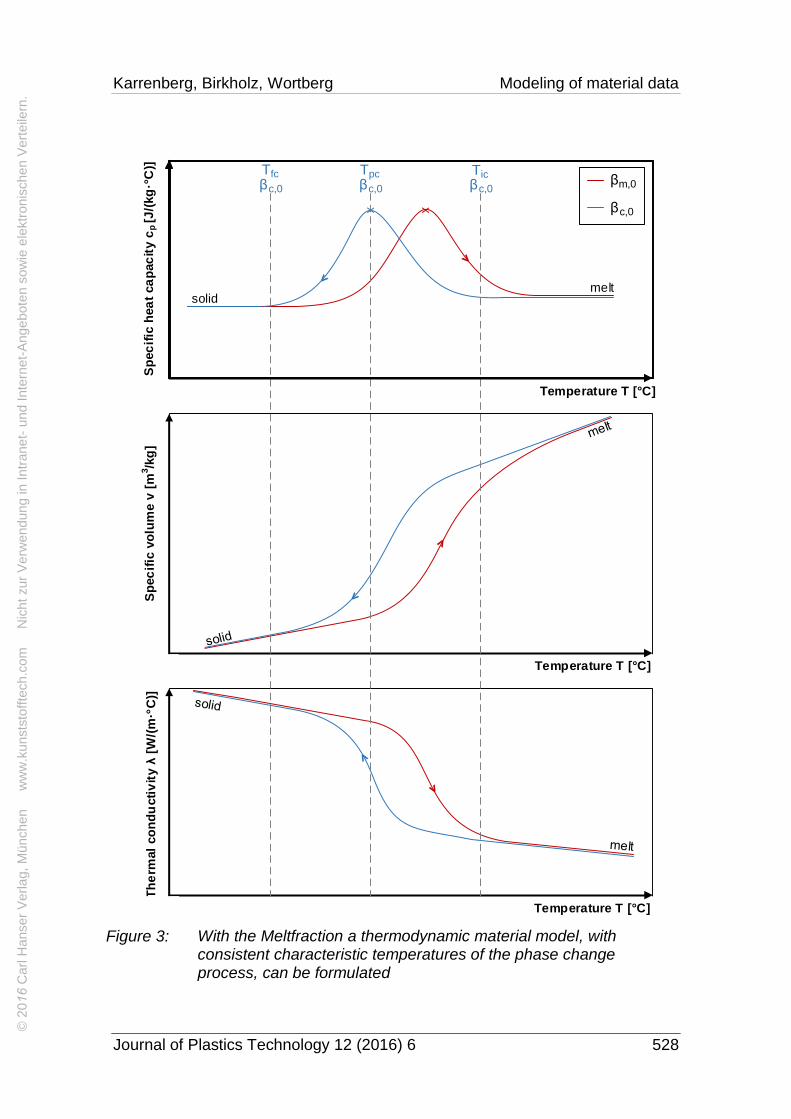
Figure 3 illustrates the relation between the transition interval, which is modelled with the Meltfraction function as a weighting function and thus consistent not only with the enthalpy function on which the Meltfraction is based but also with the specific heat capacity, the specific volume and the thermal conductivity for heating/cooling. The characteristic temperatures (basis to form the Meltfraction function) for a relatively low cooling rate are indicated exemplarily. For higher rates, the relation remains but the transition interval changes according to the course of the Meltfraction function.
In the following sections, the way to gain this consistent material model in dependence of process-relevant rates is described. Therefore, the mathematical description is given in general to avoid repetitions. The results are not presented in general at this point, but specified explicitly for different example measurements in the following sections.
© 2
016
Car
l Han
ser
Ver
lag,
Mün
chen
w
ww
.kun
stst
offte
ch.c
om
Nic
ht z
ur V
erw
endu
ng in
Intr
anet
- un
d In
tern
et-A
ngeb
oten
sow
ie e
lekt
roni
sche
n V
erte
ilern
.
Karrenberg, Birkholz, Wortberg Modeling of material data
Journal of Plastics Technology 12 (2016) 6 528
p
Temperature T [°C]
x x
Tpc
Sp
ec
ific
hea
t ca
pac
ity c
p [J
/(kg
·°C
)]
solidmelt
Tfc Tic
Sp
ecif
ic v
olu
me v
[cm
³/g
]
Temperature T [K]
Sp
ec
ific
vo
lum
e v
[m
3/k
g]
Temperature T [°C]
Th
erm
al co
nd
ucti
vit
y λ
[W/m
K]
Temperature T [K]
Th
erm
al
co
nd
ucti
vit
y λ
[W
/(m
·°C
)]
Temperature T [°C]
βm,0
βc,0
βc,0 βc,0 βc,0
Figure 3: With the Meltfraction a thermodynamic material model, with consistent characteristic temperatures of the phase change process, can be formulated
© 2
016
Car
l Han
ser
Ver
lag,
Mün
chen
w
ww
.kun
stst
offte
ch.c
om
Nic
ht z
ur V
erw
endu
ng in
Intr
anet
- un
d In
tern
et-A
ngeb
oten
sow
ie e
lekt
roni
sche
n V
erte
ilern
.
Karrenberg, Birkholz, Wortberg Modeling of material data
Journal of Plastics Technology 12 (2016) 6 529
3 EXAMPLE-MEASUREMENT
As an example for the appropriate measuring in consideration of the process-relevant heating/cooling rates and the resulting Meltfraction function, the results to constitute a consistent material model dependent on the process rate of a low density polyethylene (PE-LD) and a polypropylene homopolymer (PP) are presented. PE-LD is a typical extrusion material also used in the high-speed extrusion process, where high melting rates occur as a result of elevated screw
speeds of at least 400 min-1
[19]. The PP is measured and the results prepared in respect of the injection molding process, where high cooling rates result, especially at the barrier layer, i.e. between the cold tool wall and the hot melt. The approach is explained in detail by means of the results of the PE-LD. In avoidance of repetitions, the following results of the PP are illustrated in less detail.
3.1 Heating Process: High-Speed-Extrusion
In the extrusion process, the necessary enthalpy increase to melt the polymer is mainly caused by dissipation. This depends highly on the shearing of the material and consequently, a strong relationship between screw speed and heating rate is existent. The mathematical context is as follows: The volume
specific dissipation can be calculated as the product of viscosity η(γ,T) and the square of the shear rate γ. If the density ρ(T) is considered additionally, the mass specific dissipation PDiss.,m(γ,T) can be calculated. If heat losses are
neglected, the mass specific dissipation PDiss.,m(γ,T) corresponds to the
enthalpy increase Δh per time. As a result, the enthalpy increase Δh, which can be found in the enthalpy diagram (DSC measurement), correlates directly with a
temperature increase ∆T. Hence, a relation of mass-specific dissipation and the hereby caused temperature increase per time unit, which is the heating rate β
m,
originates (see equation 5).
PDiss.,m(γ,T)=η(γ,T)∙γ2
ρ(T)≈
∆h(T)
∆t
→
∆T
∆t=β
m (5)
If the left part of this equation is rearranged after Δt, the result inserted in the
expression on the right and the temperature increase ∆T described by the difference between the resulting melt temperature and the initial temperature (ambient temperature if the material is not pre-heated), the heating rate β
m(γ,T)
can be formulated as a function of shear rate γ and temperature T (6).
© 2
016
Car
l Han
ser
Ver
lag,
Mün
chen
w
ww
.kun
stst
offte
ch.c
om
Nic
ht z
ur V
erw
endu
ng in
Intr
anet
- un
d In
tern
et-A
ngeb
oten
sow
ie e
lekt
roni
sche
n V
erte
ilern
.
Karrenberg, Birkholz, Wortberg Modeling of material data
Journal of Plastics Technology 12 (2016) 6 530
βm(γ,T)=
∆T
∆h(T)∙η(γ,T)
ρ(T)∙ γ2
=T-20 °C
∆h(T)∙η(γ,T)
ρ(T)∙ γ2
(6)
The distribution of shear rate and temperature varies within every screw flight because the complex flow and the condition in an extruder are exposed to continuous changes. Thus, the heating rate is also a heterogeneous field. As a result, the heating rate is dependent on the location of contemplation. If the process is vastly simplified, the level of a representative heating rate β
rep.m can
be estimated. For this estimation, the point in time in melting and the strongly sheared thin melt film between solid bed and the contact surface towards the barrel are considered only. The hot melt film is in direct contact to the solid bed. An equilibrium between melt and solid bed results at the contact surface area. Since the outer solid face only is relevant during melting, heat conduction can be neglected, if an ideal contact is assumed. The thickness of this melt film grows until it is equal to the radial screw clearance between screw flights and the barrel. If this screw clearance is exceeded, the melt is caught by the flights and removed out of the observed area. Based on this assumption, the thickness
of the melt film δFilm is set to the amount of the screw clearance. The shear rate can be approximated for any given screw diameter in dependence of the screw speed according to [20] with equation (7).
γFilm(n)=
π∙D∙n
δFilm
(7)
After the insertion of equation (7) into equation (6) the representative heating rate can be calculated in dependence of the screw speed and the evoked melt temperature according to equation (8).
βrep.m
(n,T)=T-20 °C
∆h(T)∙η(γ
Film,T)
ρ(T)∙ (
π∙D∙n
δFilm
)
2
(8)
For an extruder with diameter D=35 mm and a processing temperature of
220 °C respectively a screw speed of 800 min-1
, a representative heating rate of 12,000 K/s results. Under these conditions and process-relevant heating rates, it is obvious that the normally used measuring rates of 0.167 K/s do not reflect the dynamic material behavior.
The PE-LD is analyzed with the F-DSC (Flash DSC 1 (Mettler-Toledo GmbH) at the Institute of Polymeric Materials e. V. (IPW), an affiliated institute of the University of Applied Sciences Merseburg). Therefore, the granules are sliced
with a microtome to 20-30 μm thin samples. These are placed on and
© 2
016
Car
l Han
ser
Ver
lag,
Mün
chen
w
ww
.kun
stst
offte
ch.c
om
Nic
ht z
ur V
erw
endu
ng in
Intr
anet
- un
d In
tern
et-A
ngeb
oten
sow
ie e
lekt
roni
sche
n V
erte
ilern
.
Karrenberg, Birkholz, Wortberg Modeling of material data
Journal of Plastics Technology 12 (2016) 6 531
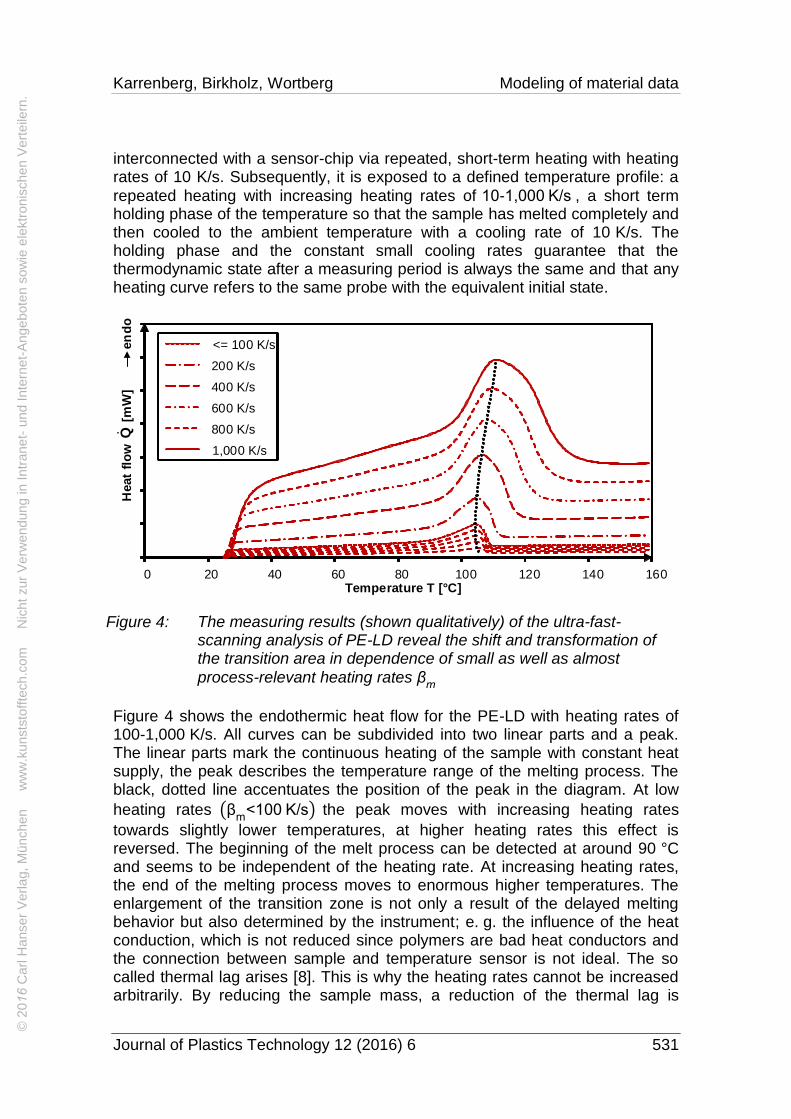
interconnected with a sensor-chip via repeated, short-term heating with heating rates of 10 K/s. Subsequently, it is exposed to a defined temperature profile: a
repeated heating with increasing heating rates of 10-1,000 K/s , a short term holding phase of the temperature so that the sample has melted completely and then cooled to the ambient temperature with a cooling rate of 10 K/s. The holding phase and the constant small cooling rates guarantee that the thermodynamic state after a measuring period is always the same and that any heating curve refers to the same probe with the equivalent initial state.
0 20 40 60 80 100 120 140 160
<= 100 K/s
200 K/s
400 K/s
600 K/s
800 K/s
1,000 K/s
Temperature T [°C]
Heat
flo
w
[mW
]en
do
Q
Figure 4: The measuring results (shown qualitatively) of the ultra-fast-scanning analysis of PE-LD reveal the shift and transformation of the transition area in dependence of small as well as almost
process-relevant heating rates βm
Figure 4 shows the endothermic heat flow for the PE-LD with heating rates of 100-1,000 K/s. All curves can be subdivided into two linear parts and a peak. The linear parts mark the continuous heating of the sample with constant heat supply, the peak describes the temperature range of the melting process. The black, dotted line accentuates the position of the peak in the diagram. At low
heating rates (βm
<100 K/s) the peak moves with increasing heating rates
towards slightly lower temperatures, at higher heating rates this effect is reversed. The beginning of the melt process can be detected at around 90 °C and seems to be independent of the heating rate. At increasing heating rates, the end of the melting process moves to enormous higher temperatures. The enlargement of the transition zone is not only a result of the delayed melting behavior but also determined by the instrument; e. g. the influence of the heat conduction, which is not reduced since polymers are bad heat conductors and the connection between sample and temperature sensor is not ideal. The so called thermal lag arises [8]. This is why the heating rates cannot be increased arbitrarily. By reducing the sample mass, a reduction of the thermal lag is
© 2
016
Car
l Han
ser
Ver
lag,
Mün
chen
w
ww
.kun
stst
offte
ch.c
om
Nic
ht z
ur V
erw
endu
ng in
Intr
anet
- un
d In
tern
et-A
ngeb
oten
sow
ie e
lekt
roni
sche
n V
erte
ilern
.
Karrenberg, Birkholz, Wortberg Modeling of material data
Journal of Plastics Technology 12 (2016) 6 532
practically not possible, because it has already been reduced to a few nanograms. The heating rate range with reliable measuring results account for 1,000 K/s; i. e. is still much smaller than the expected process-relevant heating rate of 12,000 K/s. Thus, there is no alternative than an extrapolation of the measurement results to the relevant rates and to deduce for the relevant operating point, the required shift of the melt temperature interval. According to
[8, 16], this shift of the melt peak Tpm(βm) can be described with a Power-Law-
course with equation (9), if reorganization and recrystallization effects can be excluded.
Tpm(βm)=Tpm
0+A∙√β
m=Tpm
0+√2∙Rth∙Δhf∙m ∙ √β
m (9)
In dependence of the heating rate, there are sufficient measurement results to find a curve fit for the mentioned function. The unknown parameters are
determined by means of Matlab R2013 to Tpm0
=99.26 °C and A=0.3628√°C∙s.
With this information, it is possible to calculate peak temperatures also for heating rates which cannot be measured with the F-DSC. For the reference state it is Tpm(12,000 K/s )≈140 °C. The end temperature of the phase change
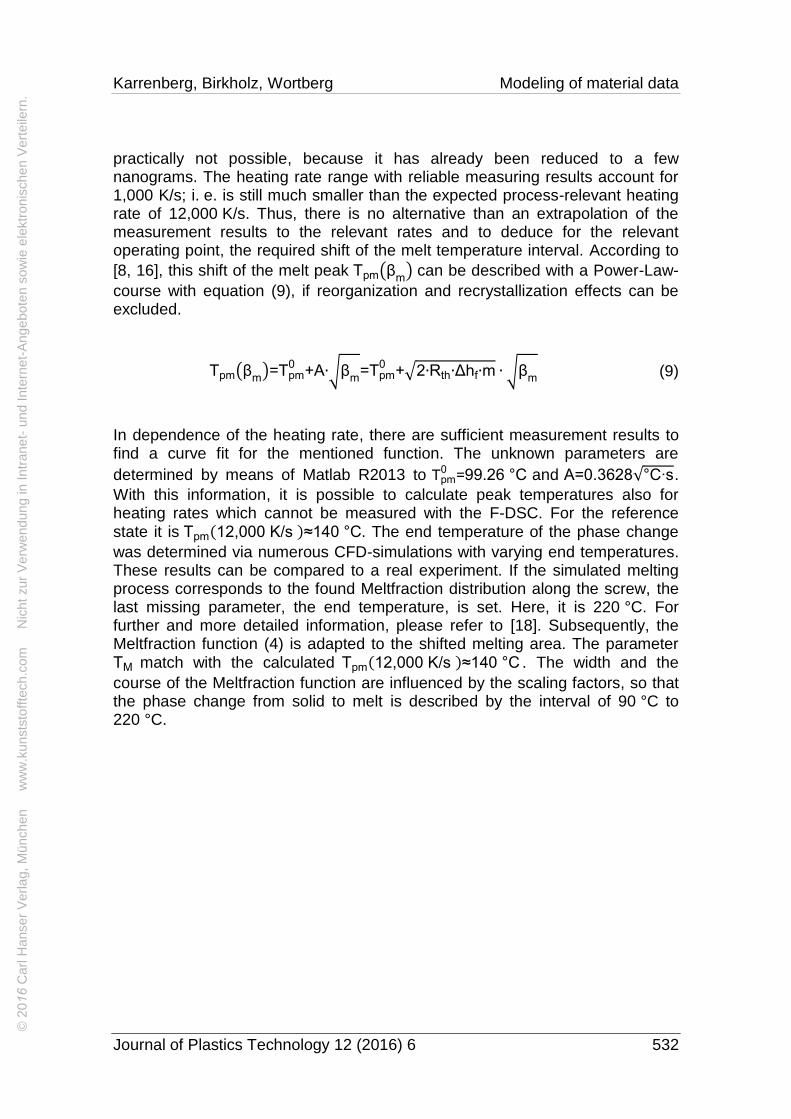
was determined via numerous CFD-simulations with varying end temperatures. These results can be compared to a real experiment. If the simulated melting process corresponds to the found Meltfraction distribution along the screw, the last missing parameter, the end temperature, is set. Here, it is 220 °C. For further and more detailed information, please refer to [18]. Subsequently, the Meltfraction function (4) is adapted to the shifted melting area. The parameter TM match with the calculated Tpm(12,000 K/s )≈140 °C . The width and the
course of the Meltfraction function are influenced by the scaling factors, so that the phase change from solid to melt is described by the interval of 90 °C to 220 °C.
© 2
016
Car
l Han
ser
Ver
lag,
Mün
chen
w
ww
.kun
stst
offte
ch.c
om
Nic
ht z
ur V
erw
endu
ng in
Intr
anet
- un
d In
tern
et-A
ngeb
oten
sow
ie e
lekt
roni
sche
n V
erte
ilern
.
Karrenberg, Birkholz, Wortberg Modeling of material data
Journal of Plastics Technology 12 (2016) 6 533
0.0
0.2
0.4
0.6
0.8
1.0
0 25 50 75 100 125 150 175 200 225 250
Melt
fracti
on
MF
[-]
Temperature T [ C]
0.167 K/s
12,000 K/s
Figure 5: Course of the Meltfraction function for low (measured) and high
heating rates βm
(extrapolated via F-DSC)
In Figure 5, the Meltfraction functions, determined by results of a standard DSC, and the results, which have been extrapolated on the basis of the F-DSC measurements, can be compared.
The change in the Meltfraction function also affects the other material properties like viscosity (WLF-shift), specific enthalpy, specific heat capacity, specific volume and thermal conductivity. Naturally, the phase change process is reflected at the same temperature range. For this reason, these material parameters can be described as a weighting function of the Meltfraction function, which itself is a superposition of solid and melt characteristics. The Meltfraction function prevents any inconsistencies between the temperature ranges of the phase change process of the different material properties.
The viscosity η(γ,T) can be described with the well-established Carreau-
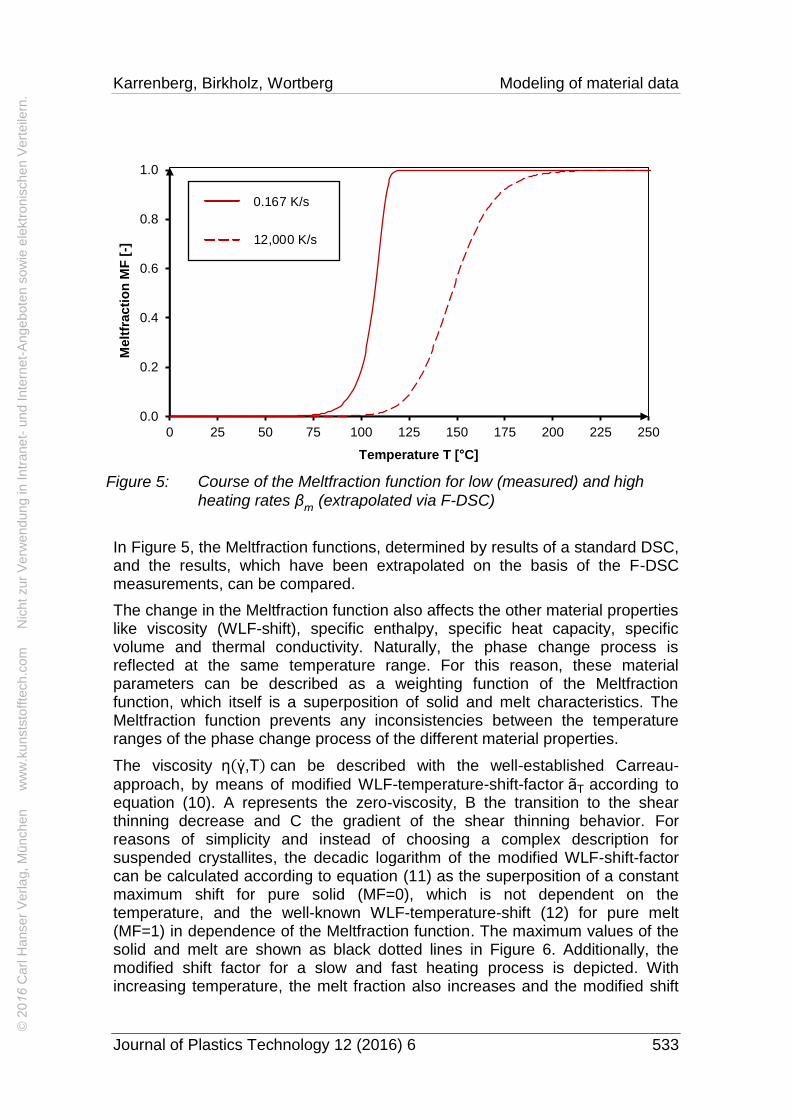
approach, by means of modified WLF-temperature-shift-factor aT according to equation (10). A represents the zero-viscosity, B the transition to the shear thinning decrease and C the gradient of the shear thinning behavior. For reasons of simplicity and instead of choosing a complex description for suspended crystallites, the decadic logarithm of the modified WLF-shift-factor can be calculated according to equation (11) as the superposition of a constant maximum shift for pure solid (MF=0), which is not dependent on the temperature, and the well-known WLF-temperature-shift (12) for pure melt (MF=1) in dependence of the Meltfraction function. The maximum values of the solid and melt are shown as black dotted lines in Figure 6. Additionally, the modified shift factor for a slow and fast heating process is depicted. With increasing temperature, the melt fraction also increases and the modified shift
© 2
016
Car
l Han
ser
Ver
lag,
Mün
chen
w
ww
.kun
stst
offte
ch.c
om
Nic
ht z
ur V
erw
endu
ng in
Intr
anet
- un
d In
tern
et-A
ngeb
oten
sow
ie e
lekt
roni
sche
n V
erte
ilern
.
Karrenberg, Birkholz, Wortberg Modeling of material data
Journal of Plastics Technology 12 (2016) 6 534
factor decreases abruptly since the viscosity decreases strongly. For pure melt (MF(T)=1), the modified WLF-shift matches up with the classical one. This mathematical description provides a very good description of the data and has shown a good practicability in the past. It can be used for semi-crystalline as well as amorphous thermoplastics. The WLF-approach provides a good accuracy for both cases [21].
η(γ,T)=aT∙A
(1+B∙aT ∙ γ)C (10)
log10(aT)=log
10(aT)max∙(1-MF(T))+log
10(aT)∙MF(T) (11)
log10(aT)=
8,86∙(T0-TS)
101,6+(T0-TS)-
8,86∙(T-TS)
101,6+(T-TS) (12)
-1.0
0.0
1.0
2.0
3.0
4.0
0 25 50 75 100 125 150 175 200 225 250
Mo
dif
ied
WL
F-S
hif
t
[
-]
Temperature T [ C]
𝒂 𝑻
0.167 K/s
12,000 K/s
Figure 6: Modified WLF-functions for PE-LD at different heating rates βm
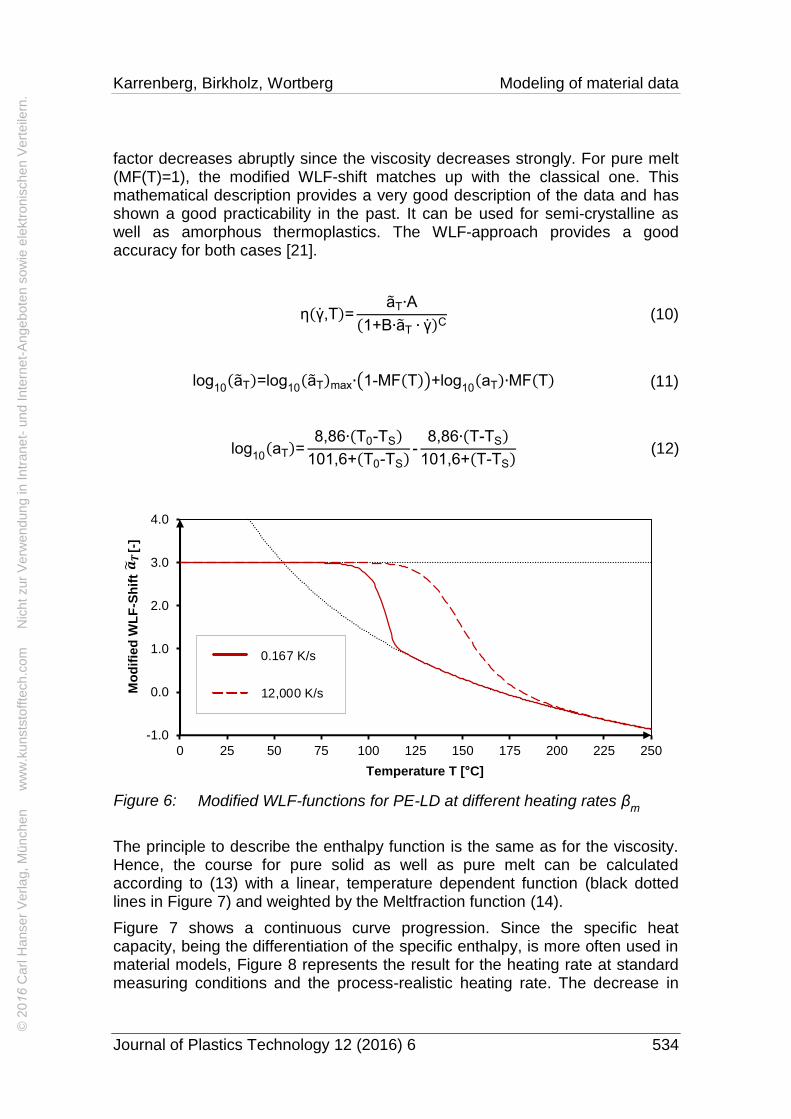
The principle to describe the enthalpy function is the same as for the viscosity. Hence, the course for pure solid as well as pure melt can be calculated according to (13) with a linear, temperature dependent function (black dotted lines in Figure 7) and weighted by the Meltfraction function (14).
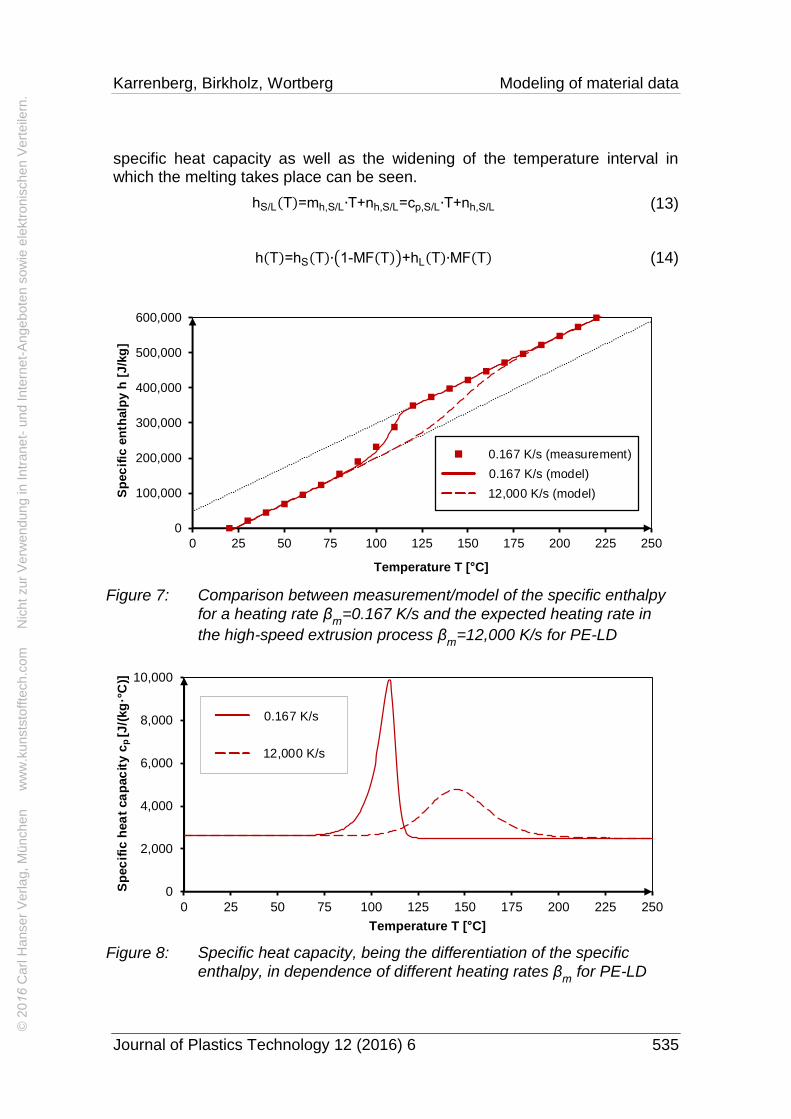
Figure 7 shows a continuous curve progression. Since the specific heat capacity, being the differentiation of the specific enthalpy, is more often used in material models, Figure 8 represents the result for the heating rate at standard measuring conditions and the process-realistic heating rate. The decrease in
© 2
016
Car
l Han
ser
Ver
lag,
Mün
chen
w
ww
.kun
stst
offte
ch.c
om
Nic
ht z
ur V
erw
endu
ng in
Intr
anet
- un
d In
tern
et-A
ngeb
oten
sow
ie e
lekt
roni
sche
n V
erte
ilern
.
Karrenberg, Birkholz, Wortberg Modeling of material data
Journal of Plastics Technology 12 (2016) 6 535
specific heat capacity as well as the widening of the temperature interval in which the melting takes place can be seen.
hS/L(T)=mh,S/L∙T+nh,S/L=cp,S/L∙T+nh,S/L (13)
h(T)=hS(T)∙(1-MF(T))+hL(T)∙MF(T) (14)
0
100,000
200,000
300,000
400,000
500,000
600,000
0 25 50 75 100 125 150 175 200 225 250
Sp
ecif
ic e
nth
alp
ie h
[J/k
g]
Temperature T [ C]
0.167 K/s (measurement)
0.167 K/s (model)
12,000 K/s (model)Sp
ec
ific
en
thalp
y h
[J
/kg
]
Figure 7: Comparison between measurement/model of the specific enthalpy
for a heating rate βm
=0.167 K/s and the expected heating rate in
the high-speed extrusion process βm
=12,000 K/s for PE-LD
0
2,000
4,000
6,000
8,000
10,000
0 25 50 75 100 125 150 175 200 225 250
Sp
ecif
ic h
eat
cap
acit
y c
p[J
/(k
g·K
)]
Temperature T [ C]
0.167 K/s
12,000 K/s
Sp
ec
ific
hea
t ca
pac
ity c
p [J
/(kg
·°C
)]
Figure 8: Specific heat capacity, being the differentiation of the specific
enthalpy, in dependence of different heating rates βm
for PE-LD
© 2
016
Car
l Han
ser
Ver
lag,
Mün
chen
w
ww
.kun
stst
offte
ch.c
om
Nic
ht z
ur V
erw
endu
ng in
Intr
anet
- un
d In
tern
et-A
ngeb
oten
sow
ie e
lekt
roni
sche
n V
erte
ilern
.
Karrenberg, Birkholz, Wortberg Modeling of material data
Journal of Plastics Technology 12 (2016) 6 536
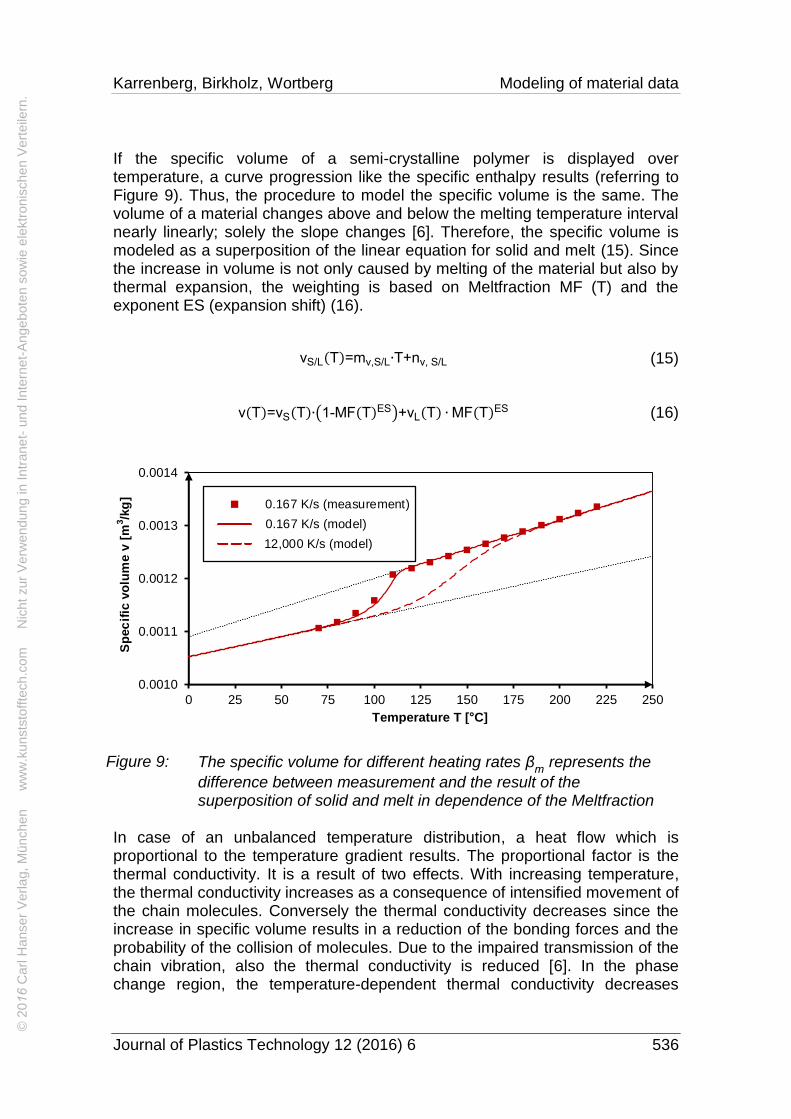
If the specific volume of a semi-crystalline polymer is displayed over temperature, a curve progression like the specific enthalpy results (referring to Figure 9). Thus, the procedure to model the specific volume is the same. The volume of a material changes above and below the melting temperature interval nearly linearly; solely the slope changes [6]. Therefore, the specific volume is modeled as a superposition of the linear equation for solid and melt (15). Since the increase in volume is not only caused by melting of the material but also by thermal expansion, the weighting is based on Meltfraction MF (T) and the exponent ES (expansion shift) (16).
vS/L(T)=mv,S/L∙T+nv, S/L (15)
v(T)=vS(T)∙(1-MF(T)ES)+vL(T) ∙MF(T)ES (16)
0.0010
0.0011
0.0012
0.0013
0.0014
0 25 50 75 100 125 150 175 200 225 250
sp
ecif
ic v
olu
me v
[m
3/k
g]
Temperature T [ C]
0.167 K/s (measurement)
0.167 K/s (model)
12,000 K/s (model)
Sp
ec
ific
vo
lum
e v
[m
3/k
g]
Figure 9: The specific volume for different heating rates βm
represents the
difference between measurement and the result of the superposition of solid and melt in dependence of the Meltfraction
In case of an unbalanced temperature distribution, a heat flow which is proportional to the temperature gradient results. The proportional factor is the thermal conductivity. It is a result of two effects. With increasing temperature, the thermal conductivity increases as a consequence of intensified movement of the chain molecules. Conversely the thermal conductivity decreases since the increase in specific volume results in a reduction of the bonding forces and the probability of the collision of molecules. Due to the impaired transmission of the chain vibration, also the thermal conductivity is reduced [6]. In the phase change region, the temperature-dependent thermal conductivity decreases
© 2
016
Car
l Han
ser
Ver
lag,
Mün
chen
w
ww
.kun
stst
offte
ch.c
om
Nic
ht z
ur V
erw
endu
ng in
Intr
anet
- un
d In
tern
et-A
ngeb
oten
sow
ie e
lekt
roni
sche
n V
erte
ilern
.
Karrenberg, Birkholz, Wortberg Modeling of material data
Journal of Plastics Technology 12 (2016) 6 537
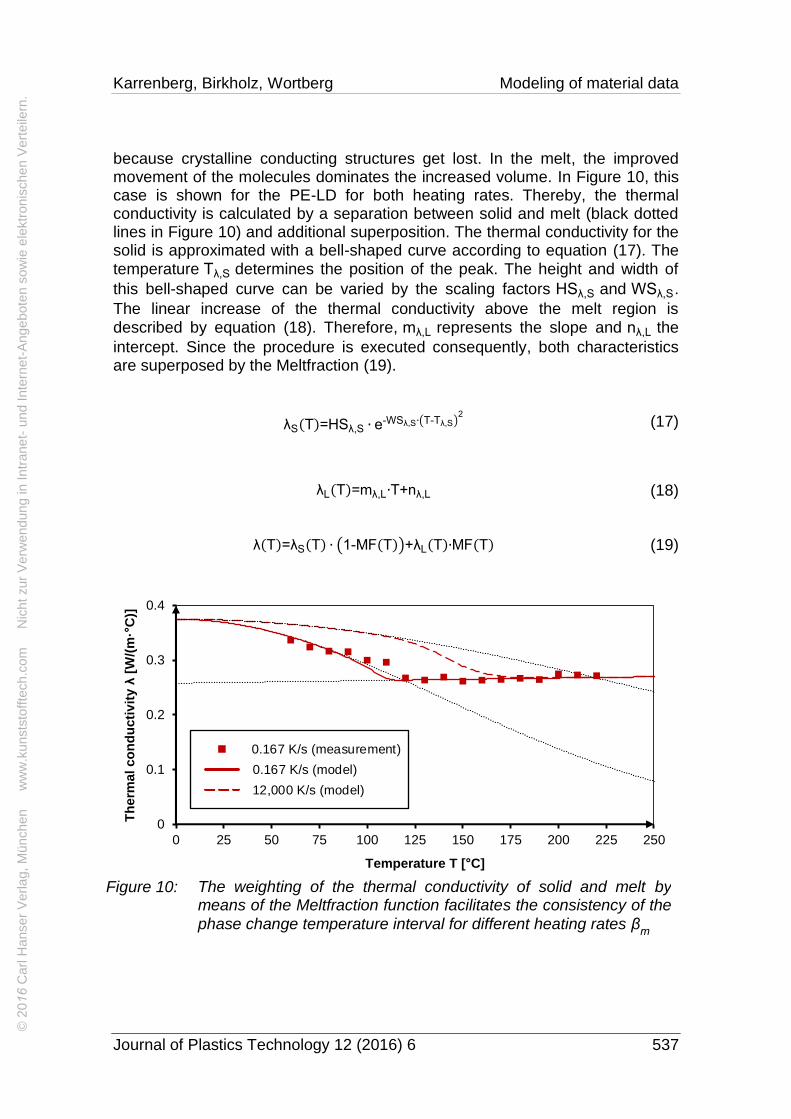
because crystalline conducting structures get lost. In the melt, the improved movement of the molecules dominates the increased volume. In Figure 10, this case is shown for the PE-LD for both heating rates. Thereby, the thermal conductivity is calculated by a separation between solid and melt (black dotted lines in Figure 10) and additional superposition. The thermal conductivity for the solid is approximated with a bell-shaped curve according to equation (17). The temperature Tλ,S determines the position of the peak. The height and width of
this bell-shaped curve can be varied by the scaling factors HSλ,S and WSλ,S.
The linear increase of the thermal conductivity above the melt region is described by equation (18). Therefore, mλ,L represents the slope and nλ,L the
intercept. Since the procedure is executed consequently, both characteristics are superposed by the Meltfraction (19).
λS(T)=HSλ,S ∙ e-WSλ,S∙(T-Tλ,S)
2
(17)
λL(T)=mλ,L∙T+nλ,L (18)
λ(T)=λS(T) ∙ (1-MF(T))+λL(T)∙MF(T) (19)
0
0.1
0.2
0.3
0.4
0 25 50 75 100 125 150 175 200 225 250
Th
erm
al co
nd
ucti
vit
y λ
[W/(
m·K
)]
Temperature T [ C]
0.167 K/s (measurement)
0.167 K/s (model)
12,000 K/s (model)
0
0.1
0.2
0.3
0.4
0 25 50 75 100 125 150 175 200 225 250
Th
erm
al co
nd
ucti
vit
y λ
[W/(
m·
C)]
Temperature T [ C]
Figure 10: The weighting of the thermal conductivity of solid and melt by means of the Meltfraction function facilitates the consistency of the
phase change temperature interval for different heating rates βm
© 2
016
Car
l Han
ser
Ver
lag,
Mün
chen
w
ww
.kun
stst
offte
ch.c
om
Nic
ht z
ur V
erw
endu
ng in
Intr
anet
- un
d In
tern
et-A
ngeb
oten
sow
ie e
lekt
roni
sche
n V
erte
ilern
.
Karrenberg, Birkholz, Wortberg Modeling of material data
Journal of Plastics Technology 12 (2016) 6 538
As a result, a comprehensive and numerical robust material model exists. It is convenient to make use of it, because the phase change process for all material data is only dependent on the Meltfraction function.
3.2 Cooling Process: Injection Molding
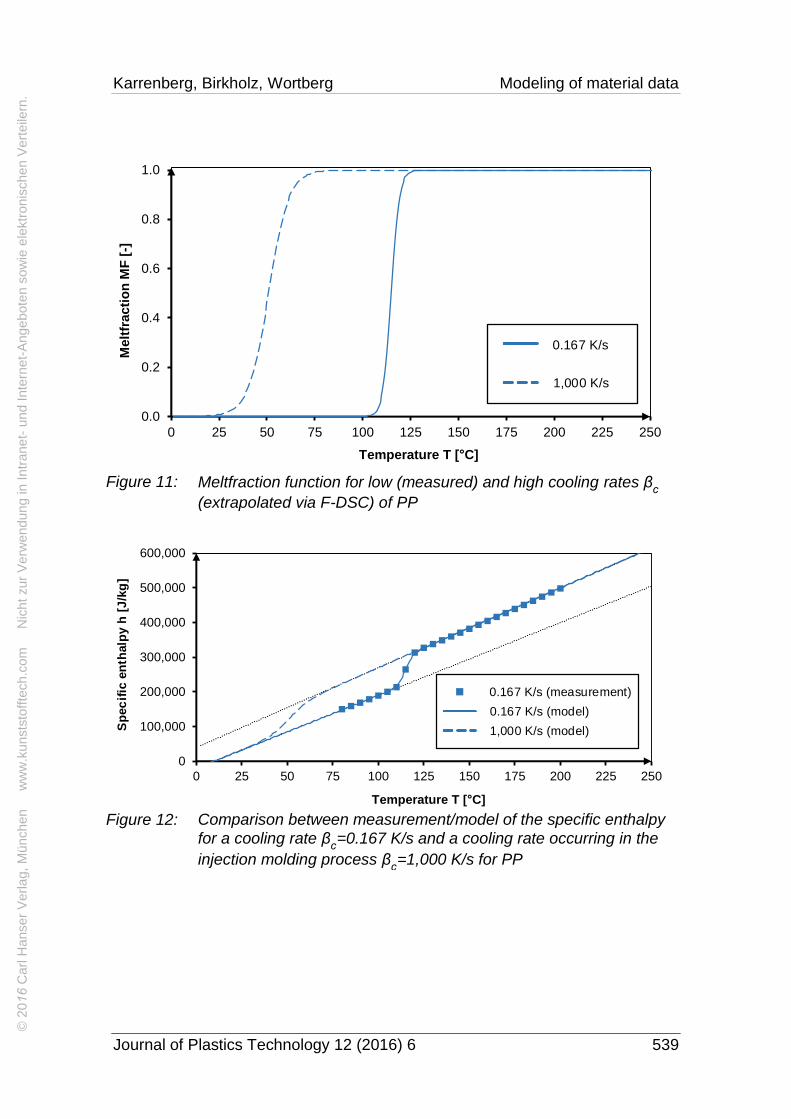
In an injection molding process, hot melt is injected into a mold and cooled down until the material is solidified. Thus, the material data to describe this process has to take these circumstances into account. When the melt touches the cold steel tool wall for the first time, the highest cooling rates occur. In the literature, cooling rates of up to 3,000 K/s [22] can be found. An increase of melt flowing into the cavity causes a decrease of the cooling rate; meaning that also in this polymer process relatively high cooling rates are prevalent, which vary over time as well as location. Hence, in CFD-simulations, material data, depending on the locally existent cooling rate, should be taken into account.
Since the procedure to describe the high-speed extrusion process (heating process) which has been presented in detail in the preceding section is a universal one, it can as well be used to determine a material model in respect of the injection molding process (cooling process). Since injection molding processes are only simulated until a so-called no-flow temperature is reached, the consideration of a modified WLF-shift factor as presented for melting in the previous section is not needed. Due to this, the results which constitute a consistent thermodynamic material model on the basis of the Meltfraction function for PP as a typical injection molding material, are summarized in Figure 11 – Figure 15. Here, a comparison between the measurement results under standard conditions and a process-relevant cooling rate (1,000 K/s) is shown. The determined Meltfraction function for the process-relevant cooling rate is as well extrapolated on the basis of the F-DSC results, which are determined during fast cooling. Hence, the results confirm the described tendencies, i. e. higher cooling rates cause a phase change at lower temperatures. The process-relevant dependency of the specific volume on the pressure is not presented, but can be considered as a combination of the continuous Meltfraction function and the generally used modified 2-domain Tait-approach, which is incapable to describe a steady phase transition between melt and semi-crystalline solid during cooling.
© 2
016
Car
l Han
ser
Ver
lag,
Mün
chen
w
ww
.kun
stst
offte
ch.c
om
Nic
ht z
ur V
erw
endu
ng in
Intr
anet
- un
d In
tern
et-A
ngeb
oten
sow
ie e
lekt
roni
sche
n V
erte
ilern
.
Karrenberg, Birkholz, Wortberg Modeling of material data
Journal of Plastics Technology 12 (2016) 6 539
0.0
0.2
0.4
0.6
0.8
1.0
0 25 50 75 100 125 150 175 200 225 250
Melt
fracti
on
MF
[-]
Temperature T [ C]
0.0
0.2
0.4
0.6
0.8
1.0
0 25 50 75 100 125 150 175 200 225 250
Melt
fracti
on
MF
[-]
Temperature T [ C]
0.167 K/s
1,000 K/s
Figure 11: Meltfraction function for low (measured) and high cooling rates βc
(extrapolated via F-DSC) of PP
0
100,000
200,000
300,000
400,000
500,000
600,000
0 25 50 75 100 125 150 175 200 225 250
Sp
ecif
ic e
nth
alp
ie h
[J
/kg
]
Temperature T [ C]
0
100,000
200,000
300,000
400,000
500,000
600,000
0 25 50 75 100 125 150 175 200 225 250
Sp
ecif
ic e
nth
alp
ie h
[J
/kg
]
Temperature T [ C]
Sp
ec
ific
en
thalp
y h
[J
/kg
]
0.167 K/s (measurement)
0.167 K/s (model)
1,000 K/s (model)
Figure 12: Comparison between measurement/model of the specific enthalpy
for a cooling rate βc=0.167 K/s and a cooling rate occurring in the
injection molding process βc=1,000 K/s for PP
© 2
016
Car
l Han
ser
Ver
lag,
Mün
chen
w
ww
.kun
stst
offte
ch.c
om
Nic
ht z
ur V
erw
endu
ng in
Intr
anet
- un
d In
tern
et-A
ngeb
oten
sow
ie e
lekt
roni
sche
n V
erte
ilern
.
Karrenberg, Birkholz, Wortberg Modeling of material data
Journal of Plastics Technology 12 (2016) 6 540
0
4,000
8,000
12,000
16,000
20,000
0 25 50 75 100 125 150 175 200 225 250
Sp
ecif
ic h
eat
cap
acit
y c
p[J
/(k
g·K
)]
Temperature T [ C]
Sp
ec
ific
hea
t ca
pac
ity c
p [J
/(kg
·°C
)]
0.167 K/s
1,000 K/s
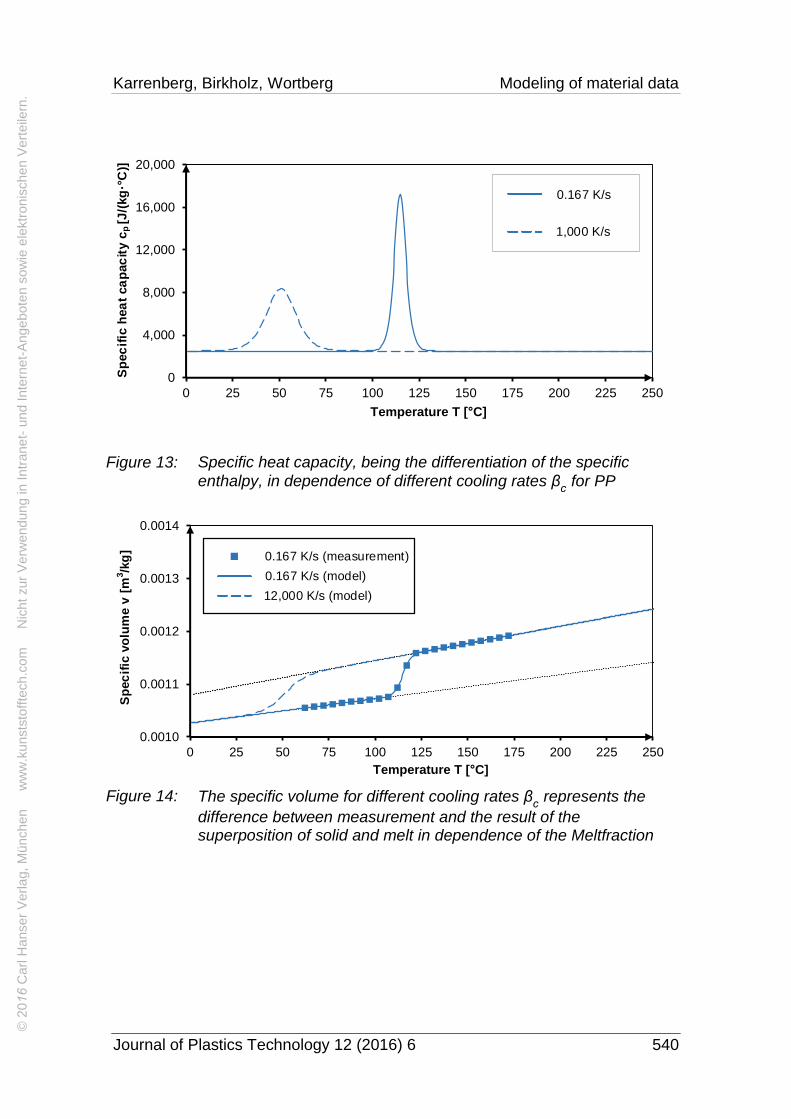
Figure 13: Specific heat capacity, being the differentiation of the specific
enthalpy, in dependence of different cooling rates βc for PP
0.0010
0.0011
0.0012
0.0013
0.0014
0 25 50 75 100 125 150 175 200 225 250
sp
ec
ific
vo
lum
e v
[m
3/k
g]
Temperature T [ C]
Sp
ec
ific
vo
lum
e v
[m
3/k
g]
0.167 K/s (measurement)
0.167 K/s (model)
12,000 K/s (model)
Figure 14: The specific volume for different cooling rates βc represents the
difference between measurement and the result of the superposition of solid and melt in dependence of the Meltfraction
© 2
016
Car
l Han
ser
Ver
lag,
Mün
chen
w
ww
.kun
stst
offte
ch.c
om
Nic
ht z
ur V
erw
endu
ng in
Intr
anet
- un
d In
tern
et-A
ngeb
oten
sow
ie e
lekt
roni
sche
n V
erte
ilern
.
Karrenberg, Birkholz, Wortberg Modeling of material data
Journal of Plastics Technology 12 (2016) 6 541
0
0.1
0.2
0.3
0.4
0 25 50 75 100 125 150 175 200 225 250
Th
erm
al co
nd
ucti
vit
y λ
[W/(
m·
C)]
Temperature T [ C]
0
0.1
0.2
0.3
0.4
0 25 50 75 100 125 150 175 200 225 250
Th
erm
al co
nd
ucti
vit
y λ
[W/(
m·
C)]
Temperature T [ C]
0.167 K/s (measurement)
0.167 K/s (model)
12,000 K/s (model)
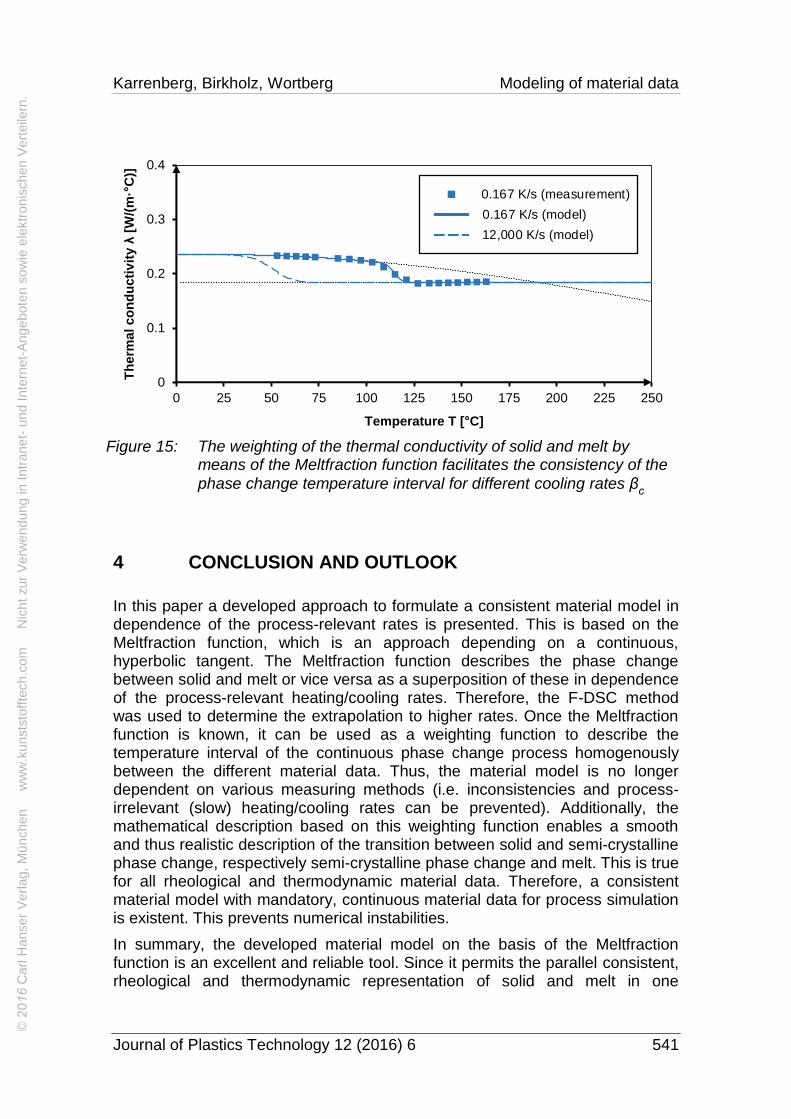
Figure 15: The weighting of the thermal conductivity of solid and melt by means of the Meltfraction function facilitates the consistency of the
phase change temperature interval for different cooling rates βc
4 CONCLUSION AND OUTLOOK
In this paper a developed approach to formulate a consistent material model in dependence of the process-relevant rates is presented. This is based on the Meltfraction function, which is an approach depending on a continuous, hyperbolic tangent. The Meltfraction function describes the phase change between solid and melt or vice versa as a superposition of these in dependence of the process-relevant heating/cooling rates. Therefore, the F-DSC method was used to determine the extrapolation to higher rates. Once the Meltfraction function is known, it can be used as a weighting function to describe the temperature interval of the continuous phase change process homogenously between the different material data. Thus, the material model is no longer dependent on various measuring methods (i.e. inconsistencies and process-irrelevant (slow) heating/cooling rates can be prevented). Additionally, the mathematical description based on this weighting function enables a smooth and thus realistic description of the transition between solid and semi-crystalline phase change, respectively semi-crystalline phase change and melt. This is true for all rheological and thermodynamic material data. Therefore, a consistent material model with mandatory, continuous material data for process simulation is existent. This prevents numerical instabilities.
In summary, the developed material model on the basis of the Meltfraction function is an excellent and reliable tool. Since it permits the parallel consistent, rheological and thermodynamic representation of solid and melt in one
© 2
016
Car
l Han
ser
Ver
lag,
Mün
chen
w
ww
.kun
stst
offte
ch.c
om
Nic
ht z
ur V
erw
endu
ng in
Intr
anet
- un
d In
tern
et-A
ngeb
oten
sow
ie e
lekt
roni
sche
n V
erte
ilern
.
Karrenberg, Birkholz, Wortberg Modeling of material data
Journal of Plastics Technology 12 (2016) 6 542
continuum, it can be used with prevalent CFD-solvers to simulate principally any melting and cooling processes. Thus, the model is able to contribute to the virtual development of process knowledge concerning flow processes in plastic processing machines.
There are still additional dependencies, such as pressure dependence of the viscosity and specific volume to be considered in more detail in the future. In addition to the discussed effect of process-relevant heating and cooling rates on the thermal conductivity, the effect of orientation of polymer chains (anisotropy) on the thermal conductivity should be taken into account.
The presented method for semi-crystalline thermoplastics can be adapted to the characteristic material behavior of amorphous thermoplastics. For this purpose, the transition from the glassy to the molten state can be described depending on the material characteristic with the Meltfraction function based on an exponential function (connection of two linear sections with different slope) or the presented hyperbolic tangent (connection of two linear sections with an inflection point).
Symbols
Symbol SI-Unit Description
aT [-] WLF-temperature-shift-factor
aT [-] modified WLF-temperature-shift-factor
aTmax [-] maximum WLF-temperature-shift-factor
A [Pa∙s] zero viscosity (Carreau)
B [s] transition to the shear thinning decrease
cp [J (kg∙K)⁄ ] specific heat capacity
cp,L [J (kg∙K)⁄ ] specific heat capacity (liquid=melt)
cp,S [J (kg∙K)⁄ ] specific heat capacity (solid)
C [-] slope of shear thinning (Carreau)
© 2
016
Car
l Han
ser
Ver
lag,
Mün
chen
w
ww
.kun
stst
offte
ch.c
om
Nic
ht z
ur V
erw
endu
ng in
Intr
anet
- un
d In
tern
et-A
ngeb
oten
sow
ie e
lekt
roni
sche
n V
erte
ilern
.
Karrenberg, Birkholz, Wortberg Modeling of material data
Journal of Plastics Technology 12 (2016) 6 543
D [m] extruder diameter
endo [W] endothermic heat flow
ES [-] Expansion Shift factor
exo [W] exothermic heat flow
f [m s2⁄ ] acceleration vector
g [m s2⁄ ] gravitational constant
h [J kg⁄ ] specific enthalpy
hL [J kg⁄ ] specific enthalpy (liquid=melt)
hS [J kg⁄ ] specific enthalpy (solid)
HSλ,S [W (m∙K)⁄ ] height scaling factor (solid)
m [kg] sample mass
mh,L [J (kg∙K)⁄ ] rate of change of the specific enthalpy
(liquid=melt)
mh,S [J (kg∙K)⁄ ] rate of change of the specific enthalpy (solid)
mv,L [m3 (kg∙K)⁄ ] rate of change of the specific volume
(liquid=melt)
mv,S [m3 (kg∙K)⁄ ] rate of change of the specific volume (solid)
mλ,L [W (m∙K2)⁄ ]
rate of change of the thermal conductivity
(liquid=melt)
MF [-] Meltfraction
MS [-] Melt-Shift Factor
n [s-1] screw speed
nh,L [J kg⁄ ] specific enthalpy at 0K (liquid=melt)
nh,S [J kg⁄ ] specific enthalpy at 0K (solid)
© 2
016
Car
l Han
ser
Ver
lag,
Mün
chen
w
ww
.kun
stst
offte
ch.c
om
Nic
ht z
ur V
erw
endu
ng in
Intr
anet
- un
d In
tern
et-A
ngeb
oten
sow
ie e
lekt
roni
sche
n V
erte
ilern
.
Karrenberg, Birkholz, Wortberg Modeling of material data
Journal of Plastics Technology 12 (2016) 6 544
nv,L [J kg⁄ ] specific volume at 0K (liquid=melt)
nv,S [J kg⁄ ] specific volume at 0K (solid)
nλ,L [W (m∙K)⁄ ] thermal conductivity at 0K (liquid=melt)
p [Pa] pressure
PDiss.,m [W m3⁄ ] mass specific dissipation
Q [W] heat flow
qS [W m3⁄ ] specific heat radiation
Rth [°C W⁄ ] thermal resistance between material specimen
and thermocouple
t [s] time
T [K] temperature
T0 [K] reference temperature
Tfc [K] endset of the (crystallization) phase change
Tic [K] onset of the (crystallization) phase change
TM [K] average melting temperature
TS [K] standard temperature
Tpc [K] crystallization temperature (peak temperature
cooling)
Tpm [K] melting temperature (peak temperature
melting)
Tpm0
[K] melting temperature if heated with a rate of
0 K/s
Tλ,S [K] Peak temperature thermal conductivity (solid)
TS [-] Transition Scaling Factor
© 2
016
Car
l Han
ser
Ver
lag,
Mün
chen
w
ww
.kun
stst
offte
ch.c
om
Nic
ht z
ur V
erw
endu
ng in
Intr
anet
- un
d In
tern
et-A
ngeb
oten
sow
ie e
lekt
roni
sche
n V
erte
ilern
.
Karrenberg, Birkholz, Wortberg Modeling of material data
Journal of Plastics Technology 12 (2016) 6 545
v [m3 kg⁄ ] specific volume
vL [m3 kg⁄ ] specific volume (liquid=melt)
vS [m3 kg⁄ ] specific volume (solid)
v=[u v w]T [m s⁄ ] velocity vector
WSλ,S [K-2] width scaling factor (solid)
z [m] vertical coordinate
βm/c,0
[K s⁄ ] slow heating/cooling
βm/c,1
[K s⁄ ] fast heating/cooling (dashed lines)
βc [K s⁄ ] cooling rate (blue)
βm
[K s⁄ ] heating rate (red)
βrep.m
[K s⁄ ] representative heating rate
γ [s-1] shear rate
γFilm
[s-1] shear rate of the film
δFilm [m] thickness of melt film
τ [N mm2⁄ ] stress tensor
η [Pa∙s] shear viscosity
λ [W (m∙K)⁄ ] thermal conductivity
ρ [kg m3⁄ ] density
© 2
016
Car
l Han
ser
Ver
lag,
Mün
chen
w
ww
.kun
stst
offte
ch.c
om
Nic
ht z
ur V
erw
endu
ng in
Intr
anet
- un
d In
tern
et-A
ngeb
oten
sow
ie e
lekt
roni
sche
n V
erte
ilern
.
Karrenberg, Birkholz, Wortberg Modeling of material data
Journal of Plastics Technology 12 (2016) 6 546
References
[1] Lecheler, S. Numerische Strömungsberechnung
3rd edition, Springer Vieweg, Wiesbaden, 2014
DOI: 10.1007/978-3-658-05201-0
[2] Ferziger, J. H.; Peric, M.
Numerische Strömungsmechanik
1st edition, Springer, Berlin, Heidelberg, 2008
DOI: 10.1007/978-3-540-68228-8
[3] Conzen, C. Numerische und experimentelle Untersuchungen zu Transportvorgängen in Schneckenmaschinen
Dissertation, Universität Kassel, 2008
[4] Pohl, T. Entwicklung schnelldrehender Einschnecken-systeme für die Kunststoffverarbeitung auf Basis theoretischer Grundlagenuntersuchungen
Dissertation, Universität Paderborn, 2003
[5] Bonten, C. Kunststofftechnik: Einführung und Grundlagen
Carl Hanser, München, 2014
DOI: 10.3139/9783446441712
[6] Menges, G.; Haberstroh, E.; Michaeli, W.; Schmachtenberg, E.
Menges Werkstoffkunde Kunststoffe
6th edition, Carl Hanser Verlag, München, 2011
DOI: 10.3139/9783446443532
[7] Poel, G. V.; Istrate, D.; Magon, A; Mathot, V.
Performance and calibration of the Flash DSC 1, a new, MEMS-based fast scanning calorimeter Journal of Thermal Analysis & Calorimetry 110 (2012) 3, p. 1533 – 1546; DOI: 10.1007/s10973-012-2722-7
[8] Schawe, J. E.K An analysis of the meta stable structure of poly(ethylene terephthalate) by conventional DSC
Thermochimica Acta 461 (2007) 1-2, pp. 145 – 152
DOI: 10.1016/j.tca.2007.05.017
[9] Schawe, J. E.K Flash DSC 1: A novel fast differential scanning calorimeter
Proceedings of the 27th International Conference of the Polymer Processing Society (PPS). Marrakesh, Morocco, 2011
© 2
016
Car
l Han
ser
Ver
lag,
Mün
chen
w
ww
.kun
stst
offte
ch.c
om
Nic
ht z
ur V
erw
endu
ng in
Intr
anet
- un
d In
tern
et-A
ngeb
oten
sow
ie e
lekt
roni
sche
n V
erte
ilern
.
Karrenberg, Birkholz, Wortberg Modeling of material data
Journal of Plastics Technology 12 (2016) 6 547
[10] Rahal, H. Alternative Methoden zur Feststoffförderung und Plastifizierung in der Extrusionstechnik
Dissertation, Universität Duisburg-Essen, 2008
[11] Ehrenstein, G. W.; Riedel, G.; Trawiel, P.
Praxis der thermischen Analyse von Kunststoffen
2nd edition, Carl Hanser, München, 2003
[12] N.N. DIN EN ISO 11357-1, 2010. Kunstststoffe - Dynamische Differenz Thermoanalyse (DSC) - Teil 1: Allgemeine Grundlagen
[13] Mathot, V.; Pyda, M.; Pijpers, T. et al.
The Flash DSC 1, a power compensation twin-type, chip-based fast scanning calorimeter (FSC): First findings on polymers
Thermochimica Acta 522 (2011) 1-2, pp. 36 – 45
DOI: 10.1016/j.tca.2011.02.031
[14] Ehrenstein, G. W.; Drummer, D.
Hochgefüllte Kunststoffe mit definierten magnetischen, thermischen und elektrischen Eigenschaften
1st edition, Springer VDI, Düsseldorf, 2002
[15] Schawe, J.E.K.; Hempel, E.
Investigations of structure formation of semi-crystalline polymers at high supercooling and reorganization during reheating
Proceedings of the 28th International Conference of the Polymer Processing Society (PPS), Pattaya, Thailand, 2012
[16] Toda, A.; Taguchi, K.; Nozaki, K.; Konishi, M.
Melting behaviors of polyethylene crystals: An application of fast-scan DSC
Polymer 55 (2014) 14, pp. 3186 – 3194
DOI: 10.1016/j.polymer.2014.05.009
[17] Vanden Eynde, S.; Mathot, V.; Höhne, G. et al.
Thermal behaviour of homogeneous ethylene-1-octene copolymers and linear polyethylene at high pressures
Polymer 41 (2000) 9, pp. 3411 – 3423
DOI: 10.1016/S0032-3861(99)00505-4
[18] Karrenberg, G. Einsatz innovativer Simulationstechniken zur Entwicklung eines High-Speed-Extrusionskonzeptes auf Basis von Feststoff-Schmelze-Trennung
Dissertation, Universität Duisburg-Essen, 2016
© 2
016
Car
l Han
ser
Ver
lag,
Mün
chen
w
ww
.kun
stst
offte
ch.c
om
Nic
ht z
ur V
erw
endu
ng in
Intr
anet
- un
d In
tern
et-A
ngeb
oten
sow
ie e
lekt
roni
sche
n V
erte
ilern
.
Karrenberg, Birkholz, Wortberg Modeling of material data
Journal of Plastics Technology 12 (2016) 6 548
[19] Roth, M. Schnelllaufende Einschnecken-Extruder – Entwicklungsstand
VDI Tagungsband "Extrusionstechnik 2010", 2010, pp. 21 – 32
[20] Rao, N. S.; Schumacher, G.
Design formulas for plastics engineers
2nd edition, Carl Hanser, München, 2004
DOI: 10.3139/9783446413009
[21] Michaeli, W. Extrusionswerkzeuge für Kunststoffe und Kautschuk. Bauarten, Gestaltung und Berechnungsmöglichkeiten.
Carl Hanser, München, 2009
[22] Brunotte, R. Die thermodynamischen und verfahrenstechnischen Abläufe der in-situ-Oberflächenmodifizierung beim Spritzgießen
Dissertation Technische Universität Chemnitz, 2006
Bibliography DOI 10.3139/O999.040616 Zeitschrift Kunststofftechnik / Journal of Plastics Technology 12 (2016) 6; page 516–549 © Carl Hanser Verlag GmbH & Co. KG ISSN 1864 – 2217
© 2
016
Car
l Han
ser
Ver
lag,
Mün
chen
w
ww
.kun
stst
offte
ch.c
om
Nic
ht z
ur V
erw
endu
ng in
Intr
anet
- un
d In
tern
et-A
ngeb
oten
sow
ie e
lekt
roni
sche
n V
erte
ilern
.
Karrenberg, Birkholz, Wortberg Modeling of material data
Journal of Plastics Technology 12 (2016) 6 549
Stichworte: konsistente Stoffdaten, Materialmodel, Simulation, Verfahren der Kunststoffverarbeitung (Extrusion, Spritzgießen)
Keywords:
consistent material data, material model, simulation, methods of plastics processing (extrusion, injection molding)
Autor / author:
Dr.-Ing. Gregor Karrenberg Antje Birkholz, M.Sc. Prof. Dr.-Ing. Johannes Wortberg Institute of Product Engineering University of Duisburg-Essen Lotharstraße 1 47057 Duisburg
E-Mail: : [email protected] Webseite: www.uni-due.de/kkm Tel.: +49 (0)203/379-1732 Fax: +49 (0)203/379-4379
Herausgeber / Editors:
Editor-in-Chief Prof. em. Dr.-Ing. Dr. h.c. Gottfried W. Ehrenstein Lehrstuhl für Kunststofftechnik, Universität Erlangen-Nürnberg Phone: +49 (0)9131/85 – 29701; Fax.: +49 (0)9131/85 – 29709, E-Mail: [email protected] Europa / Europe Prof. Dr.-Ing. Dietmar Drummer, verantwortlich Lehrstuhl für Kunststofftechnik Universität Erlangen-Nürnberg Am Weichselgarten 9 91058 Erlangen Deutschland Tel.: +49 (0)9131/85 - 29701 Fax: +49 (0)9131/85 - 29709 E-Mail: [email protected]
Amerika / The Americas Prof. Prof. hon. Dr. Tim A. Osswald, responsible Polymer Engineering Center, Director University of Wisconsin-Madison 1513 University Avenue Madison, WI 53706 USA Tel.: +1/608 263 9538 Fax: +1/608 265 2316 E-Mail: [email protected]
Verlag / Publisher:
Carl Hanser Verlag GmbH & Co. KG Wolfgang Beisler Geschäftsführer Kolbergerstraße 22 D-81679 München Tel.: +49 (0)89 99830-0 Fax: +49 (0)89 984809 E-Mail: [email protected]
Redaktion / Editorial Office:
Dr.-Ing. Eva Bittmann Christopher Fischer, M.Sc. E-Mail: [email protected] Beirat / Advisory Board:
Experten aus Forschung und Industrie, gelistet unter www.kunststofftech.com
© 2
016
Car
l Han
ser
Ver
lag,
Mün
chen
w
ww
.kun
stst
offte
ch.c
om
Nic
ht z
ur V
erw
endu
ng in
Intr
anet
- un
d In
tern
et-A
ngeb
oten
sow
ie e
lekt
roni
sche
n V
erte
ilern
.