zambia’s infrastructure: a continental...
TRANSCRIPT

COUNTRY REPORT
Zambia’s Infrastructure: A Continental Perspective
Vivien Foster and Carolina Dominguez
MARCH 2010

© 2010 The International Bank for Reconstruction and Development / The World Bank 1818 H Street, NW Washington, DC 20433 USA Telephone: 202-473-1000 Internet: www.worldbank.org E-mail: [email protected] All rights reserved A publication of the World Bank. The World Bank 1818 H Street, NW Washington, DC 20433 USA The findings, interpretations, and conclusions expressed herein are those of the author(s) and do not necessarily reflect the views of the Executive Directors of the International Bank for Reconstruction and Development / The World Bank or the governments they represent. The World Bank does not guarantee the accuracy of the data included in this work. The boundaries, colors, denominations, and other information shown on any map in this work do not imply any judgment on the part of The World Bank concerning the legal status of any territory or the endorsement or acceptance of such boundaries.
Rights and permissions The material in this publication is copyrighted. Copying and/or transmitting portions or all of this work without permission may be a violation of applicable law. The International Bank for Reconstruction and Development / The World Bank encourages dissemination of its work and will normally grant permission to reproduce portions of the work promptly. For permission to photocopy or reprint any part of this work, please send a request with complete information to the Copyright Clearance Center Inc., 222 Rosewood Drive, Danvers, MA 01923 USA; telephone: 978-750-8400; fax: 978-750-4470; Internet: www.copyright.com. All other queries on rights and licenses, including subsidiary rights, should be addressed to the Office of the Publisher, The World Bank, 1818 H Street, NW, Washington, DC 20433 USA; fax: 202-522-2422; e-mail: [email protected].

About AICD and its country reports
This study is a product of the Africa Infrastructure Country Diagnostic (AICD), a project designed to expand the world’s knowledge of physical infrastructure in Africa. The AICD provides a baseline against which future improvements in infrastructure services can be measured, making it possible to monitor the results achieved from donor support. It also offers a solid empirical foundation for prioritizing investments and designing policy reforms in Africa’s infrastructure sectors.
The AICD is based on an unprecedented effort to collect detailed economic and technical data on African infrastructure. The project has produced a series of original reports on public expenditure, spending needs, and sector performance in each of the main infrastructure sectors, including energy, information and communication technologies, irrigation, transport, and water and sanitation. Africa’s Infrastructure—A Time for Transformation, published by the World Bank and the Agence Française de Développement in November 2009, synthesized the most significant findings of those reports.
The focus of the AICD country reports is on benchmarking sector performance and quantifying the main financing and efficiency gaps at the country level. These reports are particularly relevant to national policy makers and development partners working on specific countries.
The AICD was commissioned by the Infrastructure Consortium for Africa following the 2005 G8 (Group of Eight) summit at Gleneagles, Scotland, which flagged the importance of scaling up donor finance for infrastructure in support of Africa’s development.
The first phase of the AICD focused on 24 countries that together account for 85 percent of the gross domestic product, population, and infrastructure aid flows of Sub-Saharan Africa. The countries are: Benin, Burkina Faso, Cape Verde, Cameroon, Chad, Côte d'Ivoire, the Democratic Republic of Congo, Ethiopia, Ghana, Kenya, Lesotho, Madagascar, Malawi, Mozambique, Namibia, Niger, Nigeria, Rwanda, Senegal, South Africa, Sudan, Tanzania, Uganda, and Zambia. Under a second phase of the project, coverage was expanded to include as many as possible of the additional African countries.
Consistent with the genesis of the project, the main focus is on the 48 countries south of the Sahara that face the most severe infrastructure challenges. Some components of the study also cover North African countries so as to provide a broader point of reference. Unless otherwise stated, therefore, the term “Africa” is used throughout this report as a shorthand for “Sub-Saharan Africa.”
The World Bank has implemented the AICD with the guidance of a steering committee that represents the African Union, the New Partnership for Africa’s Development (NEPAD), Africa’s regional economic communities, the African Development Bank (AfDB), the Development Bank of Southern Africa (DBSA), and major infrastructure donors.

Financing for the AICD is provided by a multidonor trust fund to which the main contributors are the United Kingdom’s Department for International Development (DFID), the Public Private Infrastructure Advisory Facility (PPIAF), Agence Française de Développement (AFD), the European Commission, and Germany’s Entwicklungsbank (KfW). A group of distinguished peer reviewers from policy-making and academic circles in Africa and beyond reviewed all of the major outputs of the study to ensure the technical quality of the work. The Sub-Saharan Africa Transport Policy Program and the Water and Sanitation Program provided technical support on data collection and analysis pertaining to their respective sectors.
The data underlying AICD’s reports, as well as the reports themselves, are available to the public through an interactive Web site, www.infrastructureafrica.org, that allows users to download customized data reports and perform various simulations. Many AICD outputs will appear in the World Bank’s Policy Research Working Papers series.
Inquiries concerning the availability of data sets should be directed to the volume editors at the World Bank in Washington, DC.
iii
Contents
Synopsis 1
The continental perspective 2
Why infrastructure matters 2
The state of Zambia’s infrastructure 5
Roads 8Rail 10Air transport 11Water supply and sanitation 12Power 16Water resources 19Information and communication technology 20
Financing Zambia’s infrastructure 23
How much more can be done within the existing resource envelope? 26Annual funding gap 31What else can be done? 32
Bibliography 34

Synopsis
Infrastructure improvements contributed 0.6 percentage points to the annual per capita growth of
Zambia’s gross domestic product (GDP) over the past decade, mostly because of the exponential growth
of information and communication technology (ICT) services. Poor performance of the power sector
reduced the per capita growth rate by 0.1 percentage point. Simulations suggest that if Zambia’s
infrastructure platform could be improved to the level of the African leader—Mauritius—per capita
growth rates could increase by 2 percentage points per year.
Zambia’s high generation capacity and relatively high power consumption are accompanied by fewer
power outages than its neighbors. But Zambia’s power sector is primarily oriented toward the mining
industry, while household electrification, at 20 percent, is about half that in other resource-rich countries.
Zambia’s power tariffs are among the lowest in Africa and are less than half the level needed to accelerate
electrification and keep pace with mining sector demands. Meeting future power demands and raising
electrification rates will be difficult without increasing power tariffs.
Improving Zambia’s infrastructure requires reform of its administrative and regulatory processes (for
example, to remove obstacles to regional trade), as well as substantial physical investments. Because of
border delays along the north-south corridor (now being tackled by the government) road and rail freight
crawls along at a pace of little more than 10 kilometers per hour. Lack of effective regulation also allows
Zambia’s rail operator to charge exorbitant tariffs while providing lackluster service.
On just about every aspect of infrastructure, rural Zambians lag well behind their African peers. In a
country where 70 percent of the population depends on agriculture for its livelihood, this represents a
huge drag on the economy.
Zambia would need to spend an average of $1.6 billion a year over the decade 2006–15 to develop the
infrastructure found in the rest of the developing world. This is equivalent to 20 percent of Zambia’s GDP
(similar to what China invested in infrastructure in the mid-2000s), and is about double the country’s rate
of investment in recent years. The power sector alone accounts for 32 percent of these spending needs.
Inefficiencies cause the loss of $300 million (or 4.3 percent of GDP) a year that could be recouped by
suitable policy and institutional reforms. Underpricing of power and related subsidies cost the economy
$152 million a year, even though Zambia’s relatively low-cost power could be afforded by most of the
population at cost-recovery prices. Distribution losses and low rates of collection by water utilities
represent a further $52 million, while low rates of execution of capital budgets in the road transport sector
mean that $39 million of budgeted resources are not spent within the financial year.
Zambia’s infrastructure funding gap of $500 million a year (6.5 percent of GDP) could be largely
offset by strategic policy choices. Closing the gap requires raising more funds and looking for more cost-
effective ways to meet infrastructure targets. Adopting lower-cost solutions (such as standposts,
boreholes, improved latrines) to meet the Millennium Development Goals for water supply and sanitation
could save $218 million a year. Participation in the regional power market could save $160 million. And
eliminating overengineering in the road sector could save $60 million. Reallocation of disbursements that
exceed requirements could make an additional $90 million available for more productive uses each year.

ZAMBIA’S INFRASTRUCTURE: A CONTINENTAL PERSPECTIVE
2
If current levels of inefficiency are allowed to persist, and in the absence of additional funding, it will
take at least 30 years to meet Zambia’s infrastructure targets at today’s spending levels. With efficiency
gains, Zambia could reach the targets within 15 years.
Zambia’s infrastructure situation is more hopeful than that of many other African countries. Infrastructure spending needs—though large—are not beyond the realm of possibility, and Zambia’s
resource wealth and relatively well-off population provide a more solid financing basis than is available
to many other countries. Zambia’s infrastructure funding gap—though substantial—can be dramatically
reduced through measures to stem inefficiencies and lower costs.
The continental perspective
The Africa Infrastructure Country Diagnostic (AICD) has gathered and analyzed extensive data on
infrastructure in some 40 Sub-Saharan countries, including Zambia. The results have been presented in
reports covering different areas of infrastructure—ICT, irrigation, power, transport, and WSS—and
different policy areas, including investment needs, fiscal costs, and sector performance.
This report presents the key AICD findings for Zambia, allowing the country’s infrastructure situation
to be benchmarked against that of its African peers. Given that Zambia’s economy is dependent on
mining, it will be benchmarked against other resource-rich economies in Africa, as well as against other
African low-income countries. Detailed comparisons will also be made with immediate regional
neighbors in the Southern Africa Development Community (SADC).
Several methodological issues should be borne in mind. First, because of the cross-country nature of
data collection, a time lag is inevitable. The period covered by the AICD runs from 2001 to 2006. Most
technical data presented are for 2006 (or the most recent year available), while financial data are typically
averaged over the available period to smooth out the effect of short-term fluctuations. Second, in order to
make comparisons across countries, we had to standardize the indicators and analysis so that everything
was done on a consistent basis. This means that some of the indicators presented here may be slightly
different from those that are routinely reported and discussed at the country level.
Why infrastructure matters
During the five years 2003–07, Zambia’s economic performance was relatively strong; by 2007 it had
neared the 7 percent growth rate needed to make a significant impact on poverty reduction. The overall
contribution of infrastructure to improved growth in Zambia in the early 2000s was 0.6 percentage points,
substantially less than for other countries in the region (figure 1). Zambia’s ICT sector was responsible
for most of this growth as it added 0.47 percentage points to the per capita growth rate, while the power
sector reduced per capita growth by 0.13 percentage points. If Zambia could improve its infrastructure to
the level of middle-income countries in the region, performance could grow by as much as 2.6 percent per
capita.

ZAMBIA’S INFRASTRUCTURE: A CONTINENTAL PERSPECTIVE
3
Figure 1. Historic and potential future links between infrastructure and growth a. Historic changes in growth per capita
b. Potential improvements in growth per capita
Source: Calderon, 2009.
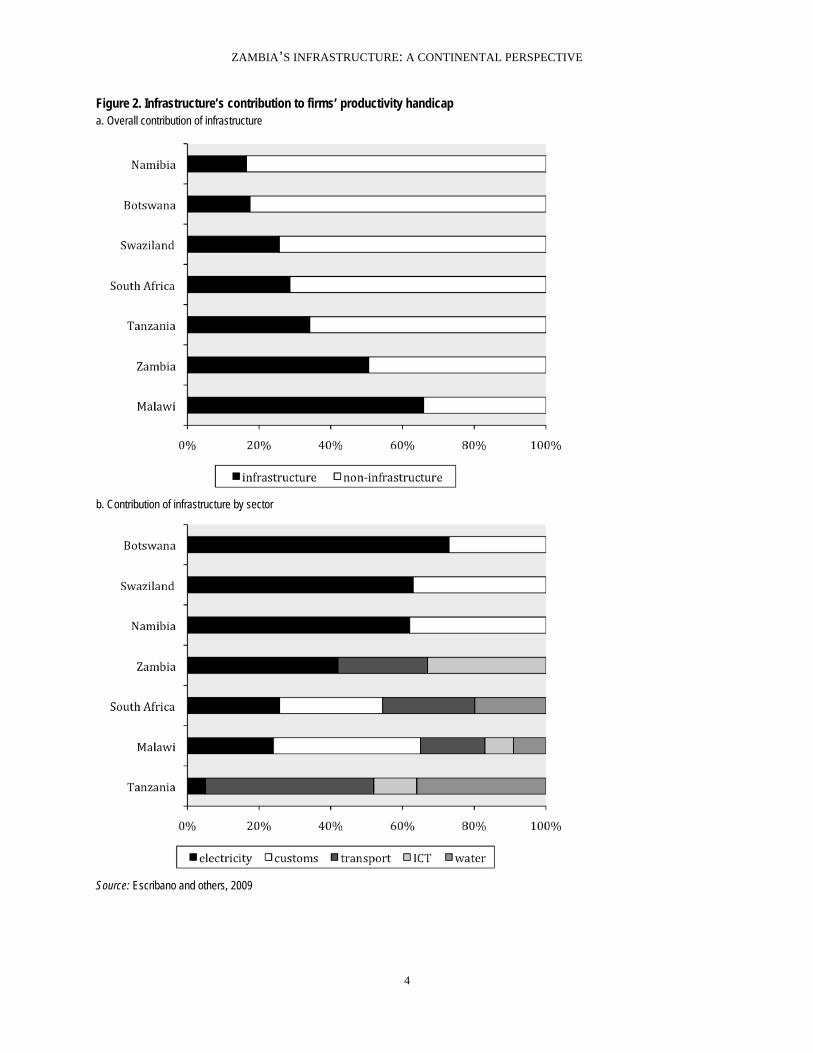
Evidence from enterprise surveys suggests that infrastructure constraints are responsible for about 50
percent of the productivity handicap faced by Zambian firms, with the remainder being due to poor
governance, red tape, and financing constraints (figure 2). Power is the infrastructure constraint that
weighs most heavily on Zambian firms, followed by ICT and transport.
ZAMBIA’S INFRASTRUCTURE: A CONTINENTAL PERSPECTIVE
4
Figure 2. Infrastructure’s contribution to firms’ productivity handicap a. Overall contribution of infrastructure
b. Contribution of infrastructure by sector
Source: Escribano and others, 2009
ZAMBIA’S INFRASTRUCTURE: A CONTINENTAL PERSPECTIVE
5
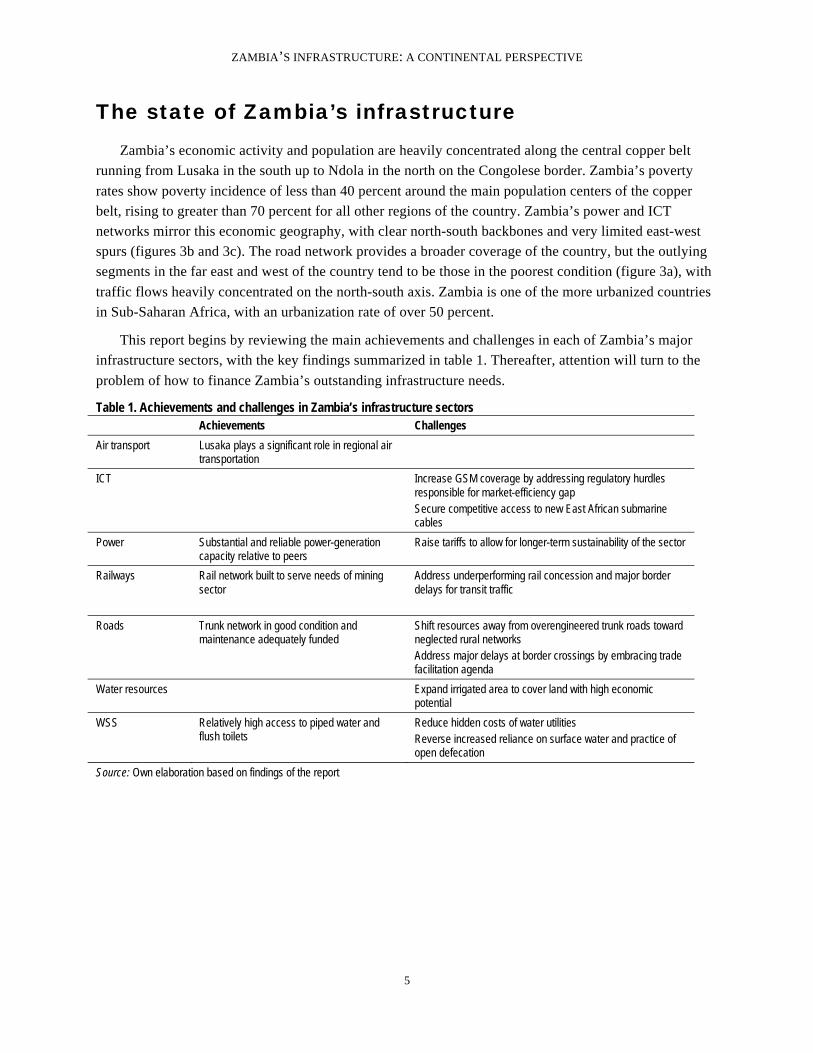
The state of Zambia’s infrastructure
Zambia’s economic activity and population are heavily concentrated along the central copper belt
running from Lusaka in the south up to Ndola in the north on the Congolese border. Zambia’s poverty
rates show poverty incidence of less than 40 percent around the main population centers of the copper
belt, rising to greater than 70 percent for all other regions of the country. Zambia’s power and ICT
networks mirror this economic geography, with clear north-south backbones and very limited east-west
spurs (figures 3b and 3c). The road network provides a broader coverage of the country, but the outlying
segments in the far east and west of the country tend to be those in the poorest condition (figure 3a), with
traffic flows heavily concentrated on the north-south axis. Zambia is one of the more urbanized countries
in Sub-Saharan Africa, with an urbanization rate of over 50 percent.
This report begins by reviewing the main achievements and challenges in each of Zambia’s major
infrastructure sectors, with the key findings summarized in table 1. Thereafter, attention will turn to the
problem of how to finance Zambia’s outstanding infrastructure needs.
Table 1. Achievements and challenges in Zambia’s infrastructure sectors Achievements Challenges
Air transport Lusaka plays a significant role in regional air transportation
ICT Increase GSM coverage by addressing regulatory hurdles responsible for market-efficiency gap Secure competitive access to new East African submarine cables
Power Substantial and reliable power-generation capacity relative to peers
Raise tariffs to allow for longer-term sustainability of the sector
Railways Rail network built to serve needs of mining sector
Address underperforming rail concession and major border delays for transit traffic
Roads Trunk network in good condition and maintenance adequately funded
Shift resources away from overengineered trunk roads toward neglected rural networks Address major delays at border crossings by embracing trade facilitation agenda
Water resources Expand irrigated area to cover land with high economic potential
WSS Relatively high access to piped water and flush toilets
Reduce hidden costs of water utilities Reverse increased reliance on surface water and practice of open defecation
Source: Own elaboration based on findings of the report

ZAMBIA’S INFRASTRUCTURE: A CONTINENTAL PERSPECTIVE
6
Figure 3. Zambia’s infrastructure networks follow natural resources a. Roads b. Power

ZAMBIA’S INFRASTRUCTURE: A CONTINENTAL PERSPECTIVE
7
c. ICT d. Irrigation
Source: AICD Interactive Infrastructure Atlas for Zambia downloadable from http://www.infrastructureafrica.org/aicd/system/files/zmb_new_ALL.pdf
ZAMBIA’S INFRASTRUCTURE: A CONTINENTAL PERSPECTIVE
8
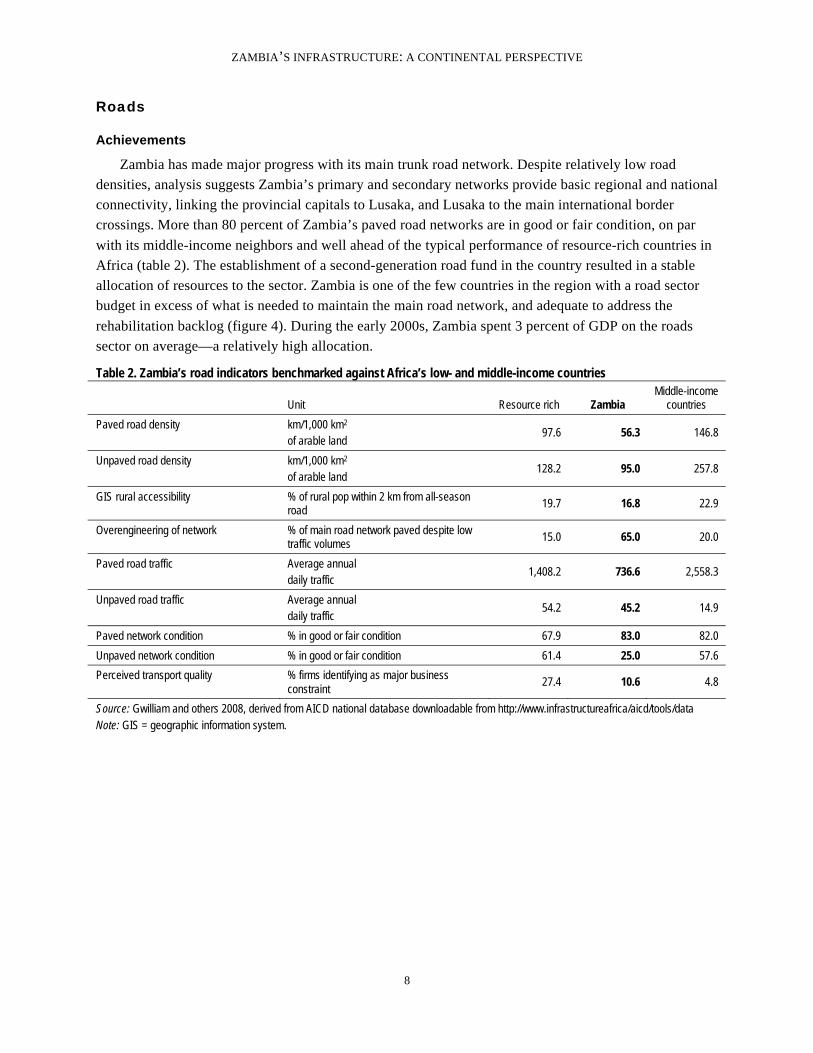
Roads
Achievements
Zambia has made major progress with its main trunk road network. Despite relatively low road
densities, analysis suggests Zambia’s primary and secondary networks provide basic regional and national
connectivity, linking the provincial capitals to Lusaka, and Lusaka to the main international border
crossings. More than 80 percent of Zambia’s paved road networks are in good or fair condition, on par
with its middle-income neighbors and well ahead of the typical performance of resource-rich countries in
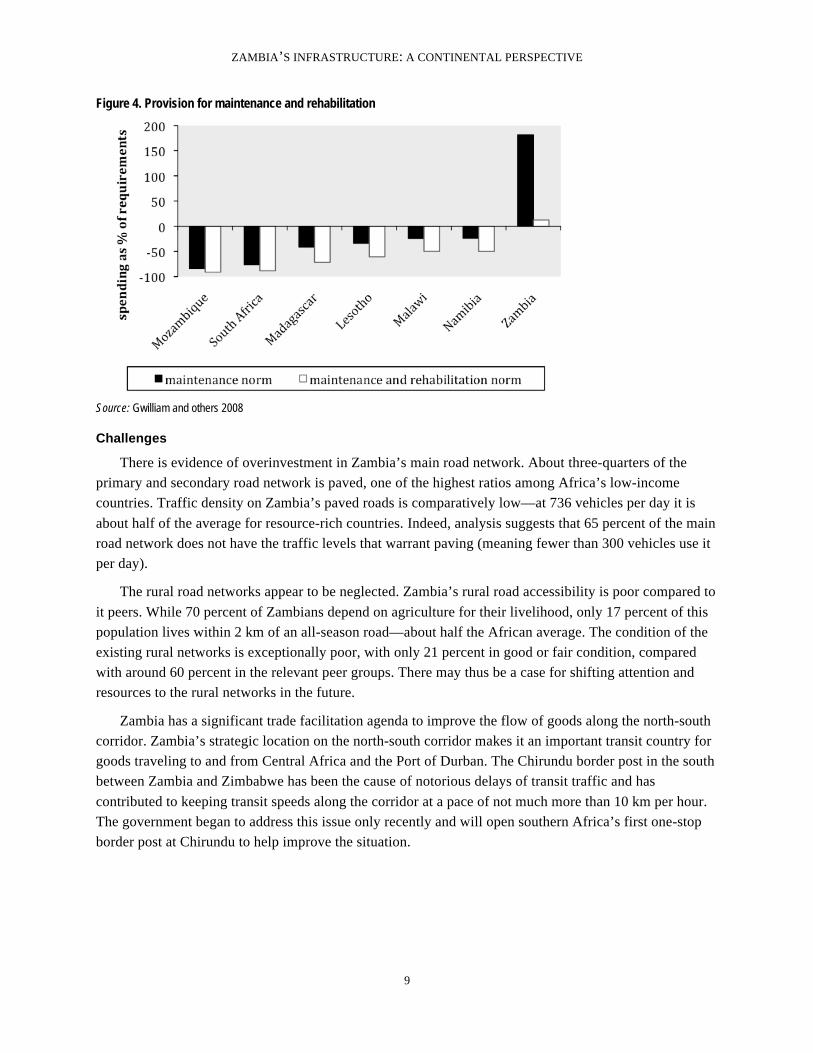
Africa (table 2). The establishment of a second-generation road fund in the country resulted in a stable
allocation of resources to the sector. Zambia is one of the few countries in the region with a road sector
budget in excess of what is needed to maintain the main road network, and adequate to address the
rehabilitation backlog (figure 4). During the early 2000s, Zambia spent 3 percent of GDP on the roads
sector on average—a relatively high allocation.
Table 2. Zambia’s road indicators benchmarked against Africa’s low- and middle-income countries
Unit Resource rich Zambia Middle-income
countries
Paved road density km/1,000 km2 of arable land
97.6 56.3 146.8
Unpaved road density km/1,000 km2 of arable land
128.2 95.0 257.8
GIS rural accessibility % of rural pop within 2 km from all-season road
19.7 16.8 22.9
Overengineering of network % of main road network paved despite low traffic volumes
15.0 65.0 20.0
Paved road traffic Average annual daily traffic
1,408.2 736.6 2,558.3
Unpaved road traffic Average annual daily traffic
54.2 45.2 14.9
Paved network condition % in good or fair condition 67.9 83.0 82.0
Unpaved network condition % in good or fair condition 61.4 25.0 57.6
Perceived transport quality % firms identifying as major business constraint
27.4 10.6 4.8
Source: Gwilliam and others 2008, derived from AICD national database downloadable from http://www.infrastructureafrica/aicd/tools/data Note: GIS = geographic information system.
ZAMBIA’S INFRASTRUCTURE: A CONTINENTAL PERSPECTIVE
9
Figure 4. Provision for maintenance and rehabilitation
Source: Gwilliam and others 2008
Challenges
There is evidence of overinvestment in Zambia’s main road network. About three-quarters of the
primary and secondary road network is paved, one of the highest ratios among Africa’s low-income
countries. Traffic density on Zambia’s paved roads is comparatively low—at 736 vehicles per day it is
about half of the average for resource-rich countries. Indeed, analysis suggests that 65 percent of the main
road network does not have the traffic levels that warrant paving (meaning fewer than 300 vehicles use it
per day).
The rural road networks appear to be neglected. Zambia’s rural road accessibility is poor compared to
it peers. While 70 percent of Zambians depend on agriculture for their livelihood, only 17 percent of this
population lives within 2 km of an all-season road—about half the African average. The condition of the
existing rural networks is exceptionally poor, with only 21 percent in good or fair condition, compared
with around 60 percent in the relevant peer groups. There may thus be a case for shifting attention and
resources to the rural networks in the future.
Zambia has a significant trade facilitation agenda to improve the flow of goods along the north-south
corridor. Zambia’s strategic location on the north-south corridor makes it an important transit country for
goods traveling to and from Central Africa and the Port of Durban. The Chirundu border post in the south
between Zambia and Zimbabwe has been the cause of notorious delays of transit traffic and has
contributed to keeping transit speeds along the corridor at a pace of not much more than 10 km per hour.
The government began to address this issue only recently and will open southern Africa’s first one-stop
border post at Chirundu to help improve the situation.

ZAMBIA’S INFRASTRUCTURE: A CONTINENTAL PERSPECTIVE
10
Rail
Achievements
Zambia’s rail sector is critical to its mineral-based economy. Rail transport continues to be the most
competitive for large bulk, time-insensitive commodities, such as Zambia’s copper production. The
country’s rail network has two operators: (i) the Railway Systems of Zambia (RSZ) serves the north-south
corridor and connects with the Zimbabwean rail operator for onward service to the Port of Durban; (ii) the
Tanzania and Zambia Railway Authority (TAZARA) operates an eastward route from the copper belt into
Tanzania and on to Dar es Salaam. The first of these is an awarded concession, while the second
continues to be operated directly by the state.
Table 3. Railway indicators for Zambia and select countries, 2000–05
CFM
(Ang
ola)
BRC
(Bot
swan
a)
CEA
R (M
alaw
i)
RSZ
(Zam
bia)
Spoo
rnet
(Sou
th A
frica
)
TAZA
RA
(Tan
zani
a-Za
mbi
a)
Tran
sNam
ib (
Nam
ibia
)
NR
Z (Z
imba
bwe)
Concessioned (1)/ state run (0) 0 0 1 1 0 0 0 0
Traffic density, freight, 1,000 tonne-km/km 469.0 827.0 90.1 406.1 2,426.9 461.3 475.3 901.8
Passenger density, 1,000 passenger-kms/km 38.0 91.9 60.3 147.0 32.7 165.6
Efficiency
Labor productivity (1,000 traffic units per employee) 121.0 722.1 502.0 3,308.1
Carriage productivity (1,000 passenger-km per carriage) 1,176.5 3,285.7
Locomotive productivity (million traffic units per locomotive) 25.1
Wagon productivity (1,000 net tonne-km per wagon) 376.5
Tariffs
Average unit tariff (UT), freight, U.S. cents/tonne-km 3.0 5.8 3.9
Average UT, passenger, U.S. cents/passenger-km 1.0 1.0 0.8
Source: Bullock 2009, derived from AICD railways database downloadable at http://www.infrastructureafrica.org/aicd/tools/data Empty cells denote that data not available.
Challenges
Zambian railways’ low traffic densities are well below the viability threshold of at least 2 million tons
per kilometer for railways of this kind, making it difficult to capture the revenues needed to maintain
assets. Also, performance for the RSZ is mixed, while TAZARA performance data is largely unavailable
(table 3).

ZAMBIA’S INFRASTRUCTURE: A CONTINENTAL PERSPECTIVE
11
Low traffic volumes complicate the financial viability of any concession arrangement. In the case of
the RSZ, the lack of a clear regulatory framework or administrative capacity to supervise the contract has
made it difficult for the government to provide clear oversight. For example, the RSZ practices
discriminatory pricing against transit traffic from the Democratic Republic of Congo (DRC) to Dar es
Salaam, charging $2.00 per tonne-km versus the normal tariff of around $0.05 per tonne-km. These tariffs
reflect an abuse of monopoly power aimed at diverting trade flows from the DRC away from Dar es
Salaam and toward Durban, with the same concessionaire operating the Zambian rail network and the
Beit Bridge border crossing from Zimbabwe into South Africa. The high level of these tariffs has a
distortionary effect on traffic flows and investment decisions along the entire corridor. For example,
copper exports from the DRC are currently going by road in order to avoid these charges, even though
they are more suited to rail transportation. Resolving this situation is not simple, and would probably
require a major renegotiation of the rail concession contract, combined with careful tariff regulation
thereafter.
The lack of reciprocal access rights delays rail transit through Zambia and along the entire north-
south corridor. A rail freight journey of 3,000 km from Kolwezi on the DRC border to the port of Durban
takes 38 days to complete—9 days of travel time and 29 days associated with customs clearance and
loading and interchange. Freight moves no more than 4 km per hour on average, and the aggregate costs
of delays along the corridor have been estimated at $120 million per year. The Zambian rail network
contributes to these delays. Access from one rail system to another is restricted for technical reasons or
connecting rail operators simply do not have the necessary traction capacity to service existing traffic.
Poor traffic planning causes undue delays, and operators are not incentivized to provide reliable
interconnection services. Reducing these delays requires revision of the contractual relationships and
access rights linking these railways to ensure transparency and fairness in reciprocal track access rights.
Air transport
Achievements
Zambia’s overall air traffic doubled between 2001 and 2007. By the standards of its neighbors,
Zambia is handling a relatively high volume of such traffic, at 1.46 million seats per year. Its domestic air
transport sector remains modest and is a fraction of that found in Angola, Mozambique, and Tanzania.
This may reflect the fact that the most economically significant cities are relatively close together and
well connected by road and rail.
Challenges Even as overall traffic has increased, connectivity (measured by the number of city pairs served) has
declined from 35 to 25 in recent years, typical across Africa over this period. Lusaka has relatively good
intra-African connectivity compared to many other capitals in the region. But the aging aircraft fleet in
Zambia presents another challenge, and its renewal is slower than in neighboring countries.
The recent collapse of Zambian Airways puts the future of the domestic market in question.
Experience from neighboring Tanzania may be relevant in this respect. Following the demise of Air
Tanzania, a joint venture was set up to form the private airline Precision Air, with 51 percent ownership
by Tanzanian interests and 49 percent by Kenyan Airways. The airline has grown substantially, and
ZAMBIA’S INFRASTRUCTURE: A CONTINENTAL PERSPECTIVE
12
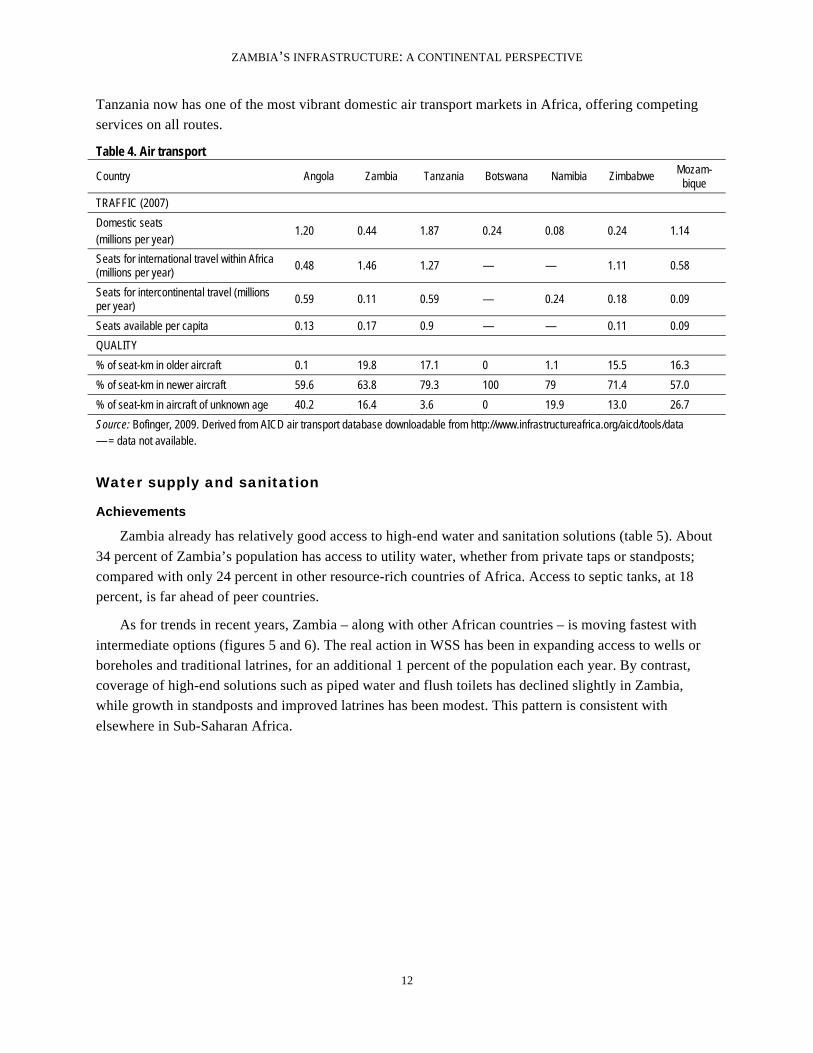
Tanzania now has one of the most vibrant domestic air transport markets in Africa, offering competing
services on all routes.
Table 4. Air transport
Country Angola Zambia Tanzania Botswana Namibia Zimbabwe Mozam-
bique
TRAFFIC (2007)
Domestic seats (millions per year)
1.20 0.44 1.87 0.24 0.08 0.24 1.14
Seats for international travel within Africa (millions per year)
0.48 1.46 1.27 — — 1.11 0.58
Seats for intercontinental travel (millions per year)
0.59 0.11 0.59 — 0.24 0.18 0.09
Seats available per capita 0.13 0.17 0.9 — — 0.11 0.09
QUALITY
% of seat-km in older aircraft 0.1 19.8 17.1 0 1.1 15.5 16.3
% of seat-km in newer aircraft 59.6 63.8 79.3 100 79 71.4 57.0
% of seat-km in aircraft of unknown age 40.2 16.4 3.6 0 19.9 13.0 26.7
Source: Bofinger, 2009. Derived from AICD air transport database downloadable from http://www.infrastructureafrica.org/aicd/tools/data — = data not available.
Water supply and sanitation
Achievements Zambia already has relatively good access to high-end water and sanitation solutions (table 5). About
34 percent of Zambia’s population has access to utility water, whether from private taps or standposts;
compared with only 24 percent in other resource-rich countries of Africa. Access to septic tanks, at 18
percent, is far ahead of peer countries.
As for trends in recent years, Zambia – along with other African countries – is moving fastest with
intermediate options (figures 5 and 6). The real action in WSS has been in expanding access to wells or
boreholes and traditional latrines, for an additional 1 percent of the population each year. By contrast,
coverage of high-end solutions such as piped water and flush toilets has declined slightly in Zambia,
while growth in standposts and improved latrines has been modest. This pattern is consistent with
elsewhere in Sub-Saharan Africa.

ZAMBIA’S INFRASTRUCTURE: A CONTINENTAL PERSPECTIVE
13
Table 5. Benchmarking water and sanitation indicators
Unit Resource
rich Zambia Middle-income
countries
Access to piped water % pop 12.0 18.3 52.1
Access to standposts % pop 12.6 15.6 18.9
Access to wells/boreholes % pop 49.0 46.9 6.0
Access to surface water % pop 23.7 19.0 13.0
Access to septic tanks % pop 1.6 18.1 40.8
Access to improved latrines % pop 6.4 1.6 1.4
Access to traditional latrines % pop 54.8 53.1 30.4
Open defecation % pop 27.6 27.0 14.3
Domestic water consumption liter/capita/day 90.3 80.7 187.6
Urban water assets in need of rehabilitation % 42.0 42.0 25.0
Revenue collection % sales 69.7 68* 100
Distribution losses % production 43.6 44.9 27.4
Cost recovery % total costs 55.6 65.4 80.6
Total hidden costs as % of revenue % 270.4 236.4 855.2
US cents per m3 Zambia Scarce water resources Other developing regions
Residential tariff 48 60
Nonresidential tariff 59 120 3.0–60.0
Source: Banerjee and others 2008. Derived from AICD water and sanitation utilities database downloadable from http://www.infrastructureafrica.org/aicd/tools/data Note: *Average of three largest utilities.
Challenges
The share of the population without access to safe solutions is increasing over time (figures 5 and 6).
Despite doing well at the high end of the coverage spectrum, Zambia does not fare much better than its
peers when it comes to the percentage of the population relying on surface water or practicing open
defecation. A full 19 percent of Zambia’s population continues to rely on surface water and as much as 27
percent of the population continues to practice open defecation. Moreover, trends in household access to
WSS services from successive household surveys show that the share of the population living in these
insanitary conditions continues to increase. An additional 0.8 percent of the population each year relies on
surface water and an additional 0.4 percent of the population practices open defecation. The high health
risk associated with these practices makes this a very troubling finding.
Zambia’s water utilities have relatively high levels of hidden costs due to inefficiencies (figure 7).
First, utilities recover only about two-thirds of the total cost of service provision (when full capital costs
are taken into account). Second, utilities are collecting only about 70 percent of the revenues owed by
their customers. Third, about 45 percent of water produced is lost in distribution due to technical and
nontechnical factors. This poor performance is not atypical of water utilities in other resource-rich
countries in Africa, even if it lags far behind the performance of middle-income countries in the region.

ZAMBIA’S INFRASTRUCTURE: A CONTINENTAL PERSPECTIVE
14
The financial value of all these losses, expressed as a percentage of utility revenues, indicates that losses
are more than twice as high as current sector revenues (236 percent of revenues).
Figure 5. Growing reliance on surface water
Source: Banerjee and others 2008.

ZAMBIA’S INFRASTRUCTURE: A CONTINENTAL PERSPECTIVE
15
Figure 6. Progress in traditional latrines, but an increase in open defecation
Source: Morella and others, 2008 Figure 7. Hidden costs of water utilities
Source: Banerjee and others, 2008

ZAMBIA’S INFRASTRUCTURE: A CONTINENTAL PERSPECTIVE
16
Power
Achievements Zambia is endowed with a relatively large amount of cost-effective hydropower. In terms of
electricity supply, Zambia enjoys a much more favorable position than many of its neighbors (table 6).
Due to the demands of its large-scale mining sector, Zambia has a relatively large generation capacity and
power consumption per capita, several times higher than that of other resource-rich countries in Africa.
Abundant hydro resources allow Zambia to produce electricity at around $0.08 per kilowatt-hour (kWh),
about half the average cost of electricity production in Africa.
The national utility Zambian Electricity Supply Company Ltd. (ZESCO) also performs relatively well
in terms of operational efficiency. In the two key indicators of operational performance, revenue
collection and distribution losses, ZESCO performs well relative to the resource-rich peer group and near
the level of the middle-income peer group (table 6).
Table 6. Benchmarking power indicators
Unit Resource
rich Zambia Middle-income
countries
Installed power-generation capacity MW/mill. people 43.2 154.9 798.6
Power consumption kWh/capita 205.7 771.0 4,479.3
Power outages Day/year 14.5 49.8 5.9
Firms’ reliance on own generator % consumption 44.9 19.5 10.9
Firms’ value lost due to power outages % sales 7.0 3.7 1.6
Access to electricity % population 46.1 20.1 59.9
Urban access to electricity % population 79.4 50.0 85.2
Rural access to electricity % population 28.0 3.5 31.8
Growth access to electricity % population/year 2.4 0.3 1.5
Revenue collection % billings 81.1 96.5 100.0
Distribution losses % production 25.8 12.0 10.1
Cost recovery % total cost 53.9 39.1 100.0
Total hidden costs as % of revenue % 168.3 93.3 0.1
U.S. cents Zambia Predominantly hydro
generation Other developing regions
Power tariff (residential at 75 kWh) 2.9 10.3 5.0–10.0
Power tariff (commercial at 900 kWh) 4.4 11.7
Power tariff (industrial at 50,000 kWh) 2.9 11.4
Source: Eberhard and others, 2008 Derived from data downloadable at AICD on-line power utilities database http://www.infrastructureafrica.org/aicd/tools/data Note: MW = megawatt.

ZAMBIA’S INFRASTRUCTURE: A CONTINENTAL PERSPECTIVE
17
Challenges
Access to electricity is only 20 percent in Zambia, less than half of what is found among the relevant
African peer groups. Power access lags behind in both urban and rural areas, but the gap for rural
electrification is particularly large—more than 3 percent in Zambia versus 30 percent in the peer groups.
Not only is access low, but it has also been stagnant over time. Only 0.5 percent of the Zambian
population is newly electrified each year, compared with 2 percent in the peer groups. While power is
relatively abundant in Zambia, much of that power is going to the mining sector, leaving relatively little
for domestic consumption.
Low power tariffs undermine the sustainability of the power sector. At $0.03–$0.04 per kWh, Zambia
has some of the lowest power tariffs in Africa (figure 8). Looking across the developing world, Zambia’s
power tariffs fall below the typical price range of $0.05–$0.10 per kWh. While Zambia’s power
production costs are low, tariffs are lower. Both historic and long-run marginal costs are close to the mark
of $0.08 per kWh (figure 9). Tariffs are capturing only about 40 percent of historic costs, and the power
sector today is living on the investments of the past without making provision for the future. South
Africa’s recent power shortages demonstrate the dangers of putting off change for too long. Underpricing
of power creates hidden costs that are as large as the overall level of revenues (figure 10). Given the
relatively low costs of power in absolute terms, it should be feasible for Zambian consumers to pay full-
cost recovery tariffs. A stronger cash flow for the ZESCO would help to finance the needed expansions in
generation capacity to keep pace with growing demand and to accelerate the pace of electrification.
Zambia’s long-term power supply options could be affected by the evolution of regional power trade
in the framework of the Southern African Power Pool (SAPP). Zambia already imports a relatively small
amount of power from neighboring DRC. Plans to further develop the Inga hydropower site in the DRC
could lead to a large expansion in low-cost hydropower for the DRC, available for export to countries
such as Zambia. While Zambia has attractive hydropower resources of its own, the long-run marginal cost
of hydropower generation in the DRC, at around $0.014 per kWh, is about half the equivalent cost in
Zambia. In the medium term, therefore, Zambia will face a strategic choice between developing more
domestic hydropower resources versus strengthening its cross-border interconnectors with the DRC.
Adopting a regional approach could save Zambia $160 million a year in power-supply costs in the long
term.

ZAMBIA’S INFRASTRUCTURE: A CONTINENTAL PERSPECTIVE
18
Figure 8. Comparison of electricity tariffs across Africa
Source: Eberhard and others, 2008.
Figure 9. Comparison of Zambia’s power tariffs against various cost benchmarks
Source: Eberhard and others, 2008; Rosnes and Vennemo, 2008

ZAMBIA’S INFRASTRUCTURE: A CONTINENTAL PERSPECTIVE
19
Figure 10. Hidden costs of power utilities
Source: Eberhard and others, 2008
Water resources1
Achievements By African standards Zambia is relatively well endowed with water and water storage. The renewable
water resource per capita is estimated at about 8,700 m3 per year, well above the Sub-Saharan African
average of 7,000 m3 per year. Zambia already has extensive water storage capacity amounting to 9,600 m3
per hectare, compared with an average for Sub-Saharan Africa of only 800 m3 per capita.
Challenges Nevertheless, the country’s water resources are largely underdeveloped. Available freshwater
supplies are 60 times larger than the current levels of withdrawal for economic consumption. Only 27
percent of the country’s 6,000 MW of hydropower potential have been tapped. Only 155,000 hectares (3
percent) of agricultural land are irrigated, and access to safe water remains low.
Zambia’s current irrigated area could be increased substantially with good economic returns.
Simulations suggest that with a threshold internal rate of return (IRR) of 6 percent it would already be
economically viable to develop a further 110,000 hectares of land for irrigation. If the threshold IRR is
raised to 12 percent the economically viable area for irrigation shrinks to 23,000 hectares. The area with
irrigation potential is concentrated in the copper belt area and on the shores of Lake Kariba in the
southwest of the country (figure 11).
A high degree of spatial and intertemporal variability of water resources creates local scarcity. The
uneven distribution of water resources across the country, high climatic variability leading to frequent
floods and droughts, and degradation of water quality from mining discharges on the strategic Kafue
catchment, result in localized issues of scarcity. From 1997 to 2007, floods and droughts are estimated to
1 This section draws heavily on the recently completed World Bank report: Managing Water for Sustainable Growth and Poverty Reduction—A Country Water Resources Assistance Strategy for Zambia.

ZAMBIA’S INFRASTRUCTURE: A CONTINENTAL PERSPECTIVE
20
have cost Zambia a total of $13.8 billion in damages and lost outputs, a 0.4 percent loss of growth
annually. Rainfall variability lowers agricultural growth by 1 percentage point, and regularly leads to crop
failures and food shortages. Water scarcity also has serious consequences for Zambia’s unique
environmental resources, on which the country’s significant tourist sector depend.
Given the wide range of conflicting uses (hydropower, water supply, irrigation, environment), it is
essential to have a clearly defined basis for allocating water rights among sectors to maximize their
development impact. To move ahead with important investments in water storage, Zambia needs to make
further progress in integrated river-basin planning and investment. Beyond large-scale storage
investments, the development of small-scale storage (as noted above) would do much to alleviate rural
poverty and enhance the resilience of rural livelihoods.
Figure 11. Economic potential for irrigation in the Zambia
Source You and others 2009
Information and communication technology
Challenges Zambia’s GSM coverage is comparatively low by regional standards and well below what the market
can deliver. Only 53 percent of Zambia’s population lives within range of a GSM signal, compared with
67 percent among Africa’s resource-rich states and 85 percent of the middle-income countries. Not only is
the percentage low, but the architecture of the network (recall figure 2c) is very tightly clustered along the
main economic arteries and almost nonexistent elsewhere. Simulations suggest more than 95 percent of

ZAMBIA’S INFRASTRUCTURE: A CONTINENTAL PERSPECTIVE
21
Zambia’s population could be reached by a GSM signal on a commercially viable basis if measures were
taken to dismantle regulatory barriers and promote competition to increase the market (figure 12).
The state-owned telecommunications incumbent, Zambia Telecommunications Company Ltd.
(ZAMTEL), is characterized by inefficiency and an inability to compete with private mobile operators.
The operator has become increasingly dependent on state financial support. The ZAMTEL monopoly is
responsible for the exceptionally high prices of international voice communication that are observed in
Zambia. In response, the government initiated a privatization process that aims to introduce private
investment and management practices into the fixed-line sector.
Table 7. Benchmarking ICT indicators Unit Resource rich Zambia Middle-income
countries
GSM coverage % population 66.9 53.0 85.1
International bandwidth Mbps/capita 4.0 4.4 104.0
Internet Subscribers/100 people 0.1 0.2 3.0
Landline Subscribers/100 people 19.3 8.5 34.8
Mobile phone Subscribers/100 people 11.4 20.9 30.0
Labor productivity Subscribers/employee 405.1 505.8 756.8
Quality of service Faults/100 main lines 82.4 90.8 50.8
Zambia Without submarine cable Other developing
regions
Price of monthly mobile basket 14.6 11.12 9.9
Price of monthly fixed-line basket 8.9 13.58 —
Price of 20-hour Internet package 81.5 67.95 11.0
Price of a 3-minute call to the United States 5.5 2.59 2.0
Price of intra-Africa calls, mean 1.2 0.72 n.a.
Source: Minges and others, 2009 Note: — = data not available; n.a. = not applicable.

ZAMBIA’S INFRASTRUCTURE: A CONTINENTAL PERSPECTIVE
22
Figure 12. Potential for commercially viable expansion of GSM coverage
Source: Mayer and others 2009
Connecting to new East African submarine cables could slash international communication costs with
competitive access. As with other African countries that lack access to submarine cables, Zambia faces
even higher costs for Internet and international telecommunications than elsewhere. With the planned
submarine cables along the east coast of Africa, and the extension of backbone connectivity inland for
landlocked countries, there is the prospect of a 50 percent reduction in these charges based on experience
elsewhere (table 8). These reductions will occur if there is competition on the international gateway to the
submarine infrastructure, otherwise they will feed higher monopoly profits.

ZAMBIA’S INFRASTRUCTURE: A CONTINENTAL PERSPECTIVE
23
Table 8. High international call charges driven both by technology and market power
US$ Percent cases
Call within Sub-Saharan Africa
Call to the United States Internet dial-up
Internet ADSL
Without submarine cable 67 1.34 0.86 68 283
With submarine cable 33 0.57 0.48 47 111
• Monopoly on international gateway 16 0.70 0.72 37 120
• Competitive international gateway 16 0.48 0.23 37 98
Source: Minges and others, 2009
Financing Zambia’s infrastructure
Zambia needs to implement an ambitious infrastructure investment agenda over the next decade. In
order to meet its most pressing infrastructure needs and catch up with developing countries in other parts
of the world, Zambia needs to expand its infrastructure assets in a number of key areas. The targets
outlined in table 9 are purely illustrative in nature, but they represent reasonable aspirations. Developed in
a way that is standardized across African countries, they allow for cross-country comparisons of the
affordability of meeting the targets, which can be modified or delayed as needed to achieve financial
balance.
Table 9. Illustrative investment targets for infrastructure in Zambia Economic target Social target
ICT Fiber-optic links to neighboring capitals and submarine cable Universal access to GSM signal and public broadband facilities
Irrigation Develop 23,000 hectares that are economically viable for irrigation
n.a.
Power Refurbish 1,700 MW of generation and develop 1,700 MW of new generation
Raise electrification to 24% (50% urban and 15% rural)
Transport Achieve regional (national) connectivity with good quality 2-lane (1-lane) paved road
Provide rural road access to 80% highest value agricultural land, and urban road access within 500 meters
WSS Achieve MDGs
Source: Derived from Foster and Briceño-Garmendia 2009 n.a. = not applicable.
Meeting these illustrative infrastructure targets for Zambia would cost $1.6 billion per year over the
next decade. Capital expenditure would account for 70 percent of this requirement. The country’s power
needs represent the single largest item and are estimated to be $0.6 billion per year to refurbish 1,700 MW
of generation capacity and develop a further 1,700 MW of new capacity. The second-largest item is the
expenditure of $0.5 billion a year for the WSS sector, needed to meet the MDGs. Both transport and ICT
spending needs are somewhat lower (table 10).

ZAMBIA’S INFRASTRUCTURE: A CONTINENTAL PERSPECTIVE
24
Table 10. Indicative infrastructure spending needs in Zambia, 2006–15 $ million per year
Sector
CAPEX O&M Total needs
ICT 132 86 218
Power (trade stagnation) 532 99 631
Transport (basic) 145 144 289
WSS 317 154 471
Irrigation 5 0 5
Total 1,131 483 1,614
Source: Briceño-Garmendia, Smits, and Foster 2008. Note: Figures refer to investment except public sector that also includes recurrent spending. Public sector covers general government and nonfinancial enterprises. O&M = operations and maintenance; CAPEX = capital expenditure.
This total spending requirement would absorb 19.2 percent of Zambia’s GDP for a decade, with about
13.2 percent going to investment and 6.6 percent to operations and maintenance (O&M, figure 13). This
would be a substantial burden for the economy, but is within the scope of what other countries around the
world have spent on infrastructure during periods of intensive development. As a point of reference,
China dedicated 15 percent of its GDP just to infrastructure investment during the mid-2000s. So while
spending at these levels would certainly be very challenging, it is not entirely inconceivable.
Figure 13. The burden of infrastructure needs
Source: Briceño-Garmendia, Smits, and Foster 2008.

ZAMBIA’S INFRASTRUCTURE: A CONTINENTAL PERSPECTIVE
25
Zambia already spends a sizeable $0.7 billion per year to meet infrastructure needs (table 11). (Due to
the nonavailability of financial statements from the ZAMTEL, the state-owned telecommunications
incumbent, these figures represent a lower limit for the level of infrastructure spending in the country.)
About 65 percent of the recorded total is allocated toward capital expenditure and 35 percent toward
operating expenditures. Two-thirds of total spending is domestically financed, coming from the pockets
of Zambian taxpayers and users of utility services. Focusing on infrastructure investment alone, about
half is funded by the public budget and the remaining half by a range of external financiers—primarily
private investors and official development assistance (ODA) partners. Zambia receives relatively little
infrastructure investment from countries outside the Organisation for Economic Co-operation and
Development (OECD). Private finance goes almost entirely to the ICT sector, while ODA is evenly split
between the transport and WSS sectors.
Table 11. Existing financing flows for infrastructure, average, 2001–06 $m per year
O&M Capital expenditure
Sector
Public sector Public sector ODA Non-OECD financiers PPI Total CAPEX
Total spending
ICT n.a. n.a. 1 0 89 90 >90
Power 99 70 2 8 0 81 180
Transport 99 85 52 6 3 145 245
WSS 35 67 47 1 9 123 158
Total 233 224 99 15 101 439 >673
Source: Briceño-Garmendia, Smits, and Foster 2008. Note: Due to nonavailability of ZAMTEL financial statements the data represent a lower bound on total spending. PPI = private participation in infrastructure; OECD = Organisation for Economic Co-operation and Development; n.a. = not applicable.

ZAMBIA’S INFRASTRUCTURE: A CONTINENTAL PERSPECTIVE
26
Figure 14. Burden of infrastructure spending
Source: Briceño-Garmendia, Smits, and Foster 2008.
In terms of GDP, Zambia’s existing infrastructure spending is typical of other resource-rich countries
in Africa. During the early 2000s, Zambia was spending an average of around 6 percent of GDP on
infrastructure (figure 14). This is close to the average for resource-rich countries, but well below the
average of 10 percent for low-income countries in Africa. Thus, relative to African peers, Zambia’s
existing spending on infrastructure does not look that high.
How much more can be done within the existing resource envelope?
There is evidence that some $315 million of additional resources each year could be recovered by
improving efficiency (table 12). The three largest potential sources of efficiency gains are improving cost-
recovery (particularly in the power sector), improving capital budget execution (particularly in the
transport sector), and improving various aspects of operational efficiency (particularly in the water
sector).
ZAMBIA’S INFRASTRUCTURE: A CONTINENTAL PERSPECTIVE
27
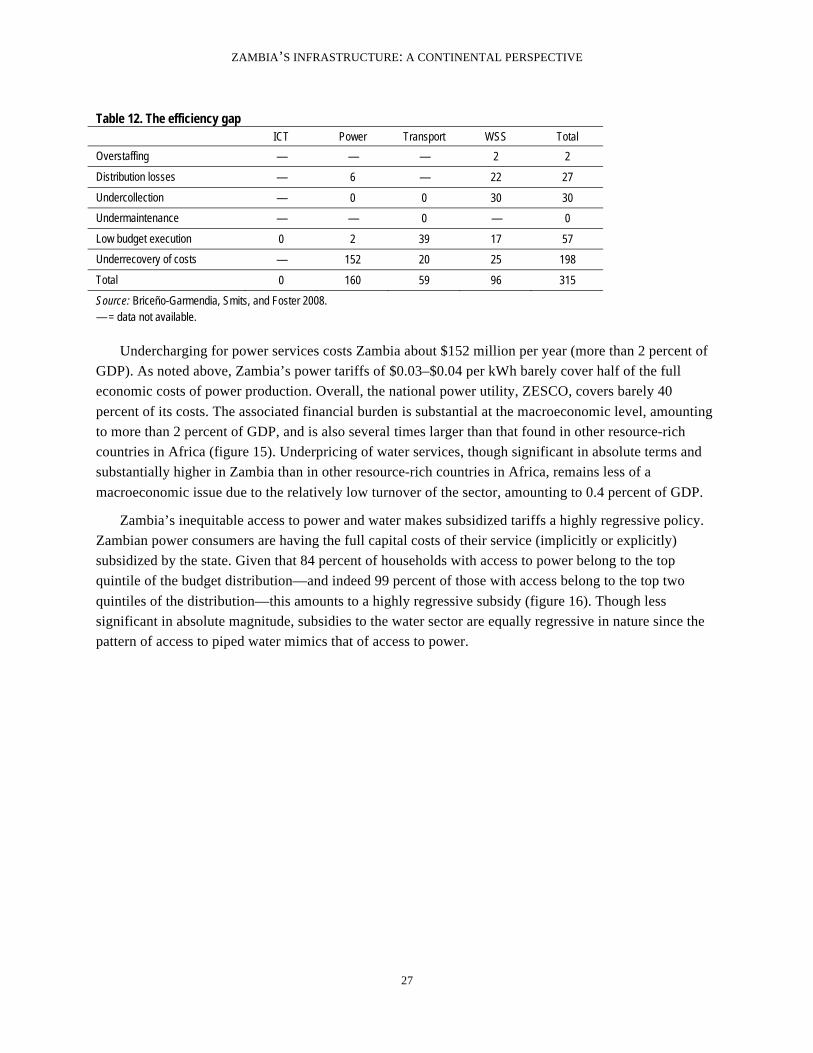
Table 12. The efficiency gap
ICT Power Transport WSS Total
Overstaffing — — — 2 2
Distribution losses — 6 — 22 27
Undercollection — 0 0 30 30
Undermaintenance — — 0 — 0
Low budget execution 0 2 39 17 57
Underrecovery of costs — 152 20 25 198
Total 0 160 59 96 315
Source: Briceño-Garmendia, Smits, and Foster 2008. — = data not available.
Undercharging for power services costs Zambia about $152 million per year (more than 2 percent of
GDP). As noted above, Zambia’s power tariffs of $0.03–$0.04 per kWh barely cover half of the full
economic costs of power production. Overall, the national power utility, ZESCO, covers barely 40
percent of its costs. The associated financial burden is substantial at the macroeconomic level, amounting
to more than 2 percent of GDP, and is also several times larger than that found in other resource-rich
countries in Africa (figure 15). Underpricing of water services, though significant in absolute terms and
substantially higher in Zambia than in other resource-rich countries in Africa, remains less of a
macroeconomic issue due to the relatively low turnover of the sector, amounting to 0.4 percent of GDP.
Zambia’s inequitable access to power and water makes subsidized tariffs a highly regressive policy. Zambian power consumers are having the full capital costs of their service (implicitly or explicitly)
subsidized by the state. Given that 84 percent of households with access to power belong to the top
quintile of the budget distribution—and indeed 99 percent of those with access belong to the top two
quintiles of the distribution—this amounts to a highly regressive subsidy (figure 16). Though less
significant in absolute magnitude, subsidies to the water sector are equally regressive in nature since the
pattern of access to piped water mimics that of access to power.

ZAMBIA’S INFRASTRUCTURE: A CONTINENTAL PERSPECTIVE
28
Figure 15. Underpricing in the power and water sectors
Source: Briceño-Garmendia, Smits, and Foster 2008. Figure 16. Infrastructure and income a. Water supply
b. Power

ZAMBIA’S INFRASTRUCTURE: A CONTINENTAL PERSPECTIVE
29
Source: Banerjee and others, 2008.
Interestingly enough, in Zambia those with access to electricity and power (and many of those
without access) do not face major affordability problems. To evaluate the social feasibility of raising
power tariffs to cost-recovery levels, an affordability threshold of 5 percent of the household budget is
used. On this basis, and using data on the magnitude of family budgets, figure 17 illustrates the
percentage of Zambian households able to afford monthly utility bills at various levels. Thus, a monthly
utility bill of $2 would be affordable for essentially all Zambians, whereas a monthly utility bill of $12
would be affordable for only the richest 20 percent of Zambia’s households.
Purchasing a subsistence consumption bundle at cost-recovery prices would be affordable for the vast
majority of Zambian households. Taking a cost-recovery tariff of $0.08 per kWh for power and a
subsistence consumption of 50 kWh per month—which is enough to power four 100-watt light bulbs for
four hours per day—the monthly power bill would amount to $4.00, which would be affordable for
almost 100 percent of the Zambian population (figure 17). Even taking a more generous consumption
allowance of 75–100 kWh per month, a monthly bill based on a cost-recovery tariff would still amount to
around $7.00, which would be affordable for 70 percent of the population. Given that, as of today, only
the more affluent 20 percent of the Zambian population have access to electricity, it is clear from the
analysis that cost-recovery tariffs would be perfectly affordable for this segment of the population.
Moreover, even if electrification rates were rapidly expanded to reach the middle tranches of income
distribution, power would remain affordable. Thanks to Zambia’s relatively low-cost energy resources,
and a population that is relatively well-off by the standards of low-income countries in Africa, power
tariffs are likely to remain affordable.

ZAMBIA’S INFRASTRUCTURE: A CONTINENTAL PERSPECTIVE
30
Figure 17. Those with access (and many of those without access) do not face major affordability problems
Source: Banerjee and others, 2008.
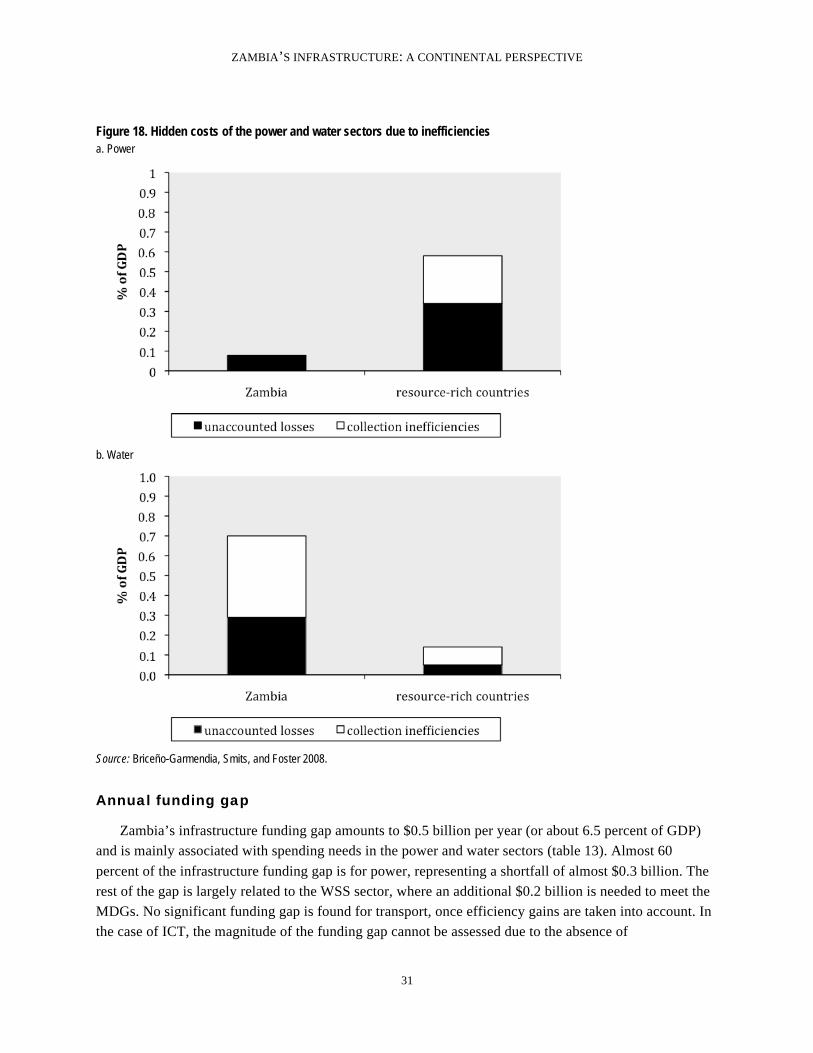
Distribution losses and low collection rates of water utilities are costing the country $52 million a
year. While Zambia’s power utilities are relatively efficient by the standards of its peers, Zambia’s water
utilities are relatively inefficient when judged by the same standard (figure 18). Whereas water utilities in
other resource-rich African countries typically face operational inefficiencies that amount to 0.14 percent
of GDP, the operational inefficiencies of Zambian water utilities are wasting 0.7 percent of GDP. Just
under half of this waste derives from unaccounted water, and just over half from undercollection of
revenues.
ZAMBIA’S INFRASTRUCTURE: A CONTINENTAL PERSPECTIVE
31
Figure 18. Hidden costs of the power and water sectors due to inefficiencies a. Power
b. Water
Source: Briceño-Garmendia, Smits, and Foster 2008.
Annual funding gap
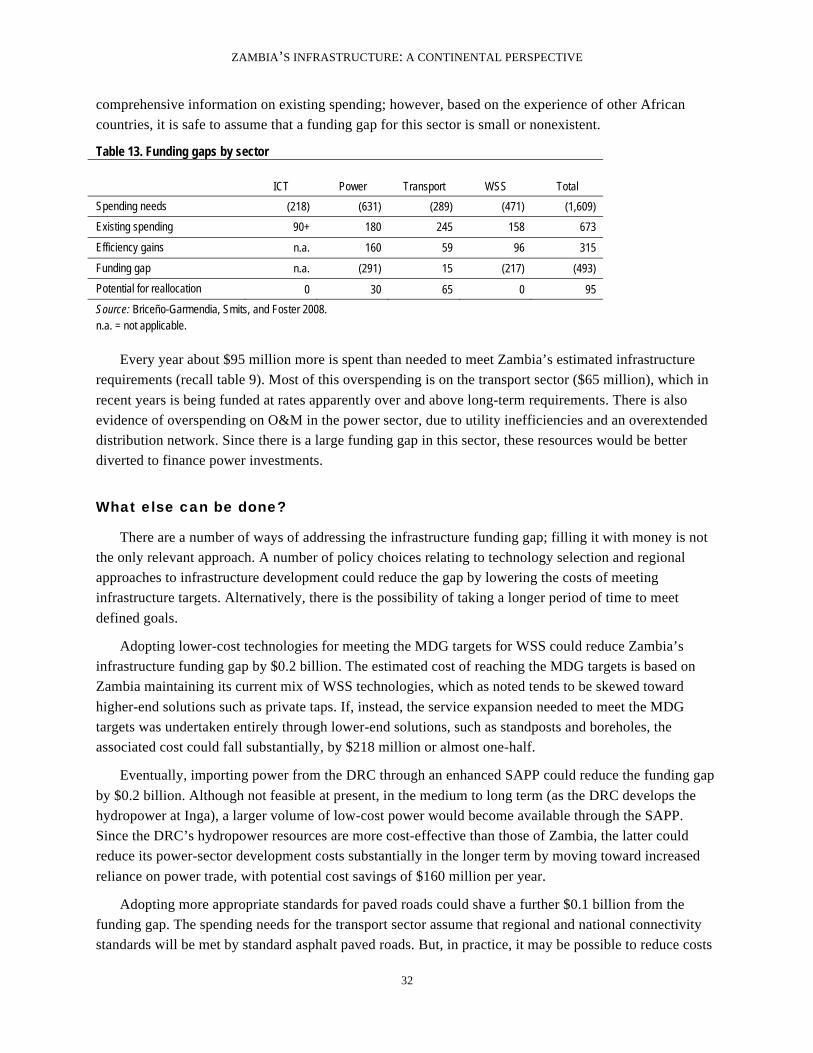
Zambia’s infrastructure funding gap amounts to $0.5 billion per year (or about 6.5 percent of GDP)
and is mainly associated with spending needs in the power and water sectors (table 13). Almost 60
percent of the infrastructure funding gap is for power, representing a shortfall of almost $0.3 billion. The
rest of the gap is largely related to the WSS sector, where an additional $0.2 billion is needed to meet the
MDGs. No significant funding gap is found for transport, once efficiency gains are taken into account. In
the case of ICT, the magnitude of the funding gap cannot be assessed due to the absence of
ZAMBIA’S INFRASTRUCTURE: A CONTINENTAL PERSPECTIVE
32
comprehensive information on existing spending; however, based on the experience of other African
countries, it is safe to assume that a funding gap for this sector is small or nonexistent.
Table 13. Funding gaps by sector
ICT Power Transport WSS Total
Spending needs (218) (631) (289) (471) (1,609)
Existing spending 90+ 180 245 158 673
Efficiency gains n.a. 160 59 96 315
Funding gap n.a. (291) 15 (217) (493)
Potential for reallocation 0 30 65 0 95
Source: Briceño-Garmendia, Smits, and Foster 2008. n.a. = not applicable.
Every year about $95 million more is spent than needed to meet Zambia’s estimated infrastructure
requirements (recall table 9). Most of this overspending is on the transport sector ($65 million), which in
recent years is being funded at rates apparently over and above long-term requirements. There is also
evidence of overspending on O&M in the power sector, due to utility inefficiencies and an overextended
distribution network. Since there is a large funding gap in this sector, these resources would be better
diverted to finance power investments.
What else can be done?
There are a number of ways of addressing the infrastructure funding gap; filling it with money is not
the only relevant approach. A number of policy choices relating to technology selection and regional
approaches to infrastructure development could reduce the gap by lowering the costs of meeting
infrastructure targets. Alternatively, there is the possibility of taking a longer period of time to meet
defined goals.
Adopting lower-cost technologies for meeting the MDG targets for WSS could reduce Zambia’s
infrastructure funding gap by $0.2 billion. The estimated cost of reaching the MDG targets is based on
Zambia maintaining its current mix of WSS technologies, which as noted tends to be skewed toward
higher-end solutions such as private taps. If, instead, the service expansion needed to meet the MDG
targets was undertaken entirely through lower-end solutions, such as standposts and boreholes, the
associated cost could fall substantially, by $218 million or almost one-half.
Eventually, importing power from the DRC through an enhanced SAPP could reduce the funding gap
by $0.2 billion. Although not feasible at present, in the medium to long term (as the DRC develops the
hydropower at Inga), a larger volume of low-cost power would become available through the SAPP.
Since the DRC’s hydropower resources are more cost-effective than those of Zambia, the latter could
reduce its power-sector development costs substantially in the longer term by moving toward increased
reliance on power trade, with potential cost savings of $160 million per year.
Adopting more appropriate standards for paved roads could shave a further $0.1 billion from the
funding gap. The spending needs for the transport sector assume that regional and national connectivity
standards will be met by standard asphalt paved roads. But, in practice, it may be possible to reduce costs

ZAMBIA’S INFRASTRUCTURE: A CONTINENTAL PERSPECTIVE
33
by adopting more appropriate paving technologies. For example, use of single-surface treatment instead
of asphalt surfacing would reduce road sector development costs by $60 million per year.
If it were possible to adopt all of the above policy measures at once, Zambia’s infrastructure funding
gap would all but disappear. The combined value of these cost-saving policy measures is $453 million,
which is very close to the funding gap of $493 million. While it may not necessarily be possible to reap
all of these cost savings in the medium term, this calculation serves to illustrate the power of strategic
policy choices in ensuring the feasibility of meeting the country’s infrastructure needs.
Holding spending at current levels but going after efficiency gains would allow Zambia to meet
identified infrastructure targets in 15 years instead of the notional 10 years from 2006-2015 assumed for
this exercise. Assuming that Zambia had no means of raising additional infrastructure finance and was not
able to implement the cost-saving policies described above, the only way to meet the infrastructure targets
would be to take a longer period of time than the decade that was contemplated at the outset of this
exercise. If Zambia were able to redress the various inefficiencies identified above, and preserve overall
spending at current levels, the targets would take 15 years to reach, which is to say they would be
achievable by the year 2020. Without tackling inefficiencies, the country would take another 15 years, or
until 2035.
Zambia’s infrastructure situation is more hopeful than that of many other African countries. For a
start, infrastructure spending needs—though large—are not beyond the realms of possibility. Second,
Zambia’s resource wealth and relatively well-off population provide a more solid financing basis than is
available to many other countries. Third, Zambia’s funding gap—though substantial—can be dramatically
reduced through a range of policy measures aimed at stemming inefficiencies and lowering costs. In sum,
notwithstanding the numerous infrastructure challenges that Zambia faces, their resolution looks much
more tractable than in the case of many African peers.

ZAMBIA’S INFRASTRUCTURE: A CONTINENTAL PERSPECTIVE
34
Bibliography
This country report draws upon a wide range of papers, databases, models, and maps that were
created as part of the Africa Infrastructure Country Diagnostic. All of these can be downloaded from the
project website: www.infrastructureafrica.org. For papers go to the document page
(http://www.infrastructureafrica.org/aicd/documents), for databases to the data page
(http://www.infrastructureafrica.org/aicd/tools/data), for models go to the models page
(http://www.infrastructureafrica.org/aicd/tools/models) and for maps to the map page
(http://www.infrastructureafrica.org/aicd/tools/maps ). The references for the papers that were used to
compile this country report are provided in the table below.
General
Africa’s Infrastructure: A Time for Transformation (AICD Web site), http://www.infrastructureafrica.org
Foster, Vivien, and Cecilia Briceño-Garmendia, eds. 2009. Africa’s Infrastructure: A Time for
Transformation. Paris and Washington, DC: Agence Française de Développement and World
Bank.
Growth
Calderón, César. 2009. “Infrastructure and Growth in Africa,” Policy Research Working Paper 4914,
World Bank, Washington, DC.
Escribano, Alvaro, J. Luis Guasch, and Jorge Pena. 2010. “Assessing the Impact of Infrastructure Quality
on Firm Productivity in Africa.” Policy Research Working Paper 5191, World Bank, Washington,
DC.
Yepes, Tito, Justin Pierce, and Vivien Foster. 2009. “Making Sense of Africa’s Infrastructure
Endowment: A Benchmarking Approach.” Policy Research Working Paper 4912, World Bank,
Washington, DC.
Financing
Briceño-Garmendia, Cecilia, Karlis Smits, and Vivien Foster. 2009. “Financing Public Infrastructure in
Sub-Saharan Africa: Patterns and Emerging Issues.” AICD Background Paper 15, Africa Region,
World Bank, Washington, DC.
Information and communication technologies
Michael Minges, Mavis Ampah, Daniel Camos, Cecilia Briceño-Garmendia, Maria Shkratan, and Mark
Williams. 2009. “Information and Communications Technology in Sub-Saharan Africa: A Sector
Review.” AICD Background Paper 10, Africa Region, World Bank, Washington, DC.

ZAMBIA’S INFRASTRUCTURE: A CONTINENTAL PERSPECTIVE
35
Mayer, Rebecca, Ken Figueredo, Mike Jensen, Tim Kelly, Richard Green, and Alvaro Federico Barra.
2009. “Connecting the Continent: Costing the Needs for Spending on ICT Infrastructure in
Africa.” AICD Background Paper 3, Africa Region, World Bank, Washington, DC.
Irrigation
Svendsen, Mark, Mandy Ewing, and Siwa Msangi. 2008. “Watermarks: Indicators of Irrigation Sector
Performance in Africa.” AICD Background Paper 4, Africa Region, World Bank, Washington,
DC.
You, L., C. Ringler, G. Nelson, U. Wood-Sichra, R. Robertson, S. Wood, G. Zhe, T. Zhu, and Y. Sun.
2009. “Torrents and Trickles: Irrigation Spending Needs in Africa.” AICD Background Paper 9,
Africa Region, World Bank, Washington, DC.
Power
Eberhard, Anton, Vivien Foster, Cecilia Briceño-Garmendia, Fatimata Ouedraogo, Daniel Camos, and
Maria Shkaratan. 2008. “Underpowered: The State of the Power Sector in Sub-Saharan Africa.”
AICD Background Paper 6, Africa Region, World Bank, Washington, DC.
Foster, Vivien, and Jevgenijs Steinbuks. 2009. “Paying the Price for Unreliable Power Supplies: In-House
Generation of Electricity by Firms in Africa.” Policy Research Working Paper 4913, World Bank,
Washington, DC.
Rosnes, Orvika, and Haakon Vennemo. 2009. “Powering Up: Costing Power Infrastructure Spending
Needs in Sub-Saharan Africa.” AICD Background Paper 5, Africa Region, World Bank,
Washington, DC.
Transport
Bullock, Richard. 2009. “Off Track: Sub-Saharan African Railways.” AICD Background Paper 17, Africa
Region, World Bank, Washington, DC.
Carruthers, Robin, Ranga Rajan Krishnamani, and Siobhan Murray. 2009. “Improving Connectivity:
Investing in Transport Infrastructure in Sub-Saharan Africa.” AICD Background Paper 7, Africa
Region, World Bank, Washington, DC.
Gwilliam, Ken, Vivien Foster, Rodrigo Archondo-Callao, Cecilia Briceño-Garmendia, Alberto Nogales,
and Kavita Sethi. 2008. “The Burden of Maintenance: Roads in Sub-Saharan Africa.” AICD
Background Paper 14, Africa Region, World Bank, Washington, DC.
Heinrich C. Bofinger. 2009. “An Unsteady Course: Growth and Challenges in Africa’s Air Transport
Industry.” AICD Background Paper 16, Africa Region, World Bank, Washington, DC.
Kumar, Ajay, and Fanny Barrett. 2008. “Stuck in Traffic: Urban Transport in Africa.” AICD Background
Paper 1, Africa Region, World Bank, Washington, DC.

ZAMBIA’S INFRASTRUCTURE: A CONTINENTAL PERSPECTIVE
36
Ocean Shipping Consultants, Inc. 2009. “Beyond the Bottlenecks: Ports in Africa.” AICD Background
Paper 8, Africa Region, World Bank, Washington, DC.
Water resources
World Bank. 2009. Zambia Managing Water for Sustainable Growth and Poverty Reduction: A Country Water Resources Assistance Strategy for Zambia. Water Resources Management, Africa Region. August 2009.
Water supply and sanitation
Banerjee, Sudeshna, Vivien Foster, Yvonne Ying, Heather Skilling, and Quentin Wodon. “Cost
Recovery, Equity, and Efficiency in Water Tariffs: Evidence from African Utilities.” AICD
Working Paper 7, World Bank, Washington, DC.
Banerjee, Sudeshna, Heather Skilling, Vivien Foster, Cecilia Briceño-Garmendia, Elvira Morella, and
Tarik Chfadi. 2008. “Ebbing Water, Surging Deficits: Urban Water Supply in Sub-Saharan
Africa.” AICD Background Paper 12, Africa Region, World Bank, Washington, DC.
Gulyani, Sumila, Debabrata Talukdar, and Darby Jack. 2009. “Poverty, Living Conditions, and
Infrastructure Access: A Comparison of Slums in Dakar, Johannesburg, and Nairobi.” AICD
Working Paper 10, World Bank, Washington, DC.
Keener, Sarah, Manuel Luengo, and Sudeshna Banerjee. 2009. “Provision of Water to the Poor in Africa:
Experience with Water Standposts and the Informal Water Sector.” AICD Working Paper 13,
World Bank, Washington, DC.
Morella, Elvira, Vivien Foster, and Sudeshna Ghosh Banerjee. 2008. “Climbing the Ladder: The State of
Sanitation in Sub-Saharan Africa.” AICD Background Paper 13, Africa Region, World Bank,
Washington, DC.