youthful cities
DESCRIPTION
Youthful CitiesTRANSCRIPT
7/18/2019 Youthful Cities
http://slidepdf.com/reader/full/youthful-cities 1/13
7/18/2019 Youthful Cities
http://slidepdf.com/reader/full/youthful-cities 2/13
2
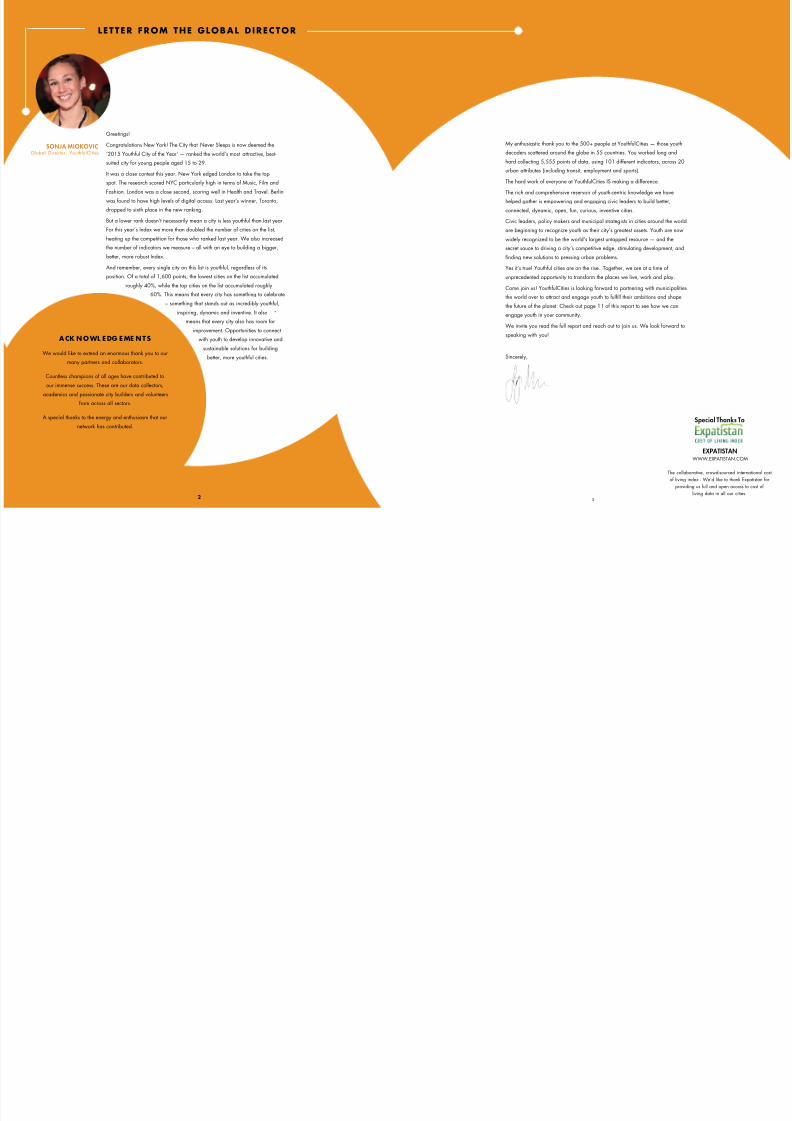
Greetings!
Congratulations New York! The City that Never Sleeps is now deemed the
‘2015 Youthful City of the Year’ — ranked the world’s most attractive, best-
suited city for young people aged 15 to 29.
It was a close contest this year. New York edged London to take the top
spot. The research scored NYC particularly high in terms of Music, Film and
Fashion. London was a close second, scoring well in Health and Travel. Berlin
was found to have high levels of digital access. Last year’s winner, Toronto,
dropped to sixth place in the new ranking.
But a lower rank doesn’t necessarily mean a city is less youthful than last year.
For this year’s Index we more than doubled the number of cities on the list,
heating up the competition for those who ranked last year. We also increased
the number of indicators we measure – all with an eye to building a bigger,
better, more robust Index.
And remember, every single city on this list is youthful, regardless of its
position. Of a total of 1,600 points, the lowest cities on the list accumulatedroughly 40%, while the top cities on the list accumulated roughly
60%. This means that every city has something to celebrate
– something that stands out as incredibly youthful,
inspiring, dynamic and inventive. It also
means that every city also has room for
improvement. Opportunities to connect
with youth to develop innovative and
sustainable solutions for building
better, more youthful cities.
My enthusiastic thank you to the 500+ people at YouthfulCities — those youth
decoders scattered around the globe in 55 countries. You worked long and
hard collecting 5,555 points of data, using 101 different indicators, across 20
urban attributes (including transit, employment and sports).
The hard work of everyone at YouthfulCities IS making a difference.
The rich and comprehensive reservoir of youth-centric knowledge we have
helped gather is empowering and engaging civic leaders to build better,
connected, dynamic, open, fun, curious, inventive cities.
Civic leaders, policy makers and municipal strategists in cities around the world
are beginning to recognize youth as their city’s greatest assets. Youth are now
widely recognized to be the world’s largest untapped resource — and the
secret sauce to driving a city’s competitive edge, stimulating development, and
finding new solutions to pressing urban problems.
Yes it’s true! Youthful cities are on the rise. Together, we are at a time of
unprecedented opportunity to transform the places we live, work and play.
Come join us! YouthfulCities is looking forward to partnering with municipalities
the world over to attract and engage youth to fulfill their ambitions and shape
the future of the planet. Check out page 11 of this report to see how we can
engage youth in your community.
We invite you read the full report and reach out to join us. We look forward to
speaking with you!
Sincerely,
LETTER FROM THE GLOBAL DIRECTOR
SONJA MIOKOVICGlobal Director, YouthfulCities
ACK NOWL E DG E ME NTS
We would like to extend an enormous thank you to our
many partners and collaborators.
Countless champions of all ages have contributed to
our immense success. These are our data collectors,
academics and passionate city builders and volunteers
from across all sectors.
A special thanks to the energy and enthusiasm that our
network has contributed.
2 3
Special Tha
EXPATISWWW.EXPATIS
The collaborative, crowd-sou
of living index - We’d like t
providing us full and ope
living data in all
7/18/2019 Youthful Cities
http://slidepdf.com/reader/full/youthful-cities 3/13
4 5
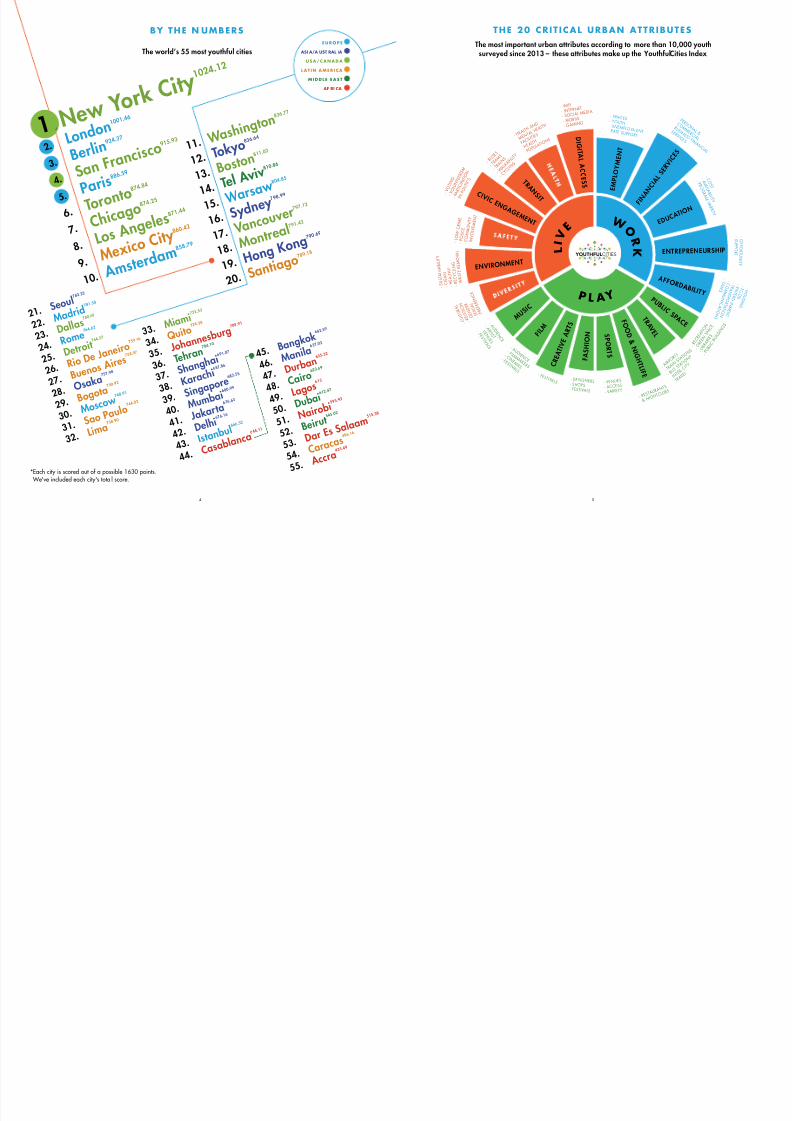
BY THE N UMBERS
The world’s 55 most youthful cities
1. N e w
Y o r k C i t y
1 0 2 4. 1 2
2. L o n d o n 1
0 0 1. 4 6
3. B e r l i n
9 2 4. 3 7
4. S a n F
r a n c i s c o
9 1 5. 9 3
5. P a r i s
8 8 6. 5 9
6. T o r o n
t o 8 7 4. 8
4
7. C h i c a
g o 8 7 4. 2
5
8. L o s A
n g e l e s 8 7
1. 4 4
9. M e x i
c o C i t y
8 6 0. 4 2
1 0. A m s t e r d
a m 8 5 8. 7
9
1 1. W a s h i n g t o
n 8 3 6. 7 7
1 2. T o k y o
8 3 6. 6 4
1 3. B o s t o
n 8 1 1. 0 2
1 4. T e l A v
i v 8 1 0. 8
6
1 5. W a r s
a w 8 0 4. 8
5
1 6. S y d n
e y 7 9 8. 9
9
1 7. V a n c o
u v e r 7 9 7. 1
2
1 8. M o n t
r e a l 7 9 1. 4
2
1 9. H o n g
K o n g 7 9 0. 6
9
2 0. S a n t i a g o
7 8 9. 1 8
2 1. S e o u
l 7 8 3. 2
2
2 2. M a d r
i d 7 8 1. 3
8
2 3. D a l l a
s 7 8 0. 6
9
2 4. R o m e
7 6 4. 6 2
2 5. D e t r o
i t 7 6 4. 5
7
2 6. R i o D
e J a n e i r o
7 5 9. 1 6
2 7. B u e n
o s A i r e s
7 5 8. 9 7
2 8. O s a k
a 7 5 7. 9
8
2 9. B o g o
t a 7 5 0. 9
2
3 0. M o s c o w
7 4 8. 9 1
3 1. S a o P a u l o
7 4 4. 0 2
3 2. L i m a
7 3 8. 9 0
3 3. M i a m
i 7 3 2. 5
3
3 4. Q u i t o
7 2 8. 3 8
3 5. J o h a n
n e s b u r g
7 0 8. 9 1
3 6. T e h r a
n 7 0 4. 1
0
3 7. S h a n
g h a i 6 9 1. 0
7
3 8. K a r a
c h i 6 8 7. 8
6
3 9. S i n g a
p o r e 6 8 2.
5 5
4 0. M u
m b a i 6 8 0. 9
9
4 1. J a k a r t a
6 7 6. 6 3
4 2. D e l h i
6 7 6. 1 6
4 3. I s t a n b
u l 6 6 6. 3
2
4 4. C a s a
b l a n c a
6 4 4. 1 1
4 5. B a n g
k o k 6 4 2. 5
9
4 6. M a n i
l a 6 3 7.
0 2
4 7. D u r b a
n 6 3 5. 3
2
4 8. C a i r o
6 2 3. 6 9
4 9. L a g o s
6 1 5
5 0. D u
b a i 6 1 2. 4
7
5 1. N a i r o b i 5 9 5. 9
2
5 2. B e i r u
t 5 4 5. 0 2
5 3. D a r E
s S a l a a m
5 1 5. 3 8
5 4. C a r a c
a s 4 8 6. 1
6
5 5. A c c r a
4 3 3. 4 9
ASI A/A UST RAL IA
US A/ C AN AD A
L AT I N AMER I C A
AF RI CA
MI D D L E EAS T
EUROP E
*Each city is scored out of a possible 1630 points. We've included each city's tota l score.
C R E A T I V
E A
R T S
P U B L I C S P A C E M U S
I C
F A S H I O N
F O O D &
N I G
H T L I F
E
T R A V E L S
P O R T S
F I L M
P L A Y
- R E C R E
A T I O
N
- G R E
E N S P A C E
- L I B R A R I E S
- P U B L I C
B U I L D
I N G S
- A I R P
O R T S
- T R A
I N S T A
T I O N S
- B U S
S T A
T I O N S
- I N T
E R - C I T Y
T R A V
E L
- R E S TA
U RA N T S
& N I G
H T C L U B
S
- V E N U ES
- A C C ESS
- VA R I E T Y
- D E SI G NE RS- SH O P S- F E ST I V ALS
- F E S T I V A L S
- A U D I E N C E
- F I L M M A K E R S
- C I N E M A S
- F E S T I V A L S
- A U D I E N
C E
- A R T I S T
- V E N
U E S
- F E S T I V A L S
W O
R K
F I N
A N
C I A L
S E R V
I C E S
E D U C
A T I O N
A F F O R D A B I L I T Y
EN TR EPR ENEUR SHIP
E M P L O Y M E N T
R T A T I O N
M M U N I C A T I O N S
- T A X E S
- C O S T
- A V A
I L A B I L I T Y
- P R O G R A
M V A
R I E T Y
- P E R S O N A L &
C O M M E R C I A L
B U S I N E S S F I N A N C I A L
S E R V I C E S
- W AG E S - Y O U T H U N E MP L O Y ME N T R AT E S U P P O R T
L
I V
E
T R A N S I T
C I V I C E N G A G E M E N T
D I G
I T A L A C C E S S
E N V I R O NM E N T
- H E A
L T H A N
D
M E N
T A L H E
A L T H
F A C I L I T I E S
- H E A
L T H
P O P U
L A T I O N
S
- B U S
E S
- T R A
M S
- T R A
I N S
- W A L K A
B I L I T Y
- C Y C
L I N G
- S U S T A
I N A B I L I T Y
- C L E A N
- H E A L T H Y
- R E C Y
C L I N G
- W A S
T E R E M O V A L
- V O T I N
G
- V O L U N T E
E R I S M
- P A
R T I C I P A T I O
N
I N P O L I T I C
S
- L O W
C R I M
E
- P O
L I C E
- C O M M U N
I T Y
I N V O L V E M
E N T
- W I F I
- I N T E R N E T
- S O C IA L M E
D IA
- M O B I L E
- GAM I N G
- C
U L T
U R A L
- R E L I G
I O N
- G E
N D E R
- S E X U A L
P R E F E R E N C E
YOUTHFULCITIESTM
THE 20 CR I T ICAL URBAN ATTR IBUTES
The most important urban attributes according to more than 10,000 youthsurveyed since 2013 – these attributes make up the YouthfulCities Index
7/18/2019 Youthful Cities
http://slidepdf.com/reader/full/youthful-cities 4/13
7
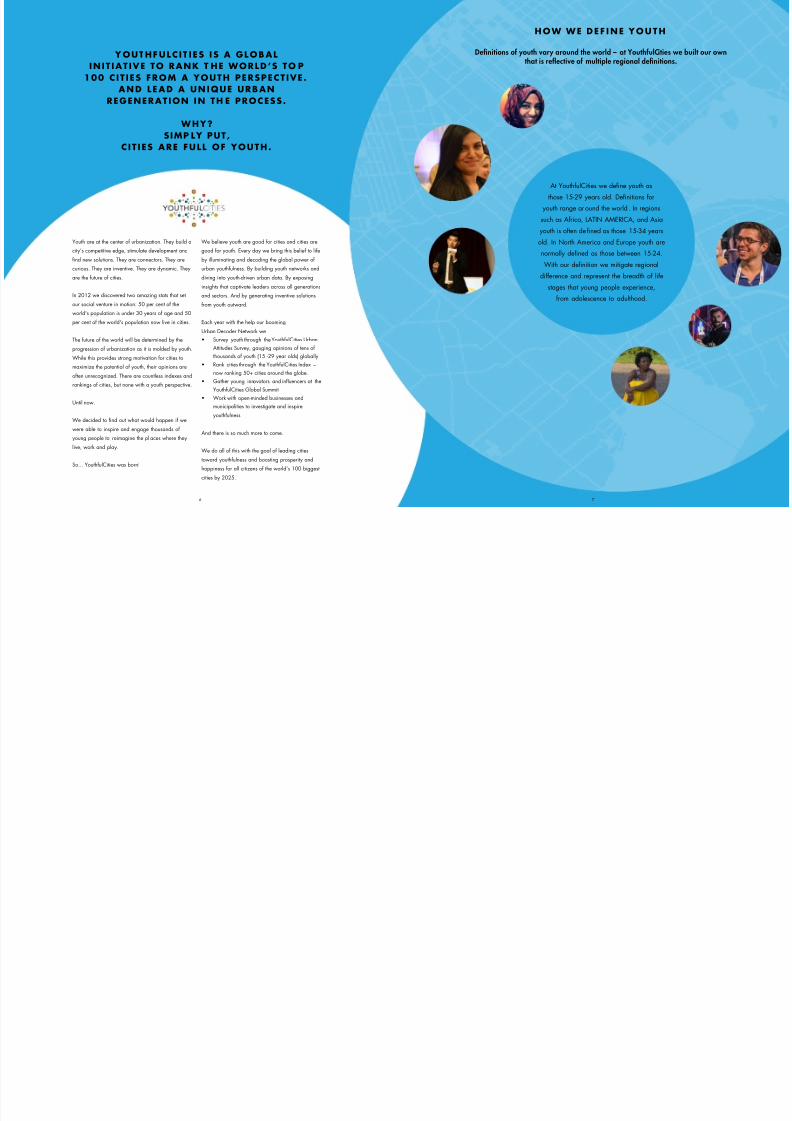
HOW WE DE F I N E YOU TH
Definitions of youth vary around the world – at YouthfulCities we built our ownthat is reflective of multiple regional definitions.
7
Youth are at the center of urbanization. They build a
city’s competitive edge, stimulate development and
find new solutions. They are connectors. They are
curious. They are inventive. They are dynamic. They
are the future of cities.
In 2012 we discovered two amazing stats that set
our social venture in motion: 50 per cent of the
world's population is under 30 years of age and 50
per cent of the world's population now live in cities.
The future of the world will be determined by the
progression of urbanization as it is molded by youth.
While this provides strong motivation for cities to
maximize the potential of youth, their opinions are
often unrecognized. There are countless indexes and
rankings of cities, but none with a youth perspective.
Until now.
We decided to find out what would happen if we
were able to inspire and engage thousands of
young people to reimagine the pl aces where they
live, work and play.
So... YouthfulCities was born!
We believe youth are good for cities and cities are
good for youth. Every day we bring this belief to life
by illuminating and decoding the global power of
urban youthfulness. By building youth networks and
diving into youth-driven urban data. By exposing
insights that captivate leaders across all generations
and sectors. And by generating inventive solutions
from youth outward.
Each year with the help our booming
Urban Decoder Network we
• Survey youth through the YouthfulCities Urban
Attitudes Survey, gauging opinions of tens of
thousands of youth (15 -29 year olds) globally
• Rank cities through the YouthfulCities Index –
now ranking 50+ cities around the globe.
• Gather young innovators and influencers at the
YouthfulCities Global Summit
• Work with open-minded businesses and
municipalities to investigate and inspire
youthfulness
And there is so much more to come.
We do all of this with the goal of leading cities
toward youthfulness and boosting prosperity and
happiness for all citizens of the world’s 100 biggest
cities by 2025.
Y OUTHFULC I T I E S I S A GLOB ALIN IT IAT IVE TO RANK T HE WORLD’S TO P
100 C I T I ES FROM A YOUTH PERSPECT IVE . AN D LE AD A UN I QUE URB AN
REGENERAT ION IN TH E PROCESS .
WHY?
SIMP LY PUT,C I T I ES ARE FULL OF YOUTH.
At YouthfulCities we define youth as
those 15-29 years old. Definitions for
youth range ar ound the world . In regions
such as Africa, LATIN AMERICA, and Asia
youth is often defined as those 15-34 years
old. In North America and Europe youth are
normally defined as those between 15-24.
With our definition we mitigate regional
difference and represent the breadth of lifestages that young people experience,
from adolescence to adulthood.
6
7/18/2019 Youthful Cities
http://slidepdf.com/reader/full/youthful-cities 5/138
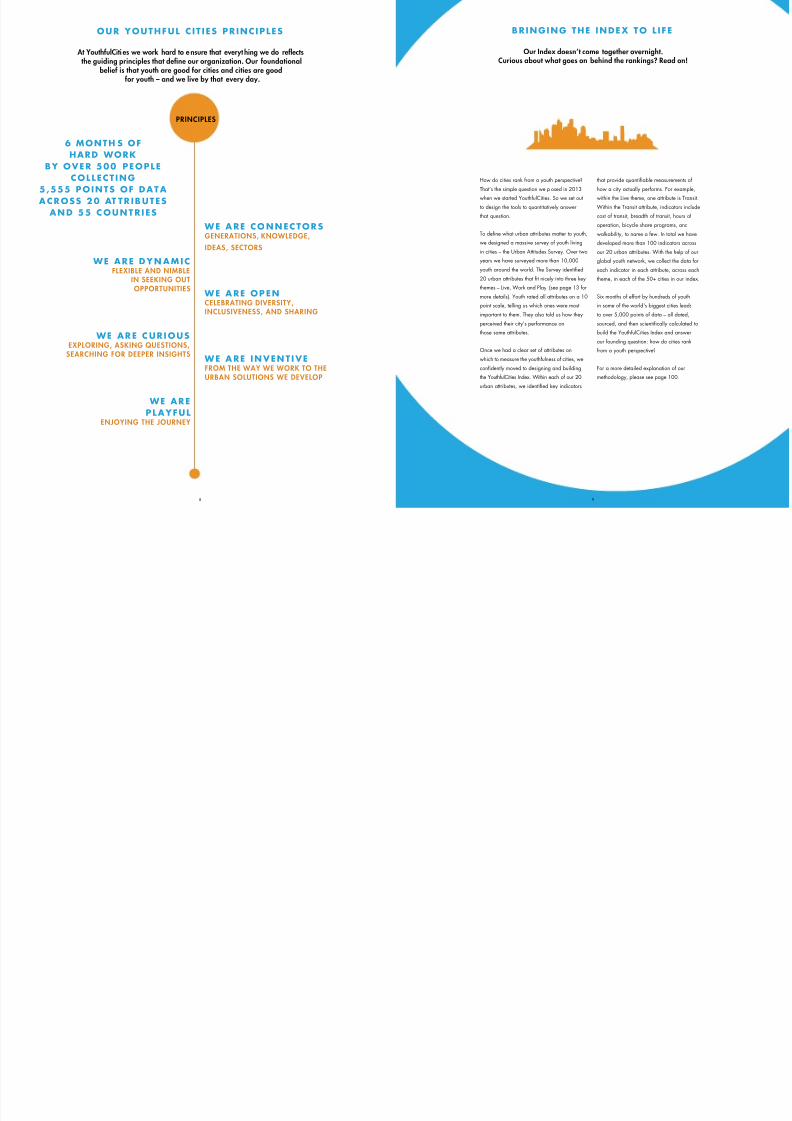
OUR YOUTHFUL C I T I ES PR INCIPLES
At YouthfulCiti es we work hard to e nsure that everyt hing we do reflectsthe guiding principles that define our organization. Our foundational
belief is that youth are good for cities and cities are goodfor youth – and we live by that every day.
BRINGING THE INDEX TO L I FE
Our Index doesn’t come together overnight.Curious about what goes on behind the rankings? Read on!
6 MONTH S OFHARD WORK
BY OVER 500 PEOPLECOLLECT ING
5,555 POINTS OF DATA
A CROSS 20 AT TR IB UTES AN D 55 COUN TRI ES
How do cities rank from a youth perspective?
That’s the simple question we p osed in 2013
when we started YouthfulCities. So we set out
to design the tools to quantitatively answer
that question.
To define what urban attributes matter to youth,
we designed a massive survey of youth living
in cities – the Urban Attitudes Survey. Over two
years we have surveyed more than 10,000
youth around the world. The Survey identified
20 urban attributes that fit nicely into three key
themes – Live, Work and Play (see page 13 for
more details). Youth rated all attributes on a 10
point scale, telling us which ones were most
important to them. They also told us how they
perceived their city’s performance on
those same attributes.
Once we had a clear set of attributes on
which to measure the youthfulness of cities, we
confidently moved to designing and building
the YouthfulCities Index. Within each of our 20
urban attributes, we identified key indicators
that provide quantifiable measurements of
how a city actually performs. For example,
within the Live theme, one attribute is Transit.
Within the Transit attribute, indicators include
cost of transit, breadth of transit, hours of
operation, bicycle share programs, and
walkability, to name a few. In total we have
developed more than 100 indicators across
our 20 urban attributes. With the help of our
global youth network, we collect the data for
each indicator in each attribute, across each
theme, in each of the 50+ cities in our index.
Six months of effort by hundreds of youth
in some of the world's biggest cities leads
to over 5,000 points of data – all dated,
sourced, and then scientifically calculated to
build the YouthfulCities Index and answer
our founding question: how do cities rank
from a youth perspective?
For a more detailed explanation of our
methodology, please see page 100.
PRINCIPLES
WE A RE CON N ECTORS GENERATIONS, KNOWLEDGE,
IDEAS, SECTORS
WE A RE OPEN CELEBRATING DIVERSITY,INCLUSIVENESS, AND SHARING
WE A RE IN VEN T I VE FROM THE WAY WE WORK TO THEURBAN SOLUTIONS WE DEVELOP
WE ARE DYN AMIC FLEXIBLE AND NIMBLE
IN SEEKING OUTOPPORTUNITIES
WE ARE CURI OUSEXPLORING, ASKING QUESTIONS,
SEARCHING FOR DEEPER INSIGHTS
WE ARE
PLAYFULENJOYING THE JOURNEY
9
7/18/2019 Youthful Cities
http://slidepdf.com/reader/full/youthful-cities 6/1311
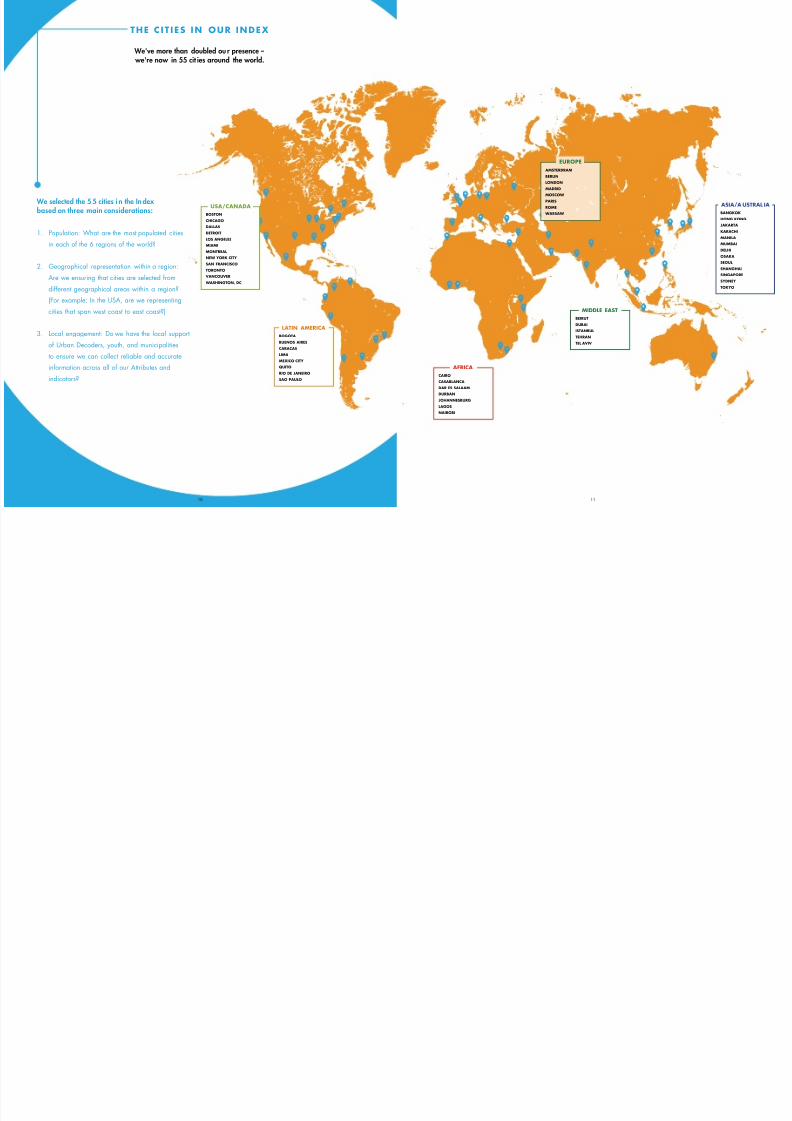
We selected the 5 5 cities i n the Indexbased on three main considerations:
1. Population: What are the most populated cities
in each of the 6 regions of the world?
2. Geographical representation within a region:
Are we ensuring that cities are selected fromdifferent geographical areas within a region?
(For example: In the USA, are we representing
cities that span west coast to east coast?)
3. Local engagement: Do we have the local support
of Urban Decoders, youth, and municipalities
to ensure we can collect reliable and accurate
information across all of our Attributes and
indicators?
THE C I T I ES IN OUR INDEX
We've more than doubled ou r presence – we're now in 55 cit ies around the world.
10
BA
HO
JA
KA
MA
MU
DE
OS
SEO
SH
SIN
SY
TO
A
BOGOTA
BUENOS AIRES
CARACAS
LIMA
MEXICO CITY
QUITO
RIO DE JANEIRO
SAO PAULO
LATIN AMERICA
BOSTON
CHICAGO
DALLAS
DETROIT
LOS ANGELES
MIAMI
MONTREAL
NEW YORK CITY
SAN FRANCISCO
TORONTO
VANCOUVER WASHINGTON, DC
USA/CANADA
CAIRO
CASABLANCA
DAR ES SALAAM
DURBAN
JOHANNESBURG
LAGOS
NAIROBI
AFRICA
BEIRUT
DUBAI
ISTANBUL
TEHRAN
TEL AVIV
MIDDLE EAST
EUROPE
AMSTERDRAM
BERLIN
LONDON
MADRID
MOSCOW
PARIS
ROME
WARSAW
7/18/2019 Youthful Cities
http://slidepdf.com/reader/full/youthful-cities 7/1312
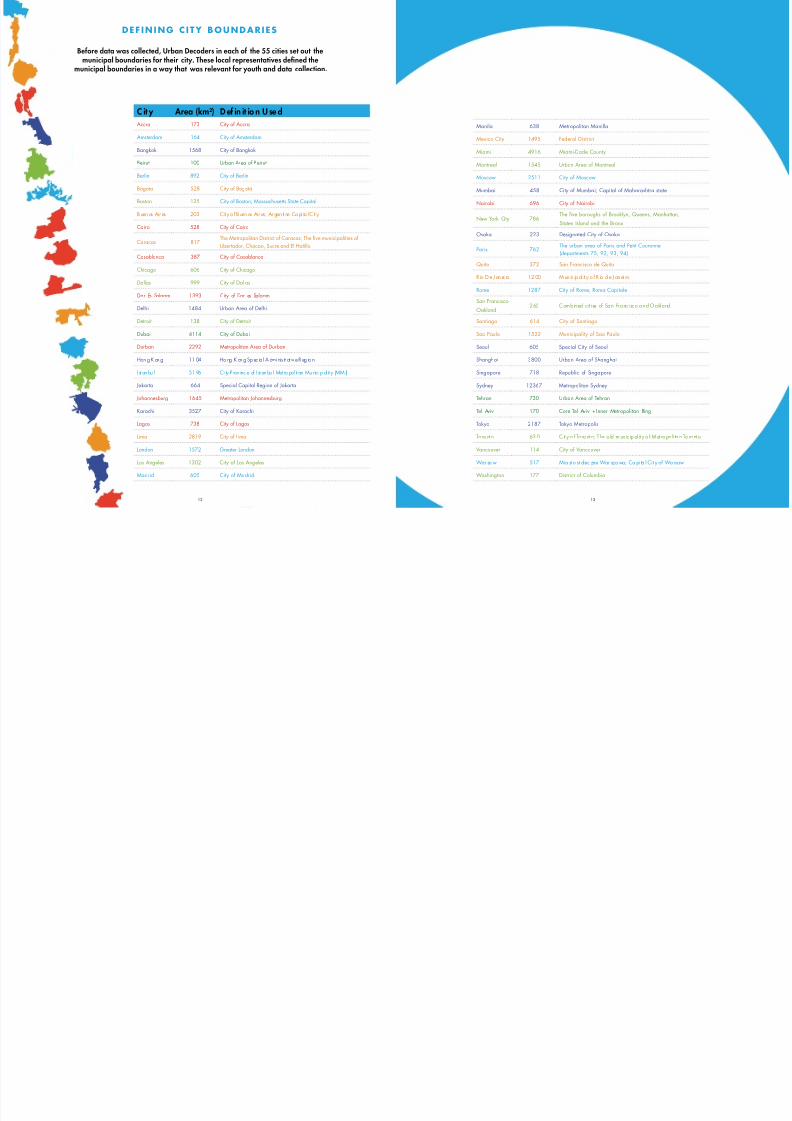
C it y Area (km²) D ef in it io n U se dAccra 173 City of Accra
Amsterdam 164 City of Amsterdam
Bangkok 1568 City of Bangkok
Beirut 100 Urban Area of Beirut
Berlin 892 City of Berlin
Bogota 528 City of Bogotá
Boston 125 City of Boston; Massachusetts State Capital
B uen os Air es 203 Cit y o f B uen os Air es; Ar gen ti ne Ca pi ta l C it y
Cairo 528 City of Cairo
Caracas 817The Metropolitan District of Caracas; The five municipalities of
Libertador, Chacao, Sucre and El Hatillo
Casablanca 387 City of Casablanca
Chicago 606 City of Chicago
Dallas 999 City of Dallas
Dar Es Salaam 1393 City of Dar es Salaam
Delhi 1484 Urban Area of Delhi
Detroit 138 City of Detroit
Dubai 4114 City of Dubai
Durban 2292 Metropolitan Area of Durban
Hon g Kon g 11 04 Ho ng Kon g Sp ec ia l A dmi nis tr at iv e R eg io n
I st an bu l 51 96 Ci ty -P rov inc e of I st an bu l Met ro pol it an Munic ip al it y (MM I)
Jakarta 664 Special Capital Region of Jakarta
Johannesburg 1645 Metropolitan Johannesburg
Karachi 3527 City of Karachi
Lagos 738 City of Lagos
Lima 2819 City of Lima
London 1572 Greater London
Los Angeles 1302 City of Los Angeles
Madrid 605 City of Madrid
Manila 638 Metropolitan Manilla
Mexico City 1495 Federal District
Miami 4916 Miami-Dade County
Montreal 1545 Urban Area of Montreal
Moscow 2511 City of Moscow
Mumbai 458 City of Mumbai; Capital of Maharashtra state
Nairobi 696 City of Nairobi
New York City 786The five boroughs of Brooklyn, Queens, Manhattan,
Staten Island and the Bronx
Osaka 223 Designated City of Osaka
Paris 762The urban area of Paris and Petit Couronne
(departments 75, 92, 93, 94)
Quito 372 San Francisco de Quito
R io De J an ei ro 12 00 M un ic ip al it y o f R io d e J an ei ro
Rome 1287 City of Rome; Roma Capitale
San Francisco-
Oakland265 Combined cit ies of San Francisco and Oakland
Santiago 614 City of Santiago
Sao Paulo 1522 Municipality of Sao Paulo
Seoul 605 Special City of Seoul
Shanghai 3800 Urban Area of Shanghai
Singapore 718 Republic of Singapore
Sydney 12367 Metropolitan Sydney
Tehran 730 Urban Area of Tehran
Tel Aviv 170 Core Tel Aviv + Inner Metropolitan Ring
Tokyo 2187 Tokyo Metropolis
To ro nt o 63 0 C it y o f To ro nt o; T he o ld m un ic ip al it y o f M et ro po li ta n To ro nt o
Vancouver 114 City of Vancouver
War sa w 517 Mia st o st ołec zne War sza wa; Ca pi ta l Cit y of Wa rsaw
Washington 177 District of Columbia
DEF IN ING C I TY BOUNDARIES
Before data was collected, Urban Decoders in each of the 55 cities set out themunicipal boundaries for their city. These local representatives defined the
municipal boundaries in a way that was relevant for youth and data collection.
13
7/18/2019 Youthful Cities
http://slidepdf.com/reader/full/youthful-cities 8/1315
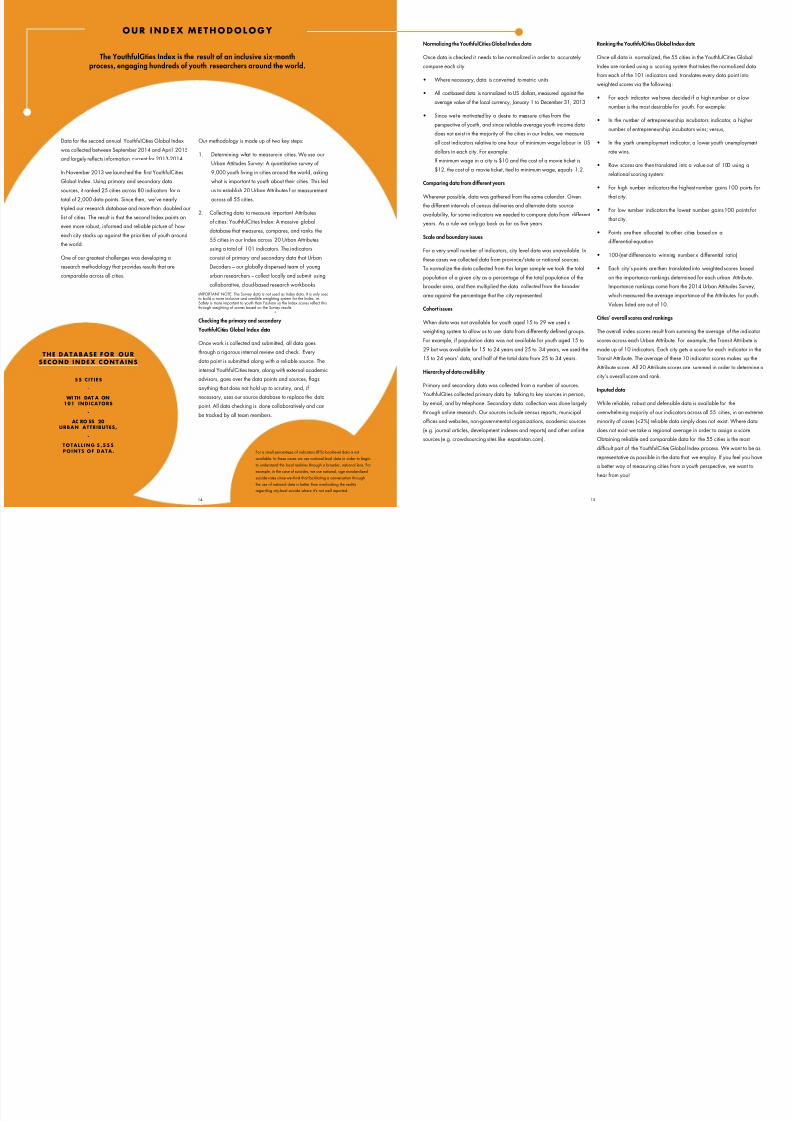
Data for the second annual YouthfulCities Global Indexwas collected between September 2014 and April 2015
and largely reflects information current for 2013-2014.
In November 2013 we launched the first YouthfulCities
Global Index. Using primary and secondary data
sources, it ranked 25 cities across 80 indicators for a
total of 2,000 data points. Since then, we’ve nearly
tripled our research database and more than doubled our
list of cities. The result is that the second Index paints an
even more robust, informed and reliable picture of how
each city stacks up against the priorities of youth around
the world.
One of our greatest challenges was developing a
research methodology that provides results that are
comparable across all cities.
Our methodology is made up of two key steps:
1. Determining what to measure in cities. We use our
Urban Attitudes Survey: A quantitative survey of
9,000 youth living in cities around the world, asking
what is important to youth about their cities. This led
us to establish 20 Urban Attributes f or measurement
across all 55 cities.
2. Collecting data to measure important Attributes
of cities: YouthfulCities Index: A massive global
database that measures, compares, and ranks the
55 cities in our Index across 20 Urban Attributes
using a total of 101 indicators. The indicators
consist of primary and secondary data that Urban
Decoders – our globally dispersed team of young
urban researchers – collect locally and submit usingcollaborative, cloud-based research workbooks.
IMPORTANT NOTE: The Survey data is not used as Index data. It is only usedto build a more inclusive and credible weighting system for the Index, ie.Safety is more important to youth than Fashion so the Index scores reflect thisthrough weighting of scores based on the Survey results.
Checking the primary and secondary
YouthfulCities Global Index data
Once work is collected and submitted, all data goes
through a rigorous internal review and check. Every
data point is submitted along with a reliable source. The
internal YouthfulCities team, along with external academic
advisors, goes over the data points and sources, flags
anything that does not hold up to scrutiny, and, if
necessary, uses our source database to replace the data
point. All data checking is done collaboratively and can
be tracked by all team members.
Normalizing the YouthfulCities Global Index data
Once data is checked it needs to be normalized in order to accurately
compare each city:
• Where necessary, data is converted to metric units
• All cost-based data is normalized to US dollars, measured against the
average value of the local currency, January 1 to December 31, 2013
• Since we’re motivated by a desire to measure cities from the
perspective of youth, and since reliable average youth income data
does not exist in the majority of the cities in our Index, we measure
all cost indicators relative to one hour of minimum wage labour in US
dollars in each city. For example:
If minimum wage in a city is $10 and the cost of a movie ticket is
$12, the cost of a movie ticket, tied to minimum wage, equals 1.2.
Comparing data from different years
Wherever possible, data was gathered from the same calendar. Given
the different intervals of census deliveries and alternate data source
availability, for some indicators we needed to compare data from different
years. As a rule we only go back as far as five years.
Scale and boundary issues
For a very small number of indicators, city level data was unavailable. In
these cases we collected data from province/state or national sources.
To normalize the data collected from this larger sample we took the total
population of a given city as a percentage of the total population of thebroader area, and then multiplied the data collected from the broader
area against the percentage that the city represented.
Cohort issues
When data was not available for youth aged 15 to 29 we used a
weighting system to allow us to use data from differently defined groups.
For example, if population data was not available for youth aged 15 to
29 but was available for 15 to 24 years and 25 to 34 years, we used the
15 to 24 years' data, and half of the total data from 25 to 34 years.
Hierarchy of data credibility
Primary and secondary data was collected from a number of sources.
YouthfulCities collected primary data by talking to key sources in person,
by email, and by telephone. Secondary data collection was done largely
through online research. Our sources include census reports, municipal
offices and websites, non-governmental organizations, academic sources
(e.g. journal articles, development indexes and reports) and other online
sources (e.g. crowdsourcing sites like expatistan.com).
Ranking the YouthfulCities Global Index data
Once all data is normalized, the 55 cities in the YouthfulC
Index are ranked using a scoring system that takes the nor
from each of the 101 indicators and translates every data
weighted scores via the following:
• For each indicator we have decided if a high numbe
number is the most desirable for youth. For example:
• In the number of entrepreneurship incubators indicat
number of entrepreneurship incubators wins; versus,
• In the youth unemployment indicator, a lower youth u
rate wins.
• Raw scores are then translated into a value out of 10
relational scoring system:
• For high number indicators the highest number gains
that city.
• For low number indicators the lowest number gains 1
that city.
• Points are then allocated to other cities based on a
differential equation.
• 100-(net difference to winning number x differential
• Each city’s points are then translated into weighted s
on the importance rankings determined for each urbaImportance rankings come from the 2014 Urban Atti
which measured the average importance of the Attrib
Values listed are out of 10.
Cities’ overall scores and rankings
The overall index scores result from summing the average
scores across each Urban Attribute. For example, the Tran
made up of 10 indicators. Each city gets a score for each
Transit Attribute. The average of these 10 indicator scores
Attribute score. All 20 Attribute scores are summed in orde
city’s overall score and rank.
Inputed data
While reliable, robust and defensible data is available for
overwhelming majority of our indicators across all 55 citie
minority of cases (<2%) reliable data simply does not exis
does not exist we take a regional average in order to assi
Obtaining reliable and comparable data for the 55 cities
difficult part of the YouthfulCities Global Index process. W
representative as possible in the data that we employ. If yo
a better way of measuring cities from a youth perspective,
hear from you!
OU R I N DE X ME THODOLOG Y
The YouthfulCities Index is the result of an inclusive six-monthprocess, engaging hundreds of youth researchers around the world.
14
THE DATABASE FOR OURSECOND INDEX CONTAINS
55 CI T I E S
-
WI TH DAT A ON101 INDICATORS
-
AC RO SS 20URBAN ATTRIBUTES,
-
TOTALL ING 5 ,555POINTS OF DATA . For a small percentage of indicators (8%) local-level data is not
available. In these cases we use national-level data in order to begin
to understand the local realities through a broader, national lens. For
example, in the case of suicides, we use national, age standardized
suicide rates since we think that facilitating a conversation through
the use of national data is better than overlooking the reality
regarding city-level suicide where it's not well reported.
7/18/2019 Youthful Cities
http://slidepdf.com/reader/full/youthful-cities 9/1316
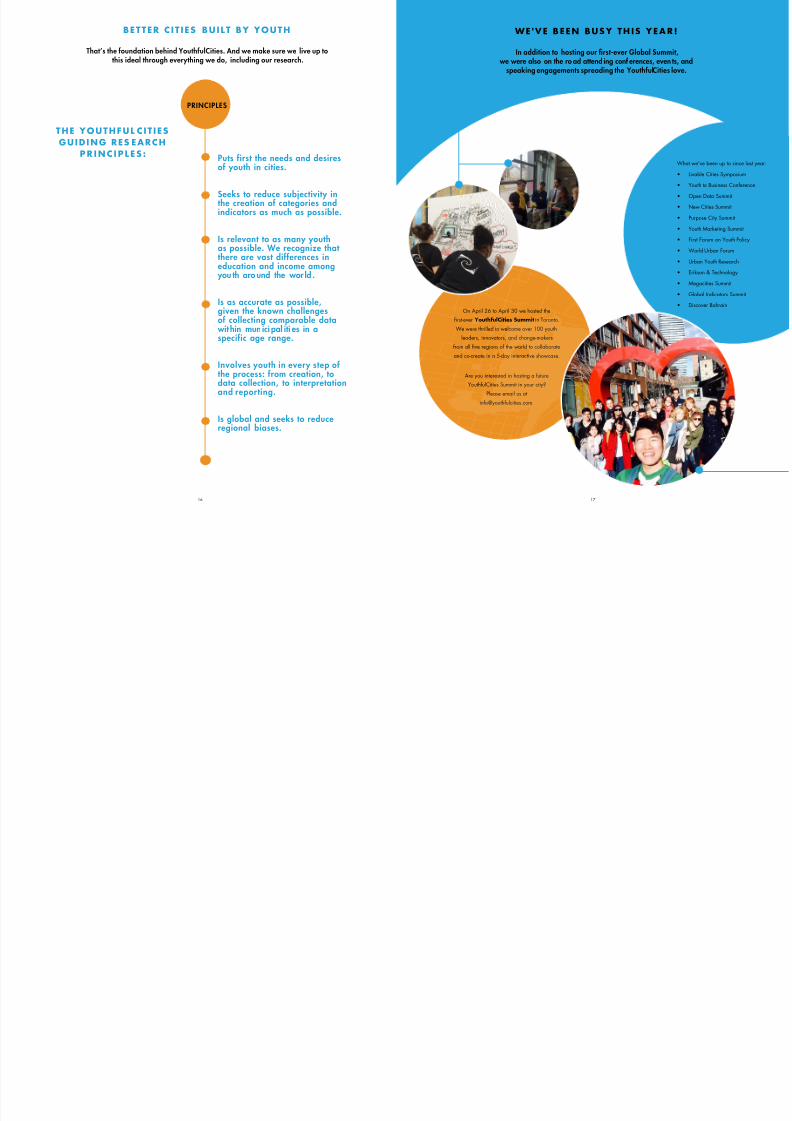
On April 26 to April 30 we hosted the
first-ever YouthfulCities Summit in Toronto.
We were thrilled to welcome over 100 youth
leaders, innovators, and change-makers
from all five regions of the world to collaborate
and co-create in a 5-day interactive showcase.
Are you interested in hosting a future
YouthfulCities Summit in your city?
Please email us at
WE 'VE B EEN BUS Y TH IS YEA R!
In addition to hosting our first-ever Global Summit, we were also on the ro ad attend ing conf erences, even ts, and
speaking engagements spreading the YouthfulCities love.
What we've been up
• Livable Cities Sy
• Youth to Busines
• Open Data Sum
• New Cities Sum
• Purpose City Sum
• Youth Marketing
• First Forum on Y
• World Urban Fo
• Urban Youth Res
• Erikson & Techn
• Megacities Summ
• Global Indicator
• Discover Bahrain
17
BETTER C I T I ES BU I LT BY YOUTH
That’s the foundation behind YouthfulCities. And we make sure we live up tothis ideal through everything we do, including our research.
THE YOUTHFUL C I T I ES
GUIDING RES EARCHPR I N C I P L E S :
PRINCIPLES
Puts first the needs and desiresof youth in cities.
Seeks to reduce subjectivity inthe creation of categories andindicators as much as possible.
Is relevant to as many youthas possible. We recognize thatthere are vast differences ineducation and income among
you th around the wor ld .
Is as accurate as possible,given the known challengesof collecting comparable data
wit hin mun ici pal iti es in aspecific age range.
Involves youth in every step ofthe process: from creation, todata collection, to interpretationand reporting.
Is global and seeks to reduceregional biases.
7/18/2019 Youthful Cities
http://slidepdf.com/reader/full/youthful-cities 10/13
ANISHA JOHAL
VANCOUVER
FRANCIS ANYAEGBU
LAGOS
OYINDAMOLA JOHN-SONDURBAN
VAIBHAV SINGH
DELHI
NOUR AOUDE
OTTAWA
SEDA YILDIZ
ISTANBUL
IGNACIO CARTESSANTIAGO
AVIGAIL VANTU
TEL AVIV
FRANCIS KESSY
DAR ES SALAAM
NARGESKHORAMSHAHI
TEHRAN
VIOLA BOJANOWICZ
WARSAW
ELIZABETHTHONGPHANITH
MONTREAL
CINDY GARCIA
BOGOTA
MARINO BOTTINIROME
DANIELA GUTIERREZ
BOGOTA
IHSANNE LAHLOU
CASABLANCA
LEEN ROMANEH
DUBAI
THINESH KUMAR
SINGAPORE
YING YANG
BANGKOK
NATHALIE WEIRDAK
CARACAS
NADEZHDA ZHEREBINA MOSCOW
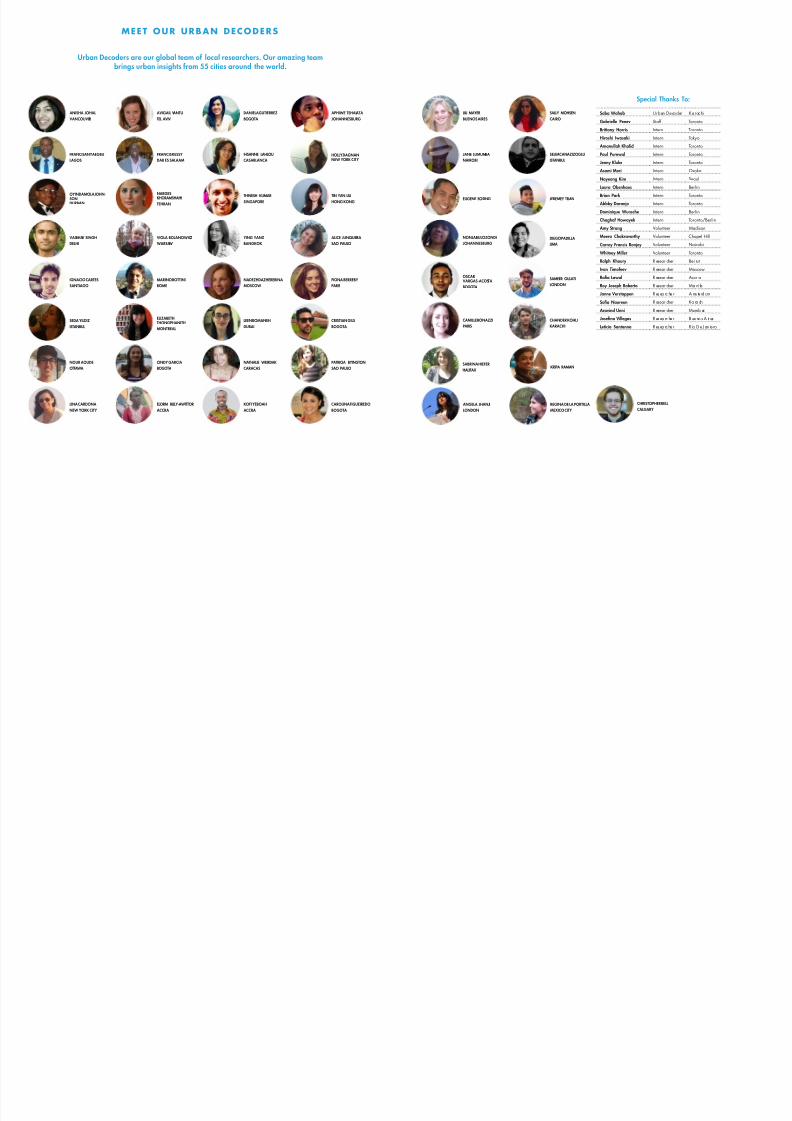
MEET OUR URBAN DECODERS
Urban Decoders are our global team of local researchers. Our amazing team
brings urban insights from 55 cities around the world.
CRISTIAN GILS
BOGOTA
SAMEER GULATILONDON
APHIWE TSHALATA
JOHANNESBURG
ANGELA JHANJI
LONDON
REGINA DE LA PORTILLA
MEXICO CITY
FIONA BERREBYPARIS
CHANDER KOHLI
KARACHI
CAMILLE BONAZZI
PARIS
HOLLY DAGNANNEW YORK CITY
LILI MAYER
BUENOS AIRES
SALLY MOHSEN
CAIRO
TIN YAN LIU
HONG KONG
JANE LUMUMBA
NAIROBI
SELIMCAN AZIZOGLU
ISTANBUL
PATRICIA BYINGTON
SAO PAULO
ALICE JUNQUEIRA
SAO PAULO
EUGENE SOSING JEREMEY TRAN
LINA CARDONA
NEW YORK CITY
ELORM BILLY-AWITTOR
ACCRA
KOFI YEBOAH
ACCRA
Special Thanks To:
CAROLINA FIGUEIREDO
BOGOTA
OSCAR VARGAS-ACOSTA
BOGOTA
KRIPA RAMANSABRINA HIEFER
HALIFAX
NONJABULO ZONDI
JOHANNESBURGDIEGO PADILLA
LIMA
Saba Wahab Urban Decoder Karachi
Gabrielle Penev Staff Toronto
Brittany Harris Intern Toronto
Hiroshi Iwasaki Intern Tokyo
Amanullah Khalid Intern Toronto
Paul Purewal Intern Toronto
Jenny Kluke Intern Toronto
Asami Mori Intern Osaka
Nayeong Kim Intern Seoul
Laura Obenhaus Intern Berlin
Brian Park Intern Toronto
Abbby Daranjo Intern Toronto
Dominique Wunsche Intern Berlin
Chaghaf Howayek Intern Toronto/Berlin
Amy Strang Volunteer Madison
Meera Chakravarthy Volunteer Chapel Hill
Carrey Francis Ronjey Volunteer Nairobi
Whitney Miller Volunteer Toronto
Ralph Khoury R esear cher Bei rut
Ivan Timofeev R esear cher Moscow
Rafia Lawal R esear cher Accr aRoy Joseph Roberto R esear cher Ma ni la
Janne Verstappen R es ea rc he r A ms te rd am
Sofia Naureen R esear cher Ka ra chi
Aravind Unni R esear cher Mumb ai
Josefina Villegas R es ea rc he r B ue no s A ir es
Leticia Santanna Res ea rc he r R io D e J an ie ro
CHRISTOPHER BELL
CALGARY

7/18/2019 Youthful Cities
http://slidepdf.com/reader/full/youthful-cities 11/13
HOW YOU C AN GET IN VOLVED
YO UT H
Are you 15-29? Connected, engaged, curious,
and inventive? Do you want to be the driving
force behind a youth-led regeneration in your
city? Do you want to join our dynamic global
network of 10,000 peers in 50+ cities around
the world?
Join in the conversation, globally or in your
city — everyone is welcome! The YouthfulCities
Index is a tool for you to make informed social
impact in your city based on global empirical
research in areas that matter to you.
We invite you to use the data from the Index to
support your passions and ambitions. Let’s face
it, there is power in numbers and statistics, and
we now have lots of them. Find out how your
city is doing from a youth perspective and howit compares globally.
How to get involved:
• Fill out and promote the Urban Attitudes
Survey (available in 22 languages)
• Request city-specific data
• Become an Urban Decoder
• Volunteer with your local
YouthfulCities team
MUNICIPAL IT IES
Are you a civic leader? A policy maker or
municipal strategist? Do you want to drive your
city’s competitive edge, stimulate development,
and find new solutions for the most pressing
urban problems? Do you want to build a more
connected, dynamic, open, fun, curious, and
inventive city?
Youth are a city’s greatest assets, and also
the biggest challenge. We facilitate the
conversation.
YouthfulCities provides a platform and method
to open this dialogue in a meaningful,
innovative, and mutually beneficial way. We
are looking to partner with municipalities
around the world to develop and share
knowledge that is key to building better citieswith youth.
How to get involved:
• Promote the Urban Attitudes Survey and
gain access to the results
• Add your city to the YouthfulCities Index
• Learn from your global peers,
what’s working and what’s not
• Sponsor a Pop-Up Think Tank for local
recommendations on what can make your
city more youthful
• Create customized research on what is
most important to your local realities
• Develop a Youth Engagement Strategyspecific to your city
• Set up a municipal Youth Advisory Board
• Host a workshop for municipal employees
which presents the importance of youth
BUS INESSES
Are you a business leader in search of great
insights into the world’s largest and most
dynamic demographic? Do you want to learn
how your business and brand actually live in
the lives of users? Do you want to generate
groundbreaking new ideas and inventive
solutions that help drive your brand and
business forward? Do you want to work with
a global team of researchers, strategists, and
social innovators?
Take a step beyond Corporate Social
Responsibility and venture into a mutually
beneficial relationship with a globally
expanding and reputable organization.
How to get involved:
• Request customized access the world’s
largest reservoir of urban youth-centric data
to better understand the priorities of this key
demographic
• Hire a customized Urban Decoder Unit
to dig into what youth really think of your
brand and your product
• Get a unique global perspective on what
matters to youth in 55 of the world’s most
populated cities
• Develop Indicators that capture key insights
into your business and your brand
• Engage your employees
• Learn key insights into how your company
can retain and engage youth talent and
maximize their full potential
• Sponsor a Category for our YouthfulCities
Index that is vital to your business
• Identify key opportunities for youth
engagement, market expansion,
innovation, cause marketing applications
YOU THFULC I T I ES I S L EAD IN G A UN IQU E URBAN RE GEN ERAT ION .
WE WA N T YOU TO JO IN US .
Interested in joiningour global movement?
Send a specialized request [email protected].
OUR CL IENTS
2120
7/18/2019 Youthful Cities
http://slidepdf.com/reader/full/youthful-cities 12/13
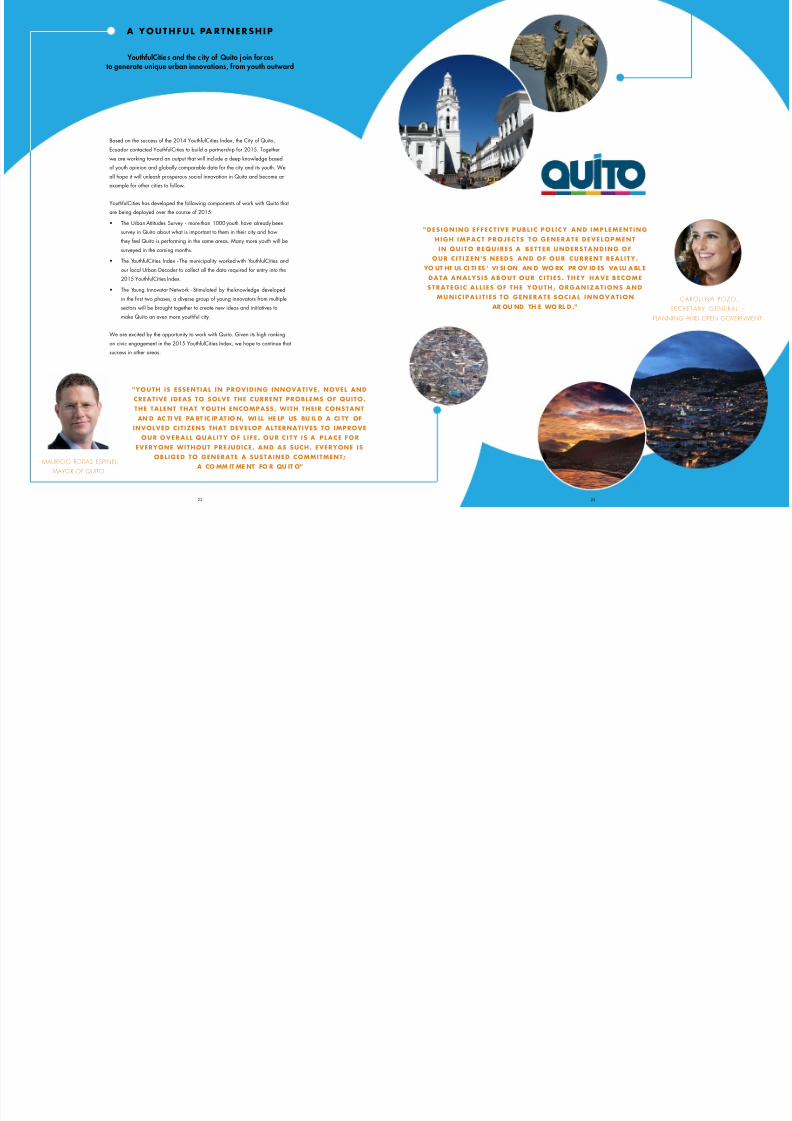
A YOUTHFU L PA RTN ERSHI P
YouthfulCitie s and the c ity of Quito j oin for cesto generate unique urban innovations, from youth outward
Based on the success of the 2014 YouthfulCities Index, the City of Quito,Ecuador contacted YouthfulCities to build a partnership for 2015. Together
we are working toward an output that will include a deep knowledge based
of youth opinion and globally comparable data for the city and its youth. We
all hope it will unleash prosperous social innovation in Quito and become an
example for other cities to follow.
YouthfulCities has developed the following components of work with Quito that
are being deployed over the course of 2015:
• The Urban Attitudes Survey - more than 1000 youth have already been
survey in Quito about what is important to them in their city and how
they feel Quito is performing in the same areas. Many more youth will be
surveyed in the coming months.
• The YouthfulCities Index - The municipality worked with YouthfulCities and
our local Urban Decoder to collect all the data required for entry into the
2015 YouthfulCities Index.
• The Young Innovator Network - Stimulated by the knowledge developed
in the first two phases, a diverse group of young innovators from multiple
sectors will be brought together to create new ideas and initiatives to
make Quito an even more youthful city.
We are excited by the opportunity to work with Quito. Given its high ranking
on civic engagement in the 2015 YouthfulCities Index, we hope to continue that
success in other areas.
"YOUTH IS ESSENTIAL IN PROVIDING INNOVATIVE, NOVEL AND
CREATIVE IDEAS TO SOLVE THE CURRENT PROBLEMS OF QUITO.
THE TALENT THAT YOUTH ENCOMPASS, WITH THEIR CONSTANT
AN D AC TI VE PA RT IC IP AT IO N, WI LL HE LP US BU IL D A CI TY OFINVOLVED CITIZENS THAT DEVELOP ALTERNATIVES TO IMPROVE
OUR OVERALL QUAL I TY OF L I FE . OUR C I TY IS A PLACE FOR
EVERYONE WITHOUT PREJUDICE, AND AS SUCH, EVERYONE IS
OBLIGED TO GENERATE A SUSTAINED COMMITMENT;
A CO MM IT ME NT FO R QU IT O"
22
- MAURICIO RODAS ESPINEL,
MAYOR OF QUITO
"DES IGNING EFFECT IVE PUBL IC POL ICY AND IMPLEMENT ING
HIGH IMPACT PROJECTS TO GENERATE DEVELOPMENT
IN QUITO REQUIRES A BETTER UNDERSTANDING OF
OUR C I T IZEN 'S NEEDS AND OF OUR CURRENT REAL I TY .
YO UT HF UL CI TI ES ' VI SI ON AN D WO RK PR OV ID ES VA LU ABL E
DATA ANALYS IS ABOUT OUR C I T I ES . THEY HAVE BECOMESTRATEGIC AL L I ES OF THE YOUTH, ORGANIZAT IONS AND
MUNICIPAL I T I ES TO GENERATE SOCIAL INNOVAT ION
AR OU ND TH E WO RL D ."- CAROL I NA PO
SECRETARY GENE
PLANNING AND OPEN G
23
7/18/2019 Youthful Cities
http://slidepdf.com/reader/full/youthful-cities 13/13
25
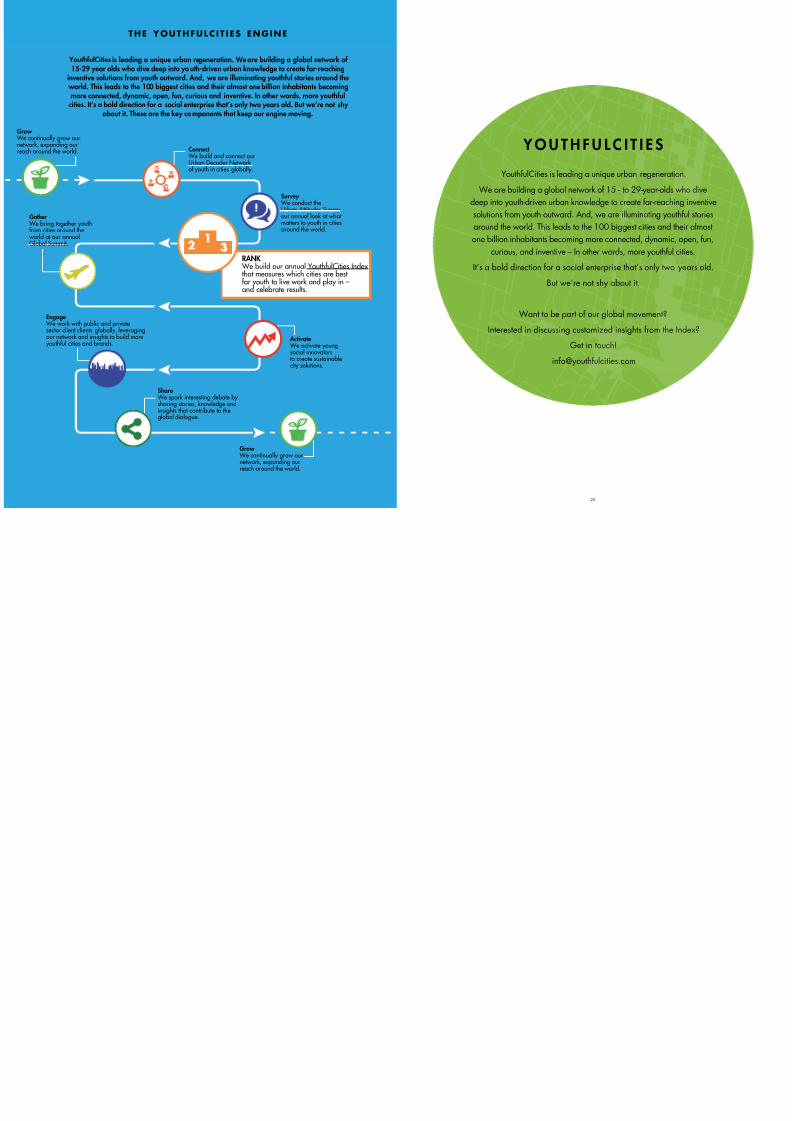
YouthfulCities is leading a unique urban regeneration.
We are building a global network of 15 - to 29-year-olds who dive
deep into youth-driven urban knowledge to create far-reaching inventive
solutions from youth outward. And, we are illuminating youthful stories
around the world. This leads to the 100 biggest cities and their almost
one billion inhabitants becoming more connected, dynamic, open, fun,
curious, and inventive – In other words, more youthful cities.
It’s a bold direction for a social enterprise that’s only two years old.
But we’re not shy about it.
Want to be part of our global movement?
Interested in discussing customized insights from the Index?
Get in touch!
Y O U T H F U L C I T I E S
24
Grow
We continually grow ournetwork, expanding ourreach around the world.
Grow We continually grow ournetwork, expanding ourreach around the world.
Connect We build and connect ourUrban Decoder Networkof youth in cities globally.
Survey We conduct theUrban Attitudes Surveyour annual look at whatmatters to youth in citiesaround the world.
Gather We bring together youthfrom cities around the world at our annualGlobal Summit.
Activate We activate youngsocial innovatorsto create sustainablecity solutions.
Share We spark interesting debate bysharing stories, knowledge andinsights that contribute to the
global dialogue.
Engage We work with public and privatesector client clients globally, leveragingour network and insights to build more youthful cities and brands.
RANK We build our annual YouthfulCities Indexthat measures which cities are bestfor youth to live work and play in –and celebrate results.
THE YOUTHFULC I T I ES ENGINE
YouthfulCities is leading a unique urban regeneration. We are building a global network of15-29 year olds who dive deep into youth-driven urban knowledge to create far-reaching
inventive solutions from youth outward. And, we are illuminating youthful stories around the world. This leads to the 100 biggest cities and their almost one billion inhabitants becoming
more connected, dynamic, open, fun, curious and inventive. In other words, more youthfulcities. It’s a bold direction for a social enterprise that’s only two years old. But we’re not shy
about it. These are the key components that keep our engine moving.