youth, revolution, and repression
TRANSCRIPT
YOUTH, REVOLUTION, AND REPRESSION∗
Mehdi Shadmehr† Peter Haschke‡
Abstract
We develop a simple model to study the effect of age-structure on the interactions
between the state and dissidents. Younger populations are more prone to protest.
As the population grows younger, states that can discriminately target repression to
different groups, but cannot concede discriminately, decrease repression. In contrast,
states that can target concession, but not repression, increase repression. We test
these results in non-military single-party regimes and military regimes without political
parties. Moreover, we study state response to dissent in East European communist
regimes in the late 1980s, showing that state response was more repressive in countries
with younger populations.
JEL Codes: D74.
Keywords: Revolution, Repression, Human Rights, Youth, Regime Types, Military
Regimes, Single-party Regimes.
∗We wish to thank Dan Bernhardt, Jose Cheibub, Luke Fitzpatrick, Justin Fox, Mark Gibney, Jude Hays,Kerim Kavakli, Patrick Kuhn, Paulina Marek, Michael Peress, Bing Powell, Kjetil Storesletten, Milan Svolik,James Vreeland, seminar participants at the University of Rochester department of political science, UIUCdepartment of economics, and MPSA Conference.†Department of Economics, University of Miami, and Department of Politics, Princeton University, 130
Corwin Hall, Princeton, NJ 08544. E-mail: [email protected] (Corresponding Author)‡Department of Political Science, University of North Carolina–Asheville, One University Heights,
Asheville, NC 28804. E-mail: [email protected]

I INTRODUCTION
The Protester was Time Magazine’s person of the year in 2011. But who are the protesters?
According to Time, “everywhere they are disproportionately young, middle class and edu-
cated” (Time Dec. 2011, 61). This paper focuses on the first characteristic: We develop
a simple model to study the effect of age structure on protest, and investigate the state’s
response to increases in the proportion of the young. The radicalism of the young and their
disproportionate participation in social unrest is a robust empirical finding.1 However, de-
spite abundant evidence linking age structure to social unrest, this aspect has gone largely
unstudied in the literature on protest, revolution, and repression.2 Our main theoretical
contribution is to show that the potential for revolution increases as the population becomes
younger, but the state’s response to this threat is subtle. In particular, when the popula-
tion becomes younger, repression decreases if the state can target repression to different age
groups, but cannot target concessions, i.e., concessions have to be made to all dissidents.
Our model is based on that of Acemoglu and Robinson (2001, 2006). There is a contin-
uum of agents distinguished by their income into the rich and the poor. Each agent lives two
periods. She is young in the first period, and becomes old in the second period. Therefore,
1The New Left in the United States in the 1960s and 1970s mostly consisted of young people and students(Lipset 1971; Lipset and Schaflander 1971). Among the early Russian communists,“[t]he activists were wellunder thirty years of age and the Bolsheviks were significantly younger than the Mensheviks” (Lane 1975,214). The charbonnerie revolutionary movement under the Bourbon Restoration in France “was primarilya movement of young men” (Pilbeam 1991, 22). Goldstone (1991, 2001) points to the coincidence of thehistorical waves of violent political crisis and population growth that resulted in the incoming of largecohorts of youth. Using survey data from the World Value Survey and Eurobarometer, MacCulloch (2005)finds that the young are more prone to revolutionary change of the society. In his quantitative study ofconflict, Urdal (2004, 2) finds that “countries that experience youth bulges are more likely to experiencedomestic armed conflict.” See also Brunborg et al. (2006), Choucri (1984), Collier (2000), and Urdal (2006).
2Age-structure is absent in the large body of theoretical literature that features revolution and repression(Acemoglu & Robinson 2001, 2006; Besley and Persson 2011; Boix 2003; Bueno de Mesquita 2010;Buenrostro et al. 2007; Casper & Tyson 2014; Chamley 1999; Chen et al. 2014; Chen & Xu 2014; DeNardo1985; Dunning 2008; Edmond 2013; Egorov et al. 2009; Ellis & Fender 2011, 2013; Epstein et al. 2012;Fearon 2011; Ginkel & Smith 1999; Hollyer et al. 2015; Leventoglu 2005; Lohmann 1994; Meirowitz &Tucker 2013; Persson & Tabellini 2009; Shadmehr 2015; Shadmehr & Bernhardt 2011; Svolik 2013; Tyson &Smith 2013). With the exception of Goldstone (1991, 2001) and Nord̊as and Davenport (2013), age structureis also absent in the mainstream sociological theories of revolutions that focus on political opportunities(Tarrow 1998; Tilly 1978, 2004), the intensity of grievances (Buechler 2004; Gurr 1970), or the nature ofthe state (Goodwin 2001; Parsa 2000; Skocpol 1979; Wilkinson 2009).
1

there are two poor groups: young poor and old poor. Each group has a representative agent,
and the fraction of that group in the population is the size of this representative agent. The
poor may challenge the status quo distribution of income by mounting a revolution.3 The
revolution succeeds if at least one poor group revolts, in which case the poor confiscate all
the assets of the rich, and share the whole income evenly forever. But the revolution destroys
a fraction of income. Revolution is equally costly for the young and the old, but the young
enjoy their higher income for a longer period, and hence have more incentives to revolt.
The state protects the interests of the rich who want to maintain the status quo. At the
beginning of each period, the state chooses a combination of repression and redistribution.
When the state represses a poor group (young or old), that group cannot mobilize and revolt.
But repression costs a fraction of the income of the rich. The cost is increasing in the size of
the group that is repressed. Alternatively, the state can redistribute income to a poor group
(young or old). The costs of redistribution depend on both the size and the age of the group:
Because the young have more to gain from the revolution, the state must redistribute more to
prevent them from revolting. After the state has determined the level of redistribution, and if
the state has not repressed a group (young or old poor), that group decides whether to revolt.
Because conceding to the young is more expensive to the rich, one may think that as the
population grows younger, the likelihood of repression always increases. However, we show
that whether a state increases repression or concession hinges on whether the state can dis-
criminately target repression and concession toward different groups.4 When the state can
3We focus on the redistribution of wealth, however, the logic applies to other issues ranging from theextension of franchise to the termination of mandatory draft for a war.
4We interpret targeted policies as those aimed at specific opposition members who represent a specificgroup in society. In this interpretation, to targetedly repress the young means to identify and repress theopposition leaders associated with the young dissidents. Similarly, to targetedly concede to the young meansto identify those leaders and to co-opt them or to address their demands. Alternatively, targeted repressionare repressive policies directed toward a specific age group, the young or the old. For example, attackingeducational institutions or the arresting of students are targeted repressive policies directed toward theyoung, while firing upon a group of demonstrators consisting of different age groups is an instance ofuntargeted repression. Restrictions on strikes, associations, and press are other examples of untargetedrepression that affect all age groups. Concession refers to actions of the state that accommodate thedissidents’ demands. Similar to repression, concession can be targeted or untargeted. Funding educationalinstitutions and lowering the voting age are examples of targeted concessions directed toward the young.Retirement benefits and pensions are instances of concessions targeted to the old. In contrast, improving
2

target concessions, but cannot target repression, the likelihood of repression increases as the
population grows younger. In contrast, when the state can target repression, but cannot tar-
get concession, the likelihood of repression decreases when the population becomes younger.5
To see the logic, suppose the state can target repression, but not redistribution. First,
consider the simpler case when the costs of revolution are high enough that only the young
impose a threat of revolution, i.e., the old non-elite have no incentive to revolt. Because a
revolution is more costly for the rich than repression and redistribution, the state chooses a
combination to avoid revolution. Thus, in effect, the state can either repress the young, or
redistribute indiscriminately to the whole poor population at a level that prevents the young
from revolting. The costs of this redistribution are not affected by increases in the proportion
of the young because the state is already redistributing to the whole poor population at the
level that satisfies the young. However, as the proportion of the young increases, the repres-
sion choice becomes more expensive because the state has to repress a larger fraction of the
population. As a result, the state may switch from repressing the young to redistribution.6
The logic extends to the case when the costs of revolution is lower so that both the young
and the old impose a threat. Then, the state can choose any one or a combination of three re-
sponses: repressing the young, repressing the old, and redistributing indiscriminately to the
whole poor population. A revolution is more costly for the rich than repression and redistri-
bution, and hence the state chooses a combination to avoid revolution. In effect, the state has
three choices to prevent revolution: (1) repress both the young and the old; (2) redistribute
at the minimum level that satisfies the young, which would also satisfy the old; and (3)
repress the young and redistribute just enough to satisfy the old. In the latter case, the state
represses the young because the chosen level of redistribution does not stop the young from
infrastructure such as roads, electricity, and water, and reducing corruption are examples of untargetedconcessions that improve the conditions of the population as a whole.
5We use the terms concession and redistribution interchangeably in the paper.6Although we focus on age structure, our model can be applied to settings in which citizens are divided
along other characteristics such as religion and ethnicity when (1) the nature of demands are similar for bothgroups (e.g., both groups demand redistribution or freedom of expression), but (2) one group is more radicalthan the other in the sense that the state has to make more concessions to prevent that group from revolting.
3

revolution. The costs of the first two choices are not affected by increases in the proportion
of the young. The first choice does not affect costs because the cost of repression depends
on the proportion of the population that is repressed. Therefore, when the state represses
all the poor, changes in the age structure of the poor do not affect these repression costs.
The second choice does not affect the costs because the state is already redistributing to the
whole poor population at the level that satisfies the young. However, as the proportion of the
young increases, the third choice becomes more expensive because the state has to repress
a larger fraction of the population. As a result, the state may switch from the third option
that involves repressing the young to the second option that does not involve repression.7
The predictions of our model concern states that can target repression, but not conces-
sions, and states that can target concessions, but not repression. The challenge is that, in
the real world, states use a combination of imperfectly targeted repression and concession
policies. The key step in bringing the model to the data is our observation that some insti-
tutions facilitate targeted concession, while others facilitate targeted repression. In Section
3, drawing on the literature on dictatorships (Acemoglu, Ticchi, and Vindigni 2010; Gandhi
2008; Gandhi and Przeworski 2006; Geddes 2007; Linz 2000; Lust-Okar 2006; Magaloni and
Kricheli 2010; Svolik 2013), we argue that state parties provide the infrastructure to dis-
tribute benefits and address demands targetedly, and hence single-party dictatorships have
institutions that facilitate targeted concessions. The institutions of military dictatorships,
however, facilitate targeted repression. Therefore, dictatorships that are single-party, but
not military, more closely represent states that target concession, but not repression. In
contrast, dictatorships that are military, but do not have a state party, more closely rep-
resent the states that target repression, but not concession. This characterization has two
7More generally, the underlying mechanism is based on two observations: (1) Only the cost of the policy(repression or concession) that can be targeted may change. The costs of untargeted policies remain thesame because they can either be applied to the whole population or to no one, and hence the age-structureof the population is irrelevant for the costs of untargeted policies. (2) An increase in the proportion of themore radical group (here, the young) can only increase the cost of the policy (repression or concession) thatcan be targeted. The cost of targeted concession increases because the young have more radical demands,and hence are more expensive to be bought. The cost of targeted repression can increase because, when thestate represses only the young, it has to repress a larger fraction of the population.
4

empirical implications: (1) In military regimes without a party structure, the younger the
population is, the lower the likelihood of repression. (2) In non-military single-party regimes,
the younger the population is, the higher the likelihood of repression.
These results seem surprising at first: One might think that increases in the population
of more radical dissidents make the state respond with the policy in which it specializes, i.e.,
the policy that the state can target and hence can employ more efficiently. For example, one
might suspect that states that can target repression, but not concession are likely to increase
repression in response to an increase in the proportion of the young. However, one must
distinguish between the level of repression and the change in the level of repression. A state
that can target repression, but cannot target concession may be more likely to use a higher
level of repression than a state that can target concession, but not repression. However, in
response to an increase in the proportion of the young, the states that can target repression,
but not concession are also more likely to decrease the level of repression.8 That is, our
finding focuses on the change in the repression level.9
We test these hypotheses, using three different measures of repression: the Cingranelli-
Richards (CIRI) Physical Integrity Rights Index (Cingranelli et al. 2014), the Political Ter-
ror Scales (Gibney et al. 2014), and Freedom House’s Civil Liberties index (Freedom House
2014). Our main independent variable is the ratio of the young to the old. We use regime-
type data from Cheibub, Gandhi, and Vreeland (2010) and Geddes, Wright, and Frantz
(2014) to constitute two samples: One for non-military single-party regimes and another for
non-partisan military regimes. For each sample, we estimate the effects of the age ratio on
repression.10 The results provide some evidence for the predictions of our theory. The coef-
ficients for the age ratio are statistically significant for several models, and for all models we
estimated, the sign of the age ratio is consistent with the theory: Negative in the sample of
8We emphasize that our results are not based on assumptions about the curvature of the repressiontechnology such as diminishing marginal benefits from more repression or convex repression costs.
9We emphasize that the driving force of our model is the comparative advantage of different regimes attargeting redistribution and repression, rather than their other characteristics.
10Because of the ordinal nature of the repression measures, we use ordered probit models. In the OnlineAppendix, we also estimate OLS models. The results are qualitatively the same as the ordered probit models.
5

non-partisan military regimes and positive in the sample of non-military single-party regimes.
Finally, we present an original case study of the state’s response to dissent in the Soviet
satellite states of Eastern Europe in the late 1980s. Consistent with our theoretical finding
for non-military single-party regimes, we show that in countries with a younger population,
states resisted reform and democratization more forcefully and used more repressive mea-
sures against the dissidents. For example, in Romania, the state forcefully resisted reform
and resorted to severe repression. By contrast in Hungary, the communist regime initiated
reform and was more tolerant of dissent than the other satellite states in the late 1980s.
Romania had the youngest and Hungary had the oldest population among these countries.
The paper proceeds as follows. Section 2 contains the model and its analysis. In Section
3, we discuss policy targetability and its relationship with regime types. Section 4 includes
the empirics. In Section 5, we study states’ responses to dissent in East European communist
regimes in the late 1980s. Section 6 concludes. All proofs are in the Appendix.
II MODEL
Consider an infinite horizon overlapping generations economy with a continuum 1 of agents
distinguished by their income into the elite and the non-elite, each constituting half of the
population.11 The elite receive a share θ > 12
of the income of the society and the non-elite
share the rest 1− θ < 12. Each agent lives two periods. Those living in their first period are
called young, and those in their second period are called old. Agents are risk-neutral and
discount future payoffs by β ∈ (0, 1). The population growth rate is ρ ∈ [0, 1]. Therefore,
the young constitute a fraction ry = 1+ρ2+ρ
of the non-elite, and the old constitute the rest,
ro = 12+ρ
. For simplicity, we abstract from the age structure of the elite, and assume that
they behave as a coherent collectivity who maximize their payoff in each period.
The income per capita of the society in each period is y, which must be consumed in the
same period. Therefore, under the status quo, the income per capita of the elite in each pe-
11The equal proportion of the elite and the non-elite is inconsequential for our results.
6

riod is ye = θy12
= θ2y, which is higher than that of the non-elite, yn = (1− θ)2y.12 However,
in each period that starts in the status quo, the non-elite can challenge the unequal economic
arrangement by mounting a revolution. Revolution is an absorbent state. If revolution takes
place, the elite receive 0 from that period on, and the non-elite share the whole income
evenly.13 However, revolution is costly and destroys a fraction µ ∈ [0, 1] of the income in the
period of revolution, leaving the non-elite with income per capita of (1−µ)y12
= (1 − µ)2y in
the period of revolution, and 2y in the following periods.
The elite control the state. That is, the state chooses policies to protect the elite against
the threat of revolution. In response to the threat of revolution, in each period that starts
in the status quo, the state can resort to repression or concession. If the state represses a
group, the threat of revolution from that group is contained. However, repression is costly
and destroys a fraction ω ∈ [0, 1) of the elite’s income, leaving them with income per capita
of (1 − ω)ye. The cost of repression increases with the fraction of the non-elite population
repressed. In particular, ω(·) is a function of the fraction of the population repressed such
that ω(0) = 0 and ω′(·) > 0.14 Alternatively, the state can redistribute a lump-sum of the
income of the elite to the non-elite.
In each period that begins with the elite in power, the timing of the game is as follows.
The state decides whether to repress and how much to redistribute. Then, if not already
repressed, the young non-elite and the old non-elite simultaneously decide whether to revolt
or not. Consumption takes place and the period ends.15
12Because y is the income per capita and there is a continuum 1 of agents, the total income of thesociety is also y. The elite receive a share θ of the income, which is distributed equally among them.Because the elite constitute half of the continuum 1 of the total population, the elite’s income per capita is(θy)/(1/2) = θ2y. The income per capita of the non-elite is calculated analogously.
13For simplicity, we assume all revolution attempts succeed. Instead, we could assume that a revolutionsucceeds with probability p(r), where r is the proportion of non-elite who revolt, with p(0) = 0 and p′(·) > 0.The results are robust whenever the elite use repression or redistribution to mitigate the likelihood ofsuccessful revolution, i.e., the elite’s optimization problem has an interior solution.
14The results are robust if we assume that a repression attempt succeeds with some probability q, or ifit is more costly to repress the young than the old.
15The general setup of the model looks similar to that of Acemoglu and Robinson (2006) with theimportant difference that our model features heterogeneous non-elite (the young and the old, and moregenerally, the radicals and the moderates). In addition, our model integrates the concept of policytargetability, analyzing the effects of variations in policy targetability on state response to an increase in
7

For simplicity, we set up the model such that the opportunity cost of revolt is the same
for both the young and the old. Alternatively, one could complicate the model so that the old
have a higher opportunity cost of revolt, e.g., by allowing for saving and investment. How-
ever, this is inconsequential for our results because the incentives depend on the difference
between the benefits and the costs of revolt.
Strategies and Equilibrium. A period strategy for the state consists of a repression pol-
icy and a redistribution policy, mapping histories without a revolution into repression and
redistribution levels. A state strategy is a sequence of period strategies. More formally,
the state’s period strategy in period t is a pair, σet (ht) = (st(ht), Tt(ht)), consisting of a
repression policy st(ht) and a redistribution policy Tt(ht), in which ht is a history that does
not include a revolution. The repression policy st(ht) = (syt (ht), sot (ht)) ∈ {0, 1}2 is a pair,
where sat (ht) is the repression policy targeted at group a ∈ {y, o} that maps a history ht that
does not include a revolution to a decision whether or not to repress group a. sat (ht) = 1
corresponds to repress, and sat (ht) = 0 corresponds to not repress. The redistribution policy
Tt(ht) = (T yt (ht), Tot (ht)) ∈ ∆2
(ye,st)is a pair, where T at (ht) is a function mapping a history ht
that does not include a revolution to a decision of how much to increase group a’s income per
capita, given the set of feasible redistribution policies ∆2(ye,st)
= {(x1, x2) ∈ R2+ | ryx1+rox2 ≤
(1 − ω(syt ry + sotro))ye}. The strategy of group a ∈ {y, o} is a function γat (ht, σ
et ) ∈ {0, 1},
mapping a history ht that does not include a revolution and a state strategy of period t that
does not include repression of group a, i.e., sat = 0, to a decision whether or not to revolt.
γat (ht, σet ) = 1 corresponds to revolt and γat (ht, σ
et ) = 0 corresponds to no revolt.
We focus on stationary strategies in which players use weakly undominated strategies.
The equilibrium concept is stationary, weakly-undominated, subgame perfect Nash equilib-
rium, where stationarity implies that players adopt the same strategies at each date t:
st = s, Tt = T, γot = γo, γyt = γy.
Note that because the initial allocation of the income per capita of all groups and the relative
the population of radical groups.
8

ratio of the elite and non-elite do not change, all period ts that do not start in revolution
are identical except for the history of the game up to t.
Dissidents’ Strategy. To decide whether to revolt or not, the non-elite compare the ex-
pected payoff from revolt, V an(R), a ∈ {y, o}, to that of no revolt, V an(¬R;T ), a ∈ {y, o},
given the redistribution policy of the state T = (T y, T o). Proposition 1 characterizes the
equilibrium behavior of the non-elite.
Proposition 1 In equilibrium, the old revolt if and only if µ < θ− T 0
2y, and the young revolt
if and only if µ < (1 + β)θ − T y+βT 0
2y.
It follows that, absent state repression or concession, the young are willing to pay a higher
cost for revolution than the old. That is, the young are more prone to revolt than the old.
Corollary 1 Under the status quo, i.e., when s = (0, 0) and T = (0, 0), the young are more
prone to revolt than the old. In particular, the young revolt if and only if µ < (1 + β)θ and
the old revolt if and only if µ < θ.
In the rest of this section, we focus on the interesting case when µ < (1 + β)θ, so that
at least some group imposes a threat of revolution that might elicit state response.
State Response. Revolution is the worst outcome for the elite because they receive 0.
Therefore, they choose a combination of repression and redistribution policies to avoid revo-
lution and maximize their income. But feasible policies depend on the institutional settings
that enable the state to target a policy toward a specific group. We analyze the elite’s
decisions under three different institutional settings: (1) Untargeted repression-Untargeted
redistribution, under which the elite cannot target their repression or redistribution policies
at a specific group, that is, sy = so and T y = T o. (2) Untargeted repression-targeted re-
distribution, under which the elite cannot target the repression policy, but can target the
redistribution policy, that is, sy = so and T = (T y, T o). (3) Targeted repression-untargeted
redistribution, under which the elite can target their repression policy, but cannot target
their redistribution policy, that is, s = (sy, so) and T y = T o.
9

Untargeted Repression, Untargeted Concession. Let su = sy = so be the repression
strategy and Tu = T y = T o be the redistribution strategy. From Corollary 1, unless the state
take necessary repression and redistribution policies, the young revolt when µ < (1 + β)θ,
and both the young and the old revolt when µ < θ. If the state represses, the threat of
revolution is contained and the elite get
V e(su = 1, Tu = 0) = (1− ω(1))ye. (1)
Alternatively, the state can implement a redistribution policy. Because T y = T o, from Propo-
sition 1, the minimum transfer that neutralizes the young, denoted by T̂u, is the one that
makes the young indifferent between revolt and no revolt. That is, µ = (1 + β)θ − (1+β)T̂u2y
,
implying
T̂u = (θ − µ
1 + β) 2y. (2)
Because T̂u is increasing in β, and β = 0 for the old, T̂u is also sufficient to neutralize the
old. Moreover, T̂u is a feasible redistribution policy because ye > T̂u. To choose between re-
pression and redistribution, the state compares the corresponding payoffs of the elite. Their
payoff from redistribution at T̂u is
V e(su = 0, Tu = T̂u) = ye − T̂u =µ
1 + β2y. (3)
Hence, the state represses if and only if V e(su = 1;Tu = 0) > V e(su = 0;Tu = T̂u). Substi-
tuting from equations (1) and (3), the state represses if and only if ω(1) < ω̂u, with
ω̂u = − µ
(1 + β)θ. (4)
Proposition 2 formalizes these results.
Proposition 2 In equilibrium, the state represses if ω(1) < ω̂u, and redistributes T̂u other-
wise.
Untargeted Repression, Targeted Concession. The state can discriminately redis-
tribute the income of the elite to the young or the old non-elite, but does not have the
10

means to repress discriminately; that is, repression is untargeted and can only be made
against all the non-elite indiscriminately. Let s ∈ {0, 1} be the state’s repression strategy
and T = (T y, T o) ∈ ∆2(ye,s) be its redistribution strategy. Because the state represents the in-
terests of the elite and revolution is the worst outcome for the elite, the optimization problem
of the state is to maximize the payoff of the elite subject to no revolution. A redistribution
policy (T y, T o) transfers a per-capita amount of ryTy + roT
o from the elite to the non-elite.
If the state represses, s = 1, it costs the elite a fraction ω(1) of their income. Thus, the
optimal policy of the state, denoted by σ̂e, is
σ̂e = arg maxs,(T y ,T o)
(1− s ω(1)) ye − ryT y − roT o
s.t. no revolution
When θ ≤ µ < (1 +β)θ the young impose a threat, but the old do not. In response, the elite
can either repress or redistribute enough to contain the threat of the young. However, the
state indiscriminately represses both the young and the old if it decides to repress. When
µ < θ both the young and the old impose a threat. The elite can either repress them both,
or redistribute to the young and to the old to neutralize their incentives to revolt. In equi-
librium, the elite choose the strategy that yields the highest payoff. Therefore, as the cost of
repression increases, the elite tend to accommodate the non-elite via concession. Proposition
3 characterizes the state’s equilibrium strategy.
Proposition 3 In equilibrium:
• If θ ≤ µ < (1 + β)θ, then the state represses all the non-elite if ω(1) < ω̄y. Otherwise,
the state takes the redistribution policy (T y, T o) = (T̄ y, 0).
• If µ < θ, then the state represses all the non-elite if ω(1) < ω̃. Otherwise, the state
takes the redistribution policy (T y, T o) = (T̃ y, T̃ o),
where ω̄y = ryθ
((1+β)θ−µ), ω̃ = 1− µθ
(1−ryβ), T̄ y = ((1+β)θ−µ)2y, T̃ y = (θ−(1−β)µ)2y,
and T̃ o = (θ − µ)2y.
11

Targeted Repression, Untargeted Concession: The state can discriminately apply
repression against the young or the old, but cannot redistribute discriminately. Let s =
(sy, so) ∈ {0, 1}2 be the state’s repression strategy and T be its redistribution strategy.
As before, when θ ≤ µ < (1 + β)θ the young impose a threat, but the old do not. In
response, the elite can either repress the young or redistribute enough to contain their threat.
However, the redistribution is to the whole non-elite because the elite do not have the insti-
tutions that enable them to only target the young. When µ < θ both the young and the old
impose a threat. The elite can either repress them both, repress the young and redistribute
enough to contain the old, or redistribute at a level that neutralizes the young’s incentive to
revolt. Because redistribution is made to the whole non–elite the latter level of redistribution
is also enough to contain the threat of the old. In equilibrium, the elite choose the strategy
that yields the higher payoff. Proposition 4 characterizes the state’s equilibrium strategy.
Proposition 4 Suppose θ ≤ µ < (1 + β)θ. In equilibrium, the state represses the young if
ω(ry) < ω̂u, otherwise, redistributes at the level T = T̂u. Suppose µ < θ. In equilibrium:
• If ω(1) < ω̂, the state represses all the non-elite provided ω(1)−ω(ry) < ω̂o. Otherwise,
represses only the young and redistributes at the level T = T̂ o.
• If ω(1) ≥ ω̂, the state redistributes at a level T = T̂u with no repression provided
ω(ry) ≥ ω̂y. Otherwise, represses the young and redistributes at the level T = T̂ o,
where ω̂ = 1− µ(1+β)θ
, ω̂o = 1− µθ, ω̂y = µ
θβ
1+β, and T̂ o = (θ − µ)2y.
Policy Targetability and Repression. How does the likelihood of repression change as
the population grows younger? To answer this question, we recognize that the cost of revolu-
tion varies from one country-year to another, and hence we assume that it has a distribution.
We then use the results in Propositions 2, 3, and 4 to investigate how changes in the pro-
portion of the young affect the likelihood that repression is observed. Because the young are
more prone to revolt than the old, one might expect that as the population grows younger the
12

likelihood of repression increases. However, Proposition 5 shows that whether shifts in the
age structure of the population increase or decrease the likelihood of repression hinges on the
institutions of the state that facilitate or hinder targeted repression and targeted concession.
Proposition 5 As the population grows younger: (1) States that use untargeted repression,
but targeted concession are more likely to use repression, but (2) states that use targeted
repression, but untargeted concession are less likely to use repression. Moreover, changes in
the age structure do not change the behavior of the states that use untargeted repression and
untargeted concession.
To formalize the content of Proposition 5, let Puu be the probability of repression under
untargeted repression and concession, Ptu be the probability of repression under targeted re-
pression and untargeted concession, and Put be the probability of repression under untargeted
repression and targeted concession. In equilibrium, Puu(ry) = Puu(r′y), Ptu(ry) ≥ Ptu(r
′y),
and Put(ry) ≤ Put(r′y), for all ry ≤ r′y ∈ (0, 1).
We discussed the intuition in the Introduction. Increases in the proportion of the young
may only make the targetable policy more expensive. Consider the case where the state con-
cession policy can be targeted, but its repression policy cannot. If the state is already using
repression, changes in the age structure do not affect the state policy because repression, be-
ing untargeted, is directed toward the whole non-elite, and hence a change in the age profile
of the non-elite does not change the costs or benefits of repression. However, if the state is
making concessions to the young, increases in the proportion of the young make such con-
cessions more costly because the young are more expensive to be bought. This can make the
state switch from concession to repression. In contrast, when repression is targeted, but con-
cession is not, increases in the proportion of the young has the opposite effect. If the state is
repressing the whole non-elite or conceding to the whole non-elite, increases in the proportion
of the young does not affect the state policy. However, if the state is repressing the young and
conceding to the old, increases in the proportion of the young makes repression more costly.
13

These results imply that increases in the relative size of one group can affect the other’s
welfare by influencing the state’s response. When the state can target repression, but cannot
target redistribution, increases in the fraction of the young may benefit the old because it
may cause the state to switch from repressing the young to redistributing to the whole pop-
ulation at a level that prevents the young’s revolt—which is higher than what the old would
get when the state represses the young and redistributes at a level that prevents the old from
revolting. In contrast, when the state can target redistribution, but cannot target repression,
increases in the fraction of the young may cause the state to switch from redistribution to
untargeted repression, thereby hurting the old. These results resonate with Waldfogel (2003)
and George and Waldfogel (2003) who empirically investigate the effects of changes in minor-
ity group size on the welfare of the majority in media markets with differentiated products.
III POLICY
TARGETABILITY AND REGIME TYPES
Policy targetability refers to the ability of the state to discriminately apply a policy toward
the advocates of a specific group (see footnote 5). State institutions affect the targetability
of policy. For example, a state with strong, professional intelligence and security agencies is
more able to narrowly target repression to specific groups or individuals than a state that
lacks these organizations.16 In this section, we identify some institutions that facilitate or
hinder targeted repression and concession. In particular, parties and legislatures are in-
stitutions that provide the infrastructure for targeted concession, while the institutions of
military regimes facilitate targeted repression.
16The targetability of policy also depends on the structure of society and the nature of policy. Forexample, it is easier to target a policy to a group with a distinct skin color than to target the same policy toa group with certain religious beliefs (structure of the society). In comparison with restrictions on strikes,imposing curfew is more likely to affect the whole population than a specific group. In turn, restrictingstrikes is a less targetable repressive policy than restricting opposition meetings because strikers’ agendamight be local economic issues (with both political activists and non-political workers participating), whilethe agenda of an opposition meeting is political. To ban the latter mostly targets the dissidents, but to banthe former targets both the militant workers and the workers who are only concerned with their day-to-daylife (the nature of the policy).
14

The literature on the political institutions of dictatorships argues that parties and leg-
islatures are the institutions through which states distribute benefits and make policy con-
cessions (Collier 1982; Gandhi 2008; Gandhi and Przeworski 2006; Geddes 2007; Wintrobe
1998). In dictatorships, a “party offers individuals willing to collaborate with the regime a
vehicle for advancing their careers within a stable system of patronage” (Gandhi 2008). “Rul-
ing parties should thus be understood as giant patronage systems” (Magaloni and Kricheli
2010, 128) through which regimes distribute benefits and privileges. “They provide their
officials and activists with benefits that give them a stake in the regime” (Geddes 2007).
For example, Linz (2000) shows that the youth branch of the ruling party in Nazi Germany
and Soviet Russia were institutions that provided the young the opportunity to advance
their careers and ambitions. “A strong party organization is required to acquire information
about citizens’ loyalties” (Magaloni and Kricheli 2010, 128) in order to targetedly distribute
privileges and benefits to co-opt citizens and buy off their support. That is, parties provide
the infrastructure necessary to targetedly redistribute wealth, privileges and benefits.
Legislatures lower the transaction costs of bargaining between the state and oppositions
by providing institutional settings for “controlled bargaining” and communication without
the threat of punishment (Gandhi 2008; Gandhi and Przeworski 2006). In some dictator-
ships such as Jordan, deputies compete for “access to state resources,” and “parliament
is a basis from which one can call upon the ministers and bureaucrats to allocate jobs to
constituents” (Lust-Okar 2006). Legislators are chosen via a combination of vetted election
and selection which allows the regime to make targeted concessions. The Polish Communist
Party’s plan in the late 1980s to allow 25 percent Catholic deputies in the Polish Parliament
is one example. King Hussein’s offer to allow the Muslim Brotherhood in Jordan to influ-
ence educational and religious policies via legislature is another (Gandhi 2008). Therefore,
legislatures in dictatorships provide institutional settings for targeted policy concessions.17
17As Magaloni and Kricheli (2010) discuss in their extensive review, Parties and legislatures in dictator-ships serve other functions too, including deterring the threat of military coup (Geddes 2007) and mitigatingthe principal-agent problem between the leader and his allies (Boix and Svolik 2013).
15

Military regimes are defined as regimes with a military officer as the effective head of
the state (Cheibub et al. 2010; Gandhi and Przeworski 2006). Those who run the state
have close links to military and intelligence agencies, insider information about military and
intelligence procedures, and expertise in coercive measures and intelligence gathering. In
fact, in many countries, domestic intelligence agencies were originally created by military
professionals or formed as a branch of military intelligence first, and separated from the mil-
itary only later.18 These features improve the efficiency of intelligence agencies to identify
dissidents and narrowly direct the repressive measures toward them. The military exper-
tise of the ruling circle and their close connections with military and intelligence agencies
make communications and procedures regarding repression decisions more efficient, and re-
duce principal-agent problems between the government and the military (Acemoglu et al.
2010; Svolik 2013). That is, the ruling circles in military regimes have more control over
the actions of the agents of repression. These institutional settings allow military regimes to
implement targeted repression more effectively than other dictatorships. Moreover, relative
to single-party dictatorships, military regimes have less effective bureaucratic procedures to
targetedly distribute benefits and privileges to co-opt dissidents.
Although most military regimes do not have a state party or a formal legislature, a few
do (Geddes 2007; Gandhi and Przeworski 2006). We thus compare military regimes that
lack party systems (non-partisan military regimes) with single-party regimes that are not
ruled by military officers (non-military single-party regimes). Our arguments suggest that
non-military single-party regimes are more capable of targeted concession than non-partisan
military regimes. In contrast, the non-partisan military regimes are more capable of targeted
repression than non-military single-party ones. In summary, the arguments of this section
together with the implications of our model (Proposition 5) yield two empirical hypotheses:
18For example, the Department of National Intelligence (DINA) in Chile was formed in the 1970s bycombining several independent intelligence agencies of armed forces (Philip 1985). The National Intelligenceand Security Organization (SAVAK) of the Pahlavi regime in Iran was formed in the 1950s mainly bymilitary officers, and although it took over the task of internal security from army intelligence unit, itremained under the command of military officers until the end of the regime (Fardust 1999).
16
Hypothesis 1: In military regimes without a party structure, the younger the population
is, the lower the likelihood of repression.
Hypothesis 2: In non-military single-party regimes, the younger the population is, the
higher the likelihood of repression.
We emphasize that we do not hypothesize that non-partisan military regimes are less
repressive than non-military single-party regimes.19 Instead, our hypotheses are about how
these regime types respond to increases in the proportion of the young. The level of re-
pression in the non-partisan military regimes can be higher than non-military single-party
regimes. However, as the proportion of the young increases, non-partisan military regimes
decrease the level of repression, while non-military single party-regimes increase it.
IV DATA AND EMPIRICS
We test Hypotheses 1 and 2, using country-year data on repression, age structure, and regime
type.20 As our dependent variables, we employ three measures of repression. The first is the
Cingranelli-Richards (CIRI) Physical Integrity Rights Index (Cingranelli et al. 2014). It is
an additive index constructed from the sum of four indicators measuring torture, extraju-
dicial killings, political imprisonment, and disappearance. Each indicator can take on the
values of 0, 1, and 2, corresponding to frequent, occasional, and no occurrence of the respec-
tive violation type. As such, the CIRI index is an ordered variable ranging from 0 (the most
frequent violation of physical integrity rights) to 8 (no violation). We invert the index so that
0 means no violation and 8 means the most frequent violation of physical integrity rights.
As a second measure of repression we use the Political Terror Scales (Gibney, Cornett,
Wood, & Haschke 2014). For each country-year, they assign values on a 5-point ordinal scale.
A score of 1 indicates that a country is under a “secure rule of law, people are not imprisoned
19Indeed, summary statistics for our two samples (Table 1) suggest the opposite.20Summary statistics for our dependent variables and covariates are in Table 1 below. Table 4 in the
Online Appendix lists each country-year’s regime type based on Geddes et al. (2014) and Cheibub et al.(2010). Table 3 in the Online Appendix contains the sources of our data.
17

for their view, and torture is rare or exceptional. Political murders are extremely rare.” By
contrast, a score of 5 implies that “murders, disappearances, and torture are a common part
of life.” Two Political Terror Scales are available. The first (PTS-A) is based on the Amnesty
International’s Annual Reports, and the second (PTS-S) is based on the U.S. State Depart-
ment’s annual Country Reports on Human Rights Practices. We use PTS-S because the
CIRI measure already relies on the Amnesty International reports (Cingranelli et al. 2014).
TABLE 1Summary Statistics
Non-Military Single Party Regimes
Variable Min Max Mean Median Std. Dev.
CIRI 0 8 4.08 4 2.17
PTS-S 1 5 2.77 3 0.94
Civil Liberties 2 7 5.24 5 1.35
Ratio of Young to Old 0.41 1.53 0.92 0.94 0.21
Executive Constraints 1 7 3.09 3 1.45
GDP per capita (log) 5.34 10.52 7.68 7.51 1.08
Population (log) 6.05 14.09 9.11 9.12 1.55
Civil War 0 1 0.14 0 0.35
Intl. War 0 1 0.03 0 0.17
Non-Partisan Military Regimes
Variable Min Max Mean Median Std. Dev.
CIRI 0 8 4.37 4 2.01
PTS-S 1 5 3.00 3 1.00
Civil Liberties 3 7 5.47 5 1.06
Ratio of Young to Old 0.47 1.26 0.97 0.99 0.14
Executive Constraints 1 7 1.67 1 0.98
GDP per capita (log) 5.56 9.91 7.34 7.03 0.93
Population (log) 6.69 12.08 9.07 8.85 1.21
Civil War 0 1 0.22 0 0.41
Intl. War 0 1 0.04 0 0.18
18

To further examine the robustness of our results, we also use the Freedom House Civil
Liberties index as a third measure of repression. This index measures a variety of concepts
grouped into four broad categories: Freedom of expression and belief, associational and or-
ganizational rights, rule of law, and personal autonomy and individual rights. It has a range
from 1 to 7 which we invert, so that 1 is associated with the highest and 7 with the lowest level
of freedom. We recognize that this index is not a good measure of repression defined as state
actions that raise the cost of political protest, but we use it to further check the robustness of
our results that use CIRI and PTS-S measures. In particular, the Civil Liberties index also
measures religious freedom, the treatment of various distinct groups such as LGBT people,
the right to own property, the undue influence of organized crime on private businesses, and
gender equality, choice of marriage partners, and even family size (Freedom House 2014).
Regime type data are from Geddes, Wright, and Frantz (2014) and Cheibub, Gandhi, and
Vreeland (2010). Geddes et al. (2014) categorize dictatorships into single-party, military,
personalist, monarchies, and their hybrids, while in Cheibub et al. (2010), dictatorships are
divided into three types: civilian, military, and monarchy. The Cheibub et al. typology
does not include information on the party structure of regimes, and the typology of Geddes
et al. includes personalist regimes that have a military leader. Therefore, we combine the
information from these two sources. For non-military single-party regimes, we consider all
single-party regimes (and their hybrids) from Geddes et al. that are not military regimes ac-
cording to Cheibub et al. For non-partisan military regimes, we include all military regimes
from Cheibub et al. that are not single-party or single-party hybrid according to Geddes et
al. This procedure excludes single-party-military hybrid regimes for which the theory does
not provide a clear prediction: These regimes have both the infrastructure for targeted redis-
tribution (party structure) and the institutional mechanisms for targeted repression. Which
institutional characteristic dominates and determines the state’s response, depends on the
relative prevalence of relevant institutions and the costs of each response.
To capture the age-structure of the population, we use U.N. population data (United
19

Nations 2013) to construct our measure for the ratio of the young to the old adults. We need
to make a decision where to set the minimum and maximum age. Clearly, it is unreason-
able to include 5-year-olds or 90-year-olds in the analysis as they are irrelevant for political
activities. Ideally, we want to choose the minimum age somewhere in the late teens, which
is about the time when people are socialized into political activities, and the maximum age
around 60 because by then a person’s physical conditions are unlikely to allow political ac-
tivism for most people. However, data are available only for 5-year age groups. For example,
the minimum age can be 10, 15, or 20. The measure used for the results that we present
here is the ratio of the population between 15 and 29 to the population between 30 and 64.
However, we have used three other measures, and the results are robust.21
We control for variables frequently used in the literature (Conrad and Moore 2010; Dav-
enport 2007; Gandhi 2008; Haschke 2014; Henderson 1991, 1993; Mitchell and McCormick
1988; Poe and Tate 1994; Poe, Rost, and Carey 2006; Vreeland 2008): past level of repression,
institutional constraints on the executive branch (from PolityIV, Marshall 2013), income per
capita (real GDP per capita from Penn Tables, Heston et al. 2012), civil war (from PRIO,
Gleditsch et al. 2002), and international war (from COW, Ghosn et al. 2004, Sarkees and
Wayman 2010). Past repression is consistently found to be one of the most important fac-
tors explaining repression. Shadmehr and Bernhardt (2011) and Shadmehr (2015) develop
formal models that imply that past and present levels of repression are correlated because
repression policies have inertia. Constraints on the executive branch limit the abilities of the
state to use coercive measures. Civil war and international war might increase repression
because states faced with threats are more likely to respond with repression (Gurr 1986).
Moreover, some researchers argue that higher income per capita may decrease repression
because it decreases dissent and conflicts over scarce resources among the population (Hen-
derson 1991; Poe and Tate 1994; see Shadmehr (2014) and Haschke (2014) for critiques.).
21In particular, we have used the ratio of the population between 15 and 29 to the population between 30and 59, the ratio of the population between 20 and 29 to the population between 30 and 64, and the ratioof the population between 20 and 29 to the population between 30 and 59.
20

However, empirical results on the effect of income on repression are mixed. For example,
Gandhi (2008) does not find any effect of per capita income on civil liberties. Similarly,
Conrad and Moore (2010) do not find significant effects of income on the likelihood that a
state terminates torture. Overall, as Davenport (2007, 14) summarizes in his review of the
literature, “one does not find a detailed discussion of why economic development wields an
influence or why GNP measures this feature adequately.” We also include time dummies to
capture any trends that affect all countries, for example, an increase in the global culture
for defending human rights, the collapse of communism, US foreign policy, and the like.
Because of the ordered nature of the dependent variables, CIRI, PTS-S, and Civil Lib-
erties, we use ordered probit models to test our hypotheses.22 In particular, let r∗it be the
latent continuous variable that captures repression, ait be the ratio of the young (between
15 and 29) to the old (between 30 and 64), and xit be the vector of covariates. Then,
r∗it =M∑c=m
δc dcit−1 + αait + x′itβ + µt + εit,
rit = c if sj−1 < r∗it ≤ sj, j = m, ...,M,
where dcit−1 is a binary indicator that take on 1 when the value of the lagged repression mea-
sure rcit−1 is c, and is 0 otherwise.23 Finally, µt’s denote a full set of time effects that capture
common shocks, and εit’s are the idiosyncratic errors. To test Hypothesis 1, we estimate the
models on the sample of non-partisan military regimes. To test Hypothesis 2, we estimate
them on the sample of non-military single-party regimes. Tables 2 and 3 present the results.24
The coefficient of our variable of interest, the ratio of young to old, has the expected sign
in all regressions. Among the four regressions that use our two main measures of repression,
CIRI and PTS-S, the coefficient of age ratio is significant at the 5% level in two and at 10%
22We also estimate OLS models. The results are reported in Tables 1 and 2 in the Online Appendix andare qualitatively the same as the ordered probit models.
23For CIRI, m = 0 and M = 8. For PTS-S, m = 1 and M = 5. For Civil Liberties m = 1 and M = 7.24We considered fixed effect specifications, but did not perform them because several control variables
such as the lags, executive constraints, and GDP per capita do not satisfy the strict exogeneity assumptionrequired for the consistency of the common fixed effect estimators. Generally, accounting for unobservedheterogeneity in dynamic models is difficult. In particular, the common MLE generates inconsistentcoefficients in dynamic probit models (Wooldridge 2002, 493-6).
21

TABLE 2Non-Military Single-Party Regimes
Regressor CIRI PTS-S Civil Liberties0–8 1–5 1–7
Ratio of Young to Old 0.59∗∗ 0.49∗ 0.13(0.29) (0.29) (0.32)
Executive Constraints −0.07∗∗ −0.09∗∗ −0.24∗∗
(0.03) (0.03) (0.04)
GDP per capita (log) 0.02 0.04 −0.05(0.06) (0.05) (0.06)
Population (log) 0.22∗∗ 0.18∗∗ 0.12∗∗
(0.04) (0.04) (0.04)
Civil War 0.27∗∗ 0.48∗∗ 0.29∗∗
(0.13) (0.13) (0.14)
Intl. War 0.03 0.02 0.44∗
(0.20) (0.22) (0.24)
N 505 614 780pseudo-R2 0.98 0.97 0.98
Time Dummies yes yes yes
Lagged Dep. Variable yes yes yes
Shown are coefficients for ordered probit regressions and standard errors in paren-theses; ∗∗ indicates significance at p < 0.05, ∗ indicates significance at p < 0.1.
level in another model. In particular, in the sample of non-military single-party regimes, the
coefficient on the ratio of the young to old is positive, indicating that the younger is the pop-
ulation, the higher is the likelihood of repression. In contrast, in the sample of non-partisan
military regimes, this coefficient is negative, indicating that the younger is the population,
the lower is the likelihood of repression. Given the wide range of concepts measured by the
Civil Liberties index, it is not surprising that the age ratio coefficient is not significant.
To gauge the magnitude of the effect of changes in age ratio on the likelihood of repres-
sion, first, consider non-partisan military regimes. Keeping the control variables at their
medians, raising the age ratio from its median by one standard deviation reduces the prob-
22

TABLE 3Non-Partisan Military Regimes
Regressor CIRI PTS-S Civil Liberties0–8 1–5 1–7
Ratio of Young to Old −0.34 −1.35∗∗ −0.53(0.65) (0.63) (0.54)
Executive Constraints −0.11∗ −0.15 −0.32∗∗
(0.07) (0.07) (0.07)
GDP per capita (log) 0.14∗∗ 0.08 −0.18∗∗
(0.07) (0.07) (0.07)
Population (log) 0.14∗∗ 0.14∗∗ −0.13∗∗
(0.05) (0.05) (0.05)
Civil War 0.34∗∗ 0.25 0.40∗∗
(0.17) (0.18) (0.19)
Intl. War −0.01 0.19 0.95∗∗
(0.42) (0.39) (0.41)
N 343 406 551pseudo-R2 0.93 0.91 0.93
Time Dummies yes yes yes
Lagged Dep. Variable yes yes yes
Shown are coefficients for ordered probit regressions and standard errors in paren-theses; ∗∗ indicates significance at p < 0.05, ∗ indicates significance at p < 0.1.
ability of repression by 2.4% from 31.4 to 29.0.25 Next, consider non-military single-party
regimes. Keeping the control variables at their median, raising the age ratio from its median
by one standard deviation increases the probability of repression by 4.7% from 23.8 to 28.5.
As expected, past repression, larger populations, and civil war are associated with higher
levels of repression, while constraints on the executive branch decrease repression. GDP per
capita is significant only in a subset of models and in four instances has a positive sign,
indicating that an increase in per capita income increases the likelihood of repression. A
possible explanation is that regimes may trade off between economic performance and polit-
25When using the CIRI measure of repression (which ranges from 0 to 8), we say the state uses repressionin a country-year when its CIRI measure is above 4. Qualitatively similar results obtain if we include 4, orif we repeat this excercise for the PTS-S measure of repression.
23

ical freedoms to maximize their survival: In poor economic contexts, regimes substitute poor
economic performance by being more politically accommodating. For example, the Pahlavi
regime raised repression in the mid-1970s in the midst of the oil boom. These years were the
heyday of the regime’s intelligence agency (SAVAK) and dissent activities were severely pun-
ished. However, in the late 1970s when the “overheated” economy slowed down and inflation
skyrocketed, the regime allowed limited liberalization, tolerated some opposition activities,
tamed SAVAK, and freed some political prisoners (Abrahamian 1982; Milani 2011).
V STATE RESPONSE
IN SOVIET SATELLITE STATES IN THE 1980S
In the late 1980s, the Soviet regime announced that it would not intervene in the internal
affairs of its satellite states, implying that if these regimes were toppled, Moscow would not
seek to restore them. In response, dissidents in the East European communist countries
mobilized, demanding political and economic reforms. However, the state’s response varied
across different countries: in some, the state initiated reforms (e.g., Hungary), while in others,
the state responded with severe repression (e.g., Romania). Our model provides insights to
explain these variations. Because these regimes were non-military single-party regimes, our
model predicts state responses to be more repressive in countries with younger populations.26
In Hungary, the state initiated reform. There were two main instances of popular protest
(the demonstrations of March and June of 1988) that led to some arrests by the police. But
even then, the state was accommodating as the official media reported the events, and later
the government sanctioned ceremonial events to praise Imre Nagy, the leader of the 1956
Hungarian anti-Soviet revolution that ended in Soviet invasion and the execution of Nagy.
The following two years, leading up to democratic elections in 1990, witnessed continuous re-
forms backed by some demonstrations and strikes. However, by mid 1988, prolonged protest
26This section is not a test of any of our hypotheses as we do not control for many other factors thatinfluenced the outcome in these countries. It is rather an illustration of the explanatory power of the modelthat provides insights (not complete answers) to explain variations in states’ responses to dissent.
24

was no longer necessary to force the state to accommodate the dissidents’ demands.
The Bulgarian state under Zhivcov was quite repressive. The opposition organized
demonstrations in October and November 1989 around the issue of political reform that
led to the replacement of Zhivcov by Mladenov with the promise of reform. From that point,
the state gradually reformed until the democratic parliamentary election of June 1990. The
opposition organized some demonstrations, but the replacement of Zhivcov by Mladenov was
the sign of the regime’s essential agreement to democratize.
Poland moved step by step toward democracy, and each serious step made possible by
popular protest. Opposition activities accelerated in 1987, leading to clashes with police in
the demonstrations of May 1987. In April and August 1988, a wave of strikes and demonstra-
tions broke out “which were only brought to an end with the promise of negotiations between
the authorities, the Catholic Church, and representatives of Solidarity” (White 2001). Al-
though Rakowski replaced Messner as the new prime minister in the Fall, he offered only
selective negotiations with the “constructive oppositions,” not “aggressive anti-communists.”
The party plenum was even against union pluralism as late as January 1989. When the regime
offered negotiation with opposition, it was conditional on Solidarity accepting to be “a part
of socialism.” The regime conceded to parliamentary elections, but 65 percent of the seats in
the lower house were reserved for the ruling party and its allies. Even after the total victory of
Solidarity in the June elections, Jeruzelski, the president and the head of state, attempted to
install a communist prime minister. Only further threat of popular protest and the defection
of the regime’s allies forced the regime to submit to a non-communist prime minister.
The communist regime in Czechoslovakia vigorously resisted political reforms. Authori-
ties repeatedly refused negotiations with the opposition, deploying security forces to contain
frequent demonstrations. Finally, widespread, massive, prolonged demonstrations and strikes
forced the regime to give in to the opposition’s demands for democratization. In Stokes’s
words (1993), it was “massive gatherings of hundreds of thousands of citizens on an almost
daily basis” that “pushed the Communists aside” in Czechoslovakia.
25

TABLE 4Age Ratios in Eastern Europe in the late 1980s
Country (15 to 29)/(30 to 64) (20 to 29)/(30 to 64)
Hungary 0.43 0.27
Bulgaria 0.45 0.29
Czechoslovakia 0.49 0.31
Poland 0.49 0.32
Romania 0.52 0.33
Shown are the ratios of the young to the old population for East Europeancommunist countries in the late 1980s. The numbers are the average ofyears 1988, 1989, and 1990.
The Romanian regime never fully conceded. Ceaus,escu was only willing to respond
with repression, threatening to create another Tienanmen Square. The result was a bloody
revolution. Even after Ceaus,escu’s execution, the new regime, which mostly consisted of
communists, was not open to democracy. The National Salvation Front that took charge
after the revolution committed election fraud and granted only limited political liberties.
This brief overview suggests that, ranking from the most accommodating response to the
most repressive response, Hungary ranks first, followed by Bulgaria, Poland, Czechoslovakia,
and Romania. There are some reservations as to whether Poland should be ranked more re-
pressive than Czechoslovakia: There were more popular protests in Czechoslovakia, however
in Poland, the regime did not fully democratize, reserving a majority of the seats in the Sejm
for the ruling party. This ranking is consistent with White’s (2001) categorization of the
1989 revolutions. He argues that transitions in Hungary and Bulgaria were “transitions from
above” and those of Poland, Czechoslovakia, and Romania were “transitions from below.”
In the former group, regimes initiated reforms, while in the latter, they were overthrown by
popular protests. White’s categorization is an alternative way to capture the tendency of
these regimes toward taking repressive or accommodating responses to popular pressure.
Table 4 shows the average of the ratio of the young to the old in these countries for the
26

three contentious years of 1988, 1989, and 1990. We use two measures: the ratio of popula-
tion between 15 and 29 to those between 30 and 64, and the ratio of population between 20
to 29 to those between 30 and 64. By both measures, Hungary had the oldest population,
followed by Bulgaria, Czechoslovakia and Poland, and Romania. This is the same pattern
that emerged from our analysis of state response to dissent in these countries in the late
1980s: the younger is the population, the higher is the likelihood of repression.
VI CONCLUSION
We develop a simple model to analyze the effects of age structure on state response to dissent.
Both the young and the old pay the costs of attempting to change the status quo. However,
the young benefit from a successful revolution for a longer period of time, and hence have
more incentive to revolt. As the population grows younger, the potential for social unrest
increases. However, whether this leads to reform or repression depends on state response to
the increase in the threat of revolution. We show that state response hinges on whether the
state can discriminately target repression or concession. Remarkably, when the state can
target repression, but not concession, the likelihood of repression decreases as the proportion
of more radical group increases—as the population grows younger. In contrast, when the
state can target concession, but not repression, the likelihood of repression increases.
In the real world, states use a combination of imperfectly targeted repression and con-
cession policies. Our key step in bringing the model to the data is that some institutions
facilitate targeted repression, while others facilitate targeted concession. Drawing on the lit-
erature on dictatorships, we argue that state parties provide the infrastructure that facilitate
targeted concessions, while the institutional settings of military regimes facilitate targeted
repression. Therefore, military regimes without state parties closely represent regimes that
can target repression, but not concession. In contrast, non-military single-party regimes
closely represent regimes that can target concession, but not repression. Thus, two empirical
hypotheses emerge: (1) In military regimes without a party structure, the younger the popu-
27

lation is, the lower the likelihood of repression; and (2) in non-military single-party regimes,
the younger the population, the higher the likelihood of repression.
We test these hypotheses by combining regime-type data from Cheibub et al. (2010) and
Geddes et al. (2014) and using three different measures of repression: the CIRI Physical
Integrity Rights Index (Cingranelli et al. 2014), the Political Terror Scales (Gibney et al.
2014), and the Freedom House Civil Liberties index. To further underscore the relevance of
our theoretical results for the real world, we apply the model to explain the variations in
state response to dissent in East European communist regimes in the late 1980s. We provide
an original case study that ranks state response in these regimes in the late 1980s from
most repressive to most accommodating. We show that, in countries with younger popula-
tions, states resisted reforms and democratization more forcefully and used more repressive
measures against the dissidents.
We end by highlighting that our model can be extended to settings in which citizens
are divided along other characteristics such as religion and ethnicity as long as the resulting
groups have similar demands, and one group is more radical than the other. In such settings,
too, as the size of the more radical group increases, states that can target repression, but
cannot target concession, are less likely to use repression.
APPENDIX
Proof of Proposition 1: Let V an(R), a ∈ {y, o}, be the group a non-elite’s expected
payoff from revolt, and let V an(¬R;T ) be their expected payoff from no revolt given the
state’s redistribution strategy T . Then,
V on(R) = (1− µ)2y, V on(¬R;T ) = γy((1− µ)2y) + (1− γy)((1− θ)2y + T o),
V yn(R) = (1− µ)2y + β2y = (1 + β − µ)2y,
28

V yn(¬R;T ) = γo{(1− µ)2y + β2y}
+(1− γo) {(1− θ)2y + T y + β [γo(1− µ)2y + (1− γo)((1− θ)2y + T o)]}
= γo(1 + β)(1− µ)2y + (1− γo)((1 + β)(1− θ)2y + T y + βT o). (5)
Each group revolt if and only if their expected payoff from revolt exceeds that of no revolt, i.e.,
γa(T ) = 1 if and only if V an(R) > V an(¬R;T ). Because we focus on weakly-undominated
strategies, the payoffs in (5) are simplified to:
V on(R) = (1− µ)2y, V on(¬R;T ) = (1− θ)2y + T o,
V yn(R) = (1 + β − µ)2y, V yn(¬R;T ) = (1 + β)(1− θ)2y + T y + βT o.
Thus, the old revolt if and only if (1 − µ)2y > (1 − θ)2y + T o, and the young revolt if and
only if (1 + β − µ)2y > (1 + β)(1− θ)2y + T y + βT o. Rearranging yields the results. �
Proof of Proposition 3: If θ ≤ µ < (1 + β)θ, from Corollary 1, only the young revolt
under the status quo. In equilibrium, the state chooses between: (1) repress all the non-elite
and do not redistribute, i.e., s = 1 and T = (0, 0); and (2) redistribute at a level, T̄ , just
enough to neutralize the young, i.e., s = 0 and T = T̄ = (T̄ y, T̄ o). T̄ is the transfer that
makes the young indifferent between revolt and no revolt, i.e., V yn(R) = V yn(T̄ ), that is,
(1 + β − µ)2y = yn + T̄ y + β(yn + T̄ o), which is simplified to
((1 + β)θ − µ) 2y = T̄ y + βT̄ o. (6)
Because β < 1, T̄ o = 0. Thus, from equation (6),
T̄ y = ((1 + β)θ − µ) 2y. (7)
Hence, the optimization of the state is simplified to
σ̂e = arg maxs,T
(1− ω(1)) ye − ryT y − roT o s.t. (s, T ) ∈ {(0, (T̄ y, 0)), (1, (0, 0))}.
Moreover, V e(0, (T̄ y, 0)) < V e(1, (0, 0)) if and only if ye− ryT̄ y < (1− ω(1))ye. Substituting
from equation (7) and rearranging, this inequality is equivalent to ω(1) < ryθ
((1 + β)θ− µ).
29

Define ω̄y ≡ ryθ
((1 + β)θ − µ). Then,
σ̂e =
{(1, (0, 0)) ; ω < ω̄y
(0, (T̄ y, 0)) ; otherwise
If µ < θ, from Corollary 1, both the young and the old revolt under the status quo. In
equilibrium, the state chooses between: (1) repress all the non-elite and do not redistribute,
i.e., s = 1 and T = (0, 0); (2) do not repress, i.e., s = 0, and redistribute to the young and
to the old at minimum levels that neutralize both groups, i.e., T = (T̃ y, T̃ o). Clearly, T̃ o is
derived by setting β = 0 in equation (2)
T̃ o = (θ − µ)2y. (8)
From equation (6), T̃ y + βT̃ o = ((1 + β)θ − µ) 2y, thus,
T̃ y = ((1 + β)θ − µ) 2y − β(θ − µ)2y = (θ − (1− β)µ)2y. (9)
Therefore, the optimization problem of the state is simplified to
σ̂e = arg maxs,T
V e(s, (T y, T o)), s.t. (s, T ) ∈ {(0, (T̃ y, T̃ o)), (1, (0, 0))}.
V e(1, (0, 0)) > V e(0, (T̃ y, T̃ 0)) if and only if (1 − ω(1))ye < ye − ryT̃ y − roT̃ o. Substituting
from equations (8) and (9) and rearranging, this inequality is equivalent to 1− µθ(1−ryβ) < ω̃,
where ω̃ is defined as ω̃ ≡ 1− µθ(1− ryβ). Thus,
σ̂e =
{(1, (0, 0)) ; ω(1) < ω̃
(0, (T̃ y, T̃ o)) ; otherwise �
Proof of Proposition 4: Define r = syry + soro. The optimization problem of the state is
σ̂e = arg maxs,T
(1− ω(r)) ye − T s.t. no revolution.
If θ ≤ µ < (1 + β)θ, from Corollary 1, the young revolt under the status quo, but
the old do not. Because repression is costly the state does not repress the old. Thus, the
optimization problem of the state is analogous to the one discussed in Proposition 2.
30
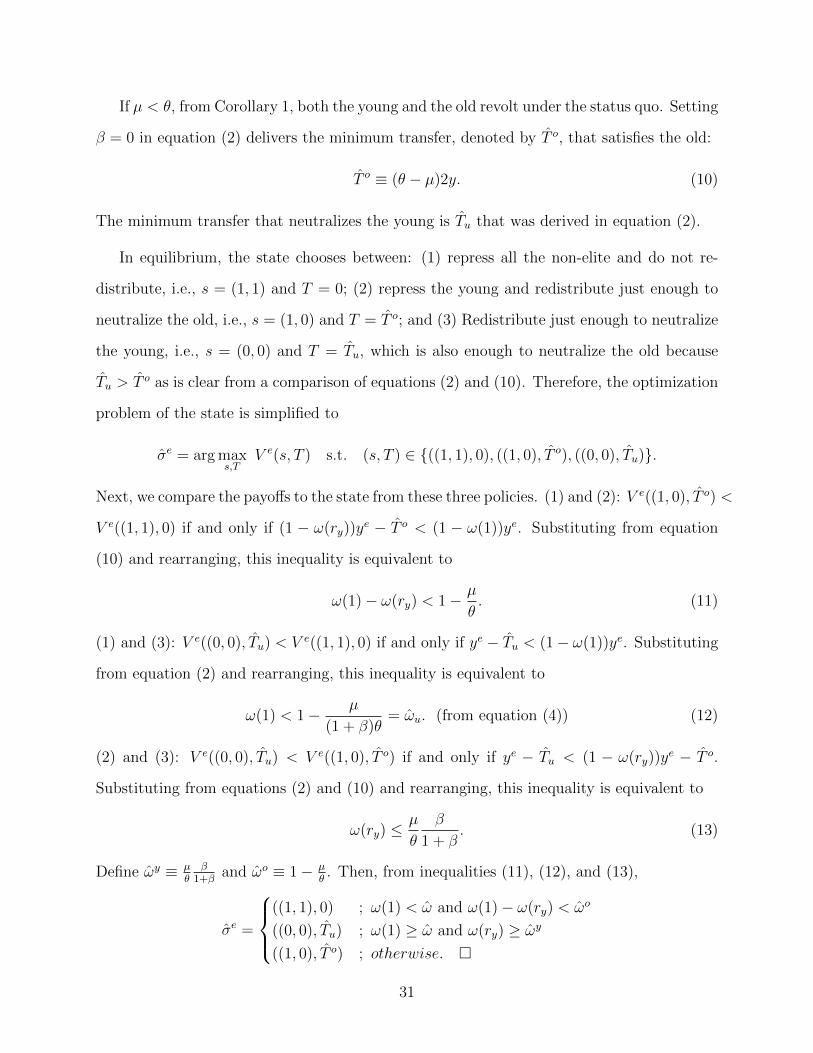
If µ < θ, from Corollary 1, both the young and the old revolt under the status quo. Setting
β = 0 in equation (2) delivers the minimum transfer, denoted by T̂ o, that satisfies the old:
T̂ o ≡ (θ − µ)2y. (10)
The minimum transfer that neutralizes the young is T̂u that was derived in equation (2).
In equilibrium, the state chooses between: (1) repress all the non-elite and do not re-
distribute, i.e., s = (1, 1) and T = 0; (2) repress the young and redistribute just enough to
neutralize the old, i.e., s = (1, 0) and T = T̂ o; and (3) Redistribute just enough to neutralize
the young, i.e., s = (0, 0) and T = T̂u, which is also enough to neutralize the old because
T̂u > T̂ o as is clear from a comparison of equations (2) and (10). Therefore, the optimization
problem of the state is simplified to
σ̂e = arg maxs,T
V e(s, T ) s.t. (s, T ) ∈ {((1, 1), 0), ((1, 0), T̂ o), ((0, 0), T̂u)}.
Next, we compare the payoffs to the state from these three policies. (1) and (2): V e((1, 0), T̂ o) <
V e((1, 1), 0) if and only if (1 − ω(ry))ye − T̂ o < (1 − ω(1))ye. Substituting from equation
(10) and rearranging, this inequality is equivalent to
ω(1)− ω(ry) < 1− µ
θ. (11)
(1) and (3): V e((0, 0), T̂u) < V e((1, 1), 0) if and only if ye − T̂u < (1− ω(1))ye. Substituting
from equation (2) and rearranging, this inequality is equivalent to
ω(1) < 1− µ
(1 + β)θ= ω̂u. (from equation (4)) (12)
(2) and (3): V e((0, 0), T̂u) < V e((1, 0), T̂ o) if and only if ye − T̂u < (1 − ω(ry))ye − T̂ o.
Substituting from equations (2) and (10) and rearranging, this inequality is equivalent to
ω(ry) ≤µ
θ
β
1 + β. (13)
Define ω̂y ≡ µθ
β1+β
and ω̂o ≡ 1− µθ. Then, from inequalities (11), (12), and (13),
σ̂e =
((1, 1), 0) ; ω(1) < ω̂ and ω(1)− ω(ry) < ω̂o
((0, 0), T̂u) ; ω(1) ≥ ω̂ and ω(ry) ≥ ω̂y
((1, 0), T̂ o) ; otherwise. �
31

Proof of Proposition 5: Define I1 ≡ [θ, (1 + β)θ], I2 ≡ [0, θ]. From Proposition 2, T̂u
and ω̂u are independent of ry, and hence Puu(ry) = Puu(r′y). Let Put(rep|µ ∈ Ii) be the
probability of repression conditional on µ ∈ Ii, i ∈ {1, 2}, under untargeted repression and
targeted concession. From Proposition 3,
Put(rep|µ ∈ I1) = Pr(ω < ω̄y|µ ∈ I1) = Pr(ω <ryθ
((1 + β)θ − µ)|µ ∈ I1)
=Pr(µ < (1 + β − ω
ry)θ, µ ∈ I1)
Pr(µ ∈ I1)=Pr(θ ≤ µ < min{(1 + β − ω
ry)θ, (1 + β)θ})
Pr(µ ∈ I1)
=Pr(θ ≤ µ < (1 + β − ω
ry)θ)
Pr(µ ∈ I1), and (14)
Put(rep|µ ∈ I2) = Pr(ω < ω̃|µ ∈ I2) = Pr(ω < 1− µ
θ(1− ryβ)|µ ∈ I2)
= Pr
(µ <
1− ω1− ryβ
θ
∣∣∣∣µ ∈ I2) =Pr(µ < 1−ω
1−ryβ θ, µ ∈ I2)Pr(µ ∈ I1)
=Pr(µ < θ min{ 1−ω
1−ryβ θ, θ})Pr(µ ∈ I2)
. (15)
Thus, from equations (14), and (15),
Put = Put(rep|µ ∈ I1)Pr(µ ∈ I1) + Put(rep|µ ∈ I2)Pr(µ ∈ I2)
= Pr
(θ ≤ µ < (1 + β − ω
ry)θ
)+ Pr
(µ < θmin{ 1− ω
1− ryβ, 1}). (16)
From equation (16), Put is increasing in ry.
Similarly, Ptu = Prtu(rep|µ ∈ I1)Pr(µ ∈ I1) + Prtu(rep|µ ∈ I2)Pr(µ ∈ I2). From
Proposition 4,
Ptu(rep|µ ∈ I1) = Pr(ω(ry) < ω̂u|µ ∈ I1) = Pr(ω(ry) < 1− µ
(1 + β)θ|µ ∈ I1)
= Pr(µ < (1 + β)θ(1− ω(ry))|µ ∈ I1) =Pr(µ < (1 + β)θ(1− ω(ry)), µ ∈ I1)
Pr(µ ∈ I1)
=Pr(θ ≤ µ < min{(1 + β)θ(1− ω(ry)), (1 + β)θ})
Pr(µ ∈ I1)
=Pr(θ ≤ µ < (1 + β)θ(1− ω(ry)))
Pr(µ ∈ I1), and (17)
32

Ptu(rep|µ ∈ I2) = 1− Pr(ω(1) ≥ ω̂, ω(ry) ≥ ω̂y|µ ∈ I2)
= 1− Pr(ω(1) ≥ 1− µ
(1 + β)θ, ω(ry) ≥
µ
θ
β
1 + β
∣∣∣∣µ ∈ I2)= 1−
Pr(µ ≥ (1− ω(1))(1 + β)θ, µ ≤ 1+ββθω(ry), µ ∈ I2)
Pr(µ ∈ I2)
= 1−Pr((1− ω(1))(1 + β)θ ≤ µ ≤ min{1+β
βθω(ry), θ})
Pr(µ ∈ I2). (18)
From equations (17) and (18), Ptu(rep|µ ∈ I1) and Ptu(rep|µ ∈ I2) are decreasing in ry.
Thus, the unconditional probability of repression, Ptu, is also decreasing in ry. �
REFERENCES
Abrahamian, Ervand. 1982. Iran between Two Revolutions. Princeton, NJ: Princeton Uni-versity Press.
Acemoglu, Daron and James Robinson. 2001. “A Theory of Political Transition.” AmericanEconomic Review 91: 938-63.
Acemoglu, Daron and James Robinson. 2006. Economic Origins of Dictatorship and Democ-racy. New York: Cambridge University Press.
Acemoglu, Daron, Davide Ticchi, and Andrea Vindigni. 2010. “A Theory of Military Dic-tatorships.” American Economic Journal: Macroeconomics 2: 1-42.
Besley, Timothy, and Torsten Persson. 2011. “The Logic of Political Violence.” QuarterlyJournal of Economics 126: 1411-45.
Boix, Charles. 2003. Redistribution and Democracy. New York: Cambridge University Press.
Boix, Charles, and Milan Svolik. 2013. “The Foundations of Limited Authoritarian Gov-ernment: Institutions and Power-Sharing in Dictatorships.” Journal of Politics 75: 300-16.
Brunborg, Helge, Ewa Tabeau, and Henrik Urdal, eds. 2006. The Demography of ArmedConflict. Berlin: Springer.
Buechler, Steven M. 2004. “The Strange Career of Strain and Breakdown Theories of Col-lective Action.” In The Blackwell Companion to Social Movements. Ed. by David A. Snow,Sarah A. Soule, and Hanspeter Kriesi. Malden, MA: Blackwell Publishing Ltd.
Bueno de Mesquita, Ethan. 2010. “Regime Change and Revolutionary Entrepreneurs.”American Political Science Review 104: 446-66.
Buenrostro, Lucia, Amrita Dhillon, and Myrna Wooders. 2007. “Protests and Reputation.”International Journal of Game Theory 35: 353-77.
Chamley, Christophe. 1999. “Coordinating Regime Switches.” Quarterly Journal of Eco-nomics 114: 869-905.
33

Casper, Brett, and Scott Tyson. 2014. “Popular Protest and Elite Coordination in a Coupd’etat.” Journal of Politics 76: 548-64.
Cheibub, Jose A., Jennifer Gandhi, and James R. Vreeland. 2010. “Democracy and Dicta-torship Revisited.” Public Choice 143: 67-101.
Chen, Heng, Yang K. Lu, and Wing Suen. 2014. “The Power of Whispers: A Theory ofRumor, Communication and Revolution.” International Economic Review. Forthcoming.
Chen, Jidong, and Yiqing Xu. 2014. “On Deliberative Authoritarian Governance.” Mimeo.
Choucri, Nazli. 1984. Multidisciplinary Perspectives on Population and Conflict. Syracuse,NY: Syracuse University Press.
Cingranelli, David L., David L. Richards, and K. Chad Clay. 2014. The CIRI Human RightsDataset Version 2014.04.14. http://www.humanrightsdata.com
Collier, Ruth B. 1982. Regimes in Tropical Africa: Changing Forms of Supremacy, 1945-1975. Los Angeles and Berkeley: University of California Press.
Collier, Paul. 2000. “Doing Well Out of War: An Economic Perspective.” In Greed andGrievance: Economic Agendas in Civil Wars ed. by Mats Berdal and David M. Malone.Boulder, CO: Lynne Rienner.
Conrad Courtenay R., and Will H. Moore. 2010. “What Stops the Torture?” AmericanJournal of Political Science 54: 459-76.
Davenport, Christian. 2007. “State Repression and Political Order.” Annual Review ofPolitical Science, 10: 1-23.
DeNardo, James. 1985. Power in Numbers: The Political Strategy of Protest and Rebellion.Princeton, NJ: Princeton University Press.
Dunning, Thad. 2008. Crude Democracy: Natural Resource Wealth and Political Regimes.New York, NY: Cambridge University Press.
Edmond, Chris. 2013. “Information Manipulation, Coordination and Regime Change.”Review of Economic Studies 80: 1422-58.
Egorov, Georgy, Sergei Guriev, and Konstantin Sonin. 2009. “Why Resource-poor DictatorsAllow Freer Media: A Theory and Evidence from Panel Data.” American Political ScienceReview 103: 645-68.
Ellis, Christopher J., and John Fender. 2011. “Information Cascades and RevolutionaryRegime Transitions.” Economic Journal 121: 763-92.
Ellis, Christopher J., and John Fender. 2014. “Public Sector Capital and the Transitionfrom Dictatorship to Democracy.” The Manchester School 82: 322-46.
Epstein, David, Bahar Leventoglu, and Sharyn O’Halloran. 2012. “Minorities and Democ-ratization.” Economics and Politics 24: 259-78.
Fardust, Hussein. 1999. The Rise and Fall of Pahlavi Dynasty: Memoirs of Former GeneralHussein Fardust. trans. by Ali Akbar Dareini. India: Motilal Banarsidass.
Fearon, James. 2011. “Self-enforcing Democracy.” Quarterly Journal of Economics 126:1661-1708.
34

Freedom House. 2014. Freedom in the World 2014 Washington, D.C. www.freedomhouse.org
Gandhi, Jennifer. 2008. Political Institutions Under Dictatorship. New York: CambridgeUniversity Press.
Gandhi, Jennifer and Adam Przeworski. 2006. “Cooperation, Cooptation, and RebellionUnder Dictatorships.” Economics and Politics, 18: 1-26.
Geddes, Barbara. 2007. “Why Parties Are Created after Authoritarian Seizures of Power?”Paper presented at APSA annual meeting, Chicago, IL, Aug 30, 2007.
Geddes, Barbara, Joseph Wright, and Erica Frantz. 2014. “Autocratic Breakdown andRegime Transitions: A New Data Set.” Perspectives on Politics 12: 313-31.
George, Lisa, and Joel Waldfogel. 2003. “Who Affects Whom in Daily Newspaper Markets?”Journal of Political Economy 111: 765-84.
Ghosn, Faten, Glenn Palmer, and Stuart Bremer. 2004. “The MID3 Data Set, 1993-2001:Procedures, Coding Rules, and Description.” Conflict Management and Peace Science 21:133-54.
Gibney, Mark, Linda Cornett, Reed Wood, & Peter Haschke. 2014. The Political TerrorScales 1976-2014. http://www.politicalterrorscale.org.
Ginkel, John, and Alastair Smith. 1999. “So You Say You Want a Revolution: A GameTheoretic Explanation of Revolution in Repressive Regimes.” Journal of Conflict Resolution43: 291-316.
Gleditsch, Nils Petter, Peter Wallensteen, Mikael Eriksson, Margareta Sollenberg, and HavardStrand. 2002. “Armed Conflict 1946-2001: A New Dataset.” Journal of Peace Research 39:615-37.
Goldstone, Jack A. 1991. Revolution and Rebellion in the Early Modern World. Universityof California Press.
Goldstone, Jack A. 2001. “Demography, Environment, and Security.” In EnvironmentalConflict, ed. by Paul F. Diehl and Nils P. Gleditsch, 84-108. Boulder, CO: Westview.
Goodwin, Jeff. 2001. No Other Way Out: States and Revolutionary Movements, 1945-1991.New York, NY: Cambridge University Press.
Gurr, Ted R. 1970. Why Men Rebel? Princeton, NJ: Princeton University Press.
Gurr, Ted Robert. 1986. “The Political Origins of State Violence and Terror: A Theoret-ical Analysis.” In Government Violence and Repression, ed. Michael Stohl and George A.Lopez. New York, NY: Greenwood Press pp. 45-72.
Haschke, Peter. 2014. Democracy and the Human Right to the Physical Integrity of thePerson (Unpublished doctoral dissertation). University of Rochester, Rochester, NY.
Henderson, Conway W. 1991. “Conditions Affecting the Use of Political Repression.” Jour-nal of Conflict Resolution 35: 120-42.
Henderson, Conway W. 1993. “Population Pressure and Political Repression.” Social Sci-ence Quarterly, 74: 322-33.
Heston, Alan, Robert Summers, and Bettina Aten. 2012. “Penn World Table Version 7.1”Center for International Comparisons of Production, Income and Prices at UPenn.
35
Hollyer, James R., Peter B. Rosendorff, and James R. Vreeland. 2015. “Transparency,Protest and Political (In)Stability.” Forthcoming in American Political Science Review.
Lane, David. 1975. The Roots of Russian Communism: A Social and Historical Study ofRussian Social-Democracy 1898-1907. University Park, PA: Penn State Univ. Press.
Leventoglu, Bahar. 2005. “Social Mobility and Political Transitions.” Journal of TheoreticalPolitics 17: 465-96.
Linz, Juan J. 2000. Totalitarian and Authoritarian Regimes. Boulder, CO: Lynne Rienner.
Lipset, Seymour M. 1971. “Youth and Politics.” In Contemporary Social Problems, ed. byRobert K. Merton and Robert Nisbet. Harcourt Brace Jovanovich, INC.
Lipset, Seymour M. and G. M. Schaflander. 1971. Passion and Politics: Student Activismin America. Boston: Little Brown and Company.
Lohmann, Susanne. 1994. “The Dynamics of Informational Cascades: The Monday Demon-strations in Leipzig, East Germany 198991.” World Politics 47: 42-101.
Lust-Okar, Ellen. 2006. “Elections under Authoritarianism: Preliminary Lessons from Jor-dan.” Democratization 13: 456-71.
MacCulloch, Robert Jack. 2005. “Income Inequality and the Taste for Revolution.” Journalof Law and Economics 48: 93-123.
Magaloni, Beatriz, and Ruth Kricheli. 2010. “Political Order and One-Party Rule.” AnnualReview of Political Science 13: 123-43.
Marshall, Monty G. 2013. POLITY IV PROJECT: Political Regime Characteristics andTransitions, 1800-2013: Dataset Users Manual. Polity IV dataset version 2013 ed. PolityIV Project: Center for Systemic Peace.
Meirowitz, Adam, and Joshua Tucker. 2013. “People Power or a One-Shot Deal? A DynamicModel of Protest.” American Journal of Political Science 57: 478-90.
Milani, Abbas. 2011. The Shah. New York: Palgrave MacMillan.
Mitchell Neil J. and James M. McCormick. 1988. “Economic and Political Explanations ofHuman Rights Violations.” World Politics 40: 476-98.
Nord̊as, Ragnhild, and Christian Davenport. 2013. “Fight the Youth: Youth Bulges andState Repression.” American Journal of Political Science 57: 926-40.
Parsa, Misagh. 2000. States, Ideologies, & Social Revolutions: A Comparative Study of Iran,Nicaragua, and the Philippines. Cambridge, UK: Cambridge University Press.
Persson, Torsten, and Guido Tabellini. 2009. “Democratic Capital: The Nexus of Politicaland Economic Change.” American Economic Journal: Macroeconomics 1: 88-126.
Philip, George. 1985. The Military in South American Politics. Croom Helm, Ltd.
Pilbeam, Pamela. 1991. The 1830 Revolution in France. London, UK: The MacMillan Press.
Poe, Steven C., and C. Neal Tate. 1994. “Repression of Human Rights to Personal Integrityin the 1980s: A Global Analysis.” American Political Science Review 88: 853-72.
Poe, Steven C., Nicholas Rost, and Sabine C. Carey. 2006. “Assessing Risk and Opportunityin Conflict Studies: A Human Rights Analysis.” Journal of Conflict Resolution 50: 484-507.
36

Sarkees, Meredith Reid, and Frank Wayman. 2010. Resort to War: 1816-2007. CQ Press.
Shadmehr, Mehdi. 2014. “Mobilization, Repression, and Revolution: Grievances and Op-portunities in Contentious Politics.” Journal of Politics 76: 621-35.
Shadmehr, Mehdi. 2015. “Extremism in Revolutionary Movements.” Forthcoming in Gamesand Economic Behavior.
Shadmehr, Mehdi, and Dan Bernhardt. 2011. “Collective Action with Uncertain Payoffs:Coordination, Public Signals, and Punishment Dilemmas.” American Political Science Re-view 105: 829-51.
Skocpol, Theda. 1979. States and Social Revolutions: A Comparative Analysis of France,Russia, and China. New York: Cambridge University Press.
Stokes, Gale. 1993. The Walls Came Tumbling Down: The Collapse of Communism inEastern Europe. New York: Oxford University Press.
Svolik, Milan. 2013. “Contracting on Violence: Authoritarian Repression and MilitaryIntervention in Politics.” Journal of Conflict Resolution 57: 765-94.
Tarrow, Sidney. 1998. Power in Movement: Social Movement and Contentious Politics.Cambridge, UK: Cambridge University Press.
Tilly, Charles. 1978. From Mobilization to Revolution. MA: Addision-Wesley.
Tilly, Charles. 2004. Social Movements: 1768-2004. Boulder, CO: Paradigm Publishers.
Tyson, Scott, and Alastair Smith. 2013. “Two-Sided Coordination: Competition in Collec-tive Action.” Mimeo.
United Nations, The Population Division, Department of Economic and Social Affairs. 2013.World Population Prospects: The 2012 Revision. New York: United Nations.
Urdal, Henrik. 2004. “The Devil in the Demographics: The Effect of Youth Bulges on Do-mestic Armed Conflict, 1950-2000.” Social Development Papers. Washington, DC: ConflictPrevention and Reconstruction Unit, World Bank.
Urdal, Henrik. 2006. “A Clash of Generations? Youth Bulges and Political Violence.”International Studies Quarterly 50: 607-629.
US State Department. 1988-1990. Country Reports on Human Rights Practices for 1987.Washington D.C.: US Government Printing Office.
Vreeland, James Raymond. 2008. “Political Institutions and Human Rights: Why Dictator-ships Enter into the United Nations Convention Against Torture.” International Organiza-tion 62: 65-101.
Waldfogel, Joel. 2003. “Preference Externalities: An Empirical Study of Who BenefitsWhom in Differentiated Product Markets.” RAND Journal of Economics 34: 557-68.
White, Stephen. 2001. Communism and its Collapse. New York: Routledge.
Wilkinson, Steven I. 2009. “Riots.” Annual Review of Political Science 12: 329-43.
Wintrobe, Ronald. 1998. The Political Economy of Dictatorship. Cambridge, MA: Cam-bridge University Press.
Wooldridge, Jeffery. 2002. Econometric Analysis of Cross Section and Panel Data. Cam-
37

bridge, MA: The MIT Press.
38