financial repression
TRANSCRIPT
Unconventional monetary policies help to finance the public sector’s debt burden. While a number of these policies were crucial and beneficial to managing the financial crisis, they also come with significant costs. The unintended consequences include potential asset price bubbles, an impaired credit intermediation channel and increasing economic inequality.
Financial repression: The unintended consequences
Today’s low interest rate environment is not only driven by macroeconomic factors, but also by policy actions that help governments deal with the high sovereign debt burden.
These policies – called “financial repression” – have unintended consequences for both households and long-term investors like insurance companies or pension funds.

Foreword
Central banks have done an extraordinarily good job of stabilising financial markets, restoring economic confidence and fighting the threat of deflation – no question about that. But seven years after the financial crisis, interest rates are still being kept at historically low levels, mainly due to the ongoing low growth environment.
Do low interest rates really help to overcome the global economic malaise? Doubts abound. They certainly do have one effect: That is, helping governments to direct funds to themselves to finance their debt and lower their funding costs – a set of policies known as financial repression.
Indeed, policymakers’ actions to manage the financial crisis resulted in significant benefits for society at large. But today, the advantages of those ongoing actions are outweighed by their costs. As well as resulting in lower interest earnings on savings, financial repression serves as a disincentive for policymakers to tackle pressing public policy challenges and thus advance the structural reform agenda. Furthermore, continued intervention by policymakers calls into question the existence and independence of markets more generally. Central bank financial market engineering is no substitute for economic reforms.
Swiss Re has developed its own index to track financial repression. This publication contributes to quantifying its costs. We want to weigh in on today’s key public policy debate, adding valuable insight into the unintended consequences of financial repression and preserving the important opportunities for long-term investors.
Guido FürerGroup Chief Investment OfficerSwiss Re

2 Swiss Re Financial repression: The unintended consequences
Table of contents
Introduction 4
Overview of global monetary policy 6
Unintended consequences of financial repression 10
Asset price bubbles 10
Impact on private households 13
Impact on institutional investors 17
Inflation and credibility 19
Exiting monetary policy 22
Capital market outlook 22
Sovereign vulnerability 23
Infrastructure investments and growth 26
Concluding remarks 29
Appendix 32
4 Swiss Re Financial repression: The unintended consequences
Introduction
The costs of financial repression are significant. Since the financial crisis, US savers alone have lost roughly USD 470 billion in interest rate income, net of lower debt costs. The policy is not only supported by central banks’ actions, but also by regulatory rules that favour sovereign bonds.
Today’s low interest rate environment is not only driven by macroeconomic factors, but foremost by policy actions that help governments deal with the high sovereign debt burden. Regulatory rules that support financial repression by favouring sovereign bonds have also been put in place.
The impact of financial repression on markets, so far, is undisputable: Continued increases in bond prices, expensive stocks and relatively low volatility – a situation which is hardly sustainable.
Moreover, the policy actions that cause financial repression entail a number of unintended consequences (see page 10). These include potential asset price bubbles, convergence in asset allocation strategies of otherwise heterogeneous financial market participants and an increase in economic inequality. With regards to the latter, the impact of foregone interest income for households and long-term investors is substantial. At the same time, the equity rally has predominantly benefited society’s wealthiest. Furthermore, central bank independence and credibility is increasingly questioned. The longer such extraordinary and unconventional monetary policies are in place following the move from crisis management to crisis resolution, the more challenging the “exit phase” will be (see page 22).
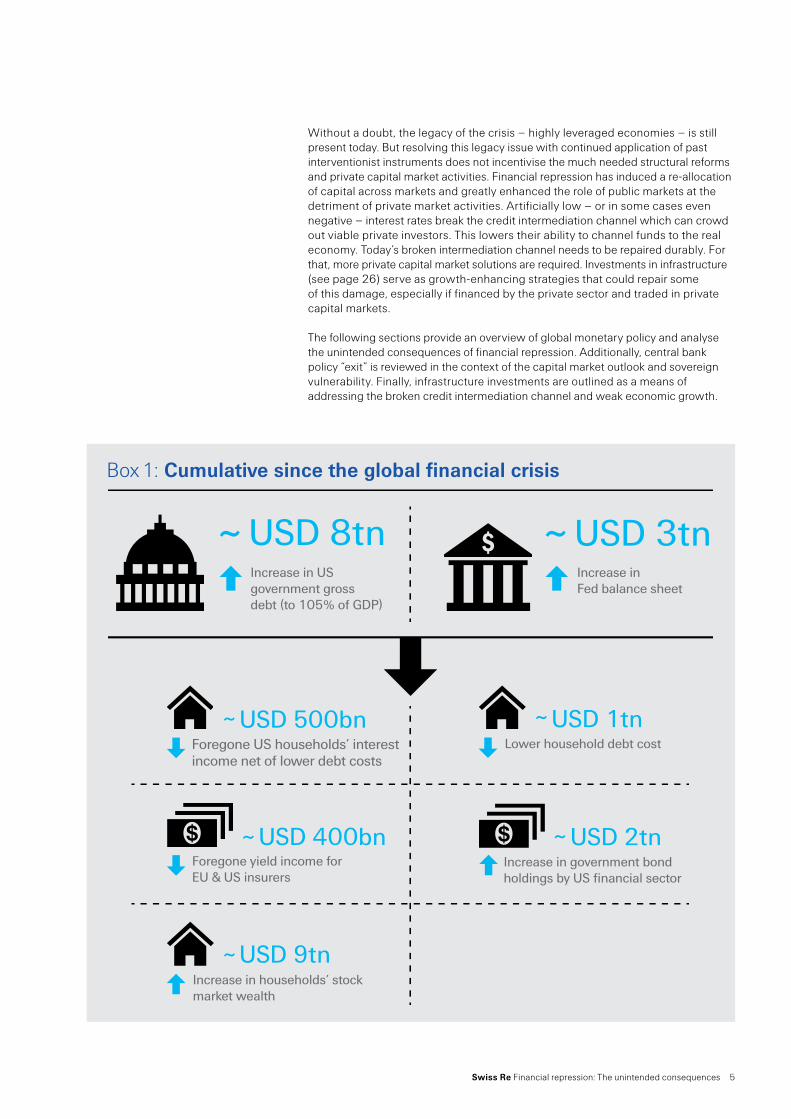
The costs of financial repression are significant. Let’s take the US as an example. Had the Federal Reserve (Fed) followed a policy based on the Taylor rule1, the interest rate target would have been roughly 1.7 percentage points higher on average than it was in the period 2008–2013. When also taking into account longer-term rates (and their extent of being below their “fair equilibrium value”) and the lower debt-related expenditures for households, the net tax on US savers amounts to USD 470 billion of foregone interest rates over that period. Simultaneously, wealthier savers benefited from the equity rally, bringing along new issues related to economic inequality. Box 1 shows the cumulative effect in the US since the financial crisis.
1 Taylor-rule rate = Neutral real policy rate + core CPI + 0.5*(Inflation target – core CPI) + 0.5* (NAIRU – unemployment rate)
Swiss Re Financial repression: The unintended consequences 5
Without a doubt, the legacy of the crisis – highly leveraged economies – is still present today. But resolving this legacy issue with continued application of past interventionist instruments does not incentivise the much needed structural reforms and private capital market activities. Financial repression has induced a re-allocation of capital across markets and greatly enhanced the role of public markets at the detriment of private market activities. Artificially low – or in some cases even negative – interest rates break the credit intermediation channel which can crowd out viable private investors. This lowers their ability to channel funds to the real economy. Today’s broken intermediation channel needs to be repaired durably. For that, more private capital market solutions are required. Investments in infrastructure (see page 26) serve as growth-enhancing strategies that could repair some of this damage, especially if financed by the private sector and traded in private capital markets.
The following sections provide an overview of global monetary policy and analyse the unintended consequences of financial repression. Additionally, central bank policy “exit” is reviewed in the context of the capital market outlook and sovereign vulnerability. Finally, infrastructure investments are outlined as a means of addressing the broken credit intermediation channel and weak economic growth.
USD 8tn USD 3tn
USD 500bn USD 1tn
USD 400bn USD 2tn
USD 9tn
Foregone US households’ interestincome net of lower debt costs
Box 1: Cumulative since the global financial crisis
6 Swiss Re Financial repression: The unintended consequences
Overview of global monetary policy
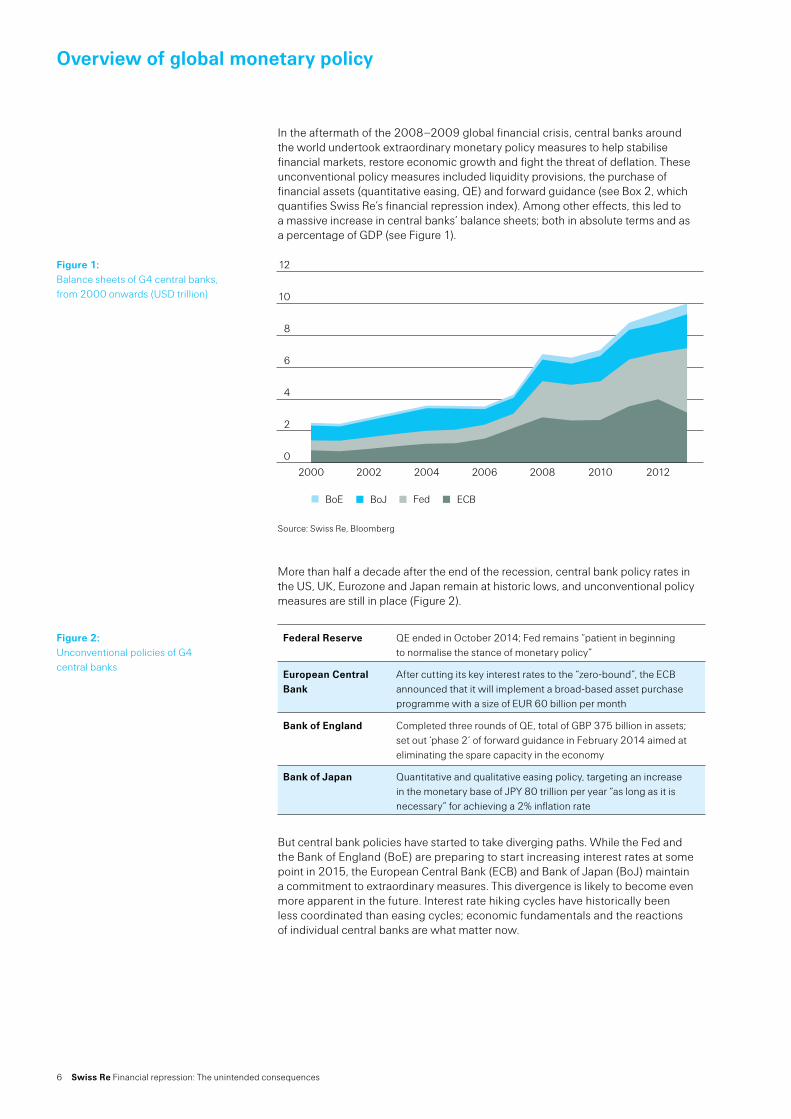
In the aftermath of the 2008–2009 global financial crisis, central banks around the world undertook extraordinary monetary policy measures to help stabilise financial markets, restore economic growth and fight the threat of deflation. These unconventional policy measures included liquidity provisions, the purchase of financial assets (quantitative easing, QE) and forward guidance (see Box 2, which quantifies Swiss Re’s financial repression index). Among other effects, this led to a massive increase in central banks’ balance sheets; both in absolute terms and as a percentage of GDP (see Figure 1).
Source: Swiss Re, Bloomberg
More than half a decade after the end of the recession, central bank policy rates in the US, UK, Eurozone and Japan remain at historic lows, and unconventional policy measures are still in place (Figure 2).
Federal Reserve QE ended in October 2014; Fed remains “patient in beginning to normalise the stance of monetary policy”
European Central Bank
After cutting its key interest rates to the “zero-bound”, the ECB announced that it will implement a broad-based asset purchase programme with a size of EUR 60 billion per month
Bank of England Completed three rounds of QE, total of GBP 375 billion in assets; set out ‘phase 2’ of forward guidance in February 2014 aimed at eliminating the spare capacity in the economy
Bank of Japan Quantitative and qualitative easing policy, targeting an increase in the monetary base of JPY 80 trillion per year “as long as it is necessary” for achieving a 2% inflation rate
But central bank policies have started to take diverging paths. While the Fed and the Bank of England (BoE) are preparing to start increasing interest rates at some point in 2015, the European Central Bank (ECB) and Bank of Japan (BoJ) maintain a commitment to extraordinary measures. This divergence is likely to become even more apparent in the future. Interest rate hiking cycles have historically been less coordinated than easing cycles; economic fundamentals and the reactions of individual central banks are what matter now.
Figure 1: Balance sheets of G4 central banks, from 2000 onwards (USD trillion)
0
2
4
6
8
10
12
BoE BoJ Fed ECB
2012201020082006200420022000
Figure 2:Unconventional policies of G4 central banks
Swiss Re Financial repression: The unintended consequences 7
US Eurozone UK Japan EMs
Normalising monetary policy. Going back to interest rate policy
From fragmentation to robust integration. A complex undertaking
Policy normalisation to start gradually. UK economy outperforms the Eurozone
From deflation to reflation.The jury is still out
Addressing spillovers from G4 central bank policies. See market reaction in May 2013 as the Fed tapered
Source: Swiss Re
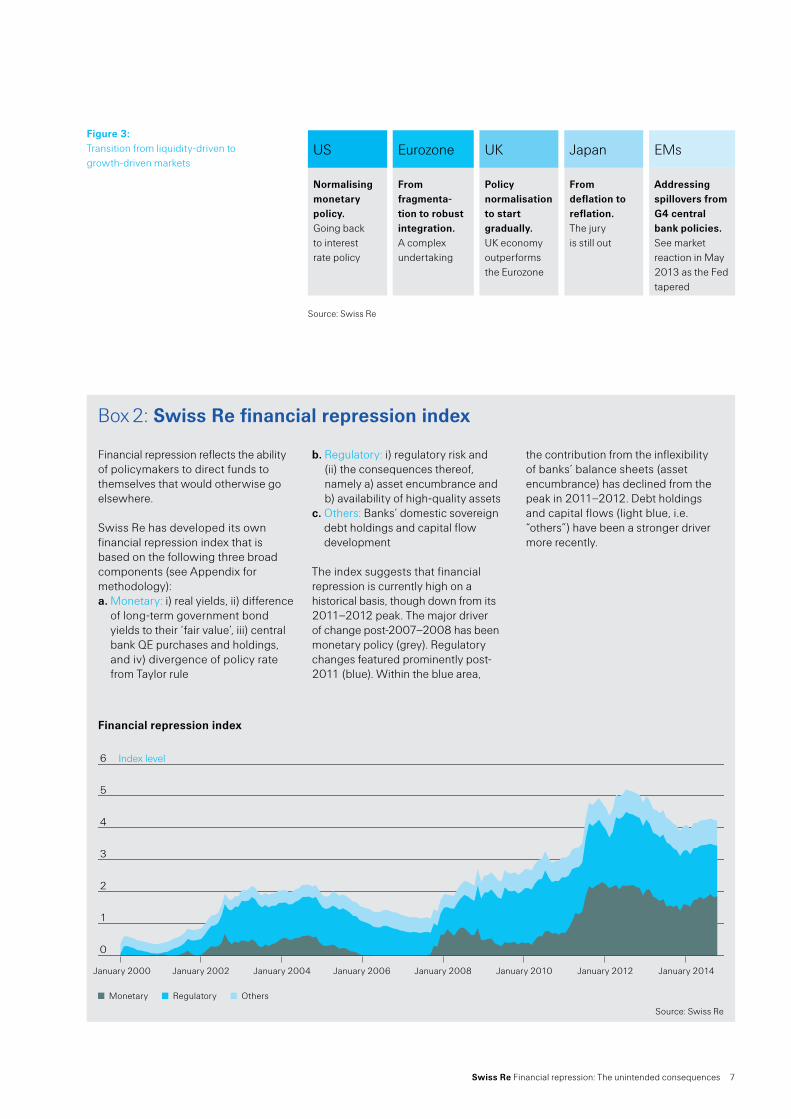
Figure 3:Transition from liquidity-driven to growth-driven markets
0
1
2
3
4
5
6
7
Index level
Financial repression index
January 2000 January 2002 January 2004 January 2006 January 2008 January 2010 January 2012 January 2014
Monetary Regulatory Others
Box 2: Swiss Re financial repression index
Financial repression reflects the ability of policymakers to direct funds to themselves that would otherwise go elsewhere.
Swiss Re has developed its own financial repression index that is based on the following three broad components (see Appendix for methodology):a. Monetary: i) real yields, ii) difference
of long-term government bond yields to their ‘fair value’, iii) central bank QE purchases and holdings, and iv) divergence of policy rate from Taylor rule
b. Regulatory: i) regulatory risk and (ii) the consequences thereof, namely a) asset encumbrance and b) availability of high-quality assets
c. Others: Banks’ domestic sovereign debt holdings and capital flow development
The index suggests that financial repression is currently high on a historical basis, though down from its 2011–2012 peak. The major driver of change post-2007–2008 has been monetary policy (grey). Regulatory changes featured prominently post-2011 (blue). Within the blue area,
the contribution from the inflexibility of banks’ balance sheets (asset encumbrance) has declined from the peak in 2011–2012. Debt holdings and capital flows (light blue, i.e. “others”) have been a stronger driver more recently.
Source: Swiss Re

8 Swiss Re Financial repression: The unintended consequences
Financial repression has broken the credit intermediation channel. Long-term investors are crowded out of some markets, lowering their ability to channel funds to the real economy. Infrastructure investments would repair this damage and address weak economic growth.

Swiss Re Financial repression: The unintended consequences 9
10 Swiss Re Financial repression: The unintended consequences
Unintended consequences of financial repression
Why do central banks engage in unorthodox monetary policies? Key objectives include bringing inflation back to target, stabilising financial markets and fostering economic growth. While the jury is still out on their success and ability to achieve those goals, one effect is clear: Low interest rates help governments to fund their debt. In other words, they are able to channel funds to themselves – referred to as financial repression.
This type of policymaking comes at a cost. So far, central bankers have argued that the benefits of quantitative easing and other unorthodox measures outweigh the costs. However, exiting ultra-easy monetary policy will become harder with time and the unintended consequences will become more apparent. These include potential asset bubbles, a financial repression “tax”, increasing economic inequality, the potential of higher inflation and reputation damage for central banks.
The debate among central bankers on the potential unintended consequences of the “Great Monetary Experiment” has already intensified somewhat, in particular related to the implications for economic inequality2. However, the focus on the topic remains rather tepid at best and more informed public policy discussions are necessary.
Asset price bubbles
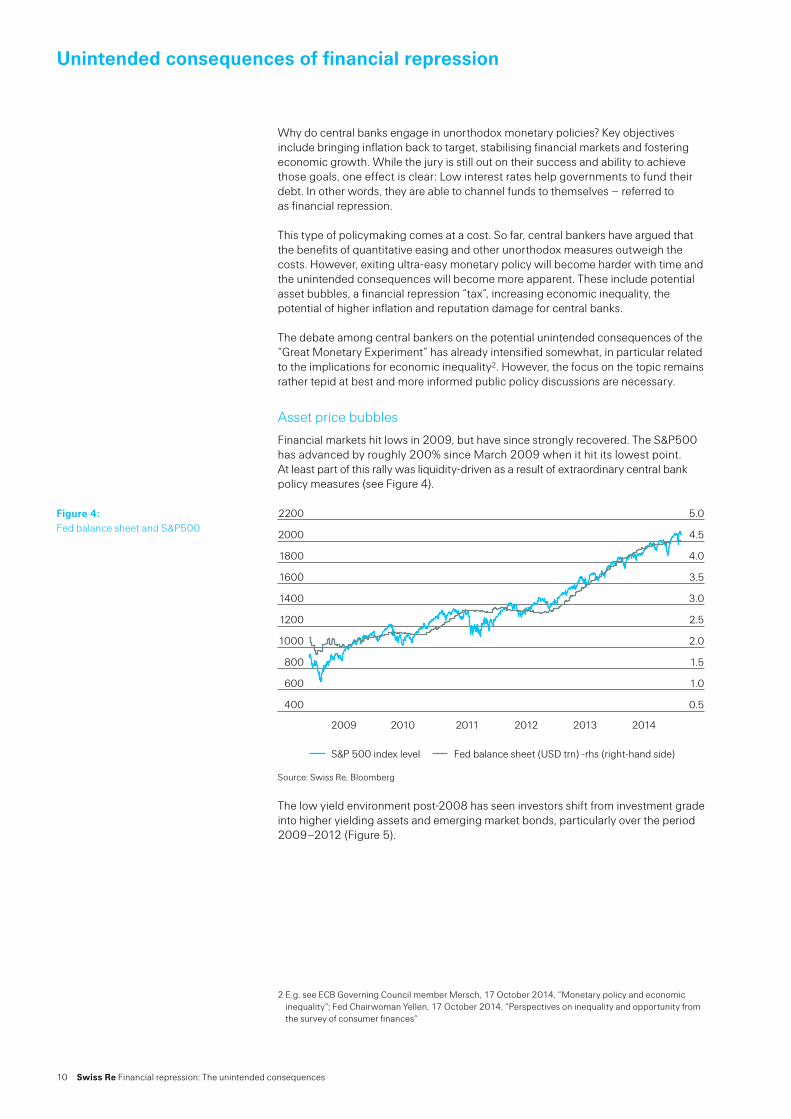
Financial markets hit lows in 2009, but have since strongly recovered. The S&P500 has advanced by roughly 200% since March 2009 when it hit its lowest point. At least part of this rally was liquidity-driven as a result of extraordinary central bank policy measures (see Figure 4).
Source: Swiss Re, Bloomberg
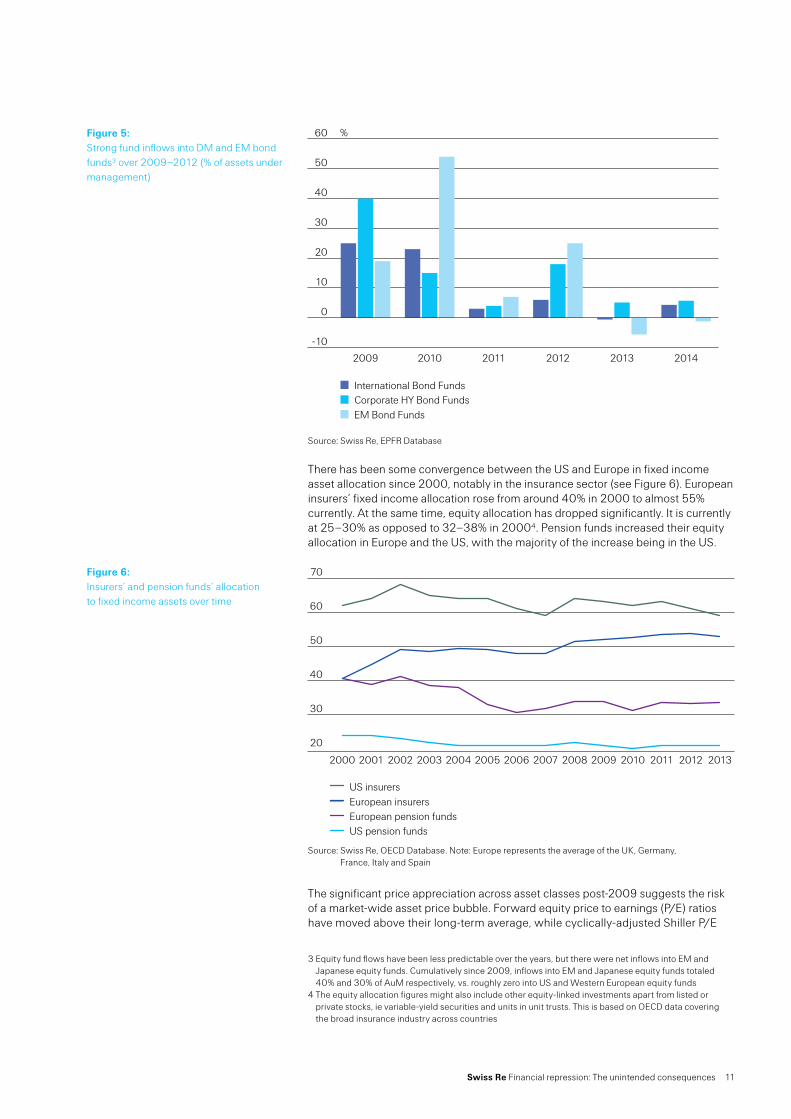
The low yield environment post-2008 has seen investors shift from investment grade into higher yielding assets and emerging market bonds, particularly over the period 2009–2012 (Figure 5).
Figure 4:Fed balance sheet and S&P500
400
600
800
1000
1200
1400
1600
1800
2000
2200
2009 2010 2011 2012 2013 2014
S&P 500 index level Fed balance sheet (USD trn) -rhs (right-hand side)
0.5
1.0
1.5
2.0
2.5
3.0
3.5
4.0
4.5
5.0
2 E.g. see ECB Governing Council member Mersch, 17 October 2014, “Monetary policy and economic inequality“; Fed Chairwoman Yellen, 17 October 2014, “Perspectives on inequality and opportunity from the survey of consumer finances“
Swiss Re Financial repression: The unintended consequences 11
Source: Swiss Re, EPFR Database
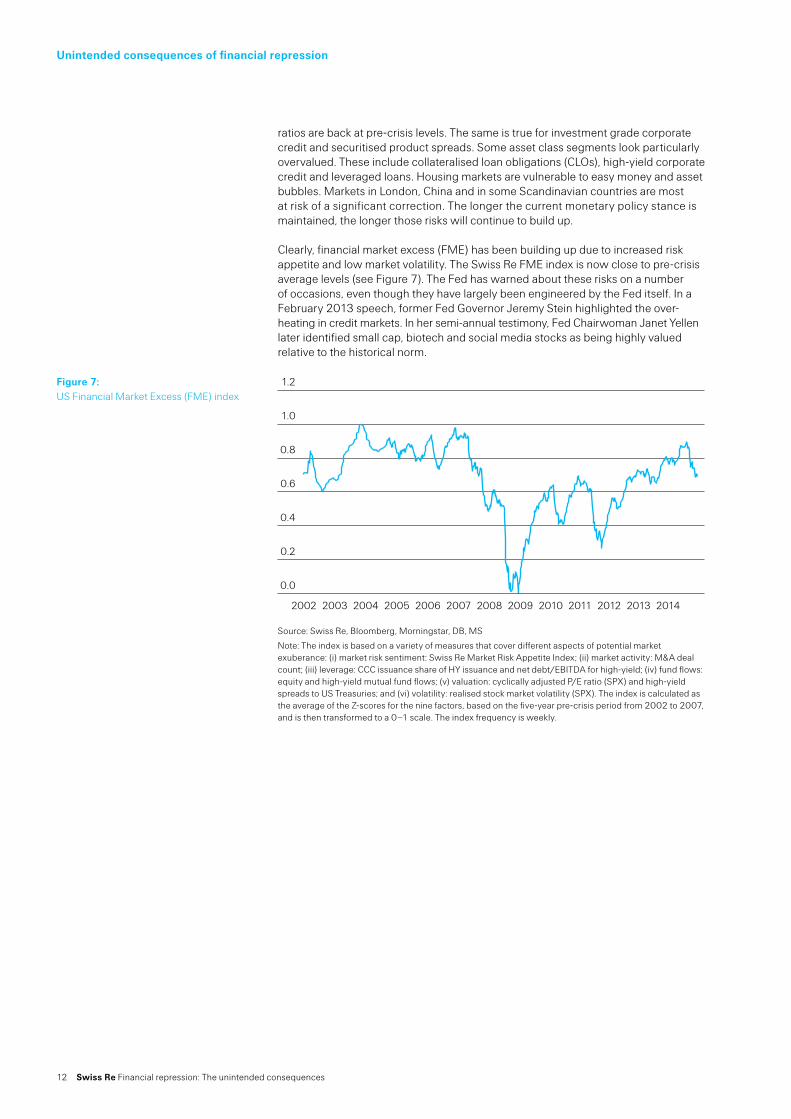
There has been some convergence between the US and Europe in fixed income asset allocation since 2000, notably in the insurance sector (see Figure 6). European insurers’ fixed income allocation rose from around 40% in 2000 to almost 55% currently. At the same time, equity allocation has dropped significantly. It is currently at 25–30% as opposed to 32–38% in 20004. Pension funds increased their equity allocation in Europe and the US, with the majority of the increase being in the US.
Source: Swiss Re, OECD Database. Note: Europe represents the average of the UK, Germany, France, Italy and Spain
The significant price appreciation across asset classes post-2009 suggests the risk of a market-wide asset price bubble. Forward equity price to earnings (P/E) ratios have moved above their long-term average, while cyclically-adjusted Shiller P/E
Figure 5:Strong fund inflows into DM and EM bond funds3 over 2009–2012 (% of assets under management)
-10
0
10
20
30
40
50
60
EM Bond FundsCorporate HY Bond FundsInternational Bond Funds
201420132012201120102009
%
Figure 6:Insurers’ and pension funds’ allocation to fixed income assets over time
20
30
40
50
60
70
US insurersEuropean insurersEuropean pension fundsUS pension funds
20132012201120102009200820072006200520042003200220012000
3 Equity fund flows have been less predictable over the years, but there were net inflows into EM and Japanese equity funds. Cumulatively since 2009, inflows into EM and Japanese equity funds totaled 40% and 30% of AuM respectively, vs. roughly zero into US and Western European equity funds
4 The equity allocation figures might also include other equity-linked investments apart from listed or private stocks, ie variable-yield securities and units in unit trusts. This is based on OECD data covering the broad insurance industry across countries
12 Swiss Re Financial repression: The unintended consequences
Unintended consequences of financial repression
ratios are back at pre-crisis levels. The same is true for investment grade corporate credit and securitised product spreads. Some asset class segments look particularly overvalued. These include collateralised loan obligations (CLOs), high-yield corporate credit and leveraged loans. Housing markets are vulnerable to easy money and asset bubbles. Markets in London, China and in some Scandinavian countries are most at risk of a significant correction. The longer the current monetary policy stance is maintained, the longer those risks will continue to build up.
Clearly, financial market excess (FME) has been building up due to increased risk appetite and low market volatility. The Swiss Re FME index is now close to pre-crisis average levels (see Figure 7). The Fed has warned about these risks on a number of occasions, even though they have largely been engineered by the Fed itself. In a February 2013 speech, former Fed Governor Jeremy Stein highlighted the over-heating in credit markets. In her semi-annual testimony, Fed Chairwoman Janet Yellen later identified small cap, biotech and social media stocks as being highly valued relative to the historical norm.
Source: Swiss Re, Bloomberg, Morningstar, DB, MS
Note: The index is based on a variety of measures that cover different aspects of potential market exuberance: (i) market risk sentiment: Swiss Re Market Risk Appetite Index; (ii) market activity: M&A deal count; (iii) leverage: CCC issuance share of HY issuance and net debt/EBITDA for high-yield; (iv) fund flows: equity and high-yield mutual fund flows; (v) valuation: cyclically adjusted P/E ratio (SPX) and high-yield spreads to US Treasuries; and (vi) volatility: realised stock market volatility (SPX). The index is calculated as the average of the Z-scores for the nine factors, based on the five-year pre-crisis period from 2002 to 2007, and is then transformed to a 0–1 scale. The index frequency is weekly.
Figure 7:US Financial Market Excess (FME) index
0.0
0.2
0.4
0.6
0.8
1.0
1.2
2002 2003 2004 2005 2006 2007 2008 2009 2010 2011 20132012 2014
Swiss Re Financial repression: The unintended consequences 13
Impact on private households
The prevailing low interest rate environment and the strong performance of financial assets due to loose monetary policy have a profound impact on savers and institutional investors’ portfolio returns. Some regard this as another example of financial repression. Reinhart and Sbrancia (2011) summarise it thus as: “unlike income, consumption, or sales taxes, the ‘repression’ tax rate […] may be a more politically palatable alternative to authorities.”
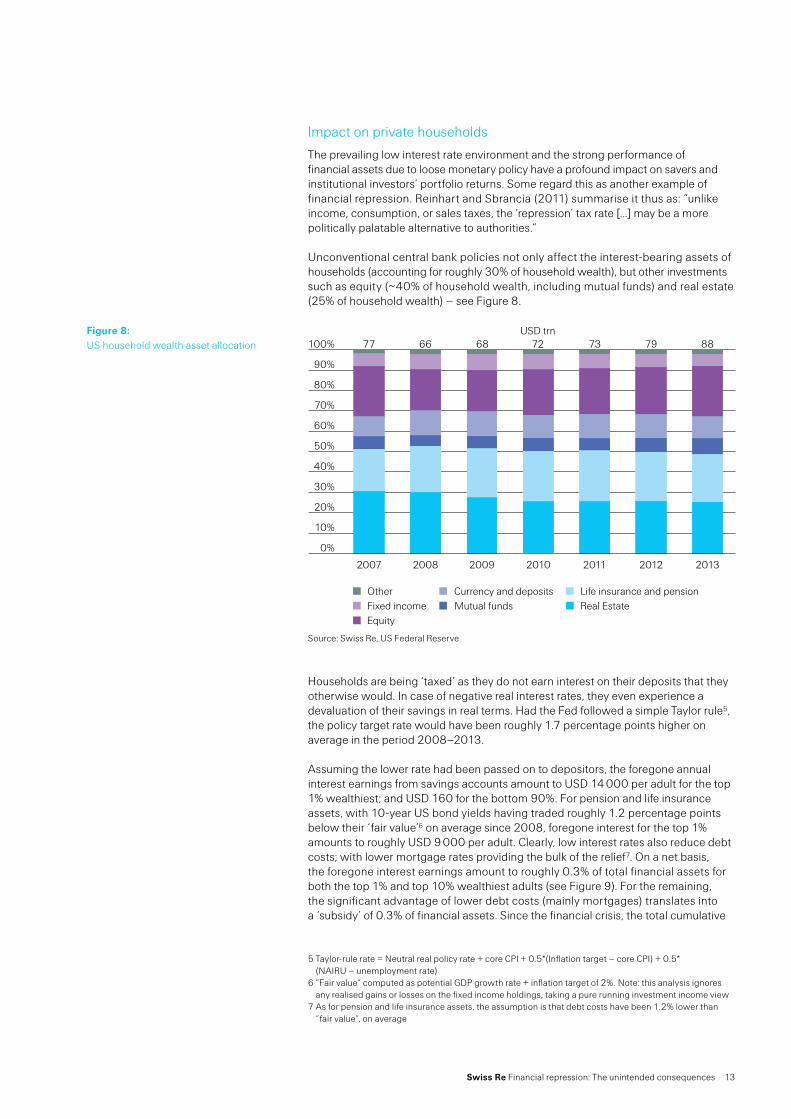
Unconventional central bank policies not only affect the interest-bearing assets of households (accounting for roughly 30% of household wealth), but other investments such as equity (~40% of household wealth, including mutual funds) and real estate (25% of household wealth) – see Figure 8.
Source: Swiss Re, US Federal Reserve
Households are being ‘taxed’ as they do not earn interest on their deposits that they otherwise would. In case of negative real interest rates, they even experience a devaluation of their savings in real terms. Had the Fed followed a simple Taylor rule5, the policy target rate would have been roughly 1.7 percentage points higher on average in the period 2008–2013.
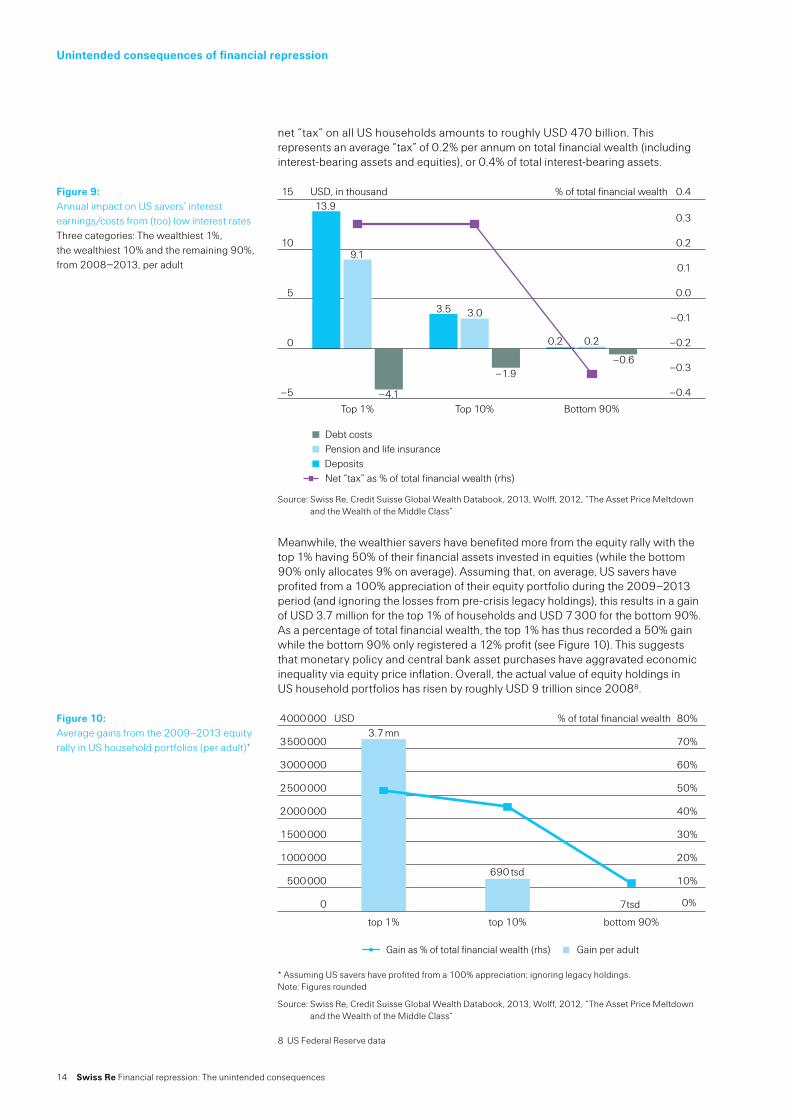
Assuming the lower rate had been passed on to depositors, the foregone annual interest earnings from savings accounts amount to USD 14 000 per adult for the top 1% wealthiest; and USD 160 for the bottom 90%. For pension and life insurance assets, with 10-year US bond yields having traded roughly 1.2 percentage points below their ‘fair value’6 on average since 2008, foregone interest for the top 1% amounts to roughly USD 9 000 per adult. Clearly, low interest rates also reduce debt costs; with lower mortgage rates providing the bulk of the relief7. On a net basis, the foregone interest earnings amount to roughly 0.3% of total financial assets for both the top 1% and top 10% wealthiest adults (see Figure 9). For the remaining, the significant advantage of lower debt costs (mainly mortgages) translates into a ‘subsidy’ of 0.3% of financial assets. Since the financial crisis, the total cumulative
Figure 8:US household wealth asset allocation
0%
10%
20%
30%
40%
50%
60%
70%
80%
90%
100%
OtherFixed incomeEquity
Currency and depositsMutual funds
Life insurance and pensionReal Estate
2013201220112010200920082007
USD trn77 66 68 72 73 79 88
5 Taylor-rule rate = Neutral real policy rate + core CPI + 0.5*(Inflation target – core CPI) + 0.5* (NAIRU – unemployment rate)
6 “Fair value“ computed as potential GDP growth rate + inflation target of 2%. Note: this analysis ignores any realised gains or losses on the fixed income holdings, taking a pure running investment income view
7 As for pension and life insurance assets, the assumption is that debt costs have been 1.2% lower than “fair value“, on average
14 Swiss Re Financial repression: The unintended consequences
net “tax” on all US households amounts to roughly USD 470 billion. This represents an average “tax” of 0.2% per annum on total financial wealth (including interest-bearing assets and equities), or 0.4% of total interest-bearing assets.
Source: Swiss Re, Credit Suisse Global Wealth Databook, 2013, Wolff, 2012, “The Asset Price Meltdown and the Wealth of the Middle Class“
Meanwhile, the wealthier savers have benefited more from the equity rally with the top 1% having 50% of their financial assets invested in equities (while the bottom 90% only allocates 9% on average). Assuming that, on average, US savers have profited from a 100% appreciation of their equity portfolio during the 2009–2013 period (and ignoring the losses from pre-crisis legacy holdings), this results in a gain of USD 3.7 million for the top 1% of households and USD 7 300 for the bottom 90%. As a percentage of total financial wealth, the top 1% has thus recorded a 50% gain while the bottom 90% only registered a 12% profit (see Figure 10). This suggests that monetary policy and central bank asset purchases have aggravated economic inequality via equity price inflation. Overall, the actual value of equity holdings in US household portfolios has risen by roughly USD 9 trillion since 20088.
* Assuming US savers have profited from a 100% appreciation; ignoring legacy holdings. Note: Figures rounded
Source: Swiss Re, Credit Suisse Global Wealth Databook, 2013, Wolff, 2012, “The Asset Price Meltdown and the Wealth of the Middle Class“
Figure 9:Annual impact on US savers’ interest earnings/costs from (too) low interest rates Three categories: The wealthiest 1%, the wealthiest 10% and the remaining 90%, from 2008–2013, per adult
–5
0
5
10
15
Debt costsPension and life insuranceDeposits
Bottom 90%Top 10%Top 1%
13.9
9.1
3.5
–1.9
–4.1
0.2 0.2
–0.6
3.0
USD, in thousand % of total financial wealth
–0.4
–0.3
–0.2
–0.1
0.0
0.1
0.2
0.3
0.4
Net “tax” as % of total financial wealth (rhs)
Figure 10:Average gains from the 2009–2013 equity rally in US household portfolios (per adult)*
0
500000
1000000
1500000
2000000
2500000
3000000
3500000
4000000
Gain per adult
bottom 90%top 10%top 1%
3.7 mnUSD % of total financial wealth
690 tsd
7tsd 0%
10%
20%
30%
40%
50%
60%
70%
80%
Gain as % of total financial wealth (rhs)
Unintended consequences of financial repression
8 US Federal Reserve data
Swiss Re Financial repression: The unintended consequences 15
Finally, low interest rates may also have impacted house prices through lower mortgage costs, thus increasing refinancing activity and housing demand. Historically, a decline in the real long-term interest rate by 100 basis points was found to have increased house prices by up to 7%9. A simple regression of the log house price (FHFA US house price index) on the real 10-year US interest rate10 confirms these findings (impact is found to be around 5%). This translates into an increase in household wealth of roughly USD 1 trillion based on the assumption that long-term real interest rates have been roughly 1.2 percentage points below their ‘fair value’, on average, since 2008. As a percentage of total financial wealth, the bottom 90% wealth class has profited most, even though from an absolute perspective the gain for the top 10% richest is still multiple times higher.
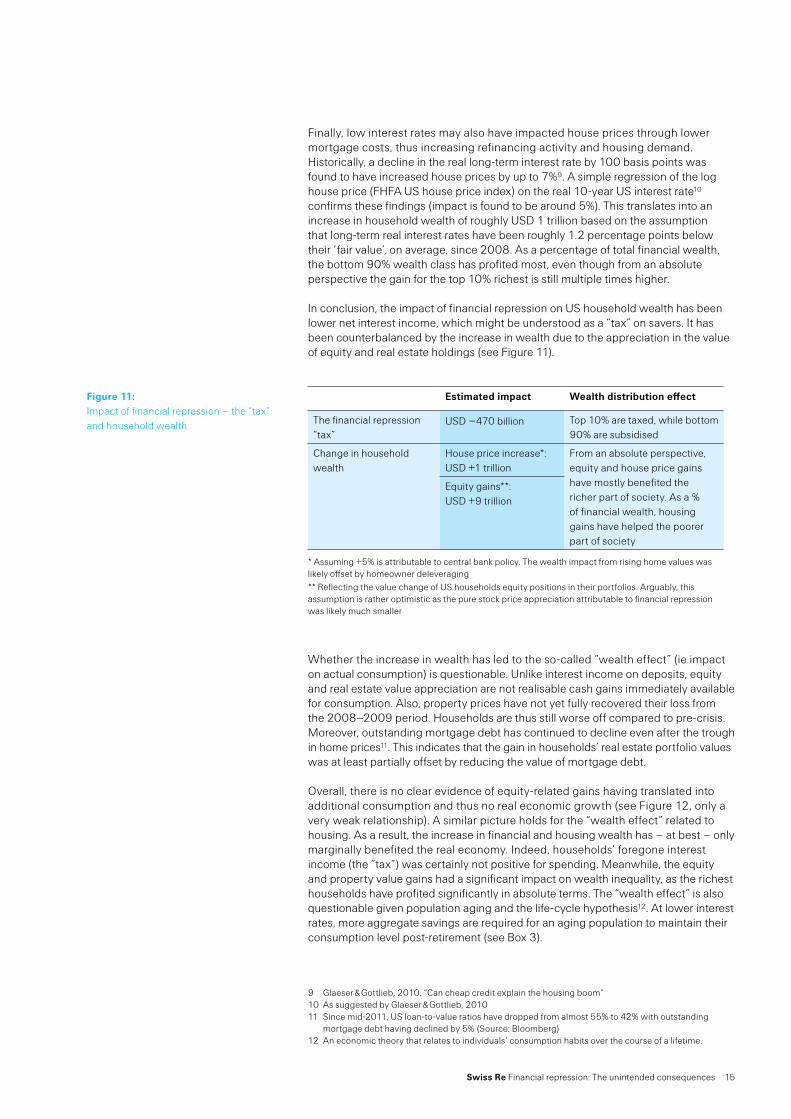
In conclusion, the impact of financial repression on US household wealth has been lower net interest income, which might be understood as a “tax” on savers. It has been counterbalanced by the increase in wealth due to the appreciation in the value of equity and real estate holdings (see Figure 11).
Estimated impact Wealth distribution effect
The financial repression “tax”
USD –470 billion Top 10% are taxed, while bottom 90% are subsidised
Change in household wealth
House price increase*: USD +1 trillion
From an absolute perspective, equity and house price gains have mostly benefited the richer part of society. As a % of financial wealth, housing gains have helped the poorer part of society
Equity gains**:USD +9 trillion
* Assuming +5% is attributable to central bank policy. The wealth impact from rising home values was likely offset by homeowner deleveraging** Reflecting the value change of US households equity positions in their portfolios. Arguably, this assumption is rather optimistic as the pure stock price appreciation attributable to financial repression was likely much smaller
Whether the increase in wealth has led to the so-called “wealth effect” (ie impact on actual consumption) is questionable. Unlike interest income on deposits, equity and real estate value appreciation are not realisable cash gains immediately available for consumption. Also, property prices have not yet fully recovered their loss from the 2008–2009 period. Households are thus still worse off compared to pre-crisis. Moreover, outstanding mortgage debt has continued to decline even after the trough in home prices11. This indicates that the gain in households’ real estate portfolio values was at least partially offset by reducing the value of mortgage debt.
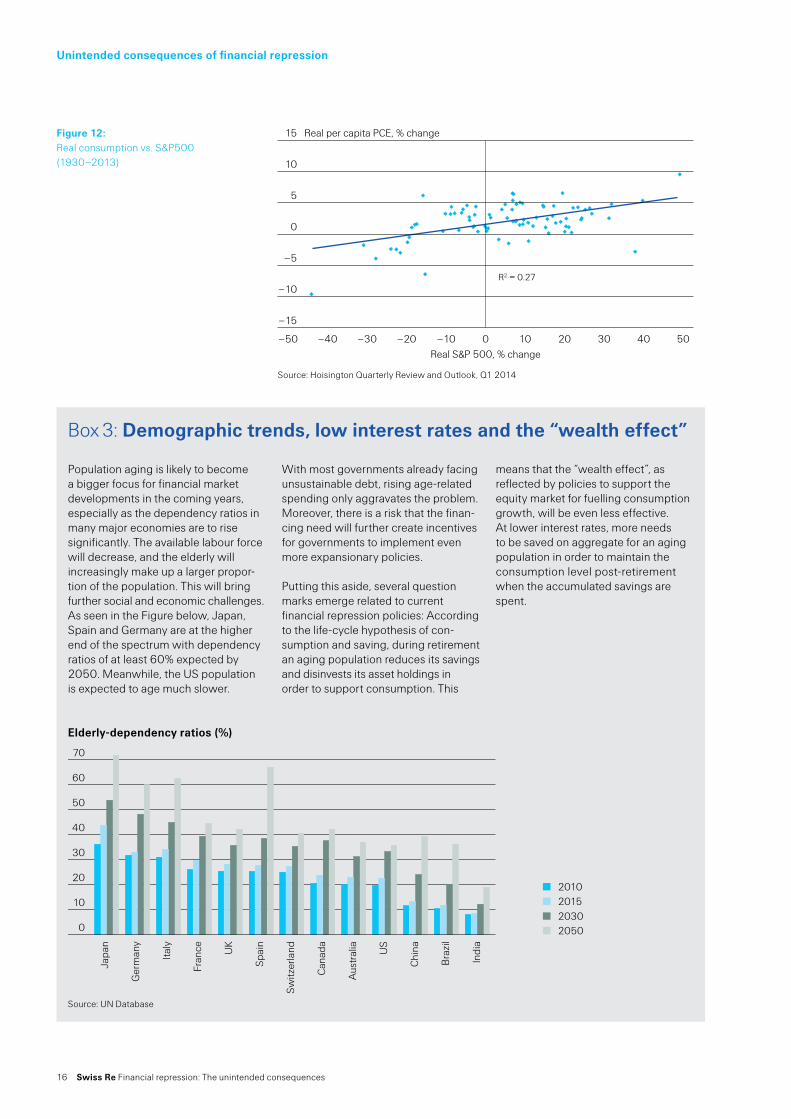
Overall, there is no clear evidence of equity-related gains having translated into additional consumption and thus no real economic growth (see Figure 12, only a very weak relationship). A similar picture holds for the “wealth effect” related to housing. As a result, the increase in financial and housing wealth has – at best – only marginally benefited the real economy. Indeed, households’ foregone interest income (the “tax”) was certainly not positive for spending. Meanwhile, the equity and property value gains had a significant impact on wealth inequality, as the richest households have profited significantly in absolute terms. The “wealth effect” is also questionable given population aging and the life-cycle hypothesis12. At lower interest rates, more aggregate savings are required for an aging population to maintain their consumption level post-retirement (see Box 3).
Figure 11:Impact of financial repression – the “tax” and household wealth
9 Glaeser & Gottlieb, 2010, “Can cheap credit explain the housing boom“10 As suggested by Glaeser & Gottlieb, 201011 Since mid-2011, US loan-to-value ratios have dropped from almost 55% to 42% with outstanding
mortgage debt having declined by 5% (Source: Bloomberg)12 An economic theory that relates to individuals‘ consumption habits over the course of a lifetime.
16 Swiss Re Financial repression: The unintended consequences
Source: Hoisington Quarterly Review and Outlook, Q1 2014
Figure 12: Real consumption vs. S&P500 (1930–2013)
Real per capita PCE, % change
Real S&P 500, % change
R2 = 0.27
15
10
5
0
–5
–10
–15
–50 –40 –30 –20 –10 0 5040302010
Elderlydependency ratios (%)
Box 3: Demographic trends, low interest rates and the “wealth effect”
Population aging is likely to become a bigger focus for financial market developments in the coming years, especially as the dependency ratios in many major economies are to rise significantly. The available labour force will decrease, and the elderly will increasingly make up a larger propor-tion of the population. This will bring further social and economic challenges. As seen in the Figure below, Japan, Spain and Germany are at the higher end of the spectrum with dependency ratios of at least 60% expected by 2050. Meanwhile, the US population is expected to age much slower.
With most governments already facing unsustainable debt, rising age-related spending only aggravates the problem. Moreover, there is a risk that the finan-cing need will further create incentives for governments to implement even more expansionary policies.
Putting this aside, several question marks emerge related to current financial repression policies: According to the life-cycle hypothesis of con-sumption and saving, during retire ment an aging population reduces its savings and disinvests its asset holdings in order to support consumption. This
means that the “wealth effect”, as reflected by policies to support the equity market for fuelling consumption growth, will be even less effective. At lower interest rates, more needs to be saved on aggregate for an aging population in order to maintain the consumption level post-retirement when the accumulated savings are spent.
0
10
20
30
40
50
60
70
80
2050203020152010
Indi
a
Bra
zil
Chi
naUS
Aus
tral
ia
Can
ada
Switz
erla
nd
Spai
n
UK
Fran
ce
Italy
Ger
man
y
Japa
n
Unintended consequences of financial repression
Source: UN Database
Swiss Re Financial repression: The unintended consequences 17
Impact on institutional investors
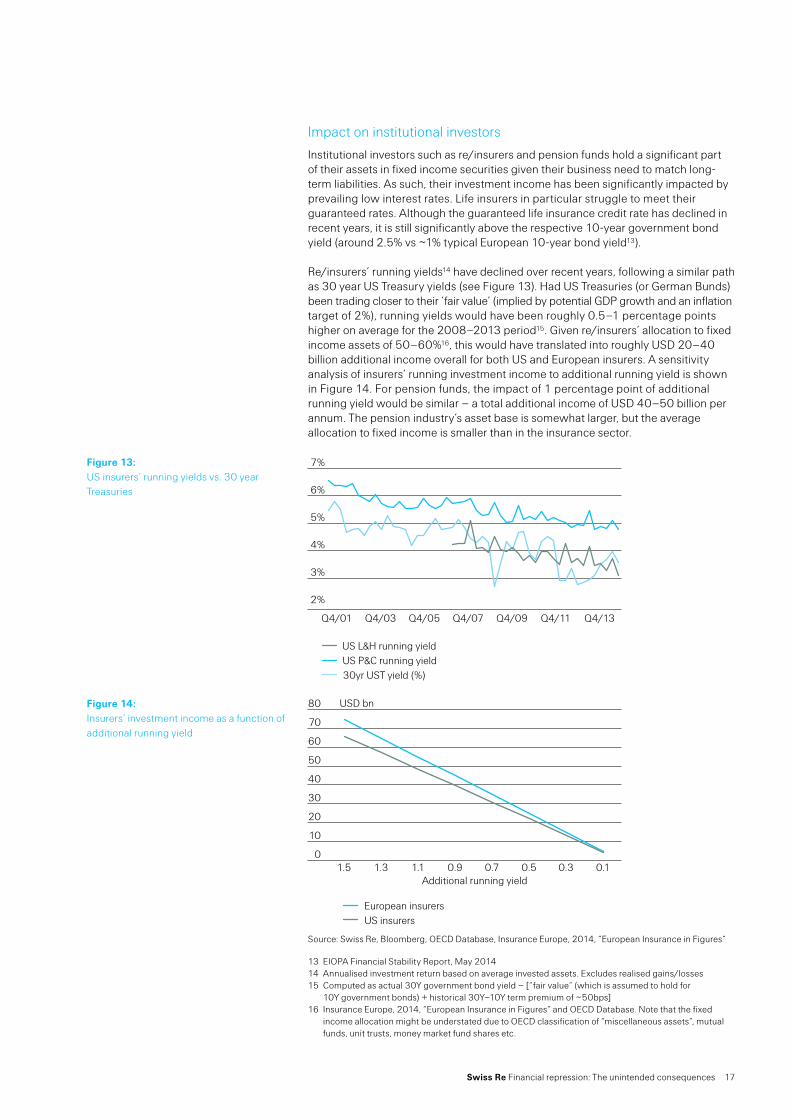
Institutional investors such as re/insurers and pension funds hold a significant part of their assets in fixed income securities given their business need to match long-term liabilities. As such, their investment income has been significantly impacted by prevailing low interest rates. Life insurers in particular struggle to meet their guaranteed rates. Although the guaranteed life insurance credit rate has declined in recent years, it is still significantly above the respective 10-year government bond yield (around 2.5% vs ~1% typical European 10-year bond yield13).
Re/insurers’ running yields14 have declined over recent years, following a similar path as 30 year US Treasury yields (see Figure 13). Had US Treasuries (or German Bunds) been trading closer to their ‘fair value’ (implied by potential GDP growth and an inflation target of 2%), running yields would have been roughly 0.5–1 percentage points higher on average for the 2008–2013 period15. Given re/insurers’ allocation to fixed income assets of 50–60%16, this would have translated into roughly USD 20–40 billion additional income overall for both US and European insurers. A sensitivity analysis of insurers’ running investment income to additional running yield is shown in Figure 14. For pension funds, the impact of 1 percentage point of additional running yield would be similar – a total additional income of USD 40–50 billion per annum. The pension industry’s asset base is somewhat larger, but the average allocation to fixed income is smaller than in the insurance sector.
Source: Swiss Re, Bloomberg, OECD Database, Insurance Europe, 2014, “European Insurance in Figures“
Figure 13:US insurers’ running yields vs. 30 year Treasuries
2%
3%
4%
5%
6%
7%
30yr UST yield (%)US P&C running yieldUS L&H running yield
Q4/01 Q4/03 Q4/05 Q4/07 Q4/09 Q4/11 Q4/13
Figure 14: Insurers‘ investment income as a function of additional running yield
0
10
20
30
40
50
60
70
80
European insurersUS insurers
0.10.30.50.70.91.11.31.5
USD bn
Additional running yield
13 EIOPA Financial Stability Report, May 201414 Annualised investment return based on average invested assets. Excludes realised gains/losses15 Computed as actual 30Y government bond yield – [“fair value“ (which is assumed to hold for
10Y government bonds) + historical 30Y–10Y term premium of ~50bps]16 Insurance Europe, 2014, “European Insurance in Figures“ and OECD Database. Note that the fixed
income allocation might be understated due to OECD classification of “miscellaneous assets“, mutual funds, unit trusts, money market fund shares etc.
18 Swiss Re Financial repression: The unintended consequences
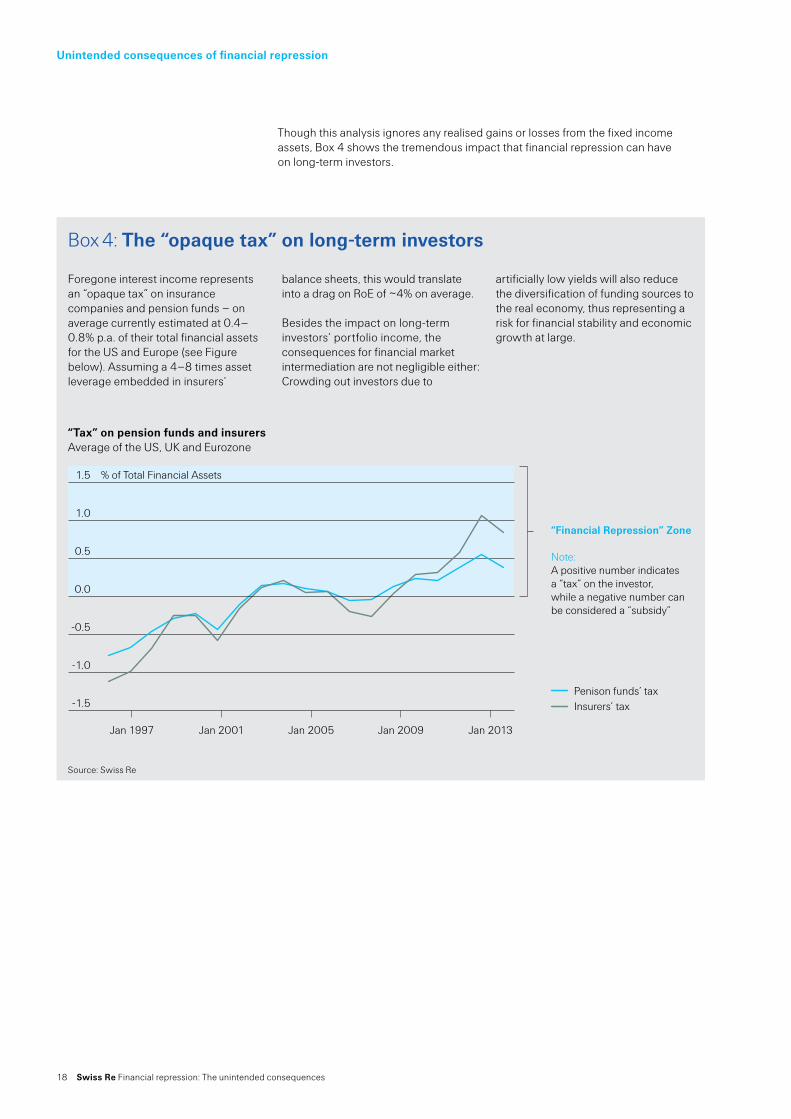
Though this analysis ignores any realised gains or losses from the fixed income assets, Box 4 shows the tremendous impact that financial repression can have on long-term investors.
“Tax” on pension funds and insurersAverage of the US, UK and Eurozone
Box 4: The “opaque tax” on longterm investors
Foregone interest income represents an “opaque tax” on insurance companies and pension funds – on average currently estimated at 0.4–0.8% p.a. of their total financial assets for the US and Europe (see Figure below). Assuming a 4–8 times asset leverage embedded in insurers’
balance sheets, this would translate into a drag on RoE of ~4% on average.
Besides the impact on long-term investors’ portfolio income, the consequences for financial market intermediation are not negligible either: Crowding out investors due to
artificially low yields will also reduce the diversification of funding sources to the real economy, thus representing a risk for financial stability and economic growth at large.
-1.5
-1.0
-0.5
0.0
0.5
1.0
1.5
Penison funds’ taxInsurers’ tax
Jan 1997 Jan 2001 Jan 2005 Jan 2009 Jan 2013
“Financial Repression” Zone
Note: A positive number indicates a “tax” on the investor, while a negative number can be considered a “subsidy”
% of Total Financial Assets
Unintended consequences of financial repression
Source: Swiss Re
Swiss Re Financial repression: The unintended consequences 19
Inflation and credibility
Major central banks face a trade-off between supporting economic recovery and contributing to the further potential build-up of financial and economic imbalances, in particular the risk of long-term inflation. While inflation is currently low, this could change over the medium- to long-term given extraordinarily accommodative central bank policies and the gradual reduction of economic overcapacity.
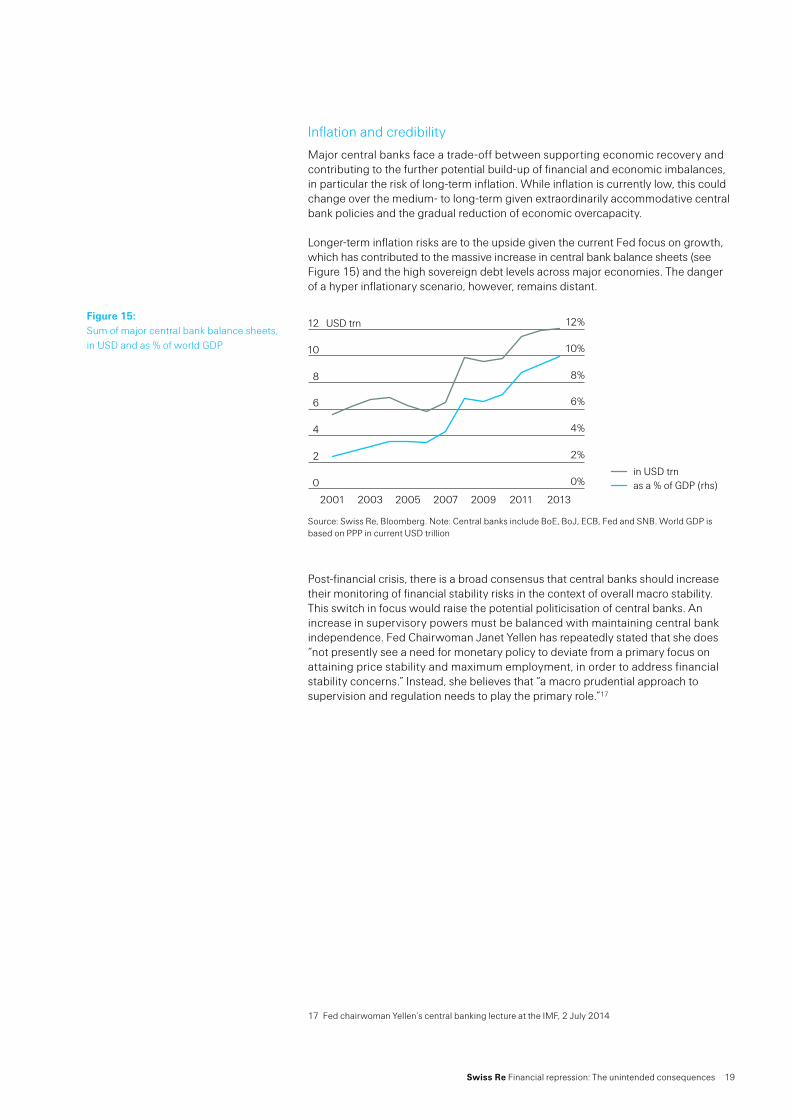
Longer-term inflation risks are to the upside given the current Fed focus on growth, which has contributed to the massive increase in central bank balance sheets (see Figure 15) and the high sovereign debt levels across major economies. The danger of a hyper inflationary scenario, however, remains distant.
Source: Swiss Re, Bloomberg. Note: Central banks include BoE, BoJ, ECB, Fed and SNB. World GDP is based on PPP in current USD trillion
Post-financial crisis, there is a broad consensus that central banks should increase their monitoring of financial stability risks in the context of overall macro stability. This switch in focus would raise the potential politicisation of central banks. An increase in supervisory powers must be balanced with maintaining central bank independence. Fed Chairwoman Janet Yellen has repeatedly stated that she does “not presently see a need for monetary policy to deviate from a primary focus on attaining price stability and maximum employment, in order to address financial stability concerns.” Instead, she believes that “a macro prudential approach to supervision and regulation needs to play the primary role.”17
Figure 15: Sum of major central bank balance sheets, in USD and as % of world GDP
0
2
4
6
8
10
12
2013201120092007200520032001
USD trn
0%
2%
4%
6%
8%
10%
12%
in USD trnas a % of GDP (rhs)
17 Fed chairwoman Yellen‘s central banking lecture at the IMF, 2 July 2014

20 Swiss Re Financial repression: The unintended consequences
Central banks face a trade-off between supporting economic recovery and contributing to the further potential build-up of financial and economic imbalances.

Swiss Re Financial repression: The unintended consequences 21
22 Swiss Re Financial repression: The unintended consequences
While some economies are recovering, notably the UK and the US, growth is more fragile in Japan and in the Eurozone. But even in countries experiencing better growth, central banks have yet to gain sufficient confidence in the strength of their economies to start exiting the extraordinary monetary conditions enacted post-2008.
At some point central banks will have to exit unconventional monetary policies and raise rates again. So, what will happen if they change their accommodative approach? Most significant for the global economy will be the tightening of US monetary policy. This will imply long- and short-term challenges. In the short-term, they will include: (i) maintaining credible and consistent communication as economic data further improves; (ii) preventing unnecessary and excessive market volatility amid the even-tual shift to a more hawkish stance; and (iii) technical implementation of the exit, with the new fixed-rate reverse repo facility likely to play an important role in the Fed’s exit toolkit.
Long term, the fundamental question arises of whether too much is being asked of central banks. As already stated by Paul Volcker18, “the Federal Reserve – any central bank – should not be asked to do too much, to undertake responsibilities that it cannot reasonably meet with the appropriately limited powers provided.”
Amid the general recognition that more attention must be paid to financial stability risks in the future, the key questions are: How can monetary and regulatory policies be optimally coordinated to achieve greater financial stability? And, what is the best institutional setup in order to safeguard central bank independence?
Capital market outlook
The Fed’s hiking cycle is likely to be closely watched, as it impacts both developed and emerging market economies. The ECB and BoJ are expected to remain in accommodative mode for some time yet.
With growth below the long-term trend and inflation tame, the Fed’s rate hikes are likely to be gradual. A repeat of the 1994 bond market collapse, when the Fed’s policy rate increased by 300 basis points in a single year, seems unlikely. The hiking cycles in 1990–2000 and 2004–2006 are better comparisons. In 1999–2000, the Fed raised rates by 1.5 percentage points. The Barclays Aggregate U.S. Bond Index19 lost just 0.8% in 1999 before rebounding 11.6% in 2000. In 2004–2006, the Fed raised rates 17 times, from 1.0% to 5.25%. During those three years, the Barclays index delivered positive returns.
An important difference, however, is that yields were higher in the two previous episodes noted than they are today (though investment grade spreads20 were fairly similar to today), offering more income to offset potential price declines.
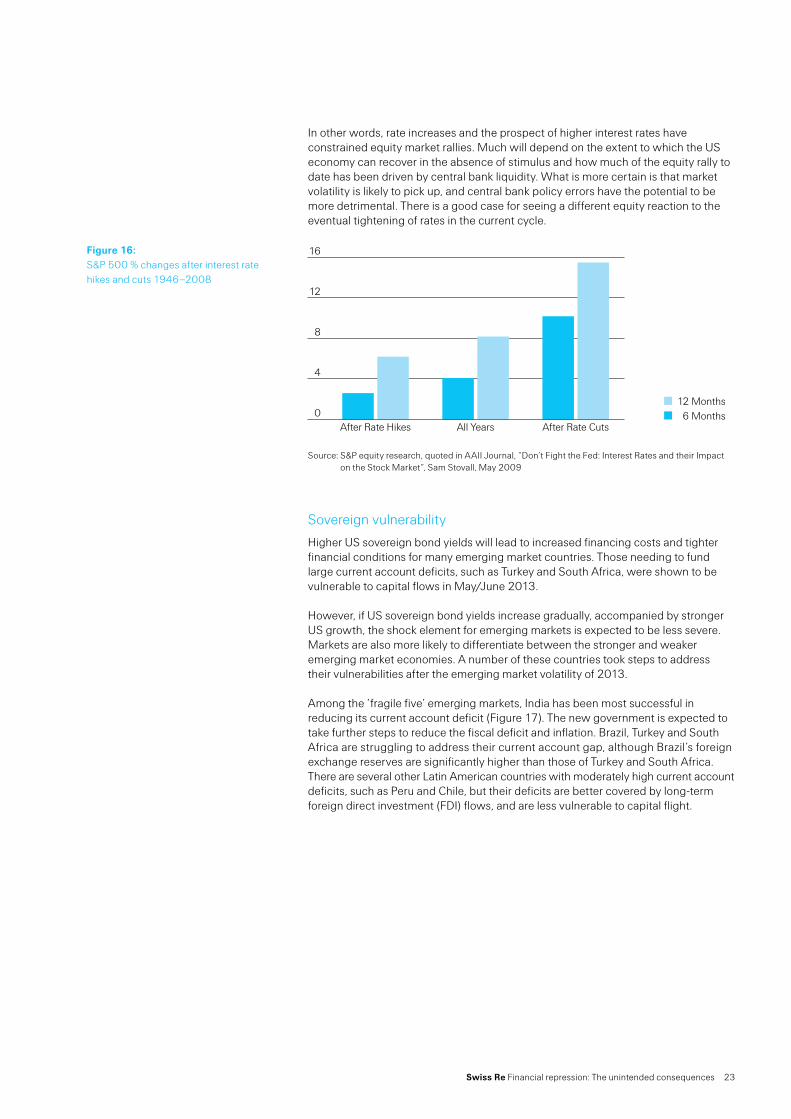
The equity market’s initial reaction in all three instances was a sell-off, with the S&P 500 Index ending down by an average of 3.2% after a one-month period. The average price rise over six-month periods after the start of each rate-hiking cycle was still positive at 2.6%. After 12 months, the average return was 6.2%, 200 basis points below the long-term average annual price change21 (Figure 16).
Exiting monetary policy
18 Remarks by Paul A. Volcker, May 29, 2013, “Central banking at a crossroad“19 Formerly the Lehman Aggregate index. The index includes sovereign, quasi-sovereign and corporate
bonds20 For US investment grade, having lost 2% in 1999, total return was 9.1% in 2000. Over 2004–2006,
the index returned 5.4%, 1.7% and 4.3% respectively21 AAII Journal, “Don‘t Fight the Fed: Interest Rates and their Impact on the Stock Market“, Sam Stovall,
May 2009
Swiss Re Financial repression: The unintended consequences 23
In other words, rate increases and the prospect of higher interest rates have constrained equity market rallies. Much will depend on the extent to which the US economy can recover in the absence of stimulus and how much of the equity rally to date has been driven by central bank liquidity. What is more certain is that market volatility is likely to pick up, and central bank policy errors have the potential to be more detrimental. There is a good case for seeing a different equity reaction to the eventual tightening of rates in the current cycle.
0
4
8
12
16
12 Months6 Months
After Rate CutsAll YearsAfter Rate Hikes
Source: S&P equity research, quoted in AAII Journal, “Don’t Fight the Fed: Interest Rates and their Impact on the Stock Market“, Sam Stovall, May 2009
Sovereign vulnerability
Higher US sovereign bond yields will lead to increased financing costs and tighter financial conditions for many emerging market countries. Those needing to fund large current account deficits, such as Turkey and South Africa, were shown to be vulnerable to capital flows in May/June 2013.
However, if US sovereign bond yields increase gradually, accompanied by stronger US growth, the shock element for emerging markets is expected to be less severe. Markets are also more likely to differentiate between the stronger and weaker emerging market economies. A number of these countries took steps to address their vulnerabilities after the emerging market volatility of 2013.
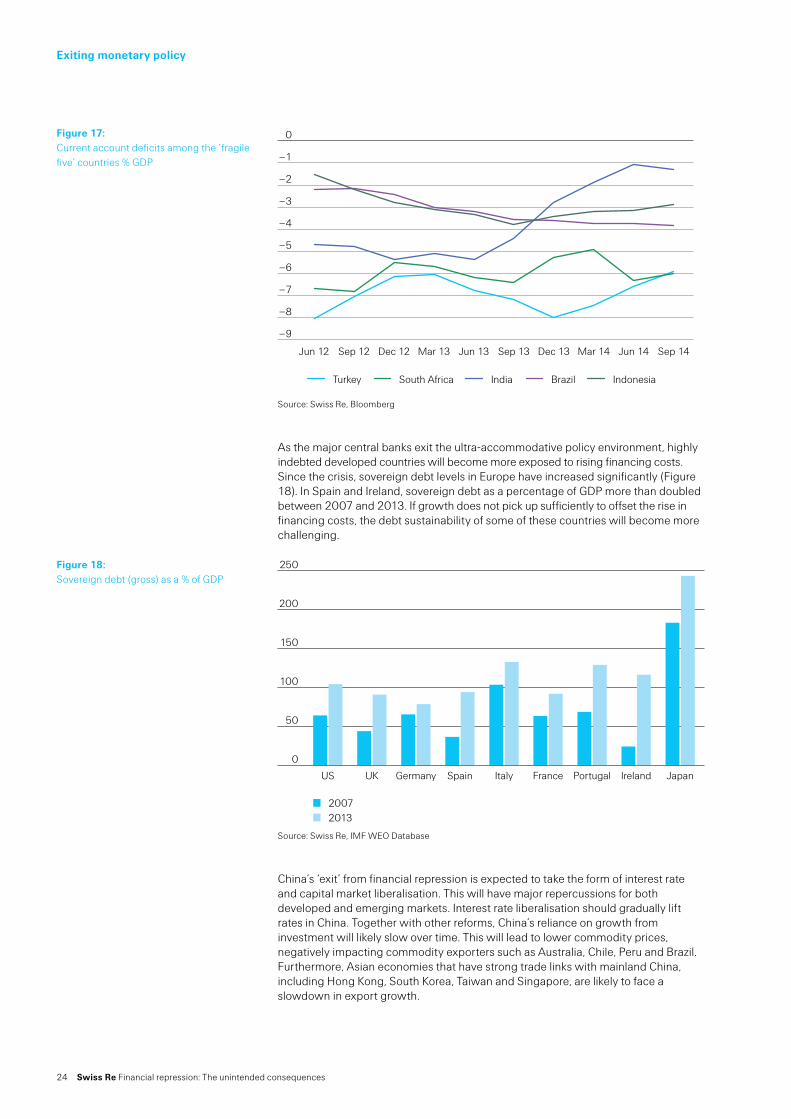
Among the ‘fragile five’ emerging markets, India has been most successful in reducing its current account deficit (Figure 17). The new government is expected to take further steps to reduce the fiscal deficit and inflation. Brazil, Turkey and South Africa are struggling to address their current account gap, although Brazil’s foreign exchange reserves are significantly higher than those of Turkey and South Africa. There are several other Latin American countries with moderately high current account deficits, such as Peru and Chile, but their deficits are better covered by long-term foreign direct investment (FDI) flows, and are less vulnerable to capital flight.
Figure 16:S&P 500 % changes after interest rate hikes and cuts 1946–2008
24 Swiss Re Financial repression: The unintended consequences
Exiting monetary policy
Source: Swiss Re, Bloomberg
As the major central banks exit the ultra-accommodative policy environment, highly indebted developed countries will become more exposed to rising financing costs. Since the crisis, sovereign debt levels in Europe have increased significantly (Figure 18). In Spain and Ireland, sovereign debt as a percentage of GDP more than doubled between 2007 and 2013. If growth does not pick up sufficiently to offset the rise in financing costs, the debt sustainability of some of these countries will become more challenging.
Source: Swiss Re, IMF WEO Database
China’s ‘exit’ from financial repression is expected to take the form of interest rate and capital market liberalisation. This will have major repercussions for both developed and emerging markets. Interest rate liberalisation should gradually lift rates in China. Together with other reforms, China’s reliance on growth from investment will likely slow over time. This will lead to lower commodity prices, negatively impacting commodity exporters such as Australia, Chile, Peru and Brazil. Furthermore, Asian economies that have strong trade links with mainland China, including Hong Kong, South Korea, Taiwan and Singapore, are likely to face a slowdown in export growth.
Figure 17:Current account deficits among the ‘fragile five’ countries % GDP
–9
–8
–7
–6
–5
–4
–3
–2
–1
0
Turkey South Africa India Brazil Indonesia
Sep 14Jun 14Mar 14Dec 13Sep 13Jun 13Mar 13Dec 12Sep 12Jun 12
Figure 18:Sovereign debt (gross) as a % of GDP
0
50
100
150
200
250
20132007
JapanIrelandPortugalFranceItalySpainGermanyUKUS
Swiss Re Financial repression: The unintended consequences 25
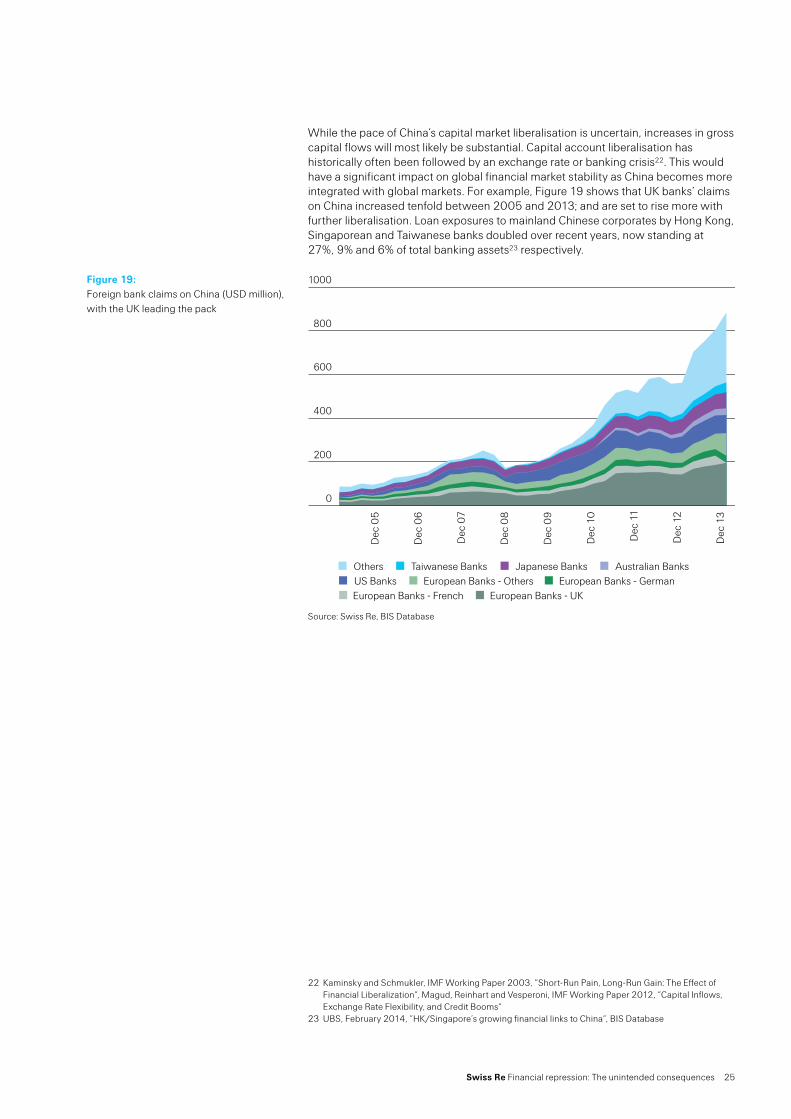
While the pace of China’s capital market liberalisation is uncertain, increases in gross capital flows will most likely be substantial. Capital account liberalisation has historically often been followed by an exchange rate or banking crisis22. This would have a significant impact on global financial market stability as China becomes more integrated with global markets. For example, Figure 19 shows that UK banks’ claims on China increased tenfold between 2005 and 2013; and are set to rise more with further liberalisation. Loan exposures to mainland Chinese corporates by Hong Kong, Singaporean and Taiwanese banks doubled over recent years, now standing at 27%, 9% and 6% of total banking assets23 respectively.
Source: Swiss Re, BIS Database
Figure 19:Foreign bank claims on China (USD million), with the UK leading the pack
0
200
400
600
800
1000
Others Taiwanese Banks Japanese Banks Australian BanksUS Banks European Banks - Others European Banks - GermanEuropean Banks - French European Banks - UK
Dec
13
Dec
12
Dec
11
Dec
10
Dec
09
Dec
08
Dec
07
Dec
06
Dec
05
22 Kaminsky and Schmukler, IMF Working Paper 2003, “Short-Run Pain, Long-Run Gain: The Effect of Financial Liberalization“, Magud, Reinhart and Vesperoni, IMF Working Paper 2012, “Capital Inflows, Exchange Rate Flexibility, and Credit Booms“
23 UBS, February 2014, “HK/Singapore’s growing financial links to China“, BIS Database
26 Swiss Re Financial repression: The unintended consequences
Infrastructure investments and growth
Long-term investors are part of the intermediation channel that helps move saving funds to the real economy. Keeping interest rates artificially low through public intervention can have significant consequences on long-term investors, including crowding out viable private markets. A healthy financial intermediation channel is needed to sustain financial market stability and support economic growth.
Investments in infrastructure are not only growth-enhancing strategies, they also offer attractive and suitable investment opportunities for long-term investors. With the global economic recovery being weak by historical standards and output in several countries lower than pre-crisis levels, the provision of long-term funds to the economy is urgently needed. Moreover, institutional investors such as re/insurers and pension funds require such investments to match their long-term liabilities, as well as to improve their portfolio returns in the current low-yield environment (see also joint Swiss Re/IIF publications24).
Assessing the impact of infrastructure investment on economic growth, two primary channels can be identified. First, infrastructure capital increases production capacity. Second, it may also raise productivity. In theory, both effects will lead to higher GDP, but the magnitude of the potential increase has been debated for a long time. Academic studies estimate that 10% more infrastructure capital can boost the long-term GDP growth rate by 0.9 percentage points25. The IMF26 has also found that in a low economic growth environment, USD 1 of infrastructure spending results in almost USD 3 of additional economic output. Infrastructure investments also lower the production costs of manufacturing firms, in turn raising their productivity27. A recent S&P study28 estimated that a USD 1.3 billion infrastructure investment would likely add 29 000 jobs to the construction sector and USD 2 billion to US real economic growth.
Indeed, the importance of infrastructure investment for economic growth has been recognised globally, with the topic ranking high on the G20 agenda under the Australian presidency.
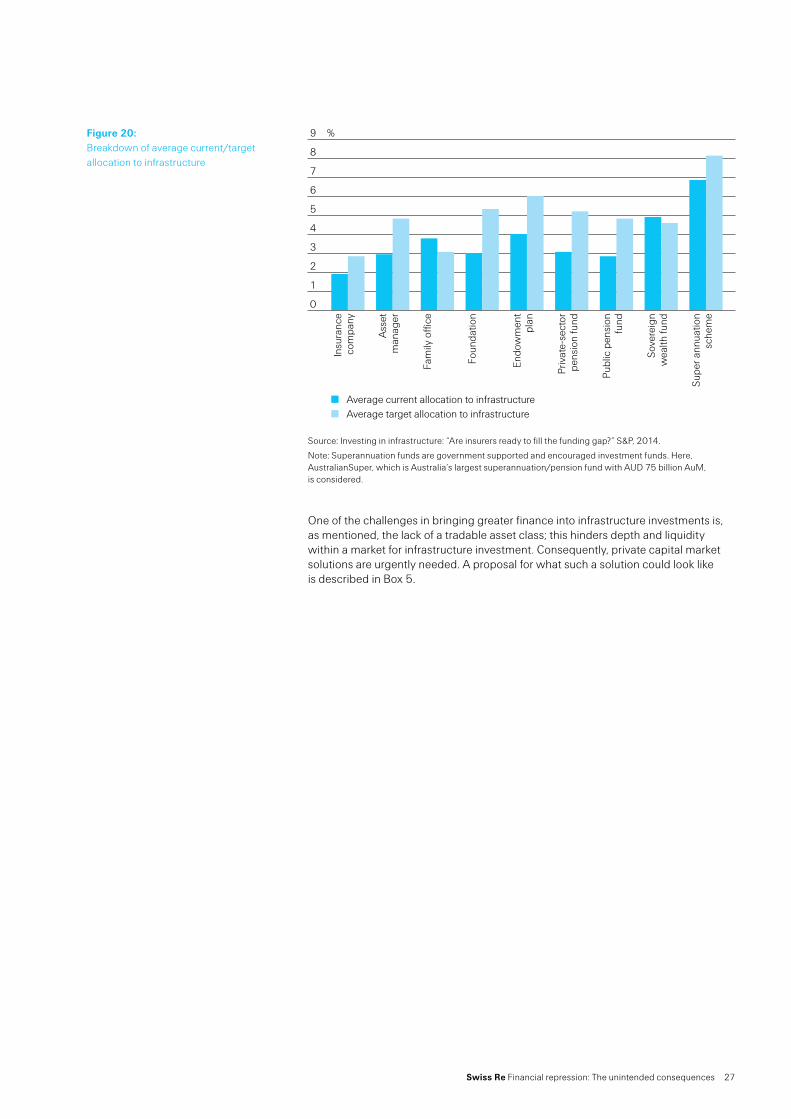
Some USD 50–70 trillion will be needed to finance infrastructure globally through 2030. Thereby, we estimate that the current spending of roughly USD 2.6 trillion annually will have to increase to around USD 4 trillion by 2030. This emerging financing gap, estimated at roughly USD 1 trillion annually (also highlighted by the WEF29), will have to be met in order to support economic growth. Though commercial banks will remain key players, institutional investors such as re/insurers and pension funds have a potentially much larger role to play. Infrastructure investments provide a good balance given the steady cash flows and potential to match investors’ long-term liabilities. However, several impediments remain to unlocking the large long-term institutional investor asset base of roughly USD 75 trillion globally. Besides regulatory uncertainty, there is a lack of an investable and transparent asset class. Indeed, the current infrastructure allocation of pension funds and re/insurers remains below the average target allocation (3% vs 5%, and 2% vs 3%, respectively), as indicated in Figure 20.
24 “Strengthening the Role of Long-term Investors“, 2013; “Infrastructure Investing. It Matters“, 201425 Bom and Ligthart, CESifo working paper, January 200826 IMF World Economic Outlook, October 201427 The American Economic Review, Morrison & Schwartz, December 1996, “State Infrastructure and
Productive Performance“28 S&P, May 2014, “US infrastructure investment: A chance to reap more than we sow“29 WEF, 2014, “Infrastructure Investment Policy Blueprint“
Swiss Re Financial repression: The unintended consequences 27
Source: Investing in infrastructure: “Are insurers ready to fill the funding gap?” S&P, 2014.
Note: Superannuation funds are government supported and encouraged investment funds. Here, AustralianSuper, which is Australia‘s largest superannuation/pension fund with AUD 75 billion AuM, is considered.
One of the challenges in bringing greater finance into infrastructure investments is, as mentioned, the lack of a tradable asset class; this hinders depth and liquidity within a market for infrastructure investment. Consequently, private capital market solutions are urgently needed. A proposal for what such a solution could look like is described in Box 5.
Figure 20:Breakdown of average current/target allocation to infrastructure
9
8
7
6
5
4
3
2
1
0
Insu
ranc
e co
mpa
ny
Ass
etm
anag
er
Fam
ily o
ffice
Foun
datio
n
Endo
wm
ent
plan
Priv
ate-
sect
or
pens
ion
fund
Publ
ic p
ensi
on
fund
Sove
reig
n w
ealth
fund
Supe
r ann
uatio
n sc
hem
e
%
Average current allocation to infrastructureAverage target allocation to infrastructure
28 Swiss Re Financial repression: The unintended consequences
Infrastructure investments and growth
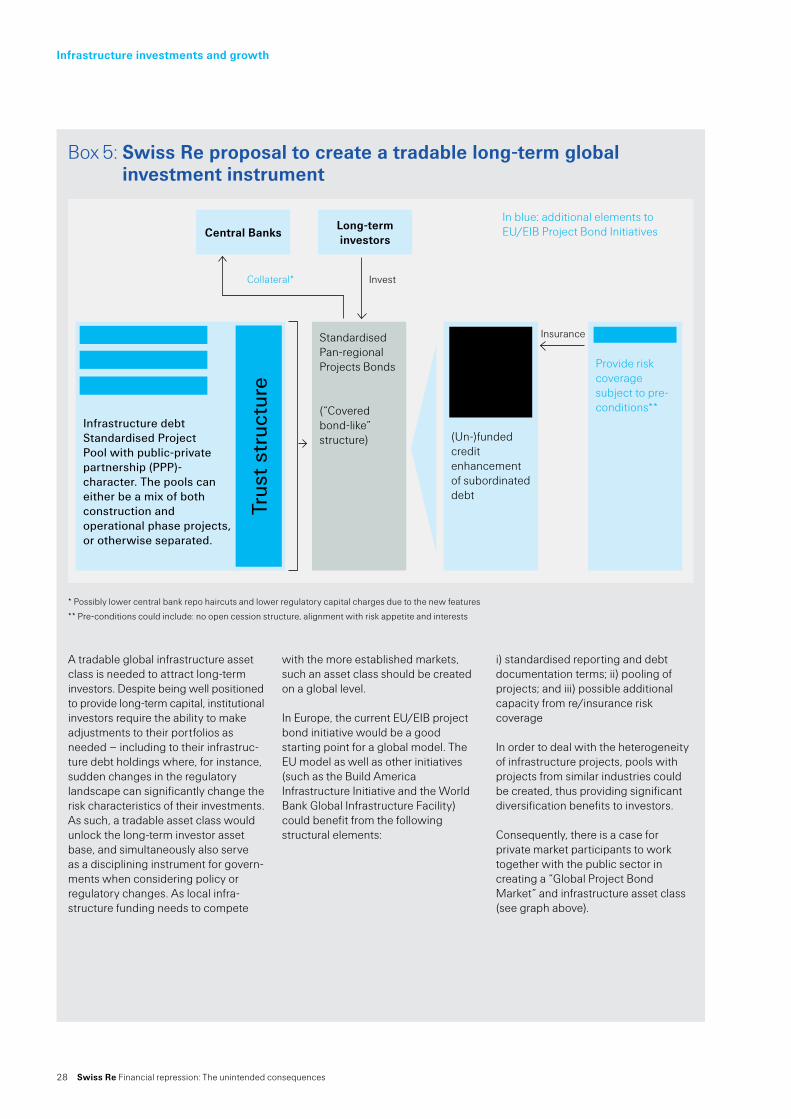
Box 5: Swiss Re proposal to create a tradable longterm global investment instrument
A tradable global infrastructure asset class is needed to attract long-term investors. Despite being well positioned to provide long-term capital, institutional investors require the ability to make adjustments to their portfolios as needed – including to their infrastruc-ture debt holdings where, for instance, sudden changes in the regulatory landscape can signifi cantly change the risk characteristics of their investments. As such, a tradable asset class would unlock the long-term investor asset base, and simultaneously also serve as a disciplining instrument for govern-ments when considering policy or regulatory changes. As local infra-structure funding needs to compete
with the more established markets, such an asset class should be created on a global level.
In Europe, the current EU/EIB project bond initiative would be a good starting point for a global model. The EU model as well as other initiatives (such as the Build America Infrastructure Initiative and the World Bank Global Infrastructure Facility) could benefit from the following structural elements:
i) standardised reporting and debt documentation terms; ii) pooling of projects; and iii) possible additional capacity from re/insurance risk coverage
In order to deal with the heterogeneity of infrastructure projects, pools with projects from similar industries could be created, thus providing significant diversification benefits to investors.
Consequently, there is a case for private market participants to work together with the public sector in creating a “Global Project Bond Market” and infrastructure asset class (see graph above).
* Possibly lower central bank repo haircuts and lower regulatory capital charges due to the new features
** Pre-conditions could include: no open cession structure, alignment with risk appetite and interests
Central BanksLongterminvestors
Standardised Pan-regionalProjects Bonds
(“Covered bond-like” structure)
In blue: additional elements to EU/EIB Project Bond Initiatives
Insurance
InvestCollateral*
Project Company 1
Project Company 2
Project Company 3
Infrastructure debt Standardised Project Pool with public-private partnership (PPP)-character. The pools can either be a mix of both construction and operational phase projects, or otherwise separated.
Trus
t st
ruct
ure
Multilateral development banks/National development banks
(Un-)funded credit enhancement of subordinated debt
Re/insurer
Provide risk coverage subject to pre-conditions**
Swiss Re Financial repression: The unintended consequences 29
Concluding remarks
30 See IMF World Economic Outlook, October 2014.
Looking ahead, financial repression is likely to remain a key tool for policymakers given the moderate global growth outlook and high public debt overhang. But, as outlined in this paper, financial repression comes with significant costs. Whether the costs outweigh the benefits largely depends on the ability of governments to take advantage of the low interest rate environment by implementing the right structural reforms. So far, their record for doing so has not been comforting, as also noted by the IMF30.
Additional research on financial repression could be linked to the impact of an aging society on the broader economic and financial market environment and hence the optimal policy mix. Finally, a largely unexplored area is the consequence – especially longer-term – of public authorities acting as dominant players in their own bond markets. How does this affect private capital markets, and how severe are the distortions in price formation, investment decisions, allocation to productive areas and capital flows more generally?
Swiss Re’s current work on this topic is intended to contribute to the debate on the benefits-costs analysis and derive important implications for sustainable policymaking that will help build stable global capital markets. We should not wait for tomorrow to see the effect of the policy actions taken to date. Instead, we should put in place the elements for more stable markets today.

30 Swiss Re Financial repression: The unintended consequences
Swiss Re Financial repression: The unintended consequences 31
Unintended consequences of financial repression include potential asset bubbles, a financial repression “tax”, increasing economic inequality, the potential of higher inflation, and reputation damage for central banks. So how long will it remain a key instrument in govern-ments’ toolkits?
32 Swiss Re Financial repression: The unintended consequences
Appendix
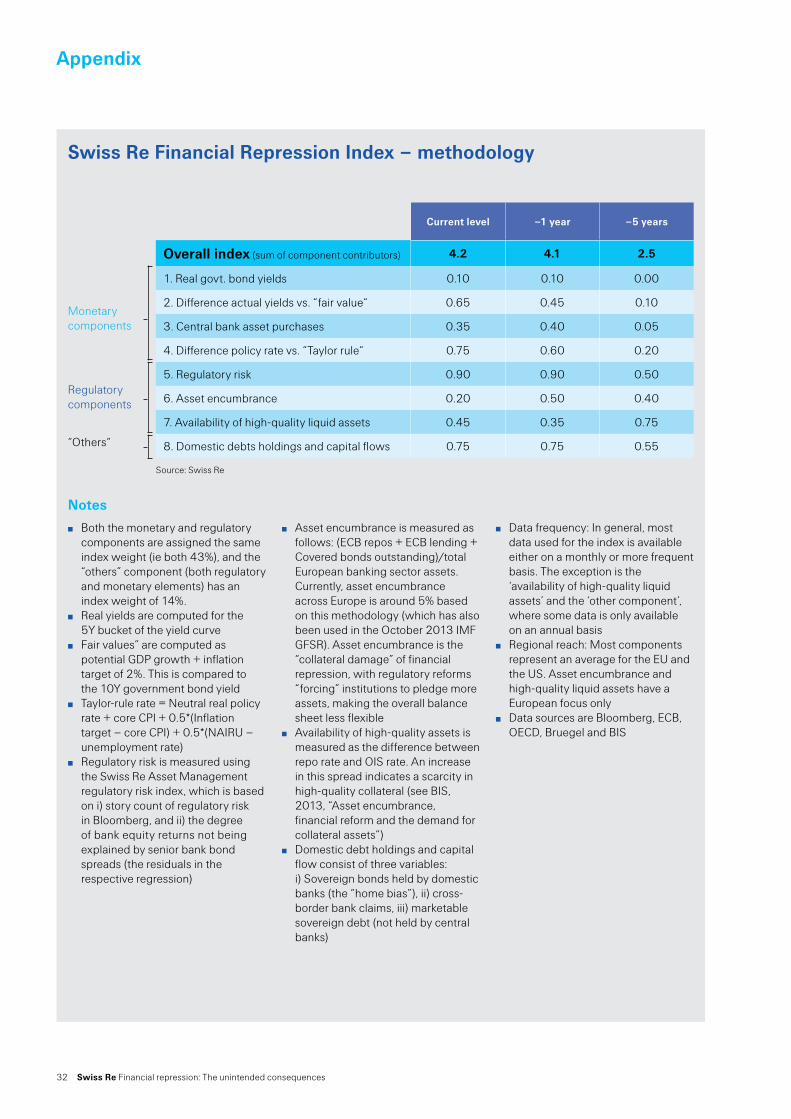
Swiss Re Financial Repression Index – methodology
Notes
Both the monetary and regulatory components are assigned the same index weight (ie both 43%), and the “others” component (both regulatory and monetary elements) has an index weight of 14%.
Real yields are computed for the 5Y bucket of the yield curve
Fair values” are computed as potential GDP growth + inflation target of 2%. This is compared to the 10Y government bond yield
Taylor-rule rate = Neutral real policy rate + core CPI + 0.5*(Inflation target – core CPI) + 0.5*(NAIRU – unemployment rate)
Regulatory risk is measured using the Swiss Re Asset Management regulatory risk index, which is based on i) story count of regulatory risk in Bloomberg, and ii) the degree of bank equity returns not being explained by senior bank bond spreads (the residuals in the respective regression)
Asset encumbrance is measured as follows: (ECB repos + ECB lending + Covered bonds outstanding)/total European banking sector assets. Currently, asset encumbrance across Europe is around 5% based on this methodology (which has also been used in the October 2013 IMF GFSR). Asset encumbrance is the “collateral damage” of financial repression, with regulatory reforms “forcing” institutions to pledge more assets, making the overall balance sheet less flexible
Availability of high-quality assets is measured as the difference between repo rate and OIS rate. An increase in this spread indicates a scarcity in high-quality collateral (see BIS, 2013, “Asset encumbrance, financial reform and the demand for collateral assets”)
Domestic debt holdings and capital flow consist of three variables: i) Sovereign bonds held by domestic banks (the “home bias”), ii) cross-border bank claims, iii) marketable sovereign debt (not held by central banks)
Data frequency: In general, most data used for the index is available either on a monthly or more frequent basis. The exception is the ‘availability of high-quality liquid assets’ and the ‘other component’, where some data is only available on an annual basis
Regional reach: Most components represent an average for the EU and the US. Asset encumbrance and high-quality liquid assets have a European focus only
Data sources are Bloomberg, ECB, OECD, Bruegel and BIS
Current level –1 year –5 years
Overall index (sum of component contributors) 4.2 4.1 2.5
1. Real govt. bond yields 0.10 0.10 0.00
2. Difference actual yields vs. “fair value“ 0.65 0.45 0.10
3. Central bank asset purchases 0.35 0.40 0.05
4. Difference policy rate vs. “Taylor rule“ 0.75 0.60 0.20
5. Regulatory risk 0.90 0.90 0.50
6. Asset encumbrance 0.20 0.50 0.40
7. Availability of high-quality liquid assets 0.45 0.35 0.75
8. Domestic debts holdings and capital flows 0.75 0.75 0.55
Monetarycomponents
Regulatorycomponents
“Others“
Source: Swiss Re

© 2015 Swiss Re. All rights reserved.
Title: Financial repression: The unintended consequences
Authors: Jérôme Haegeli Chuan Lim Tauno Loertscher Laurent Degoumois Steven Biekens
Editing and realisation: Katharina Fehr Cushla Sherlock
Managing editor: Urs Leimbacher
Graphic design and production: Corporate Real Estate & Logistics/ Media Production, Zurich
Printing: Corporate Real Estate & Logistics/ Media Production, Zurich
Disclaimer: The content of this brochure is subject to copyright with all rights reserved. The information may be used for private or internal purposes, provided that any copyright or other proprietary notices are not removed. Electronic reuse of the content of this brochure is prohibited. Reproduction in whole or in part or use for any public purpose is only permitted with the prior written approval of Swiss Re, and if the source reference is indicated. Courtesy copies are appreciated.
Swiss Re gives no advice and makes no investment recommendation to buy, sell or otherwise deal in securities or investments whatsoever. This document does not constitute an invitation to effect any transaction in securities or make investments.
Although all the information used was taken from reliable sources, Swiss Re does not accept any res-ponsibility for the accuracy or comprehensiveness of the details given. All liability for the accuracy and completeness thereof or for any damage resulting from the use of the information contained in this brochure is expressly excluded. Under no circum-stances shall Swiss Re or its Group companies be liable for any financial and/or consequential loss relating to this brochure.
Order no: 1506050_15_en
02/15, 1 000 en

Swiss Reinsurance Company Ltd Mythenquai 50/60 P.O. Box 8022 Zurich Switzerland
Telephone +41 43 285 2121 Fax +41 43 285 2999 www.swissre.com